

Submitted:
16 October 2026
Posted:
16 October 2026
You are already at the latest version
Abstract
The interfacial reaction and shear behavior of Sn-19Bi-19In (SBI) solder joints on an electroless nick-el/electroless palladium/immersion gold (ENEPIG) surface finish were investigated during isother-mal aging at 85 °C for durations of up to 500 h and compared with those of the SBI joints on elec-troless nickel/immersion gold (ENIG) reported previously. A thin densely packed needle-like in-termetallic compound (IMC) layer formed at the interface and grew with aging time. According to scanning electron microscopy (SEM) and electron probe microanalysis (EPMA), the IMC layer is suggested to be (Ni,Pd)(Sn,In)2, and Pd was concentrated in the upper part of the IMC layer after aging. Since the composition of the IMC layer is similar to that of the loosely stacked cuboid Ni(In0.3Sn0.7)2 IMC on ENIG, the difference in morphology is likely due to the participation of Pd in the formation of the (Ni,Pd)(Sn,In)2 IMC. Transmission electron microscopy (TEM) analysis of the interface at the initial stage of the reaction suggests that Au(In,Sn)2 and (Pd,Ni)(Sn,In)4 IMCs form prior to the (Ni,Pd)(Sn,In)2 IMC. In ball shear tests, the SBI/ENEPIG joints showed a gradual duc-tile-to-brittle transition with aging time, and the crack path tended to shift from the solder bulk to-ward the IMC/Ni3P interface. The maximum shear strength of the SBI/ENEPIG joints remained at 39.5–44.2 MPa on average, whereas that of the SBI/ENIG joints decreased with aging time. This difference in the maximum shear strength can be attributed to the difference in the IMC morphology between the two surface finishes.
Keywords:
Sn-Bi-In ternary solder
; ENEPIG surface finish
; intermetallic compound
; interfacial reaction
; iso-thermal aging
; ball shear test
; low-temperature solder
; advanced packaging
1. Introduction
As semiconductor packages become larger and more highly integrated, warpage control during reflow has become increasingly important for the assembly yield and the reliability of the solder joints [1,2,3,4]. Lowering the reflow temperature with low-temperature solders (LTSs) can reduce the warpage, so LTSs have been extensively studied [1,5,6,7,8,9,10]. Among the various LTSs, the Sn-Bi-In system is one of the promising candidates, because its liquidus temperature varies over a wide range depending on the composition and In improves the wettability and ductility of the alloys [1,7,11].
Accordingly, many Sn-Bi-In compositions have been proposed, including In-rich alloys (e.g., In-31.6Bi-19.6Sn), Bi-rich alloys (e.g., Bi-31.5Sn-25In), and Sn-rich alloys (e.g., Sn-40Bi-10In and Sn-31Bi-19In) [12,13,14,15,16,17,18]. Among them, Sn-rich alloys are preferred, because Bi-rich alloys contain a large amount of the brittle Bi phase, and In-rich alloys are expensive and have poor creep resistance [1,3,19]. In the Sn-rich region, twelve compositions along the 62 wt.% Sn line with liquidus temperatures of about 170 °C were compared in a previous study [18], and a large elongation was also reported for Sn-31Bi-19In [17]. However, because the Sn-Bi-In system has a ternary eutectic point at about 76 °C [7,11], alloys such as Sn-40Bi-10In and Sn-31Bi-19In begin to melt at about 76–78 °C, although they are fully molten only at about 140–150 °C [15,17]. Because even partial melting can change the internal properties of the solder, such a low onset of melting limits the operating temperature of the joints [8,17].
In the previous study on the 62 wt.% Sn line, the solidus temperature and the ductile fracture ratio in ball shear tests depended on the composition, ranging from about 78 to 118 °C and from 15% to 95%, respectively [18]. Among these compositions, Sn-19Bi-19In [wt.%] (hereafter referred to as SBI solder), which showed the ductile fracture mode in 90% of its joints, begins to melt at about 100 °C. This temperature is higher than those of the compositions with solidus temperatures of around 76 °C, and the SBI joints also showed good mechanical reliability. For these reasons, the interfacial reactions and shear behavior of the SBI solder during isothermal aging at 85 °C have been investigated on organic solderability preservative (OSP) and electroless nickel/immersion gold (ENIG) finishes [20]. At the SBI/OSP and SBI/ENIG interfaces, Cu6(Sn,In)5 and Ni(In0.3Sn0.7)2 intermetallic compounds (IMCs) formed, respectively. The SBI/OSP joints showed ductile stress–displacement curves in the as-reflowed condition and a ductile-to-brittle transition with increasing aging time. In contrast, the SBI/ENIG joints showed brittle curves even in the as-reflowed condition, and the maximum shear strength decreased after prolonged aging. These results show that the mechanical reliability of joints of the same solder can be significantly affected by the surface finish.
Among various surface finishes, electroless nickel/electroless palladium/immersion gold (ENEPIG) is widely used in advanced packaging because of its solderability, corrosion resistance, and long shelf life [21,22,23,24,25,26]. ENEPIG was developed as an alternative to ENIG, in which the black pad has long been a serious problem. The black pad forms when the Ni(P) layer is corroded during immersion Au plating because of the potential difference between Au and Ni, and it reduces the wettability of the solder and the interfacial strength. The Pd layer between the Ni(P) and Au layers prevents the galvanic corrosion of Ni(P) and acts as a diffusion barrier [27,28,29]. Due to the addition of the Pd layer, Sn-3.0Ag-0.5Cu joints on ENEPIG showed slower IMC growth and less degradation of the shear force than those on ENIG under extreme thermal shock [30]. However, the Pd layer is quickly consumed during reflow by forming PdSn4-type compounds, and the subsequent reaction products, such as Ni3Sn4 and (Cu,Ni)6Sn5, vary with the solder composition [21,22,29]. Therefore, the joint properties also vary with the solder composition, so the interfacial reaction and joint properties on ENEPIG need to be investigated when the solder composition changes significantly.
Nevertheless, most studies on ENEPIG have used Sn-Ag-Cu solders, and only a few studies have dealt with LTSs, mainly with Sn-Bi-based solders [24,26,27,31,32]. Therefore, it remains unclear how the Pd layer of ENEPIG affects the interfacial reaction of Sn-Bi-In solders with a high In content, and the shear behavior of their joints during aging. For Sn-Bi-In solders, studies on Ni-based surface finishes have been limited. The previous study addressed this gap with SBI joints, but only OSP and ENIG were compared [20]. Thus, the same SBI solder was selected for ENEPIG to evaluate the effect of the surface finish.
In this study, joints of the SBI solder on ENEPIG were isothermally aged at 85 °C for durations of up to 500 h. This aging temperature was selected because it is commonly used for LTS joints [32,33,34]. The microstructures of the as-reflowed and aged joints were analyzed by scanning electron microscopy (SEM) and electron probe microanalysis (EPMA), and the initial stage of the interfacial reaction was examined by SEM and transmission electron microscopy (TEM) after short reflow on a hot plate. The shear behavior of the joints was evaluated by ball shear tests. The sheared joints were analyzed by observing the fracture surfaces and crack paths. By comparing the results with those of the SBI/ENIG joints aged under the same conditions [20], this work aims to contribute to a deeper understanding of the role of the Pd layer in the interfacial reaction of Sn-Bi-In solder joints.
2. Materials and Methods
The solder used in this study was Sn-19Bi-19In (SBI, in wt.%). Elemental powders of Sn (99.5%, Alfa Aesar), Bi (99.5%, Alfa Aesar), and In (99.99%, Alfa Aesar) were weighed to the SBI composition with a tolerance of ±0.05 wt.% for each powder and then mechanically mixed. The mixed powders were pressed into pellets. The pellets were melted in carbon crucibles at 300 °C in an N2-filled glove box to achieve homogeneous alloying, and the melt was subsequently solidified. The solidified alloy was ground into powder with a rotor mill (PULVERISETTE 14, Fritsch). The powder was then sieved, and the particles in the 25–45 μm size range were collected. Finally, the collected particles were mixed with a rosin-based flux at an 85:15 weight ratio to prepare the solder paste. The substrates were printed circuit boards (PCBs) with an ENEPIG surface finish, in which electroless Ni(P), electroless Pd, and immersion Au layers were sequentially deposited on the Cu pads. The thicknesses of the Pd and Au layers specified by the supplier were 0.07 and 0.03 μm, respectively. The solder paste was applied to the pads with a diameter of 500 μm and reflowed in air in a reflow machine (GF-120HT, DDM Novastar). The peak temperature of the reflow profile was 185 ± 3 °C, and the time above liquidus was 60 s. After reflow, the joints were cooled to room temperature in air at a cooling rate of 2.2 ± 0.2 °C/s. The joints were then aged in air at 85 °C for 100, 300, and 500 h in a drying oven (SH-VDO-08NG, SH Scientific).
To examine the initial stage of the interfacial reaction, the solder paste on the ENEPIG pads was reflowed on a hot plate at 185 °C. The specimens were removed from the hot plate after 30, 40, 50, and 60 s and cooled to room temperature in air. For cross-sectional observation, all the joints were cold-mounted in epoxy resin to avoid heating them during specimen preparation. The mounted joints were ground with SiC papers of 120, 1200, and 2000 grit and then polished with a 3 μm diamond suspension followed by a 1 μm diamond suspension. To reveal the interfacial IMC, the solder matrix of the polished cross-sections was selectively etched in a solution of 90 vol.% CH3OH and 10 vol.% HNO3. For top-view observation of the IMC layer, the solder was etched away in a solution of 80 vol.% CH3OH and 20 vol.% HNO3.
Ball shear tests were performed with a shear tester (Dage 4000, Nordson). The shear height and the shear speed were set to 20 μm and 0.3 mm/s, respectively. Twenty joints were tested for each condition. After the shear tests, the fracture surfaces were observed by top-view SEM, and the sheared joints were also cross-sectioned to observe the fracture path. The stress–displacement curve of each joint was obtained, and its fracture mode was determined to be ductile or brittle from the fracture surface together with the curve.
The microstructure was observed with a scanning electron microscope (SEM, VEGA II LSH, TESCAN) operated at 20 kV and with a field-emission SEM (FE-SEM, JSM-7600F, JEOL, NFEC-2011-01-135487) operated at 15 kV at the MEMS Sensor Platform Center of Sungkyunkwan University. The VEGA II LSH was used for the etched cross-sections of the as-reflowed and aged joints, the fracture surfaces, and the cross-sections of the sheared joints. The JSM-7600F was used for the cross-sections of the hot plate joints and the top view of the IMC layer. Secondary electron (SE) images were used for the high-magnification top view of the IMC layer, and most of the other SEM images were acquired in backscattered electron (BSE) mode. Both SEMs were equipped with energy-dispersive X-ray spectroscopy (EDS), which was used for the point analysis of the phases. Elemental mapping and point analysis at the interface were also carried out by electron probe microanalysis (EPMA, JXA-iHP200F, JEOL) with wavelength dispersive spectroscopy (WDS) at 15 kV. The thickness of the IMC layer was measured from the cross-sectional SEM images using the ImageJ software. The thickness for each aging condition is reported as the mean ± standard deviation of ten measurements, each taken from the bottom of the IMC layer to the tips of the needle-like IMCs. Using focused ion beam (FIB) milling (Helios 5 UX, Thermo Fisher Scientific), TEM samples were prepared from the cross-sections of the joints reflowed on the hot plate for 30 and 50 s, and their interfaces were examined by transmission electron microscopy (TEM, Spectra 200, Thermo Fisher Scientific) at 200 kV. High-angle annular dark-field (HAADF) images were acquired in the scanning TEM (STEM) mode, and the elemental maps were obtained by STEM-EDS. The line profiles were extracted from the elemental maps.
3. Results and Discussion
Figure 1 shows cross-sectional SEM images of the Sn-19Bi-19In/ENEPIG joints in the as-reflowed state and after isothermal aging at 85 °C for 100, 300, and 500 h. This SBI solder has the same composition as that examined in the earlier studies of the Sn-Bi-In alloy joints on OSP and ENIG [18,20]. The microstructure of the SBI solder bulk, in which the matrix consists of β-Sn and γ-InSn4 and bright BiIn particles are dispersed, appears consistent with that reported in these previous studies. Furthermore, a dark Ni3P layer with voids is observed between the IMC layer and the Ni(P) layer in Figure 1 (c) and (d), as in the ENIG joints [20]. Careful observation of the IMC layer reveals that at the interface, the layer appears a thin layer with a densely packed needle-like morphology in the as-reflowed joint, and the IMC layer has grown progressively with aging time. In the aged joints, the IMCs exhibit a dense needle-like morphology rather than a fully filled continuous layer. This morphology is likely to have originated from the continued growth of the pre-existing needle-like IMCs.
Elemental mapping and point analysis were carried out by EPMA with WDS to investigate the interfacial phase formation and the distribution of Pd. Figure 2 shows the WDS elemental maps of Sn, In, Bi, Ni, Pd, and Au together with the corresponding BSE images, and the compositions at the marked points are summarized in Table 1. In the WDS elemental maps, the intensity increases from blue to red, as indicated in the scale at the bottom of the figure. In the Sn maps, the signal is strongest in the solder matrix and is almost absent from the particles dispersed in the matrix. The solder matrix appears divided into red and orange regions while the IMC layer below it displays a weaker Sn signal, appearing yellowish. In the In maps, the signal is distributed over the whole matrix and is concentrated in the particles in which Sn is almost absent. The In signal of the IMC layer is comparable to that of the matrix, indicating that In is incorporated into the IMC together with Sn. In the Bi maps, the signal is concentrated in the same particles in which Sn is almost absent. As reported in the previous study of this Sn-Bi-In solder [18], the regions of the matrix that are red in the Sn maps and light blue in the In maps are β-Sn, those that are orange in the Sn maps and green in the In maps are γ-InSn4, and the particles rich in both Bi and In are BiIn. In the Ni maps, the strongest signal comes from the bottom electroless Ni layer, and a thin layer with an intermediate intensity lies directly above it, which corresponds to the Ni3P layer. The IMC layer above them gives a weaker signal and thickens with aging. In the Pd maps, a very thin layer of a high Pd signal intensity appears just above the Ni(P) layer in the as-reflowed sample; apparently the layer with a high Pd signal intensity has moved upward with the increase of the aging time as the underlying IMC layer has grown thicker. It should be also noted that although the layer with a high Pd signal intensity appears pronounced in the image, the actual content is very low (0.3~4.6 at.%) according to the point analysis (shown in Table 1). In the Au maps, Au is not detected at the interface and appears in the solder matrix only as isolated particles, which also give a high In signal.
We investigated the morphology of the IMC layer from top-view by etching away solder for the as-reflowed and 300 h aged joints as shown in Figure 3. As seen in Figure 3 (a) and (b), the top part of the IMC layer exhibits a plate-like morphology in both joints, and the needle-like morphology in Figure 1 (a) and (c) appears to be the cross-sectional view of this IMC. EDS point analysis was carried out on the IMC marked in Figure 3 (a) and (b), and the results showed 27.7 at.% Ni, 9.4 at.% Pd, 11.8 at.% In, and 51.1 at.% Sn in the as-reflowed joint and 28.8 at.% Ni, 3.9 at.% Pd, 12.0 at.% In, and 55.3 at.% Sn in the 300 h aged joint. In both cases, Bi was not detected, contrary to the significant Bi content detected in the point analysis from the cross-sectional sample (6.6 at.%, see Table 1). This is probably because, for the cross-sectional analysis, some Bi signal probably came from the surrounding solder matrix containing a high Bi content or solder that exists between the needles. This result suggests that the IMC layer possibly includes only a very low content of Bi. For Pd, the Pd content measured from the top is higher than the corresponding values in Table 1. This is probably because Pd is concentrated in the upper part of the IMC layer both in the as-reflowed and the 300 h aged joint, consistent with the Pd maps in Figure 2.
It is interesting to note that compared with the ENIG joints of the same solder, the IMC morphology on ENEPIG is significantly different. On ENIG, the Ni(In0.3Sn0.7)2 IMC grew as loosely stacked cuboids [20], whereas, on ENEPIG, the IMC exhibits a densely packed needle-like morphology. Since the SBI solder and the underlying Ni(P) layer are common to both cases, this change in the interfacial reaction could be attributed to the presence of the Pd layer. Thus, we used WDS point analysis mainly on the IMC layer to investigate the whereabouts of Pd with the growth of the IMC layer, as shown in Table 1. (Point 3 was measured on an Au-rich phase in the solder because it was not reported in the ENIG joints [20].) In the 100 h aged joint, point 2 was measured in the middle of the IMC layer, and in the 300 and 500 h aged joints, two points were measured at different heights in the IMC layer, to compare the composition between the upper and lower parts. Points 4 and 6 were measured in the upper part of the IMC layer and points 5 and 7 were measured close to the Ni(P) layer. As in the Pd maps, Pd is higher at the upper points (1.8 at.% at both) than at the lower points (0.5 and 0.3 at.%). Unlike the Pd maps, the Sn, In, Bi, and Ni maps are relatively uniform within the IMC layer, and the five points in the aged joints show similar values of 52.2–54.6 at.% Sn, 13.9–14.8 at.% In, 27.0–30.3 at.% Ni, and 1.3–3.9 at.% Bi. Point 3 contains 31.0 at.% Au, 56.9 at.% In, and 9.7 at.% Sn, so that (In+Sn)/Au is 2.1. Therefore, this phase is considered to be Au(In,Sn)2. It should be noted that Sn and In can dissolve each other to a substantial amount because they have high solid solubilities [35]. The Au layer of the ENEPIG finish is probably dissolved into the solder during reflow and then reacts with In and Sn to form this phase.
It should be noted that the previous studies of Sn-Bi, Sn-Ag, and Sn-Ag-Cu solders on ENEPIG report that Pd plays an important role in the formation of different (Pd, Ni, Sn) containing phases. During reflow, the Au layer is rapidly dissolved into the molten solder, thereby exposing the Pd layer, which reacts with Sn to form PdSn4. Ni supplied from the Ni(P) layer then substitutes for part of the Pd, and the compound changes to (Pd,Ni)Sn4 [21,22,36]. Ni and Pd can substitute for each other because they form a continuous solid solution [37], and a remarkable ternary solubility has been reported for the compounds in the Sn-rich corner of the Ni–Pd–Sn system, such as PdSn4, PdSn3, PdSn2, and Ni3Sn4 [38]. During the reaction of these solders on ENEPIG, the supply of Pd is limited by the thin Pd layer, whereas Ni continues to be supplied from the Ni(P) layer. Therefore, a Ni3Sn4 layer appears beneath the (Pd,Ni)Sn4 [31,36]. During prolonged reflow reactions, the (Pd,Ni)Sn4 dissolves into the molten solder, so Ni3Sn4 is left as the sole interfacial compound [3,21,36]. Although the (Pd,Ni)Sn4 disappears from the interface during prolonged reflow, a few studies have reported that compounds of the PdSn4 type remain at the interface during solid-state aging [10,22].
To understand the nature of the IMC layer observed in the present study, we carefully considered the point analysis results shown in Table 1: the (Ni+Pd)/(Sn+In) ratio of the IMC layer is 0.40 in the as-reflowed joint and 0.42–0.45 in the aged joints. These values are far below 0.75 for Ni3Sn4 and well above 0.25 for PdSn4, so the IMC layer does not correspond to either of these compounds. The value of 0.4–0.45 for the as-reflowed and 300 h aged joints is roughly close to a 1:2 ratio of (Ni+Pd) to (Sn+In). Since the Pd content of the IMC in these joints is low, the IMC can be regarded as a Ni(In,Sn)2-type IMC dissolving some Pd. Ternary Ni–In–Sn IMCs of this type have been reported for In-containing Sn-based solders on Ni, including the ENIG joints of the same solder [20,39,40]. Therefore, the composition of the IMC on ENEPIG may correspond to that of the Ni(In0.3Sn0.7)2 IMC on ENIG, with Pd substituting for part of Ni.
However, the morphology of this IMC in Figure 1 and Figure 3 differs considerably from that of the loosely stacked cuboid IMC on ENIG, so one might expect the IMC on ENEPIG to be a different phase from that on ENIG. Nevertheless, a similar phenomenon, in which the same type of IMC shows different morphologies on ENIG and ENEPIG, has been reported for Sn-3.0Ag-0.5Cu solder. The (Cu,Ni)6Sn5 IMC exhibits a column-type morphology on ENIG, whereas the (Cu,Ni,Pd)6Sn5 IMC exhibits a needle-type morphology on ENEPIG [30]. Therefore, the difference in morphology does not necessarily mean that the IMC on ENEPIG is a different phase. Instead, the difference can be attributed to the participation of Pd in the formation of the IMC. Consequently, the IMC layer in this study is suggested to be (Ni,Pd)(Sn,In)2, and it is hereafter referred to as (Ni,Pd)(Sn,In)2.
The origin of this compound is considered to lie in the initial stage of the reaction. As described above, the distribution of Pd in Figure 2 changes with aging, from a thin layer at the interface in the as-reflowed joint to the uppermost part of the IMC layer in the aged joints. This distribution suggests that Pd participated in the formation of the IMC at the initial stage of the reaction, and this participation is considered to be responsible for the needle-like morphology of the IMC layer. In the later stage of aging, the supply of Pd is limited, so the IMC is mainly composed of Ni, In, and Sn. Nevertheless, the IMC layer retains its needle-like morphology instead of that formed on ENIG [20]. Therefore, the IMC layer appears to thicken by growth on the pre-existing (Ni,Pd)(Sn,In)2 rather than by the nucleation of new IMCs.
To observe the initial stage of the reaction more closely, the SBI solder paste on the ENEPIG surface finish was reflowed only for a very short period (30~60 s) on a hot plate, as shown in Figure 4. After 30 s, a thin needle-like IMC layer is present at the interface, and rectangular-shaped IMCs lie on this layer. With the reflow time increasing, the needle-like IMC layer grows, and its morphology appears to be similar to that of the IMC layer observed in the as-reflowed joint in Figure 1. After 50 s, a rectangular IMC is observed near the interface. EDS point analysis was carried out on the rectangular IMC at the position marked in Figure 4 (c), and the results showed 3.3 at.% Ni, 15.6 at.% Pd, 14.9 at.% In, 62.1 at.% Sn, and 4.2 at.% Bi. The measured composition of the rectangular-shaped IMC is different from that of the (Ni,Pd)(Sn,In)2 IMC layer in Table 1. The 4.2 at.% Bi is likely due to the surrounding solder, which is included in the interaction volume of the electron beam. The (Ni+Pd)/(Sn+In) atomic ratio obtained from the measured composition is 0.24, which is close to the value of 0.25 for a compound of the PdSn4 type. Based on these results and the (Pd,Ni)Sn4 reported in the previous studies described above [21,22,36], the rectangular-shaped IMC is suggested to be (Pd,Ni)(Sn,In)4.
To further examine the interfacial reaction at the initial stage, TEM analysis was carried out on the joints reflowed on the hot plate for 30 and 50 s. Figure 5 and Figure 6 show the HAADF images, the STEM-EDS maps of Sn, In, Bi, Ni, Pd, Au, and P, and the line profiles across the interfaces of the two joints, respectively. Figure 5, for the 30 s sample, shows that the Pd layer remains as a continuous thin layer on the Ni(P) layer upon 30 s reflow, which indicates that Pd has not fully reacted with the surrounding materials yet. In the Au map in Figure 5 (g), most Au is present as particles with a size of a few hundred nanometers near the interface. In the Sn and In maps in Figure 5 (b) and (c), both elements are detected over most of the solder, but at these Au-rich particles, the intensity of Sn is lower than that of the surrounding matrix and the intensity of In is higher than that of the surrounding matrix. Therefore, these particles are considered to be the same Au(In,Sn)2 phase as that found in the solder matrix in Figure 2 and Table 1. This indicates that the initial Au layer of the ENEPIG finish had already reacted mainly with In near the interface at the initial stage of the reaction. Connection with the observation from the as-reflowed sample in Figure 2 suggests that during further reflow, some In in the particles has been replaced by Sn and the particles have been dispersed into the solder. Figure 5 (i) shows the STEM-EDS line profiles across the same interface, obtained along the line indicated by the arrow in Figure 5 (a). In agreement with the Ni and Pd maps in Figure 5 (e) and (f), the intensity of Ni decreases sharply at the boundary of the Ni(P) layer, and the intensity of Pd shows a narrow peak at the Pd layer. In addition, on the solder side of this peak, the intensity of Pd gradually decreases over several hundred nanometers into the solder matrix, indicating that extensive interdiffusion between the Pd layer and the solder has occurred at the initial stage of the reaction.
The interface after 50 s is shown in Figure 6, and the HAADF image in Figure 6 (a) reveals that some needle-like IMCs have grown into the solder. In the P map, shown in Figure 6 (h), a thin layer with a higher P intensity is observed at the top of the Ni(P) layer, which indicates the formation of the Ni3P layer. The Pd map, shown in Figure 6 (f), discloses that the Pd film still remains as a continuous layer. In addition, the map also shows a significant amount of Pd present in the needle-like IMCs in Figure 6 (a). In the Bi and Au maps in Figure 6 (d) and (g), the intensity of Bi in the needle-like IMCs is lower than that of the surrounding matrix, whereas Au is detected in them. However, it should be noted that the intensities of Bi and Au in Figure 6 (i) are much lower than those of Sn and In on the solder side.
EDS analysis was carried out on one of the needle-like IMCs (marked with the square in Figure 6 (a)). The composition of the IMC is found to be 5.5 at.% Ni, 19.9 at.% Pd, 26.0 at.% In, and 48.7 at.% Sn. The (Ni+Pd)/(Sn+In) ratio of the IMC area is around 0.34, which is roughly close to the value of 0.25 for a compound of the PdSn4 type. Based on these results and the (Pd,Ni)Sn4 reported in the previous studies described above [21,22,36], the needle-like IMCs in Figure 6 are suggested to be (Pd,Ni)(Sn,In)4. Considering that the (Ni,Pd)(Sn,In)2 IMC layer is observed in the as-reflowed and aged joints, this (Ni,Pd)(Sn,In)2 IMC is expected to form beneath the (Pd,Ni)(Sn,In)4, in the same manner as the Ni3Sn4 layer beneath the (Pd,Ni)Sn4 reported in previous studies [31,36].
To quantify the growth of the IMC layer during aging, the thickness of the IMC layer in Figure 1 was measured from the bottom of the IMC layer to the tips of the needle-like IMCs, and Figure 7 shows the thickness plotted against the square root of aging time. The data were fitted by linear regression to the parabolic relationship X = X0 + k·t1/2, where X is the thickness, X0 is the thickness in the as-reflowed joint, k is the growth rate constant, and t is the aging time. The fitted line gives k = 0.471 ± 0.045 μm·h−1/2 and X0 = 1.72 ± 0.67 μm with R2 = 0.982. The linear relationship between the thickness and the square root of aging time indicates that the needle-like IMC layer thickens by diffusion-controlled growth [41,42].
Based on these results, a schematic diagram of the interfacial reaction between the SBI solder and the ENEPIG surface finish is shown in Figure 8. Before reflow, the ENEPIG surface finish consists of the Au, Pd, and Ni(P) layers. At the initial stage of the reaction, the Au layer is dissolved into the molten solder, and the Au(In,Sn)2 IMCs form near the interface. Then, the Pd layer reacts with the solder to form the needle-like (Pd,Ni)(Sn,In)4 IMCs. Then, the Pd layer is consumed and Ni is supplied from the Ni(P) layer, so the (Ni,Pd)(Sn,In)2 IMC is expected to form beneath the (Pd,Ni)(Sn,In)4. Following the Au(In,Sn)2 IMCs, the (Pd,Ni)(Sn,In)4 IMCs are also expected to be dispersed into the solder near the interface. As the reaction continues to progress, the (Ni,Pd)(Sn,In)2 IMC grows as the densely packed needle-like IMC layer, and both the Au(In,Sn)2 and (Pd,Ni)(Sn,In)4 IMCs are dispersed into the solder. This densely packed needle-like morphology can be attributed to the participation of Pd in the formation of the IMC at the initial stage of the reaction. As the (Ni,Pd)(Sn,In)2 IMC grows while maintaining this morphology, the top areas of the layer contain some Pd as highlighted in green in Figure 8.
To evaluate the effect of aging on the mechanical behavior of the joints, 20 joints were shear tested for each condition. In the previous studies of this Sn-Bi-In solder, the fracture mode was determined to be ductile or brittle from the fracture surfaces together with the stress–displacement curves [18,20]. Accordingly, the fracture of the joints is divided into ductile and brittle fracture, and Figure 9 shows top-view SEM images of a representative ductile fracture surface (upper row) and a representative brittle fracture surface (lower row) for each condition. Since ductile fracture is not found in the 500 h aged joints, a brittle fracture surface is shown in Figure 9 (d).
The fracture surfaces in Figure 9 show a smooth light gray region at the top, a rough light gray region in the middle, and a dark gray region at the bottom. To identify these regions, the as-reflowed joint in Figure 9 (e), in which they are all exposed, was examined by SEM and EDS. Figure 10 (a)–(c) show magnified images of the three regions of this joint. EDS point analysis was carried out on the smooth light gray region at the top in Figure 10 (a), and the results showed 72.5 at.% Sn, 18.0 at.% In, 7.0 at.% Bi, and 1.4 at.% Ni, indicating that this region is the residual solder. The rough light gray region in the middle, shown in Figure 10 (b), appears to consist of dimples. Dimples on fracture surfaces have been reported for joints where the crack propagated in the solder near the IMC layer, and IMCs were found inside some of the dimples [43,44]. EDS point analysis was carried out on the rough light gray region, and the results showed 47.9 at.% Sn, 23.4 at.% In, 13.9 at.% Bi, and 12.8 at.% Ni. This Ni content lies between the 1.4 at.% of the residual solder and the 27.7 at.% of the IMC in Figure 3 (a), indicating that the solder and the IMCs are mixed in this region. EDS point analysis was carried out on the dark gray region at the bottom in Figure 10 (c), and the results showed 73.8 at.% Ni, 19.5 at.% P, and 4.0 at.% Sn. Considering that the Ni3P layer lies between the IMC layer and the Ni(P) layer in Figure 2, this region is likely the Ni3P layer exposed by fracture along the IMC/Ni3P interface.
In the ductile fracture surfaces in Figure 9 (a)–(c), a large part of the surface is covered by the residual solder, and the exposed Ni3P layer is not found. The brittle fracture surfaces in Figure 9 (d)–(h) are flat, and a large part of them consists of the region where the solder and the IMCs are mixed. In Figure 9 (e)–(h), the exposed Ni3P layer is also found, and its area increases with aging time. Although the fracture surfaces of individual joints show some variation under the same condition, the fracture mode generally changes from ductile to brittle with increasing aging time. The increase in the exposed area of the Ni3P layer is similar to the trend in the ENIG joints of the same solder [20].
To analyze the crack propagation paths in more detail, the sheared joints were cross-sectioned and observed by SEM, and representative images for each condition are presented in Figure 11. The images in Figure 11 (a)–(d) show the entire cross-section of each joint, and Figure 11 (e)–(h) are magnified images of these joints, where (e) shows the residual solder and (f)–(h) show an abrupt change in the crack path. In the as-reflowed joint in Figure 11 (a) and (e), fracture occurred within the solder bulk over most of the joint area. In the 100 h aged joint in Figure 11 (f), solder remains on the right side, and the IMC layer remains on the left side. In the 300 and 500 h aged joints in Figure 11 (g) and (h), the IMC layer remains on the right side, but it is not visible on the left side. On the right side, it is likely that the crack propagated near the top of this IMC layer, similar to that reported in the ENIG joints [20]. This indicates that the crack propagated along the solder/IMC interface. On the other hand, only the Ni3P layer remains on the left side of Figure 11 (g) and (h), indicating that the crack propagated along the IMC/Ni3P interface.
Consequently, three representative crack paths are identified in the sheared joints: through the solder bulk, along the solder/IMC interface, and along the IMC/Ni3P interface. Considering these crack paths, the abrupt change in the crack path appears to be a transition from the solder bulk to the solder/IMC interface in Figure 11 (f) and from the solder/IMC interface to the IMC/Ni3P interface in Figure 11 (g) and (h). Although the crack paths of individual joints show some variation under the same condition, they tend to shift from the solder bulk to the solder/IMC interface and finally to the IMC/Ni3P interface with increasing aging time. A similar trend was reported in the ENIG joints of the same solder, in which the crack path shifted from the solder/IMC interface toward the IMC/Ni3P interface as the aging time increased [20].
Figure 12 shows the shear stress–displacement curves of the 20 joints tested for each condition. The stress–displacement curves show a gradual ductile-to-brittle transition as the aging time increases, from ductile curves in most of the as-reflowed joints to brittle curves in all of the 500 h aged joints. The maximum shear strength remains at 39.5–44.2 MPa on average, showing similar values before and after aging. However, the mean displacement at the maximum shear strength decreases with increasing aging time, from 307 μm in the as-reflowed joints to 269, 259, and 219 μm after 100, 300, and 500 h, respectively. This decrease is found even among the brittle curves, and it may be related to the shift of the crack path toward the IMC/Ni3P interface observed in Figure 9 and Figure 11.
In the ENIG joints of the same solder, both the maximum shear strength and the displacement at the maximum shear strength decreased as the aging time increased [20]. In contrast, on ENEPIG, the maximum shear strength remains in a similar range up to 500 h, but the displacement at the maximum shear strength gradually decreases. In addition to this difference, the ENIG and ENEPIG joints differ in the fracture behavior. In the as-reflowed state, most of the ENEPIG joints exhibit ductile fracture, whereas all of the ENIG joints exhibited brittle fracture, and after 500 h of aging, the IMCs remain on a larger area of the fracture surface on ENEPIG than on ENIG [20]. The difference in the maximum shear strength between ENIG and ENEPIG appears closely related to the difference in the IMC morphology between the two surface finishes, and the needle-like IMC layer on ENEPIG is considered to delay the shift of the crack path toward the IMC/Ni3P interface.
4. Conclusions
In this study, the interfacial reaction and shear behavior of the SBI solder joints on ENEPIG were investigated during isothermal aging at 85 °C for durations of up to 500 h. The results were compared with those of the SBI/ENIG joints reported previously [20] to evaluate the effect of the Pd layer on the interfacial reaction of the SBI solder and on the shear behavior of the joints.
At the SBI/ENEPIG interface, a thin needle-like IMC layer formed during reflow and grew with aging time. According to the SEM and EPMA analysis, the composition of the IMC layer on ENEPIG is similar to that of the Ni(In0.3Sn0.7)2 IMC on ENIG. Therefore, assuming that part of the Ni is replaced by Pd, the IMC layer is suggested to be (Ni,Pd)(Sn,In)2. Despite their similar compositions, the (Ni,Pd)(Sn,In)2 IMC grew as a densely packed needle-like layer, whereas the Ni(In0.3Sn0.7)2 IMC grew as loosely stacked cuboids. Considering that Pd was concentrated in the upper part of the IMC layer after aging, these results suggest that the difference in morphology arises from the participation of Pd in the IMC formation at the initial stage of the reaction.
The initial stage of the reaction was examined after short reflow on a hot plate. At this stage, the Au layer dissolved into the molten solder and formed Au(In,Sn)2 IMCs near the interface, and the Pd layer reacted with the solder to form needle-like IMCs. The needle-like IMCs formed at the initial stage are suggested to be (Pd,Ni)(Sn,In)4. As the Pd layer is consumed and Ni is supplied from the Ni(P) layer, a densely packed needle-like (Ni,Pd)(Sn,In)2 IMC layer is expected to form beneath the (Pd,Ni)(Sn,In)4 IMCs. During aging, the (Ni,Pd)(Sn,In)2 IMC layer maintained its densely packed needle-like morphology, even though it was mainly composed of Ni, In, and Sn due to the limited supply of Pd. Therefore, the (Ni,Pd)(Sn,In)2 IMC layer appears to thicken during aging by growth on the pre-existing IMC. The thickness of the IMC layer increased linearly with the square root of aging time, which indicates that its growth is diffusion-controlled.
In the ball shear tests, the SBI/ENEPIG joints showed a gradual ductile-to-brittle transition with aging time, from ductile fracture in most of the as-reflowed joints to brittle fracture in all of the 500 h aged joints. With increasing aging time, the crack path tended to shift from the solder bulk to the solder/IMC interface and finally to the IMC/Ni3P interface. The maximum shear strength of the SBI/ENEPIG joints remained in a similar range up to 500 h, while that of the SBI/ENIG joints decreased as the aging time increased. This difference in the maximum shear strength can be explained by the difference in the morphology of the interfacial IMC layer between ENIG and ENEPIG.
These results indicate that the Pd layer of ENEPIG plays an important role in the interfacial reaction of the SBI solder and in the shear behavior of its joints during aging.
Author Contributions
Conceptualization, J.-H.K. and H.-J.L.; methodology, J.-H.K., J.W.J., S.G.P. and Y.K.C.; validation, J.W.J., S.G.P. and Y.K.C.; formal analysis, J.-H.K., J.W.J., S.G.P. and Y.K.C.; investigation, J.-H.K., J.W.J., S.G.P. and Y.K.C.; data curation, J.-H.K., J.W.J., S.G.P. and Y.K.C.; writing—original draft preparation, J.-H.K.; writing—review and editing, J.-H.K., B.L. and H.-J.L.; visualization, J.-H.K. and J.W.J.; supervision, B.L. and H.-J.L.; project administration, J.-H.K.; funding acquisition, H.-J.L. J.-H.K. and J.W.J. contributed equally to this work. All authors have read and agreed to the published version of the manuscript.
Funding
This research was funded by the Ministry of Science and ICT (MSIT) through the National Research Foundation of Korea (NRF), grant number RS-2024-00432936. This research was also funded by the Ministry of Trade, Industry and Energy (MOTIE) under the Korea Collaborative & High-tech Initiative for Prospective Semiconductor Research (K-CHIPS), grant number RS-2023-00236091.
Data Availability Statement
The main data supporting the findings of this study are included within the article. Additional raw data are available from the corresponding author upon reasonable request.
Acknowledgments
During the preparation of this manuscript, the authors used GPT (OpenAI) and Claude (Anthropic) for language editing and restructuring of the text, literature searching and reference checking, and writing scripts for data processing and figure preparation. The authors have reviewed and edited the output and take full responsibility for the content of this publication.
Conflicts of Interest
The authors declare that they have no known competing financial interests or personal relationships that could have appeared to influence the work reported in this paper.
References
- Liu, Y.; Tu, K.N. Low melting point solders based on Sn, Bi, and In elements. Mater. Today Adv. 2020, 8, 100115. [Google Scholar] [CrossRef]
- Lee, Y.-W.; Lee, T.-K.; Jung, J.-P. Intermediate Low-Melting-Temperature Solder Thermal Cycling Enhancement Using Bismuth and Indium Microalloying. J. Electron. Mater. 2023, 52, 810–818. [Google Scholar] [CrossRef]
- Wang, F.; Chen, H.; Huang, Y.; Liu, L.; Zhang, Z. Recent progress on the development of Sn–Bi based low-temperature Pb-free solders. J. Mater. Sci. Mater. Electron. 2019, 30, 3222–3243. [Google Scholar] [CrossRef]
- Cai, C.; Xu, J.; Wang, H.; Park, S.B. A comparative study of thermal fatigue life of Eutectic Sn-Bi, Hybrid Sn-Bi/SAC and SAC solder alloy BGAs. Microelectron. Reliab. 2021, 119, 114065. [Google Scholar] [CrossRef]
- Yang, F.; Zhang, L.; Liu, Z.-Q.; Zhong, S.-J.; Ma, J.; Bao, L. Properties and Microstructures of Sn-Bi-X Lead-Free Solders. Adv. Mater. Sci. Eng. 2016, 2016, 9265195. [Google Scholar] [CrossRef]
- Kang, H.; Rajendran, S.H.; Jung, J.P. Low Melting Temperature Sn-Bi Solder: Effect of Alloying and Nanoparticle Addition on the Microstructural, Thermal, Interfacial Bonding, and Mechanical Characteristics. Metals 2021, 11, 364. [Google Scholar] [CrossRef]
- Li, B.; Liu, S.; Sun, Y.; Sun, G.; Qu, S.; He, P.; Zhang, S. The effect of indium microalloying on lead-free solders: A review. Mater. Sci. Semicond. Process. 2025, 185, 108956. [Google Scholar] [CrossRef]
- Sahasrabudhe, S.; Mokler, S.; Renavikar, M.; Sane, S.; Byrd, K.; Brigham, E.; Jin, O.; Goonetilleke, P.; Badwe, N.; Parupalli, S. Low Temperature Solder – A Breakthrough Technology for Surface Mounted Devices. In Proceedings of the 2018 IEEE 68th Electronic Components and Technology Conference (ECTC), San Diego, CA, USA, 29 May–1 June 2018; pp. 1455–1464. [Google Scholar] [CrossRef]
- Luo, X.; Peng, J.; Zhang, W.; Wang, S.; Cai, S.; Wang, X. CALPHAD-guided alloy design of Sn–In based solder joints with multiphase structure and their mechanical properties. Mater. Sci. Eng. A 2022, 860, 144284. [Google Scholar] [CrossRef]
- Choi, H.; Kim, C.-L.; Sohn, Y. Diffusion Barrier Properties of the Intermetallic Compound Layers Formed in the Pt Nanoparticles Alloyed Sn-58Bi Solder Joints Reacted with ENIG and ENEPIG Surface Finishes. Materials 2022, 15, 8419. [Google Scholar] [CrossRef] [PubMed]
- Spinelli, J.E.; Leal, J.R.; Wu, J.A.; Luktuke, A.; Ganju, E.; Chawla, N. Long-Term Microstructural Stability of Sn-40Bi and Sn-40Bi-10In Alloys. J. Electron. Mater. 2024, 53, 2455–2466. [Google Scholar] [CrossRef]
- Noor, E.E.M.; Sharif, N.M.; Yew, C.K.; Ariga, T.; Ismail, A.B.; Hussain, Z. Wettability and strength of In–Bi–Sn lead-free solder alloy on copper substrate. J. Alloys Compd. 2010, 507, 290–296. [Google Scholar] [CrossRef]
- Nguyen, V.L.; Kim, S.H.; Jeong, J.W.; Lim, T.-S.; Yang, D.-Y.; Kim, K.B.; Kim, Y.J.; Lee, J.H.; Kim, Y.-J.; Yang, S. Microstructure and mechanical behavior of low-melting point Bi-Sn-In solder joints. Electron. Mater. Lett. 2017, 13, 420–426. [Google Scholar] [CrossRef]
- Wang, Z.; Zhang, Q.K.; Chen, Y.X.; Song, Z.L. Influences of Ag and In alloying on Sn-Bi eutectic solder and SnBi/Cu solder joints. J. Mater. Sci. Mater. Electron. 2019, 30, 18524–18538. [Google Scholar] [CrossRef]
- Leal, J.R.; Reyes, R.A.V.; de Gouveia, G.L.; Coury, F.G.; Spinelli, J.E. Evaluation of Solidification and Interfacial Reaction of Sn-Bi and Sn-Bi-In Solder Alloys in Copper and Nickel Interfaces. Metals 2024, 14, 963. [Google Scholar] [CrossRef]
- Zhang, S.; Long, W.; Li, P.; Liu, F.; Xue, H.; Ding, T. Low-temperature lead-free SnBiIn solder for electronic packaging. J. Mater. Sci. Mater. Electron. 2024, 35, 690. [Google Scholar] [CrossRef]
- Shen, Y.-A.; Liu, C.-H.; Kao, H.-Z. Sn–31Bi–19In alloy: A golden ratio design for exceptional elongation, high strength, and low-temperature soldering. J. Mater. Res. Technol. 2025, 37, 2727–2739. [Google Scholar] [CrossRef]
- Choi, H.; Kim, J.-H.; Lee, H.-D.; Lee, S.-W.; Lee, E.-H.; Lee, B.; Song, B.-M.; Lee, H.-J. Investigation of the mechanical properties of Sn-Bi-In solders for intermediate low-temperature applications. J. Alloys Compd. 2026, 1059, 187023. [Google Scholar] [CrossRef]
- Li, Q.; Ma, N.; Lei, Y.; Lin, J.; Fu, H.; Gu, J. Characterization of Low-Melting-Point Sn-Bi-In Lead-Free Solders. J. Electron. Mater. 2016, 45, 5800–5810. [Google Scholar] [CrossRef]
- Kim, J.-H.; Lee, H.-G.; Kang, J.-W.; Lee, B.; Lee, H.-J. Interfacial reactions of Sn-19Bi-19In solder on OSP and ENIG surface finishes during thermal aging. J. Mater. Sci. Mater. Electron. 2026, 37, 1905. [Google Scholar] [CrossRef]
- Wang, C.-H.; Li, C.-A.; Li, K.-T.; Chiu, H.-W. Influence of Pd Coating Thickness and Pd Content in Sn-Based Solders on Interfacial IMC Formation and Microstructural Evolution in Solder/Ni Joints. Materials 2026, 19, 526. [Google Scholar] [CrossRef] [PubMed]
- Oda, Y.; Fukumuro, N.; Yae, S. Intermetallic Compound Growth between Electroless Nickel/Electroless Palladium/Immersion Gold Surface Finish and Sn-3.5Ag or Sn-3.0Ag-0.5Cu Solder. J. Electron. Mater. 2018, 47, 2507–2511. [Google Scholar] [CrossRef]
- Ho, C.-E.; Lin, S.-W.; Lin, Y.-C. Effects of Pd concentration on the interfacial reaction and mechanical reliability of the Sn–Pd/Ni system. J. Alloys Compd. 2011, 509, 7749–7757. [Google Scholar] [CrossRef]
- Pun, K.P.L.; Islam, M.N.; Rotanson, J.; Cheung, C.-W.; Chan, A.H.S. Enhancement of Sn-Bi-Ag Solder Joints with ENEPIG Surface Finish for Low-Temperature Interconnection. J. Electron. Mater. 2018, 47, 5191–5202. [Google Scholar] [CrossRef]
- Wang, X.; Chung, C.K. Mechanisms and solutions to the brittle solder joint in electroless Ni plating. Microelectron. Reliab. 2016, 65, 173–177. [Google Scholar] [CrossRef]
- Wang, Y.-W.; Tsai, C.-T.; Fang, J.-C.; Lin, T.-Y. Microstructural evaluation of interfacial intermetallic compounds between Sn58Bi and ENEPIG. J. Taiwan Inst. Chem. Eng. 2024, 159, 105508. [Google Scholar] [CrossRef]
- Chen, C.; Wang, C.; Sun, H.; Yin, H.; Gao, X.; Xue, H.; Ni, D.; Bian, K.; Gu, Q. Interfacial Microstructure and Mechanical Reliability of Sn-58Bi/ENEPIG Solder Joints. Processes 2022, 10, 295. [Google Scholar] [CrossRef]
- Chen, H.; Tsai, Y.-L.; Chang, Y.-T.; Wu, A.T. Effect of massive spalling on mechanical strength of solder joints in Pb-free solder reflowed on Co-based surface finishes. J. Alloys Compd. 2016, 671, 100–108. [Google Scholar] [CrossRef]
- Peng, S.P.; Wu, W.H.; Ho, C.E.; Huang, Y.M. Comparative study between Sn37Pb and Sn3Ag0.5Cu soldering with Au/Pd/Ni(P) tri-layer structure. J. Alloys Compd. 2010, 493, 431–437. [Google Scholar] [CrossRef]
- Tian, R.; Tian, Y.; Huang, Y.; Yang, D.; Chen, C.; Sun, H. Comparative study between the Sn–Ag–Cu/ENIG and Sn–Ag–Cu/ENEPIG solder joints under extreme temperature thermal shock. J. Mater. Sci. Mater. Electron. 2021, 32, 6890–6899. [Google Scholar] [CrossRef]
- Kim, J.; Park, D.-Y.; Ahn, B.; Bang, J.; Kim, M.-S.; Park, H.-S.; Sohn, Y.; Ko, Y.-H. Effective (Pd,Ni)Sn4 diffusion barrier to suppress brittle fracture at Sn-58Bi-xAg solder joint with Ni(P)/Pd(P)/Au metallization pad. Microelectron. Reliab. 2022, 129, 114472. [Google Scholar] [CrossRef]
- Kim, J.; Myung, W.-R.; Jung, S.-B. Effects of Aging Treatment on Mechanical Properties of Sn-58Bi Epoxy Solder on ENEPIG-Surface-Finished PCB. J. Electron. Mater. 2016, 45, 5895–5903. [Google Scholar] [CrossRef]
- Fuchs, C.; Schreck, T.; Kaloudis, M. Interfacial reactions between Sn–57Bi–1Ag solder and electroless Ni-P/immersion Au under solid-state aging. J. Mater. Sci. 2012, 47, 4036–4041. [Google Scholar] [CrossRef]
- Fowler, H.N.; Puttur Lakshminarayana, S.A.; Lai, S.Y.; Tay, S.X.; Masaeng, A.; Subbarayan, G.; Blendell, J.E.; Handwerker, C.A. Effect of Sb and Ag Addition and Aging on the Microstructural Evolution, IMC Layer Growth, and Mechanical Properties of Near-Eutectic Sn-Bi Alloys. J. Electron. Mater. 2024, 53, 1284–1298. [Google Scholar] [CrossRef]
- Zhou, J.; Shahbazi, M.; Poitras, J.T.; Tan, X.F.; McDonald, S.D.; Nogita, K. The Effect of Gallium Addition on the Microstructure and Superconducting Properties of In-Bi-Sn Solder Alloys. J. Electron. Mater. 2025, 54, 2628–2637. [Google Scholar] [CrossRef]
- Lee, S.-M.; Yoon, J.-W.; Jung, S.-B. Interfacial reaction and mechanical properties between low melting temperature Sn–58Bi solder and various surface finishes during reflow reactions. J. Mater. Sci. Mater. Electron. 2015, 26, 1649–1660. [Google Scholar] [CrossRef]
- Nash, A.; Nash, P. Ni-Pd (Nickel-Palladium). In ASM Handbook; Baker, H., Ed.; ASM International: Materials Park, OH, USA, 1992; Volume 3. [Google Scholar]
- Rahman, M.A.; Ho, C.E.; Gierlotka, W.; Kuo, J.C. Experimental determination and thermodynamic modeling of the Sn-rich corner of the ternary Ni-Pd-Sn phase diagram at 250 °C. J. Electron. Mater. 2014, 43, 4582–4593. [Google Scholar] [CrossRef]
- Wu, H.-M.; Wu, F.-C.; Chuang, T.-H. Intermetallic Reactions in a Sn-20In-2.8Ag Solder Ball-Grid-Array Package with Au/Ni/Cu Pads. J. Electron. Mater. 2005, 34, 1385–1390. [Google Scholar] [CrossRef]
- Wang, S.S.; Tseng, Y.H.; Chuang, T.H. Intermetallic Compounds Formed during the Interfacial Reactions between Liquid In-49Sn Solder and Ni Substrates. J. Electron. Mater. 2006, 35, 165–169. [Google Scholar] [CrossRef]
- Kim, D.-G.; Jung, S.-B. Interfacial reactions and growth kinetics for intermetallic compound layer between In-48Sn solder and bare Cu substrate. J. Alloys Compd. 2005, 386, 151–156. [Google Scholar] [CrossRef]
- Tu, K.-N. Solder Joint Technology: Materials, Properties, and Reliability; Springer: New York, NY, USA, 2007. [Google Scholar] [CrossRef]
- Li, S.; Hang, C.; Zhang, W.; Guan, Q.; Tang, X.; Yu, D.; Ding, Y.; Wang, X. Current-induced solder evolution and mechanical property of Sn-3.0Ag-0.5Cu solder joints under thermal shock condition. J. Alloys Compd. 2024, 970, 172519. [Google Scholar] [CrossRef]
- Tian, S.; Li, S.; Zhou, J.; Xue, F.; Cao, R.; Wang, F. Effect of indium addition on interfacial IMC growth and bending properties of eutectic Sn–0.7Cu solder joints. J. Mater. Sci. Mater. Electron. 2017, 28, 16120–16132. [Google Scholar] [CrossRef]
Figure 1.
Cross-sectional SEM images of the etched Sn-19Bi-19In/ENEPIG interface: (a) as-reflowed and after isothermal aging at 85 °C for (b) 100 h, (c) 300 h, and (d) 500 h.
Figure 1.
Cross-sectional SEM images of the etched Sn-19Bi-19In/ENEPIG interface: (a) as-reflowed and after isothermal aging at 85 °C for (b) 100 h, (c) 300 h, and (d) 500 h.
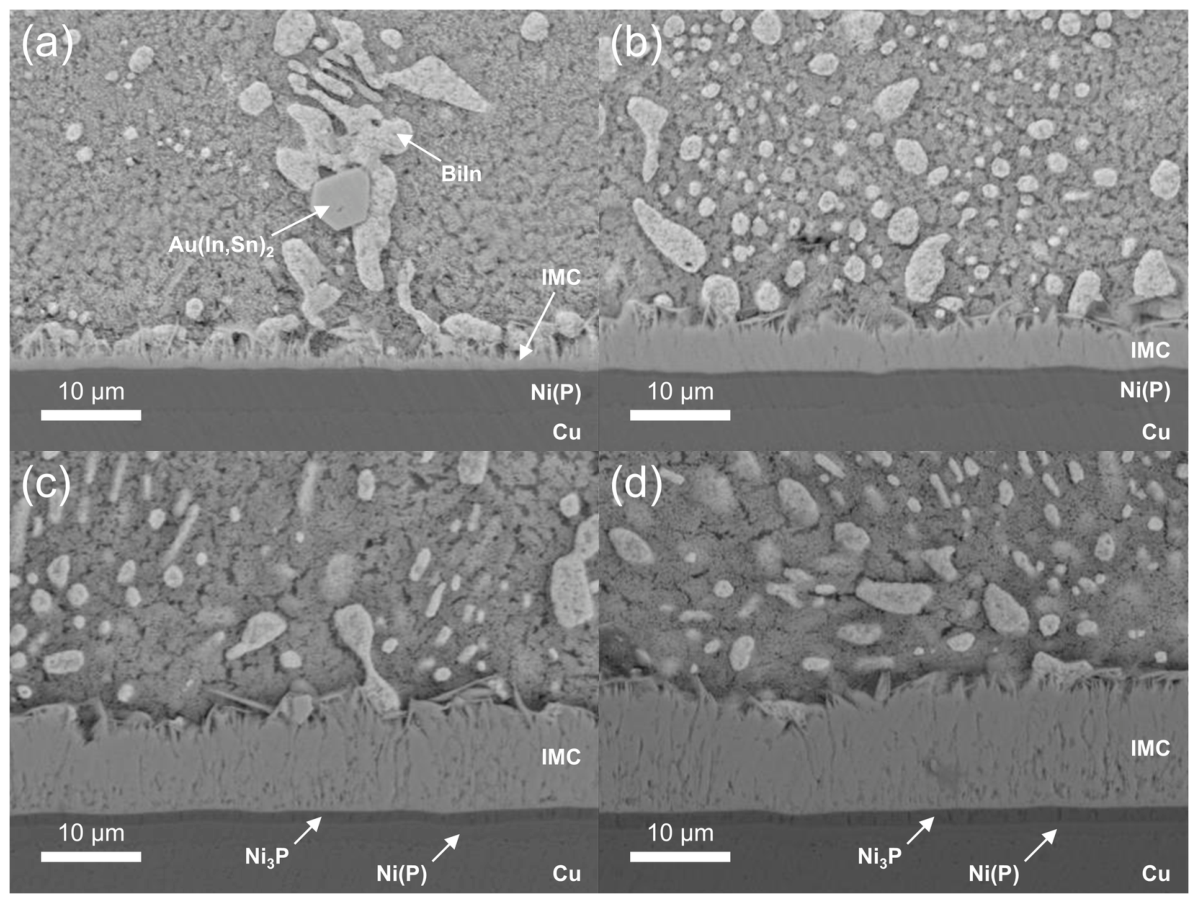
Figure 2.
WDS elemental maps (Sn, In, Bi, Ni, Pd, and Au) of the Sn-19Bi-19In/ENEPIG interface with the corresponding BSE images in the as-reflowed state and after isothermal aging at 85 °C for 100, 300, and 500 h. The color scale from low to high is set for each element and is the same for all four conditions. The compositions at the points marked in the BSE images are listed in Table 1.
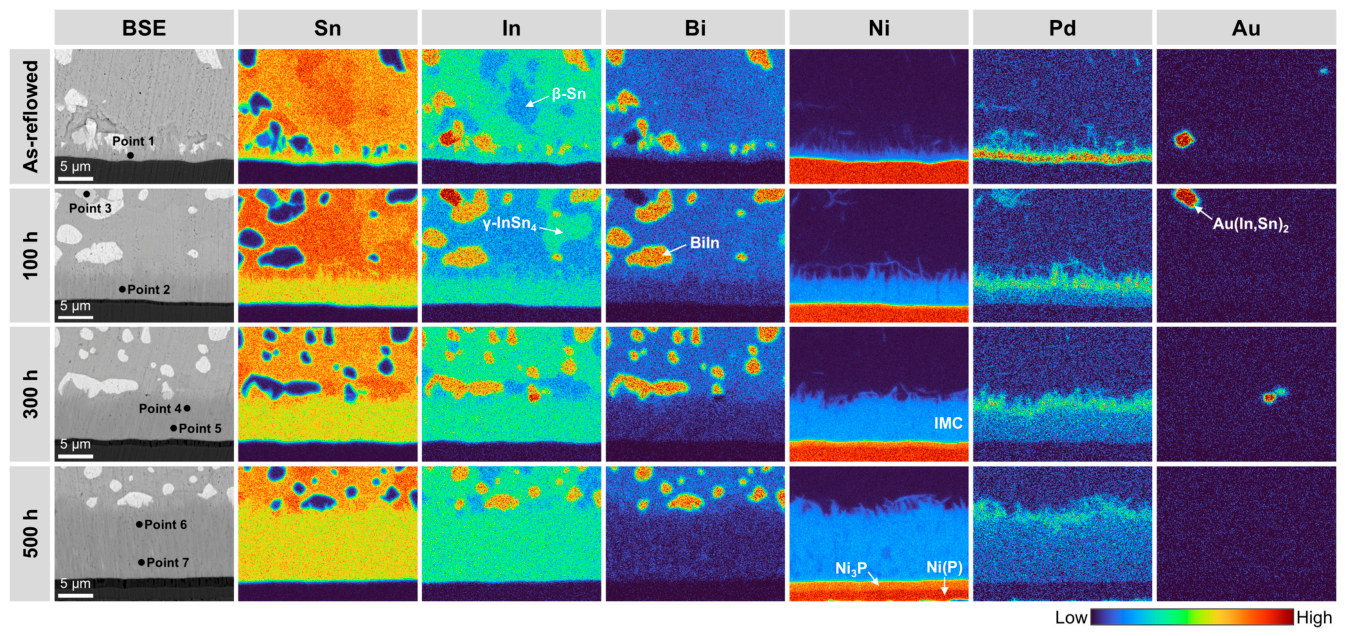
Figure 3.
Top-view SEM images of the IMC layer of the Sn-19Bi-19In/ENEPIG joints after the solder was etched away: (a) as-reflowed and (b) after aging at 85 °C for 300 h. The EDS point in each image marks the region where EDS analysis was carried out.
Figure 3.
Top-view SEM images of the IMC layer of the Sn-19Bi-19In/ENEPIG joints after the solder was etched away: (a) as-reflowed and (b) after aging at 85 °C for 300 h. The EDS point in each image marks the region where EDS analysis was carried out.
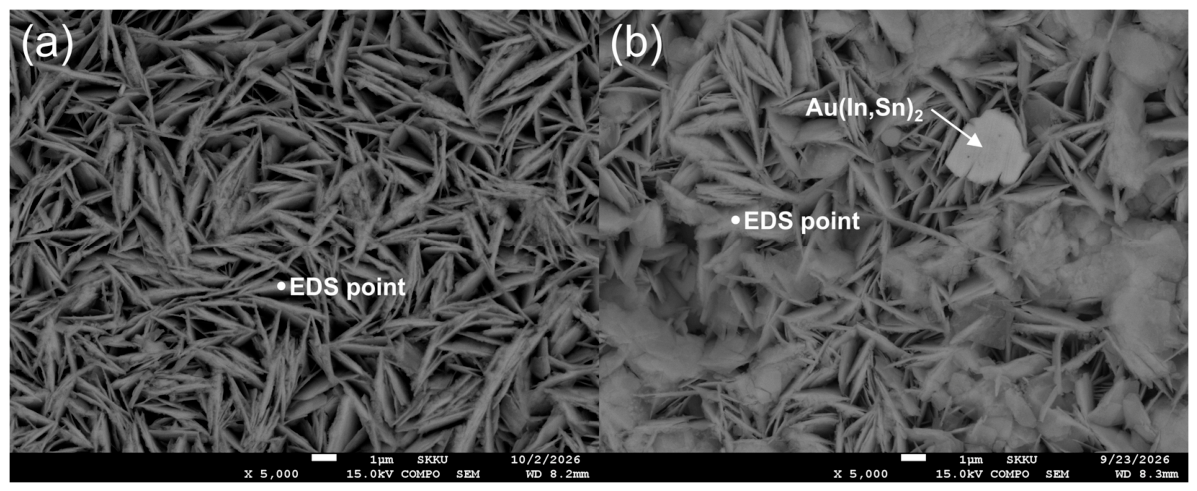
Figure 4.
Cross-sectional SEM images of the Sn-19Bi-19In/ENEPIG interface after reflow on a hot plate for (a) 30 s, (b) 40 s, (c) 50 s, and (d) 60 s, after selective etching of the solder. The EDS point in (c) marks the region where EDS analysis was carried out.
Figure 4.
Cross-sectional SEM images of the Sn-19Bi-19In/ENEPIG interface after reflow on a hot plate for (a) 30 s, (b) 40 s, (c) 50 s, and (d) 60 s, after selective etching of the solder. The EDS point in (c) marks the region where EDS analysis was carried out.
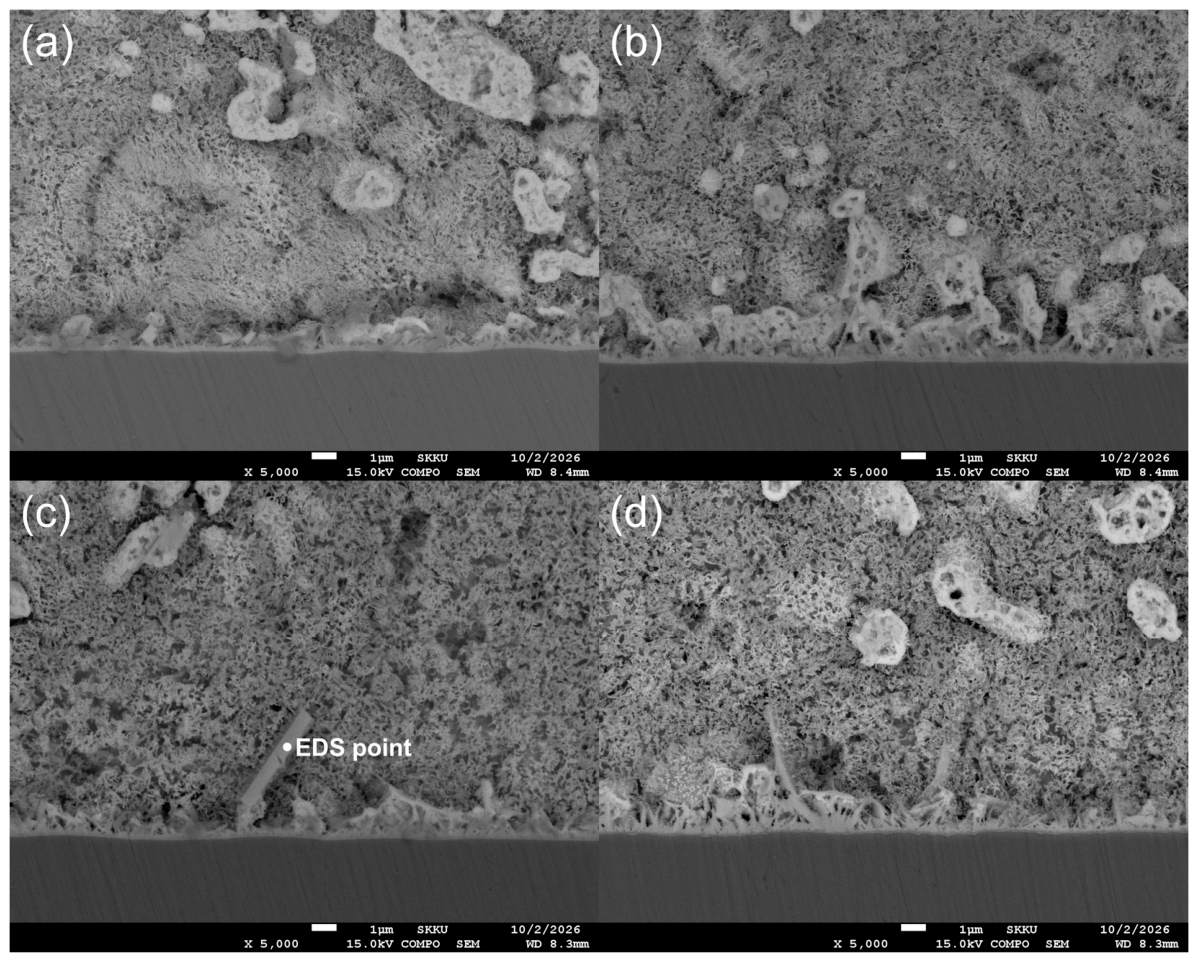
Figure 5.
STEM-EDS elemental maps and line profiles of the Sn-19Bi-19In/ENEPIG interface after reflow on a hot plate for 30 s: (a) HAADF image and maps of (b) Sn, (c) In, (d) Bi, (e) Ni, (f) Pd, (g) Au, and (h) P. The line profiles of these elements are shown in (i). The arrow in (a) indicates the position and direction of the line scan. The colors in the elemental maps indicate the relative intensity of each element.
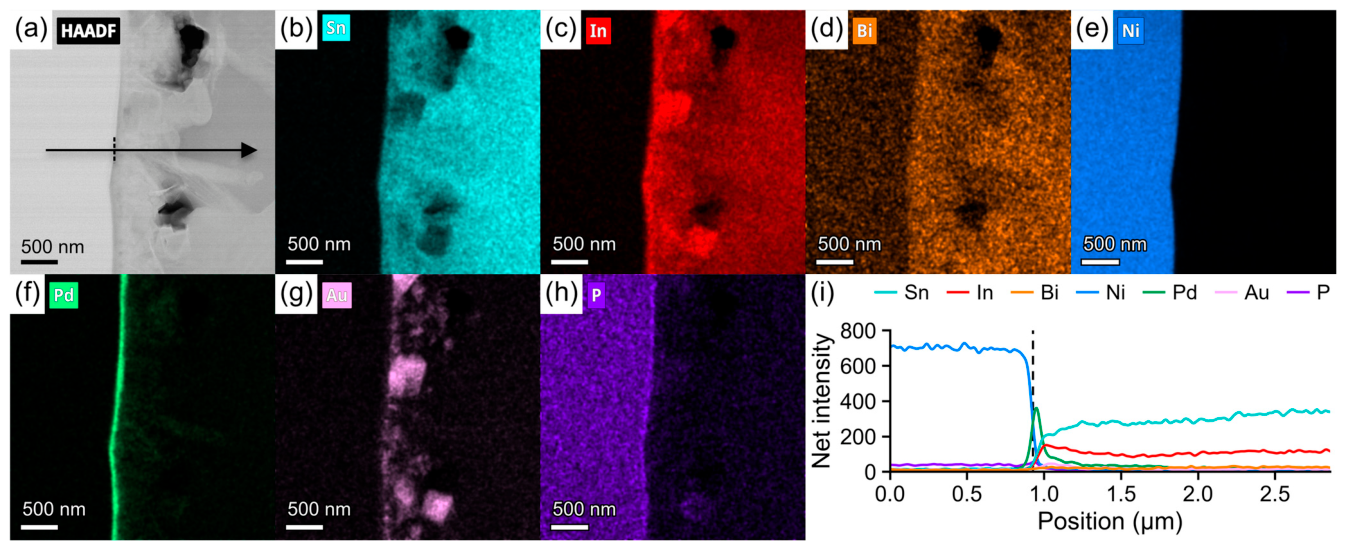
Figure 6.
STEM-EDS elemental maps and line profiles of the Sn-19Bi-19In/ENEPIG interface after reflow on a hot plate for 50 s: (a) HAADF image and maps of (b) Sn, (c) In, (d) Bi, (e) Ni, (f) Pd, (g) Au, and (h) P. The line profiles of these elements are shown in (i). The arrow in (a) indicates the position and direction of the line scan, and the dashed box marks the area where EDS analysis was carried out. The colors in the elemental maps indicate the relative intensity of each element.
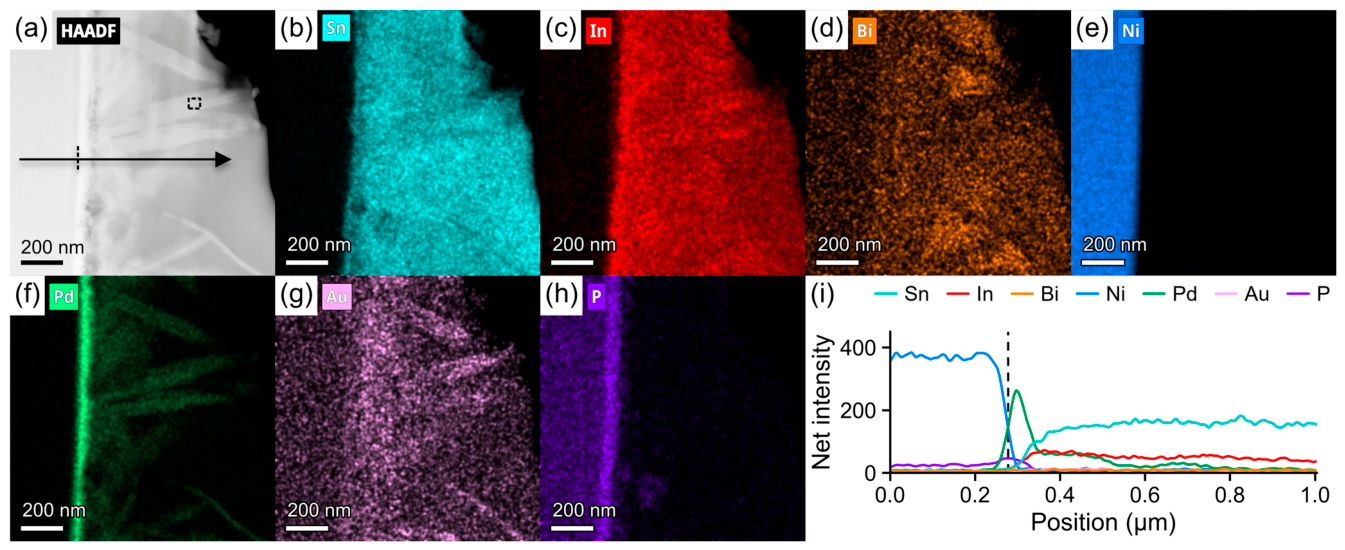
Figure 7.
Thickness of the IMC layer at the Sn-19Bi-19In/ENEPIG interface during aging at 85 °C, plotted against the square root of aging time. The solid line represents the linear fit of X = X0 + k·t1/2.
Figure 7.
Thickness of the IMC layer at the Sn-19Bi-19In/ENEPIG interface during aging at 85 °C, plotted against the square root of aging time. The solid line represents the linear fit of X = X0 + k·t1/2.
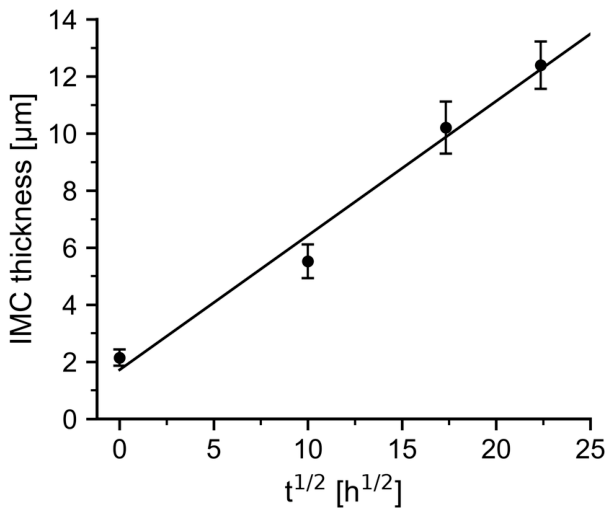
Figure 8.
Schematic diagram of the proposed interfacial reaction at the Sn-19Bi-19In/ENEPIG interface during reflow and subsequent aging at 85 °C. The arrow indicates the progress of the reaction.
Figure 8.
Schematic diagram of the proposed interfacial reaction at the Sn-19Bi-19In/ENEPIG interface during reflow and subsequent aging at 85 °C. The arrow indicates the progress of the reaction.
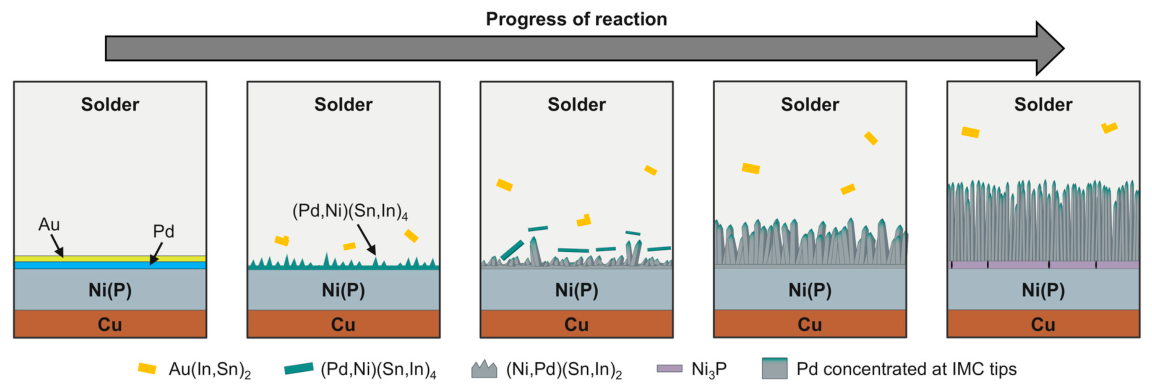
Figure 9.
Top-view SEM images of the fracture surfaces after shear testing. The upper row shows representative ductile fracture surfaces: (a) as-reflowed, (b) 100 h, and (c) 300 h. Since none of the 500 h aged joints showed ductile fracture, (d) shows a brittle fracture surface. The lower row shows representative brittle fracture surfaces: (e) as-reflowed, (f) 100 h, (g) 300 h, and (h) 500 h.
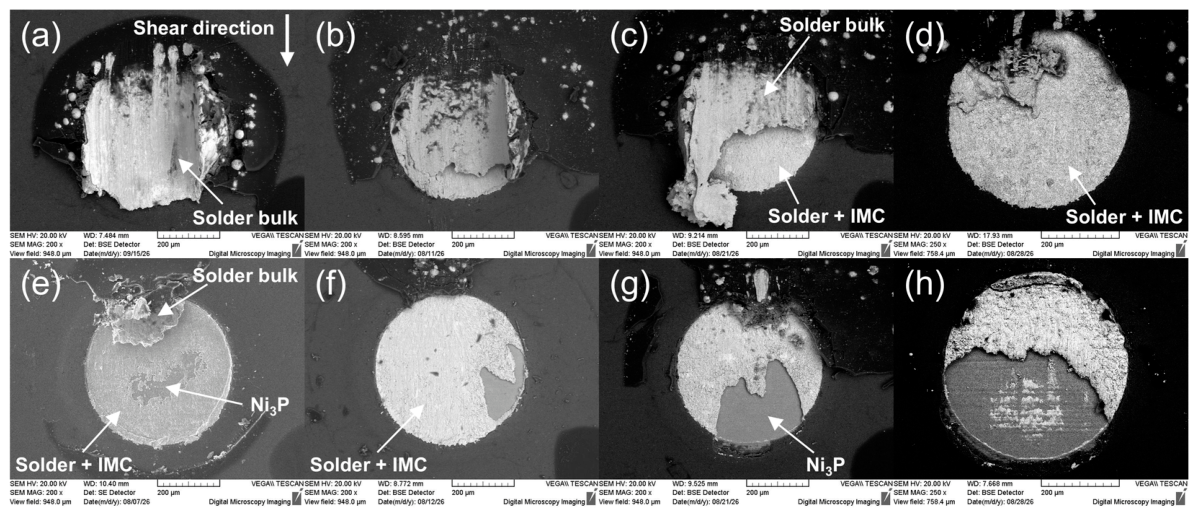
Figure 10.
Magnified SEM images of the fracture surface of the as-reflowed joint in Figure 9 (e), taken from (a) the smooth light gray region at the top, (b) the rough light gray region in the middle, and (c) the dark gray region at the bottom. The EDS point in each image marks the region where EDS analysis was carried out.
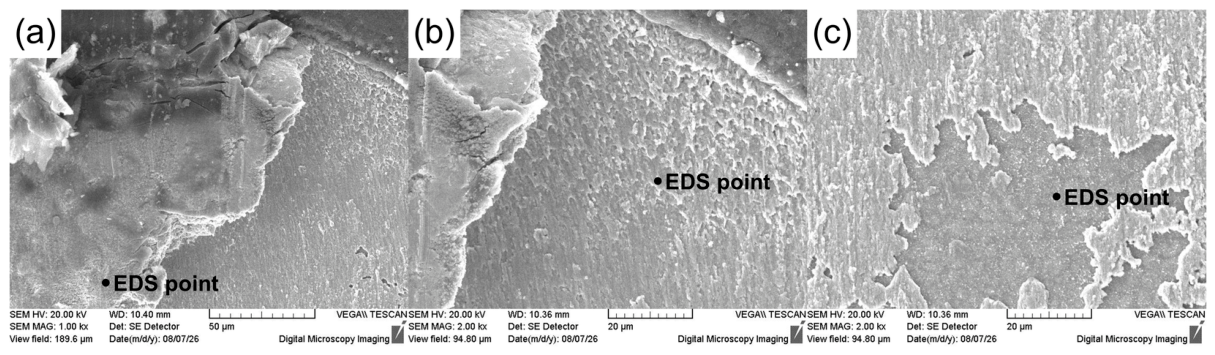
Figure 11.
Cross-sectional SEM images of the joints after shear testing: (a) as-reflowed, (b) 100 h, (c) 300 h, and (d) 500 h. The lower row (e)–(h) shows magnified images of the same joints, taken from (e) the region where the solder remained and (f)–(h) the regions where an abrupt change in the crack path is observed.
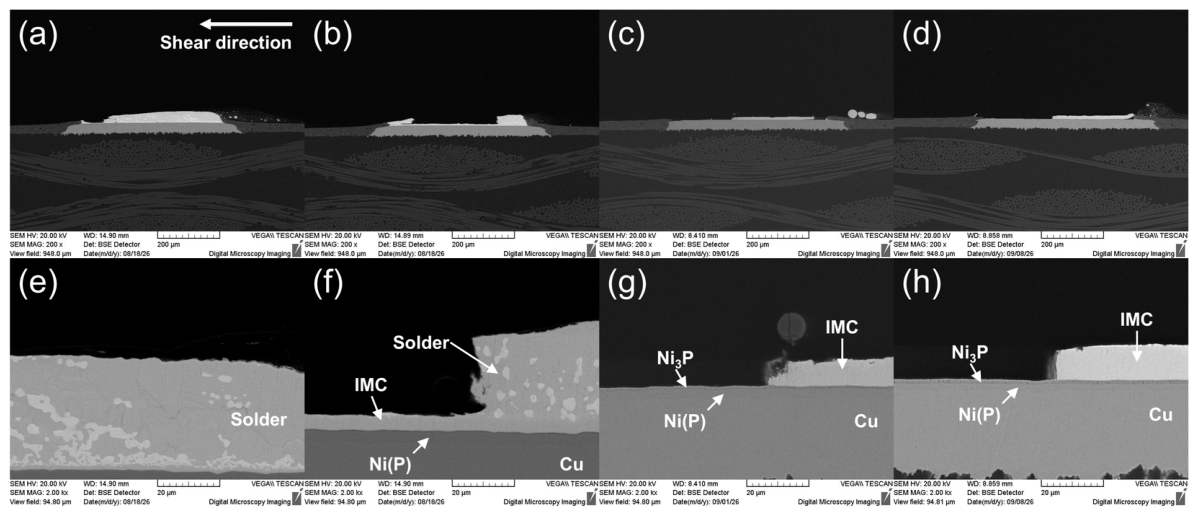
Figure 12.
Shear stress–displacement curves of the 20 joints tested for each condition: (a) as-reflowed, (b) 100 h, (c) 300 h, and (d) 500 h.
Figure 12.
Shear stress–displacement curves of the 20 joints tested for each condition: (a) as-reflowed, (b) 100 h, (c) 300 h, and (d) 500 h.
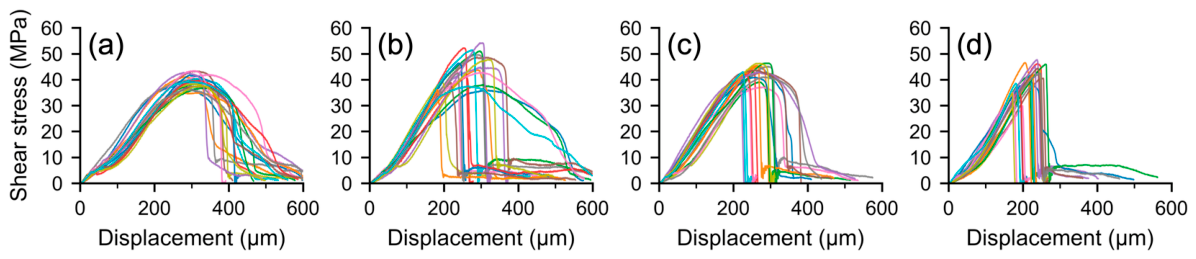

Table 1.
WDS compositions (at.%) of the points marked in Figure 2. The dash (–) indicates that the element was not measured.
Table 1.
WDS compositions (at.%) of the points marked in Figure 2. The dash (–) indicates that the element was not measured.
| Aging condition | Point | Sn | In | Bi | Ni | Pd | Au |
| As-reflowed | 1 | 52.8 | 14.0 | 6.6 | 22.0 | 4.6 | – |
| 100 h | 2 | 53.5 | 14.0 | 3.3 | 28.5 | 0.7 | – |
| 3 | 9.7 | 56.9 | – | 1.2 | 1.3 | 31.0 | |
| 300 h | 4 | 52.2 | 14.4 | 3.9 | 27.7 | 1.8 | – |
| 5 | 54.0 | 13.9 | 1.3 | 30.3 | 0.5 | – | |
| 500 h | 6 | 53.6 | 14.8 | 2.8 | 27.0 | 1.8 | – |
| 7 | 54.6 | 14.0 | 2.8 | 28.2 | 0.3 | – |
Disclaimer/Publisher’s Note: The statements, opinions and data contained in all publications are solely those of the individual author(s) and contributor(s) and not of MDPI and/or the editor(s). MDPI and/or the editor(s) disclaim responsibility for any injury to people or property resulting from any ideas, methods, instructions or products referred to in the content. |
© 2026 by the authors. Licensee MDPI, Basel, Switzerland. This article is an open access article distributed under the terms and conditions of the Creative Commons Attribution (CC BY) license (http://creativecommons.org/licenses/by/4.0/).
Copyright: This open access article is published under a Creative Commons CC BY 4.0 license, which permit the free download, distribution, and reuse, provided that the author and preprint are cited in any reuse.