

Submitted:
15 October 2026
Posted:
16 October 2026
You are already at the latest version
Abstract
Background/Objectives: Pancreatic cancer carries a five-year relative survival of 13%. Polygenic risk scores (PRS) rank inherited susceptibility across common variants. Prior syntheses pooled PRS association and discrimination, but none asked whether a PRS changes a clinical decision. We synthesized evidence on the clinical utility of PRS for pancreatic cancer risk assessment. Methods: In this PROSPERO-registered review (CRD42024511326), we searched four databases through May 11, 2026, for studies evaluating a PRS for primary pancreatic cancer risk in adults, alone or with clinical predictors. We recorded discrimination as the prerequisite for utility and organized utility across five prespecified domains: threshold-based accuracy, incremental value, calibrated absolute risk, decision-analytic output, and economic impact. We synthesized narratively and appraised risk of bias with PROBAST. Results: Forty-three studies met the inclusion and exclusion criteria, including 25 from the UK Biobank. Ten of 16 standalone discrimination estimates fell between 0.56 and 0.64. Adding PRS to a clinical model increased discrimination by at most 0.05 in general populations. Combined PRS and clinical models exceeded 0.80 only in three diabetes-focused studies. Six studies reported calibration, four reclassification, two decision-curve net benefit, none cost-effectiveness, and 20 had no translational milestone. Thirteen studies were at high risk of bias, with 11 in the analysis domain. Conclusions: Pancreatic cancer PRS discriminates modestly alone and adds most where prior risk is highest. Actionable use awaits an externally validated absolute-risk model with a prespecified threshold and a decision analysis.
Keywords:
polygenic risk score
; pancreatic cancer
; pancreatic ductal adenocarcinoma
; risk prediction
; early de-tection
; clinical utility
; new-onset diabetes
; calibration
; decision curve analysis
1. Introduction
Pancreatic cancer remains among the most lethal malignancies worldwide, with a five-year relative survival rate of 13%.[1] This poor survival figure is primarily driven by late stage diagnosis, with most patients presenting with advanced, unresectable disease, which eliminates curative resection and restricts treatment to palliative options.[1] The incidence continues to rise across high-income countries and among younger adults, with particularly notable increases among younger women.[2,3] Established risk factors include heritable predisposition, notably pathogenic variants in BRCA1/2, CDKN2A, and STK11, together with smoking, obesity, chronic pancreatitis, and diabetes.[3,4,5,6,7,8,9] High-penetrance variants, however, account for a small fraction of cases, leaving most population-level risk distributed across common variants with individually small effects. In current practice, risk stratification for pancreatic cancer primarily relies on clinical factors, family history, imaging, and testing for high-penetrance germline mutations.[7,10,11] These efforts identify the extremes of the risk distribution but miss individuals with moderate polygenic predisposition, and no approach performs well enough to support population-wide screening.[12,13]
Polygenic risk scores (PRS) aggregate many common variants identified through genome-wide association studies (GWAS) to estimate inherited susceptibility.[14] In addition, combining PRS with established clinical predictors offers a route to stratify risk among people carrying no high-penetrance mutation.[15] Recent evaluations suggest that such integration yields small but meaningful gains, whereas PRS used alone provides only modest discrimination.[16,17,18,19,20] Verras et al. meta-analyzed 27 studies and reported pooled standalone discrimination of Area Under the Receiver Operating Characteristic Curve (AUC) of 0.61 (95% confidence interval [CI], 0.58 to 0.65), rising to 0.70 (95% CI, 0.61 to 0.80) for mixed models that added clinical risk factors. The odds ratio per standard deviation reached 1.42 (95% CI, 1.30 to 1.56) in populations of European ancestry but 1.21 (95% CI, 0.77 to 1.90) in Asian populations, where the association did not reach statistical significance.[16] Wang et al. scoped 21 studies published through March 2023 and found that only seven evaluated risk factors beyond age and sex, and only three quantified the discrimination gain attributable to adding PRS to a clinical model.[17]
Recent reviews have concentrated on association and discrimination endpoints. Clinical utility depends on a different class of evidence, including calibrated absolute risk estimates, explicit thresholds that separate action from observation, and decision analytic measures demonstrating that the resulting management changes deliver net benefit at an acceptable cost.[21] Because absolute risk remains low even in enriched strata, PRS is most plausibly valuable as an enrichment layer within multistep pathways, for example, PRS combined with clinical factors, followed by biomarker triage and targeted imaging, delivered through decision support integrated into the Electronic Health Record (EHR).[22] Evidence across these steps has not been synthesized, and the literature has expanded substantially since the most recent scoping review closed its search in March 2023, including studies conducted in enriched populations, such as those with new-onset diabetes.
Whether PRS-informed risk stratification for pancreatic cancer risk prediction is ready for clinical application remains unresolved.[23] In this systematic evidence review, we synthesized evidence on the clinical utility of PRS for pancreatic cancer risk assessment across five prespecified domains: threshold based discrimination, incremental value beyond established clinical predictors, calibrated absolute risk, decision analytic outputs, and economic or downstream resource impact. We further characterized PRS construction, external validation, and transportability across ancestry groups and appraised risk of bias and applicability using the Prediction Model Risk of Bias Assessment Tool (PROBAST). Our objective was to establish the current state of evidence in each domain and specify the studies required to move PRS from association to clinical practice.
2. Materials and Methods
2.1. Protocol and Reporting
This systematic review was conducted in accordance with a published protocol (PROSPERO number: CRD42024511326) and adhered to the Preferred Reporting Items for Systematic Reviews and Meta-Analyses (PRISMA) guidelines (Supplementary Table 1).[24,25] We amended the PROSPERO record after registration to extend the search end date to May 11, 2026, so the prespecified update captured studies published after the initial search.
2.2. Eligibility Criteria
We included peer-reviewed, English-language studies published through May 11, 2026, that evaluated adults (≥18 years) and reported development, validation, or performance of PRS for primary pancreatic cancer risk prediction, either as standalone models or combined with non-genetic predictors (e.g., clinical risk factors). Studies using observational designs (cohort, case-control, cross-sectional) were eligible, as were clinical trials and validation studies (internal and/or external) when PRS was evaluated for risk prediction or intervention guidance. We excluded studies focused on pediatric populations (<18 years), simulated populations, or monogenic/syndromic pancreatic cancer. We also excluded editorials, commentaries, reviews, case reports/series, book chapters, and studies without primary data.
To maintain a clinical utility focus, we excluded prognostic models in diagnosed patients (e.g., progression/metastasis prediction) and studies that did not report outcomes relevant to clinical application (e.g., risk stratification, screening guidance, or patient-centered/decision relevant outcomes), as well as studies lacking adequate methodological detail for PRS development/validation. We distinguished redundant reporting from distinct analyses of shared data. When multiple reports described the same PRS analysis in the same cohort, we retained the most complete and most recent report and excluded the earlier duplicates. When separate reports analyzed overlapping cohorts (e.g., the UK Biobank) but addressed different predictors, outcomes, or clinical-utility questions, we retained each report as an independent study and recorded the cohort overlap in the risk of bias appraisal.
2.3. Information Sources and Search Strategy
A health sciences librarian developed and executed searches in PubMed, Embase, Cochrane Library, and Web of Science. The search combined controlled vocabulary and keywords for pancreatic cancer and polygenic/genetic risk scores. The initial search covered database inception through December 31, 2023. A prespecified update, executed with the same controlled vocabulary and keyword strategy, extended coverage from January 1, 2024, through May 11, 2026. Records from both search periods were combined and processed using a single workflow for deduplication, screening, and synthesis. Gray literature sources were screened, and reference lists of included studies were hand-searched to identify additional records. Full search strategies for both search periods are provided in Supplementary Table 2. The lead author (M.E.) and the study team members (O.B., Y.A., Y.K.) reviewed the strategy for completeness.
2.4. Study Selection
Records were imported into Covidence for deduplication, screening, and data management. Each title, abstract, and full-text was screened independently by reviewers (O.B., Y.A., Y.K.), with discrepancies resolved by consensus and adjudication by a fourth reviewer (M.E.) when needed.
2.5. Data Extraction, Synthesis, and Risk of Bias Assessment
We used the Checklist for Critical Appraisal and Data Extraction for Systematic Reviews of Prediction Modeling Studies (CHARMS) to guide standardized extraction.[26] Data were extracted in Covidence using a structured template customized for this review. The extracted data included study-level information, such as details on risk models, PRS estimation and construction methods, participant-level characteristics, intervention types, and assessed outcomes. Two reviewers extracted data from each report [independently / one extracting and one verifying] (O.B., Y.A., Y.K.), with discrepancies resolved by M.E. Study investigators were not contacted. Metrics not reported in the main text or supplement were recorded as not reported.
2.6. Clinical Utility assessment
We prespecified a clinical utility framework focused on decision relevant performance and actionability rather than association alone. For each eligible study, we abstracted the measures listed in Table 1 and organized clinical utility outcomes across five domains: (i) threshold based predictive accuracy at study defined risk thresholds; (ii) incremental value/model comparison when adding a PRS to clinical models; (iii) calibration and absolute risk characterization required for actionability; (iv) decision analytic outputs; and (v) economic and downstream impact measures. Discrimination establishes clinical validity rather than clinical utility, and we treated it as the prerequisite against which the five utility domains are read, not as evidence of actionability in itself. We therefore abstracted discrimination separately for every eligible study and report it alongside the utility domains. External validation was likewise recorded separately, as a marker of transportability rather than a utility domain.
Discrimination metrics were recorded as reported and were not converted between scales. For case-control and other binary-outcome designs, AUC and the concordance statistic are numerically identical. For time to event analyses subject to censoring, Harrell's C estimates concordance over follow-up and is not the same estimand as a cross-sectional AUC. Reported association estimates were also non-comparable across studies, spanning per-standard-deviation effects, per-allele effects, and contrasts between extreme quantiles with differing cut-points. We therefore did not display them on a common forest plot axis. Instead, we used a structured narrative synthesis supported by evidence tables and figures aligned to the framework above.
2.7. Risk of Bias and Applicability
Because no quantitative pooling was undertaken, publication bias assessments (e.g., funnel plots) were not conducted, and Grading of Recommendations Assessment, Development and Evaluation (GRADE) certainty ratings[27] were not applied. Instead, the PROBAST[28] was used to appraise the risk of bias and applicability across four domains: participants, predictors, outcome, and analysis. Two reviewers applied PROBAST to each study independently, with disagreements resolved by M.E. We rated each domain as low, high, or unclear risk of bias and assigned an overall judgment for each included study. PROBAST risk of bias and applicability judgments for each included study are summarized in Table 4.
2.8. Outcome and predictor variables
The primary outcome was pancreatic cancer risk, defined by pancreatic cancer case status or time to diagnosis as specified in each included study. The primary predictor was a pancreatic cancer PRS, evaluated either as a continuous standardized score (e.g., per 1 standard deviation [SD]) alone or in combination with clinical and demographic risk factors. Outcomes of interest included PRS association estimates and the prespecified model performance and clinical utility measures listed in Table 2 and Table 3.
2.9. Statistical Analysis and Evaluation
Given the substantial heterogeneity in PRS construction (e.g., from a small number of genome-wide-significant variants to genome-wide polygenic scores; weighted vs. unweighted), covariate sets, ancestry, validation approaches, and analytic windows, we did not perform a meta-analysis. Instead, we employed a narrative synthesis, displaying Single-Nucleotide Polymorphism (SNP) compositions and reuse across studies in Figure 2, translational milestone coverage across all included studies in Figure 3, discrimination and incremental value in Figure 4, and study and model characteristics in Table 2 and Table 3. Associations were abstracted as odds ratios (ORs) or hazard ratios (HRs) with 95% CIs. Where available, we preferentially recorded OR/HR per 1-SD increase in PRS. When studies reported quantiles (e.g., top vs. bottom quintiles or deciles), we captured those contrasts and noted the cut points used. For prospective cohorts, we recorded follow-up windows and time to event specifications. Decision analytic and economic outputs (decision curve net benefit, clinical impact curves, and cost-effectiveness summaries such as incremental Cost-Effectiveness Ratio (ICER) per Quality-Adjusted Life Year (QALY) and willingness-to-pay thresholds) were extracted when available and summarized narratively rather than quantitatively, given their dependence on local thresholds and resource assumptions. Validation and transportability were characterized as internal versus external (temporal/geographic/ancestry-external), including whether recalibration was required prior to reporting absolute risk.
3. Results
3.1. Study Selection
The PRISMA flow diagram (Figure 1) summarizes the study-selection process. We identified 874 records from databases and registers, plus 6 additional records from other sources. After removing 278 duplicates (277 via Covidence, 1 manually), 602 unique records underwent title and abstract screening. Of the screened records, 537 were excluded. Of the 65 reports sought for retrieval, 3 were not retrieved, leaving 62 full-text reports assessed for eligibility. Nineteen reports were excluded: abstract only (n = 10), repeated or duplicate publication (n = 2), review paper (n = 1), wrong outcomes (n = 3), wrong comparator (n = 1), and wrong intervention (n = 2). Accordingly, 43 studies met all inclusion criteria and were included in the final synthesis.
3.2. Study Characteristics
Table 2 reports the main characteristics of the 43 included studies, published between 2012 and 2026. Case-control designs predominated (n = 24), followed by cohort studies (n = 16) and nested case-control studies (n = 3). Study populations and data sources were heterogeneous, spanning population biobanks, cancer cohorts, and international consortia. UK Biobank was the most frequently used single data source (25 studies), including analyses focused on PRS performance alone and those integrating PRS with clinical risk factors.[18,19,20,29,30,31,32,33,34,35,36,37,38,39,40,41,42,43,44,45,46,47,48,49,50] Analytic sample sizes varied considerably, from 235 participants (103 cases and 132 controls) in a multi-ethnic Kuwaiti case-control study[51] to biobank-based analyses with hundreds of thousands of participants.[18,29,31,32,36,52,53] Several studies also used large external GWAS consortia for PRS derivation or genetic instrument construction, including datasets comprising more than 1.4 million participants.[37] Ancestry representation was limited. Thirty-four studies were conducted in European ancestry populations.[18,19,20,29,30,31,32,33,34,35,36,37,38,39,40,41,42,43,44,45,46,47,48,49,50,52,54,55,56,57,58,59,60,61] Three studies focused primarily on East Asian populations.[62,63,64] Multi-ancestry or diverse multiethnic samples were uncommon and included a U.S. multiethnic sample[65], stratified analyses within African and European ancestry groups[66], consortium-based datasets with mixed ancestry representation,[53] and a Brazilian case-control study.[67]
3.3. Model Characteristics
Model characteristics, PRS composition, covariate adjustment, and reported outcomes are summarized in Table 3. The number of genetic variants included in PRS models ranged from 4[51] to 49[20] genotyped variants after linkage disequilibrium pruning, and one study derived a genome-wide score using AnnoPred.[40] Two studies carried non-pancreatic comparator scores, an 87-variant transaminase score[48] and a 424-variant type 2 diabetes score.[49]
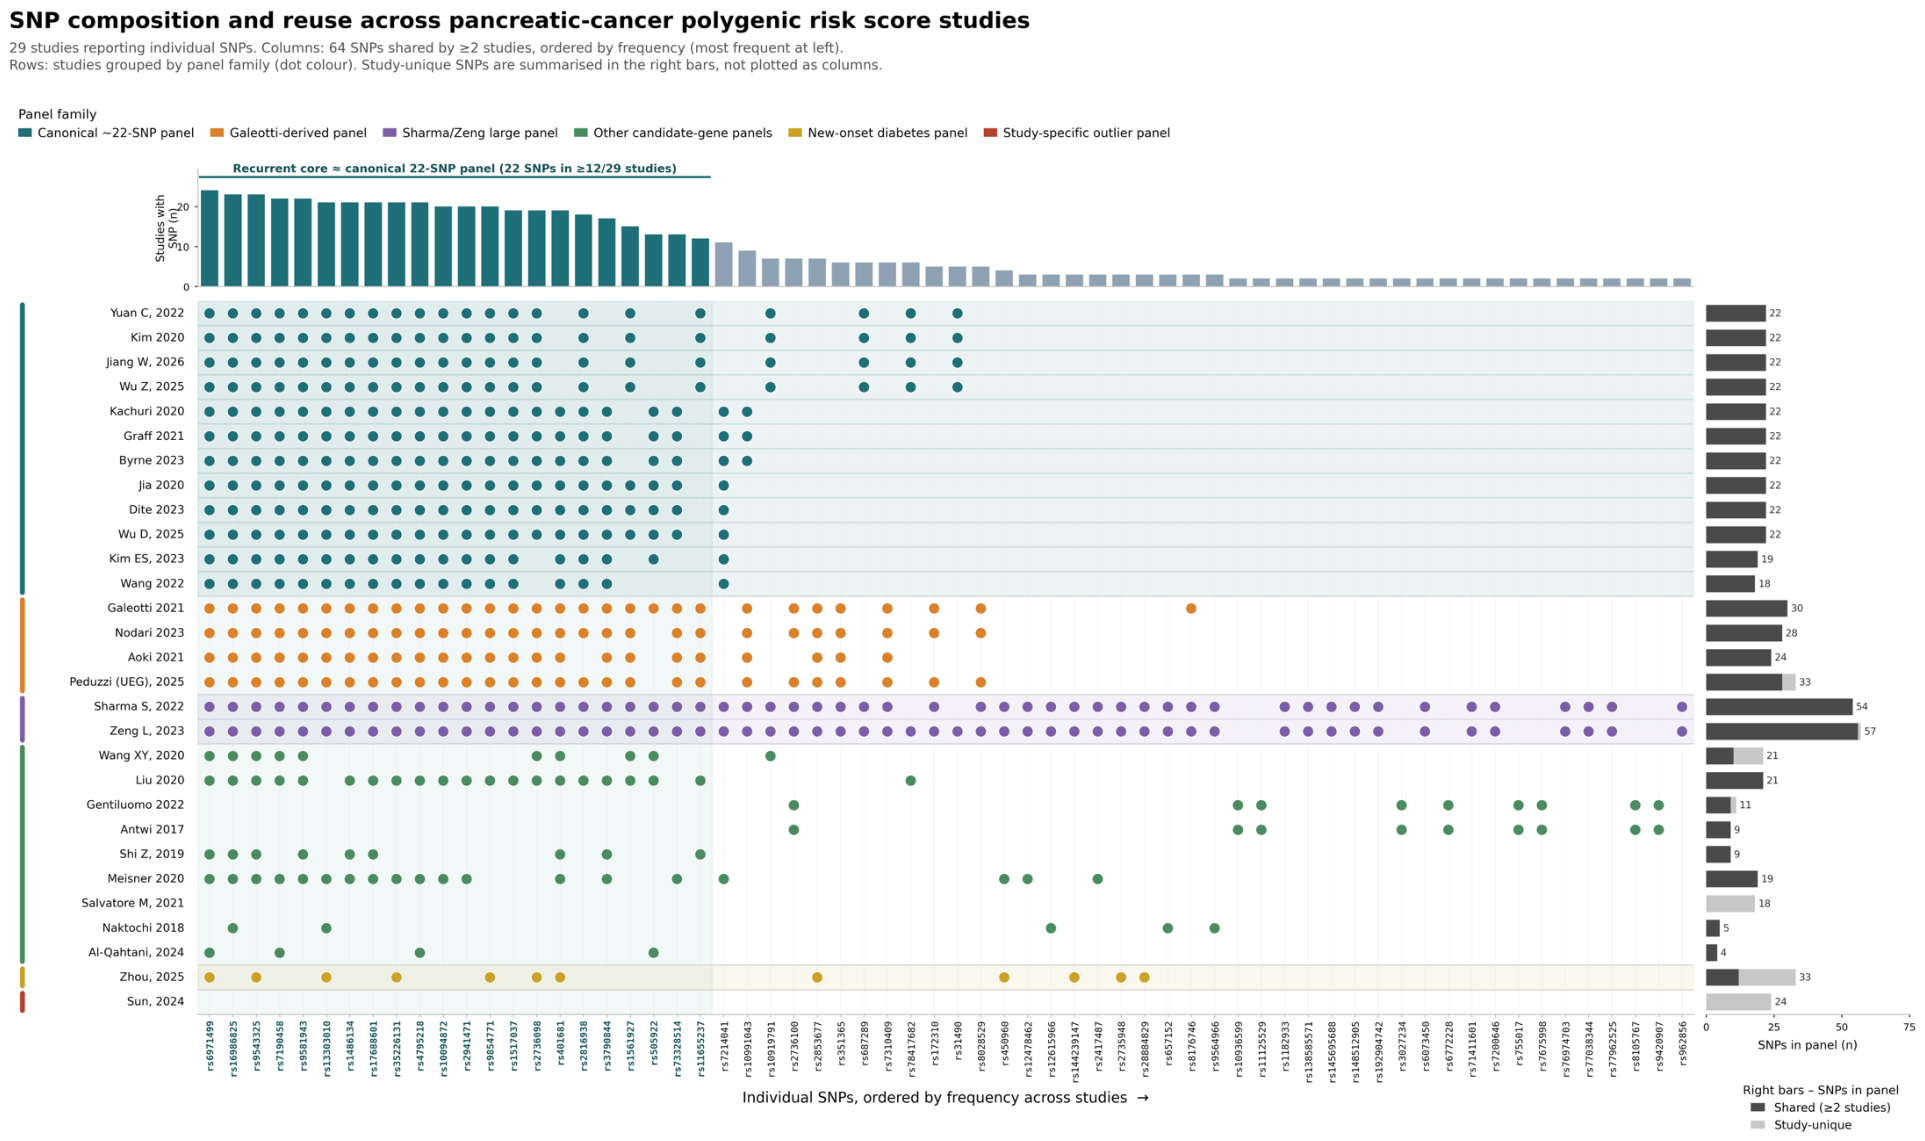
Figure 2 shows the number of times SNP(s) were used across synthesized studies, with rs6971499 recurring in 24 of the 29 studies reporting individual variants, and rs16986825 and rs9543325 in 23. Most PRSs were derived from common-variant GWAS results and analyzed either as continuous measures (i.e., often per SD increase or similar scaling) or as risk strata based on quantiles (e.g., quintiles, deciles, percentile cut points). Continuous PRS modeling appeared more commonly in cohort-based analyses reporting hazard ratios per PRS increment.[18,31,32] Extreme-strata comparisons included highest-versus-lowest quintile analyses[20,29,30] and top-versus-bottom decile analyses.[53]
Several studies evaluated approaches beyond conventional GWAS-based PRS. These included telomere-length polygenic scores ("teloscores")[55,68], transcriptome-informed or Transcriptome-Wide Association Study (TWAS) augmented models[56], cross-validation and threshold based SNP inclusion strategies[57], and models embedding PRS within broader multi-exposure or multi-cancer frameworks.[33,35,52] Clinical and environmental covariates varied across studies but most commonly included age and sex, with frequent adjustment for smoking, Body Mass Index (BMI) or anthropometrics, diabetes, family history, and pancreatitis (Table 3). A small number of studies integrated PRS into models that explicitly combined multiple domains of predictors, including biomarkers or EHR-derived risk features.[19,30,34]
Figure 2.
SNP composition and reuse across pancreatic cancer PRS studies. Rows show the 29 studies that reported individual variants, grouped by panel family. Columns show the 64 variants carried by two or more studies, ordered by frequency; the upper bars give the number of studies carrying each variant, and the bracket marks the 22 variants present in at least 12 studies. Right-hand bars give candidate variants per study before linkage disequilibrium pruning (dark, shared; light, study-unique); analytic PRS size after pruning is given in Table 3 and is smaller for Sharma 2022 (49 of 54) and Zeng 2023 (44 of 54 for PRS54). Al-Qahtani 2024 shows the four GWAS variants that entered its score. Yuan 2025 is omitted because its 87-variant transaminase score is not a pancreatic PRS.
3.4. PRS Effect Sizes
PRS associations with pancreatic cancer risk ranged from near-null to strong gradients depending on PRS construction, population, and the risk contrast used (Table 3). On the odds ratio scale, effect sizes spanned from OR = 0.55 to OR = 14.37. The lower bound reflected a referent-category contrast in one allele-count implementation[60], while the upper bound reflected a combined multifactorial score incorporating PRS plus clinical risk factors.[54] Continuous PRS associations were generally modest. Kim et al. (2020) reported ORs of 1.37 for the clinical + genetic model and 1.36 after adding biomarkers to the model. Telomere-length scores were close to null in at least one analysis (Antwi et al., 2017; multivariable-adjusted OR = 1.03). Stronger gradients emerged when comparing extreme PRS strata. For example, Ke et al. (2023) reported OR = 2.03 for the highest versus lowest PRS quintile (Q5 vs. Q1) in the UK Biobank, and Sharma et al. (2022) reported OR = 2.74 for Q5 versus Q1 in a diabetes-focused prediction context.
Elevated risk estimates were observed in selected settings and subgroups. Aoki et al. (2021) reported OR = 8.13 for Q5 versus Q1 in a Brazilian cohort, although this estimate was based on a relatively small case-control sample. In an age-stratified analysis, Yuan et al. (2022) reported OR = 6.91 for the top versus bottom 10% of PRS among individuals aged 60 years or younger (and OR = 4.12 among those older than 70 years). For early-onset pancreatic cancer, Nodari et al. (2023) reported OR = 4.93 for age 50 years or younger in Pancreatic Cancer Cohort Consortium (PanScan) plus Pancreatic Cancer Case-Control Consortium (PanC4) (and OR = 2.90 in Pancreatic Disease Research consortium [PANDoRA]), with smaller but still elevated estimates among individuals older than 50 years. In cohort-based analyses reporting hazard ratios, continuous PRS associations were generally modest (HR approximately 1.10 to 1.58), with stronger gradients for extreme strata contrasts. Zeng et al. (2023) reported HR = 1.58 for PRS modeled continuously and HR = 1.89 for the highest versus middle PRS tertile among individuals aged 60 years or younger. Kachuri et al. (2020) reported HR = 1.49 in UK Biobank. Jia et al. (2020) reported HR = 3.37 for Q5 versus Q1, with HR = 2.31 for the top 5% versus an average risk group.
3.5. Model Performance
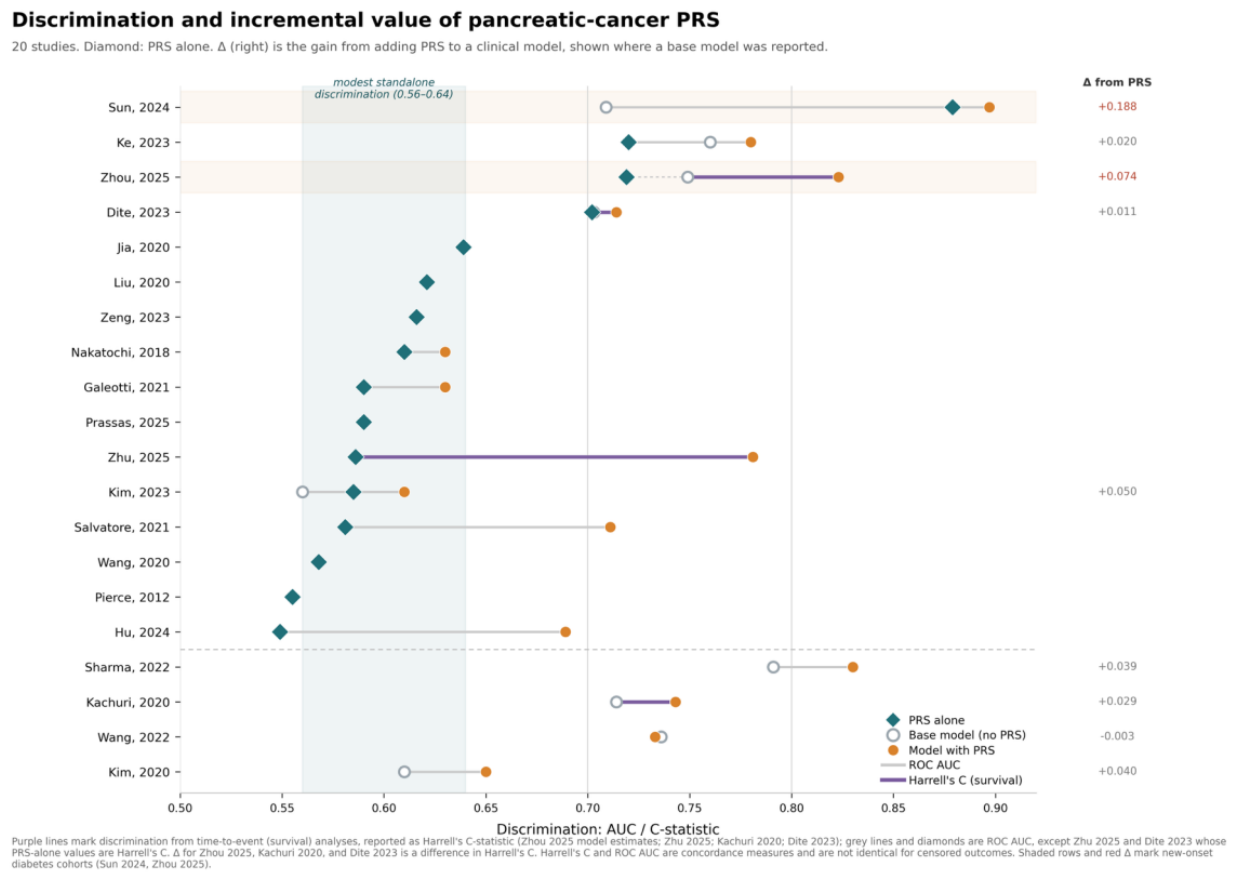
Twenty-two of the 43 studies reported discrimination, and 20 contributed interpretable model-level estimates to Figure 3. Standalone PRS discrimination clustered tightly. Ten of the 16 standalone estimates fell between 0.56 and 0.64, with the full range spanning 0.53 in the Michigan Genomics Initiative validation cohort to 0.88 in a new-onset diabetes cohort. The lowest values were reported in studies with early cross-validation approaches.[19,57] The highest standalone estimate came from Sun et al. (2024), whose genetic-only logistic regression model achieved an AUC of 0.879 (95% CI, 0.842 to 0.915) among patients with new-onset diabetes. That model was classified on 24 study-selected variants rather than applying a published weighted PRS, which sets it apart from the remaining estimates and places it well above the range reported elsewhere. Mid-range PRS-only AUC values included those from Jia et al. (2020) (AUC = 0.639) and Kim et al. (2023) (AUC = 0.58 in females and 0.59 in males).
Adding PRS to clinical predictors typically produced statistically significant but numerically modest improvements in discrimination (Figure 3). In an analysis of the UK Biobank, Kachuri et al. (2020) reported AUC increases from 0.715 (age, sex, family history, and other predictors) to 0.745 after adding PRS, with parallel C-index improvements (from 0.714 to 0.743). Similarly, adding risk factors to PRS models improved the AUC from 0.72 to 0.78 in the UK Biobank[30], and Hu et al. (2024) reported a larger gain, from 0.549 for a genome-wide PRS alone to 0.689 after adding clinical variables.[40] Kim et al. (2020) reported AUC increases from 0.61 (clinical model) to 0.67 (clinical plus genetic) and 0.69 (clinical plus genetic plus biomarker) in the 0- to 10-year follow-up window. Dite et al. (2023) reported a small gain, with a Harrell's C of 0.702 for the Jia et al. (2020) 22-SNP PRS, 0.703 for the Klein clinical score[69], and 0.714 (95% CI, 0.698 to 0.730) for the combined 10-year risk score. This amounted to a difference of 0.011 that reached significance against both components in 376,462 participants.
Zhou et al. (2025) illustrated how much the standalone estimate depends on how the score is derived. Their PRS re-derived within the new-onset diabetes setting reached AUC = 0.719 (95% CI, 0.687 to 0.751), whereas a standard pancreatic cancer PRS applied to the same cohort reached 0.611 (95% CI, 0.575 to 0.646) and a type 2 diabetes PRS reached 0.592 (95% CI, 0.555 to 0.628).[49] Sharma et al. (2022) reported an increase in AUC from 0.791 (clinical risk model) to 0.83 (combined PRS plus clinical risk model; p = 0.0002). Zeng et al. (2023) reported a PRS-only AUC of 0.616 and an age-specific AUC of 0.623 among individuals aged 60 years or younger when PRS was stratified by age. In several multi-domain models, non-genetic predictors drove most of the discrimination, with PRS contributing only incremental change. This pattern was evident in an ancestry-stratified evaluation in which adding PRS yielded no AUC gain over a baseline model including principal components, age, and sex (Wang et al., 2022; African ancestry ΔAUC = 0, p = 0.75; European ancestry ΔAUC = -0.003, p = 0.44).
3.6. Further Assessment of PRS Performance and Clinical Utility Measures
Thirteen studies reported at least one measure beyond discrimination that informs clinical utility or model reliability (Table 3; Figure 4), including threshold based predictive accuracy metrics, calibration or goodness-of-fit outputs, reclassification metrics, and error-based measures. In a diabetes-stratified prediction setting, Sharma et al. (2022) reported sensitivity of 31.8% overall (range 28.9% to 41.4% across diabetes strata), specificity of 81.2% overall (up to 91.4% in new-onset diabetes), and Positive Predictive Value (PPV) ranging from 11.9% (no diabetes) to 86.7% (new-onset diabetes) when focusing on the highest PRS quintile. For reclassification, Kachuri et al. (2020) reported a Net Reclassification Improvement (NRI) of 0.228 (95% CI, 0.174 to 0.284) when PRS was added to a comprehensive conventional risk factor model. Zhou et al. (2025) reported a continuous NRI of 0.319 (95% CI, 0.207 to 0.436) in cases and 0.309 (95% CI, 0.293 to 0.325) in controls with an Integrated Discrimination Improvement (IDI) of 0.021 (95% CI, 0.015 to 0.028)[49], and Dite et al. (2023) reported an NRI of 0.066 (95% CI, 0.035 to 0.098) for the combined score against the PRS and 0.060 (95% CI, 0.027 to 0.094) against the clinical score, using prespecified 10-year risk thresholds of 0.36% and 0.64%.[50]
Figure 3.
Discrimination and incremental value of pancreatic cancer PRS in the 20 studies reporting interpretable model-level estimates. Diamonds, PRS alone; open circles, base model without PRS; filled circles, model with PRS. The shaded band marks 0.56 to 0.64, where 10 of 16 standalone estimates fell. Grey lines connect ROC AUC estimates; purple lines connect Harrell's C estimates from time-to-event analyses (Zhou 2025 model estimates; Zhu 2025; Kachuri 2020; Dite 2023). Δ is the gain from adding PRS to a base model where one was reported; for Zhou 2025, Kachuri 2020, and Dite 2023 it is a difference in Harrell's C. Shaded rows and red Δ mark new-onset diabetes cohorts (Sun 2024, Zhou 2025). Zhou 2025 plots the re-derived new-onset-diabetes PRS; its standard pancreatic cancer PRS (0.611) and type 2 diabetes PRS (0.592) are reported in the text. Sun 2024's standalone estimate derives from a logistic model on 24 study-selected variants. Wang 2022 values come from a secondary analysis with 46 cases per ancestry stratum. Peduzzi 2025 (UEG and DLD) are omitted because they report only combined machine-learning AUCs.
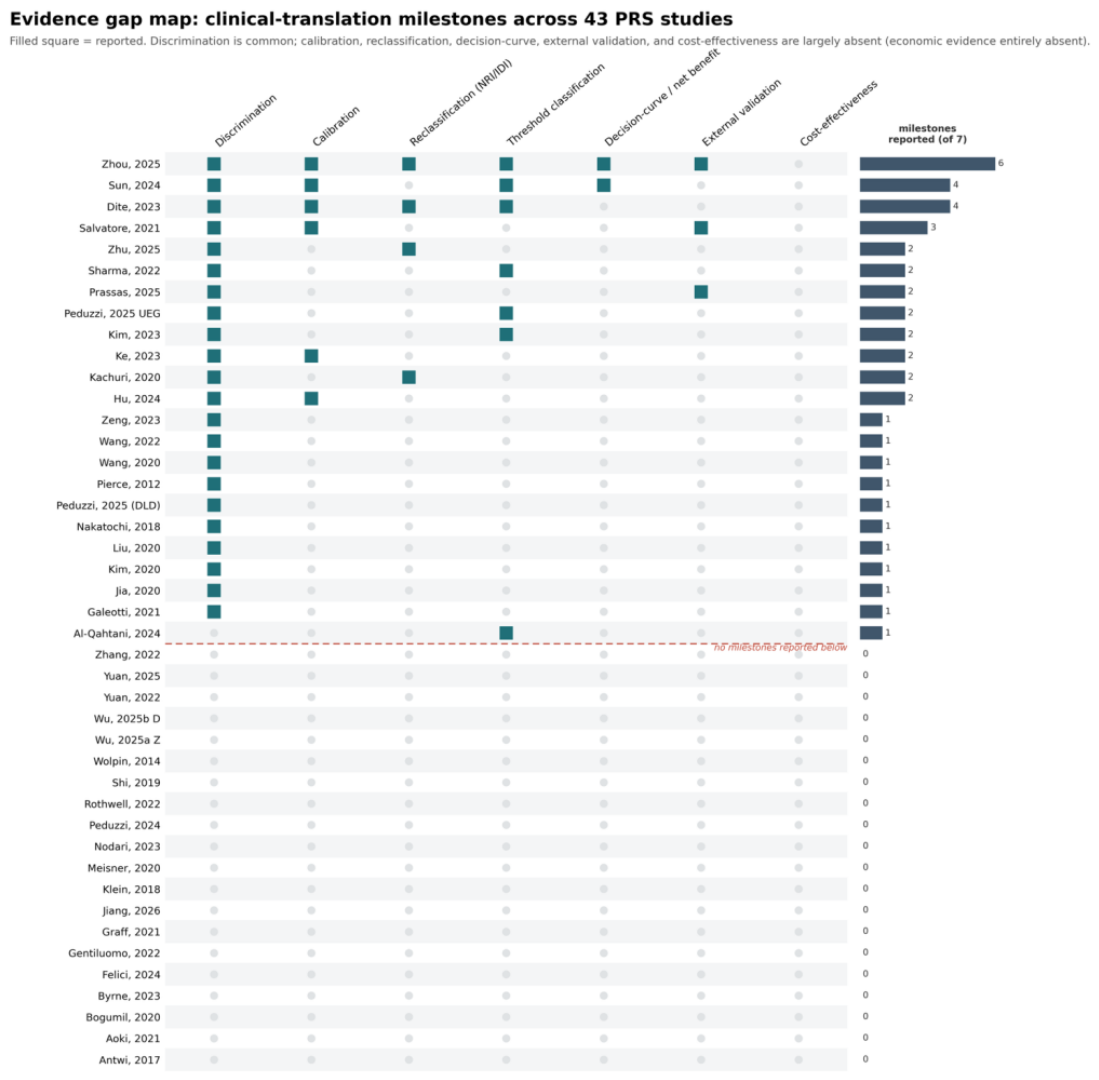
Calibration was reported in six studies.[19,30,40,45,49,50] Sun et al. (2024) reported adequate calibration for the logistic regression model and for combined models in four of five algorithms, and Zhou et al. (2025) reported a calibration slope of 0.994 (95% CI, 0.885 to 1.102) with calibration-in-the-large of -0.006 (95% CI, -0.115 to 0.102). Dite et al. (2023) reported a calibration slope of 0.952 (95% CI, 0.865 to 1.039) with slight overestimation in the calibration in the large (-0.089; 95% CI, -0.156 to -0.021), consistent with the cohort's lower than expected incidence. Salvatore et al. (2021) reported Brier scores of 0.22370 for PRS-only models and 0.21610 for combined models (phenotype risk score [PheRS] plus PRS plus covariates/risk factors) in the Michigan Genomics Initiative cohort. The Hosmer-Lemeshow test suggested poor calibration for PRS-only models (p < 0.05) but improved calibration in combined models. In a UK Biobank nested case-control analysis, Ke et al. (2023) reported a Hosmer-Lemeshow test p of 0.1543, consistent with an acceptable fit of the evaluated model specification. Model-fit comparisons were also occasionally reported. Nakatochi et al. (2018) reported Akaike Information Criterion (AIC) values to compare model fit in a Japanese risk model (AIC 1764 for risk factors plus PRS versus 1796 for PRS-only). Pierce et al. (2012) reported low variance explained (R² of 0.005 to 0.018) and limited incremental improvements in sensitivity and specificity of the fitted PRS models relative to baseline prediction.
In a screening-adjacent context, Kim et al. (2023) evaluated PRS-stratified PPV for multi-cancer early detection (MCED) tests, reporting PPV differences by PRS percentile and age. For the Galleri test, PPV was 70.3% for high-risk females aged 75 years at the 90th to 95th percentile, compared with 48.2% for low-risk females at the 5th to 10th percentile, a 22.1 percentage-point difference. Evidence on gene-environment interaction was limited. Rothwell et al. (2022) reported that positive associations between metabolic syndrome and pancreatic cancer risk were maintained across PRS strata, with no evidence of interaction (p = 0.69).
Two studies reported decision curve analyses, both in new-onset diabetes cohorts.[45,49] Sun et al. (2024) went further and anchored two explicit action thresholds, reporting that a 1.28% cut-off restricts definitive testing to 13% of the cohort while capturing 76% of cases, and that a 5.26% cut-off restricts testing to 2% while capturing nearly half. Three studies reported external validation.[19,44,49] Calibrated absolute risk anchored to explicit action thresholds appeared in two studies, Sun et al. (2024) and Dite et al. (2023). Kim et al. (2020) reported absolute risk by percentile, with cumulative risk to age 80 of 0.4% at the 10th percentile and 3.8% at the 99th, but derived it from population incidence rates without calibration or an action threshold.[34] Dite et al. (2023) went further, computing competing mortality-adjusted 10-year absolute risk and anchoring two thresholds to existing screening criteria. At the high-risk threshold, the combined score identified 17% of cases, compared with 11% for the clinical score, and the number needed to screen fell from 1 in 442 unselected adults to 1 in 145. No study reported a cost-effectiveness analysis of a PRS-guided pancreatic cancer screening pathway.
Figure 3.
Evidence gap map of clinical-translation milestones across the 43 included studies. Filled squares indicate a reported milestone; rows are ordered by milestone count. Twenty-three studies reported at least one milestone and 20 reported none. No study reported a cost-effectiveness analysis.
3.7. Quality Assessment
Risk of bias was assessed for all 43 studies (Table 4). Overall risk of bias was low in 16 studies, high in 13, and unclear in 14. Most adverse judgments came from the analysis domain, which was rated low in 20 studies, high in 11, and unclear in 12. That domain alone drove 11 of the 13 high overall ratings, with the remaining two studies, Byrne et al. (2023) and Nodari et al. (2023), rated high for participant selection.[32,61] Internal validation and correction for optimism were often absent. Calibration was rarely reported, and several studies tested a score in the same sample that had discovered its variants. The smallest studies fit more predictors than their event counts could support. In contrast, the participants, predictors, and outcome domains were rated low in 36, 41, and 39 studies. No study was rated high risk on predictors or outcomes. Applicability raised no high concern in any domain. Thirty-eight studies were judged to be of low concern overall, and the five judged unclear had uncertain population representativeness or incomplete reporting of predictors rather than any mismatch with the review question.[18,32,51,64,66] As such, the weakness in this evidence base lies in how the models were built and tested, not in the populations they were built for.

Table 4.
PROBAST Risk of Bias and Applicability Judgments for the 43 Included Studies.
| Author, Year | Risk of Bias | Applicability | Overall | ||||||
| 1. Participants | 2. Predictors | 3. Outcome | 4. Analysis | 1. Participants | 2. Predictors | 3. Outcome | Risk of Bias | Applicability | |
| Al-Qahtani, 2024 | ? | + | + | - | ? | + | + | - | ? |
| Antwi, 2017 | + | + | + | + | + | + | + | + | + |
| Aoki, 2021 | + | + | + | - | + | + | + | - | + |
| Bogumil, 2020 | + | + | ? | + | + | + | + | ? | + |
| Byrne, 2023 | - | + | + | ? | ? | + | + | - | ? |
| Dite, 2023 | + | + | + | + | + | + | + | + | + |
| Felici, 2024 | + | + | + | - | + | + | + | - | + |
| Galeotti, 2021 | + | + | + | + | + | + | + | + | + |
| Gentiluomo, 2022 | ? | + | ? | - | + | + | + | - | + |
| Graff, 2021 | + | + | + | + | + | + | + | + | + |
| Hu, 2024 | + | + | + | ? | + | + | + | ? | + |
| Jia, 2020 | + | + | + | + | + | + | + | + | + |
| Jiang, 2026 | + | + | + | ? | + | + | + | ? | + |
| Kachuri, 2020 | + | ? | + | + | + | ? | + | ? | ? |
| Ke, 2023 | + | ? | + | + | + | + | + | ? | + |
| Kim, 2023 | + | + | + | ? | + | + | + | ? | + |
| Kim, 2020 | + | + | + | ? | + | + | + | ? | + |
| Klein, 2018 | + | + | + | - | + | + | + | - | + |
| Liu, 2020 | + | + | + | + | + | + | + | + | + |
| Meisner, 2020 | + | + | + | - | + | + | + | - | + |
| Nakatochi, 2018 | + | + | + | + | + | + | + | + | + |
| Nodari, 2023 | - | + | + | + | + | + | + | - | + |
| Peduzzi, 2024 | + | + | + | + | + | + | + | + | + |
| Peduzzi (DLD), 2025 | + | + | + | - | + | + | + | - | + |
| Peduzzi (UEG), 2025 | + | + | + | + | + | + | + | + | + |
| Pierce, 2012 | + | + | + | + | + | + | + | + | + |
| Prassas, 2025 | + | + | + | ? | + | + | + | ? | + |
| Rothwell, 2022 | + | + | + | + | + | + | + | + | + |
| Salvatore, 2021 | + | + | + | ? | + | + | + | ? | + |
| Sharma, 2022 | + | + | + | + | + | + | + | + | + |
| Shi, 2019 | - | + | + | - | + | + | + | - | + |
| Sun, 2024 | + | + | + | ? | + | + | + | ? | + |
| Wang, 2020 | + | + | + | + | + | + | + | + | + |
| Wang, 2022 | - | + | ? | - | ? | + | + | - | ? |
| Wolpin, 2014 | + | + | + | - | + | + | + | - | + |
| Wu D, 2025 | + | + | + | ? | + | + | + | ? | + |
| Wu Z, 2025 | + | + | + | - | + | + | + | - | + |
| Yuan, 2022 | + | + | + | + | + | + | + | + | + |
| Yuan, 2025 | + | + | + | ? | + | + | + | ? | + |
| Zeng, 2023 | + | + | + | ? | + | + | + | ? | + |
| Zhou, 2025 | + | + | + | + | + | + | + | + | + |
| Zhu, 2025 | ? | + | ? | ? | ? | + | ? | ? | ? |
| Zhang, 2022 | + | + | + | + | + | + | + | + | + |
4. Discussion
In this systematic evidence review of 43 studies, pancreatic cancer PRS showed reproducible but modest standalone discrimination. While PRS added a small increment to clinical models in general populations, it reached clinically interpretable performance only within enriched populations. Nine studies reported a base model. In the seven general-population cohorts, adding PRS shifted discrimination by at most 0.05, and by nothing at all in the one ancestry-stratified analysis.[66] The two new-onset diabetes cohorts gained 0.074 and 0.188.[45,49] Combined models exceeded 0.80 in three studies, two restricted to new-onset diabetes[45,49] and one built around diabetes as a predictor.[20] This overall pattern is consistent with a recent meta-analysis showing modest pooled standalone discrimination and stronger performance for mixed models, and with a scoping review concluding that relatively few studies have directly evaluated whether PRS improves prediction beyond routine clinical data.[16,17]
Our results add a more explicit translational synthesis to this literature. Rather than stopping at association and discrimination, we evaluated calibration, reclassification, threshold based performance, absolute risk estimation, and implementation readiness. Against those domains, the evidence thinned quickly, with 22 of 43 studies reporting discrimination, 6 calibration, 4 reclassification, 7 an explicit threshold, 2 a decision curve, and none cost-effectiveness, and 20 reported no translational milestone at all. Viewed through that lens, the strongest signal is not that pancreatic cancer PRS is ready for standalone clinical use, but that it may function as an enrichment layer within broader multivariable and multistep risk pathways, particularly in clinically enriched settings such as new-onset diabetes.[18,20,45,49,50]
Standalone PRS discrimination was generally modest in our review, with 10 of the 16 standalone estimates falling between 0.56 and 0.64. These results were comparable to the pooled AUC of 0.61 (95% CI, 0.58 to 0.65) reported by Verras et al. (2025).[16] This level of discrimination suggests that PRS can rank-order inherited susceptibility, particularly when comparing extreme strata, but remains insufficient for independent clinical use in a low-incidence cancer where absolute risk remains small for most individuals. The apparent validity of PRS-only models is further constrained by inconsistent calibration reporting, heterogeneous derivation strategies, and limited validation outside European ancestry datasets. Several studies observed stronger gradients when PRS was analyzed across quantiles or in younger or otherwise enriched subgroups. Outside those settings, the canonical 22-SNP panel and its derivatives produced 0.56 to 0.64 in every cohort that tested them, and 12 of the 29 studies reporting individual variants applied that panel or a subset of it. In turn, part of what the field calls reproducibility is one score re-measured many times. However, these findings do not alter the broader conclusion that PRS alone is better understood as a marker of relative genetic susceptibility rather than as a clinically actionable risk prediction tool.[29,31,57,66]
The strongest evidence for clinical utility emerges when PRS is combined with non-genetic predictors rather than evaluated in isolation. Combined models incorporating PRS with clinical and environmental covariates consistently outperformed PRS-only models and usually exceeded routine clinical models by a modest but nontrivial margin. In the UK Biobank, Kachuri et al. (2020) reported an increase in AUC from 0.715 to 0.745 after adding a 22-SNP PRS to conventional risk factors, with an NRI of 0.228.[18] Sharma et al. (2022) reported that adding PRS to a diabetes-focused clinical model increased AUC from 0.791 to 0.83.[20] Those findings were similar to those of Dite et al. (2023), whose combined 10-year risk score raised Harrell's C from 0.703 to 0.714 in 376,462 participants, with an NRI of 0.060 against the clinical score.[50] Zhou et al. (2025) demonstrated that in patients with new-onset diabetes, a PRS-integrated model achieved strong discrimination, good calibration, significant reclassification improvement, and clinically relevant PPV in the highest-risk stratum.[49] Sun et al. (2024) reported the largest increment in the review, from 0.709 to 0.897, also among patients with new-onset diabetes.[45] At the same time, these gains were incremental rather than transformative in most studies. The added value of PRS depended on the strength of the baseline model, the availability of clinically informative non-genetic predictors, and the risk enrichment of the target population. As such, PRS is unlikely to serve as a standalone screening tool but can improve multivariable risk prediction when embedded in integrated models tailored to specific clinical pathways.
Clinical utility remains the least developed aspect of the pancreatic cancer PRS literature. Although several studies reported favorable discrimination or reclassification, only three translated these gains into calibrated absolute risk estimates, explicit action thresholds, or decision analytic evidence that could support clinical implementation. Most pancreatic cancer PRS studies still do not answer the question that matters for clinical practice: at what level of predicted risk should surveillance begin, and which downstream pathway would that estimate trigger? The available evidence suggests that threshold based utility is context dependent and most convincing in clinically enriched settings rather than in the general population. As such, pancreatic cancer PRS cannot yet be considered clinically actionable based on association or AUC improvement alone. Before a PRS-informed pathway can be implemented, the field will need externally validated and well-calibrated absolute risk models, prespecified thresholds linked to surveillance decisions, and formal decision analytic and cost-effectiveness evaluations to establish net benefit under realistic resource constraints. The only general-population absolute-risk model to date was developed and funded by a commercial genetic testing company, which does not invalidate it but does mean its external validation should come from an independent group.[50]
A further challenge is the substantial heterogeneity in how pancreatic cancer PRS has been constructed, reported, and validated. Across the included studies, PRS differed markedly in variant count, weighting strategy, standardization, covariate handling, endpoint definition, and validation approach, ranging from small-allele-count scores and telomere-based scores to broader, weighted GWAS-derived models and hybrid approaches that incorporated biomarkers or EHR-derived data. This heterogeneity limits direct comparability across studies and makes reported performance metrics difficult to interpret. The problem is compounded by sparse reporting of calibration and absolute risk outputs. These gaps matter because strong relative-risk gradients, by themselves, do not establish transportable or actionable risk thresholds. The evidence base is also heavily Eurocentric. Thirty-four studies were European, three East Asian, and five multi-ancestry. The one ancestry stratified evaluation found no discrimination gain from PRS in African-ancestry participants[66], and Verras et al. reported a per-SD odds ratio in Asian populations that crossed the null.[16] Performance summarized here therefore overstates what a European-derived score will deliver elsewhere. Taken together, these findings underscore the need for more standardized PRS reporting and for more rigorous evaluation of prediction models.[70]
This review has several strengths. We conducted this review using a preregistered protocol, followed PRISMA guidance, applied a prespecified clinical-utility framework, and used structured risk of bias and applicability assessments to evaluate a heterogeneous literature on prediction models. By focusing on discrimination, calibration, reclassification, threshold-based performance, and implementation-relevant measures, our review extends prior pancreatic cancer PRS syntheses beyond association alone and provides a more translational appraisal of clinical readiness. These strengths should be interpreted alongside important limitations. We did not perform a meta-analysis because of substantial heterogeneity in PRS construction, covariate selection, outcome definition, validation strategy, and reporting of performance metrics. The evidence was dominated by case-control designs and European ancestry populations, with limited external validation, sparse calibration, and inconsistent reporting of absolute risk and of decision analytic or economic endpoints. Thirteen studies were rated at high risk of bias, 11 in the analysis domain, most often for absent optimism correction, absent calibration, or evaluation of a score in the sample that discovered its variants. Each of those deficits biases reported discrimination upward, so the modest estimates summarized here are, if anything, optimistic. Applicability raised no high concern in any domain, so the weakness of this literature is how the models were built and tested, not whom they were built for.
5. Conclusions
In conclusion, pancreatic cancer PRS demonstrates a reproducible association with pancreatic cancer risk and modest standalone discrimination. The strongest evidence supports PRS as an incremental component of multivariable models rather than as a standalone screening tool. However, direct clinical-utility evidence remains sparse. Two studies tie calibrated absolute risk to explicit action thresholds[45,50], and two report decision-analytic net benefit.[45,49] All three studies are in the UK Biobank, and two are restricted to new-onset diabetes. None of the reviewed studies reported cost-effectiveness. Three study types would resolve what this review could not. External validation of the Dite and Zhou models in a non-UK cohort, with recalibration to local incidence, would establish transportability. A decision-analytic evaluation of the full pathway from PRS-informed risk to imaging, including false-positive burden and cost per case detected, would establish net benefit. A prospective or emulated-trial comparison of PRS-informed against clinical-factor-only referral among patients with new-onset diabetes would establish whether incremental discrimination becomes earlier-stage diagnosis.
Supplementary Materials
The following supporting information can be downloaded at the website of this paper posted on Preprints.org, Table S1: PRISMA checklist; Table S2: Search Strategy.
Author Contributions
Conceptualization M.I.E., D.C., E.D.P.; methodology, M.I.E., Y.A., Y.K., O.B.; software, M.I.E.; validation, M.I.E.; formal analysis, M.I.E., Y.A., Y.K., O.B.; investigation, M.I.E., Y.K., O.B. and Y.A.; data curation, M.I.E., Y.K., O.B. and Y.A.; writing-original draft preparation, M.I.E., Y.A., Y.K., O.B.; writing-review and editing, M.I.E., Y.K., O.B., Y.A., D.C., S.F., F.T., A.A., A.M. and E.D.P.; visualization, M.I.E., Y.A., Y.K., O.B.; supervision, M.I.E.; project administration, M.I.E.; funding acquisition, M.I.E. All authors have read and agreed to the published version of the manuscript.
Funding
This study was funded by the National Cancer Institute Supplemental Award P30 CA016058-47S1 and internal funding from The Ohio State University Comprehensive Cancer Center.
Institutional Review Board Statement
Not applicable. This systematic review synthesized data from published studies and did not involve new data collection from human participants.
Informed Consent Statement
Not applicable.
Data Availability Statement
Acknowledgments
We thank the Ohio State University Health Sciences Library for assistance with developing and executing the search strategy. In this review, an AI assistant (Claude, Anthropic) was used to cross-check extracted values against source articles. In addition, Claude was used to edit and refine the manuscript. The authors have reviewed and edited the output and take full responsibility for the content of this publication.
Conflicts of Interest
Dr. Elsaid receives research funding from AstraZeneca, which is unrelated to the current work. EDP would like to note that she has grants to the University from: Merck Foundation, Genentech, Pfizer, Guardant Health, AstraZeneca. She is an Advisory Board Member with Merck, Novartis, and GSK. None of these are related to this work.
Abbreviations
The following abbreviations are used in this manuscript:
| AIC | Akaike information criterion |
| AUC | Area under the receiver operating characteristic curve |
| BIC | Bayesian information criterion |
| BMI | Body mass index |
| CHARMS | Checklist for Critical Appraisal and Data Extraction for Systematic Reviews of Prediction Modeling Studies |
| CI | Confidence interval |
| EHR | Electronic health record |
| GRADE | Grading of Recommendations Assessment, Development and Evaluation |
| GWAS | Genome-wide association study |
| HR | Hazard ratio |
| ICER | Incremental cost-effectiveness ratio |
| ICI | Integrated calibration index |
| IDI | Integrated discrimination improvement |
| LR | Likelihood ratio |
| MCED | Multi-cancer early detection |
| NNS | Number needed to screen |
| NPV | Negative predictive value |
| NRI | Net reclassification improvement |
| OR | Odds ratio |
| PanC4 | Pancreatic Cancer Case-Control Consortium |
| PANDoRA | Pancreatic Disease Research consortium |
| PanScan | Pancreatic Cancer Cohort Consortium |
| PheRS | Phenotype risk score |
| PPV | Positive predictive value |
| PRISMA | Preferred Reporting Items for Systematic Reviews and Meta-Analyses |
| PROBAST | Prediction model Risk Of Bias Assessment Tool |
| PROSPERO | International Prospective Register of Systematic Reviews |
| PRS | Polygenic risk score |
| QALY | Quality-adjusted life year |
| SD | Standard deviation |
| SNP | Single-nucleotide polymorphism |
| TWAS | Transcriptome-wide association study |
References
- Siegel, R. L.; Kratzer, T. B.; Wagle, N. S.; Sung, H.; Jemal, A. Cancer statistics, 2026," (in eng). CA Cancer J. Clin. 2026, vol. 76(no. 1), e70043. [Google Scholar] [CrossRef] [PubMed]
- Li, X.; Zhang, Y.; Yan, Z.; Jiang, W.; Rui, S. Global, regional and national burden of pancreatic cancer and its attributable risk factors from 2019 to 2021, with projection to 2044. Front Oncol. 2024, vol. 14, 1521788. [Google Scholar] [CrossRef] [PubMed]
- Zottl, J.; Sebesta, C. G.; Tomosel, E.; Sebesta, M. C.; Sebesta, C. Unraveling the Burden of Pancreatic Cancer in the 21st Century: Trends in Incidence, Mortality, Survival, and Key Contributing Factors. Cancers 2025, vol. 17(no. 10). [Google Scholar] [CrossRef] [PubMed]
- Petersen, G. M. Familial pancreatic cancer. Semin Oncol. 2016, vol. 43(no. 5), 548–553. [Google Scholar] [CrossRef] [PubMed]
- Solomon, S.; Das, S.; Brand, R.; Whitcomb, D. C. Inherited pancreatic cancer syndromes. Cancer J. 2012, vol. 18(no. 6), 485–91. [Google Scholar] [CrossRef] [PubMed]
- Vincent; Herman, J.; Schulick, R.; Hruban, R. H.; Goggins, M. Pancreatic cancer," (in eng). Lancet 2011, vol. 378(no. 9791), 607–20. [Google Scholar] [CrossRef] [PubMed]
- Klein, P. Pancreatic cancer epidemiology: understanding the role of lifestyle and inherited risk factors. Nat. Rev. Gastroenterol. Hepatol. 2021, vol. 18(no. 7), 493–502. [Google Scholar] [CrossRef] [PubMed]
- Hu, J. X.; et al. Pancreatic cancer: A review of epidemiology, trend, and risk factors. World J. Gastroenterol. 2021, vol. 27(no. 27), 4298–4321. [Google Scholar] [CrossRef] [PubMed]
- Yuan, et al. Diabetes, Weight Change, and Pancreatic Cancer Risk. JAMA Oncol. 2020, vol. 6(no. 10), e202948. [Google Scholar] [CrossRef] [PubMed]
- Farr, K. P.; Moses, D.; Haghighi, K. S.; Phillips, P. A.; Hillenbrand, C. M.; Chua, B. H. Imaging Modalities for Early Detection of Pancreatic Cancer: Current State and Future Research Opportunities. Cancers 2022, vol. 14(no. 10). [Google Scholar] [CrossRef] [PubMed]
- Biller, L. H.; Wolpin, B. M.; Goggins, M. Inherited Pancreatic Cancer Syndromes and High-Risk Screening. Surg. Oncol. Clin. N Am. 2021, vol. 30(no. 4), 773–786. [Google Scholar] [CrossRef] [PubMed]
- Singhi, D.; Koay, E. J.; Chari, S. T.; Maitra, A. Early Detection of Pancreatic Cancer: Opportunities and Challenges. Gastroenterology 2019, vol. 156(no. 7), 2024–2040. [Google Scholar] [CrossRef] [PubMed]
- Mohamed, G.; Munir, M.; Rai, A.; Gaddam, S. Pancreatic Cancer: Screening and Early Detection. Gastroenterol. Clin. North Am. 2025, vol. 54(no. 1), 205–221. [Google Scholar] [CrossRef] [PubMed]
- Wang, Y.; Zhu, M.; Ma, H.; Shen, H. Polygenic risk scores: the future of cancer risk prediction, screening, and precision prevention. Med. Rev. (2021) 2021, vol. 1(no. 2), 129–149. [Google Scholar] [CrossRef] [PubMed]
- Lewis, M.; Vassos, E. Polygenic risk scores: from research tools to clinical instruments. Genome Med. 2020, vol. 12(no. 1), 44. [Google Scholar] [CrossRef] [PubMed]
- Verras, G. I.; Hamady, Z. Z.; Collins, A.; Tapper, W. Utility of Polygenic Risk Scores (PRSs) in Predicting Pancreatic Cancer: A Systematic Review and Meta-Analysis of Common-Variant and Mixed Scores with Insights into Rare Variant Analysis," (in eng). Cancers 2025, vol. 17(no. 2). [Google Scholar] [CrossRef] [PubMed]
- Wang, L.; Grimshaw, A. A.; Mezzacappa, C.; Rahimi Larki, N.; Yang, Y. X.; Justice, A. C. Do Polygenic Risk Scores Add to Clinical Data in Predicting Pancreatic Cancer? A Scoping Review," (in eng). Cancer Epidemiol. Biomark. Prev. 2023, vol. 32(no. 11), 1490–1497. [Google Scholar] [CrossRef] [PubMed]
- Kachuri, L.; et al. Pan-cancer analysis demonstrates that integrating polygenic risk scores with modifiable risk factors improves risk prediction. Nat. Commun. 2020, vol. 11(no. 1), 6084. [Google Scholar] [CrossRef] [PubMed]
- Salvatore, M.; et al. Phenotype risk scores (PheRS) for pancreatic cancer using time-stamped electronic health record data: Discovery and validation in two large biobanks. J. BioMed Inf. 2021, vol. 113, 103652. [Google Scholar] [CrossRef] [PubMed]
- Sharma, S.; Tapper, W. J.; Collins, A.; Hamady, Z. Z. R. Predicting Pancreatic Cancer in the UK Biobank Cohort Using Polygenic Risk Scores and Diabetes Mellitus," (in eng). Gastroenterology 2022, vol. 162(no. 6), 1665–1674.e2. [Google Scholar] [CrossRef] [PubMed]
- Badrick, T.; Bowling, F. Clinical utility - Information about the usefulness of tests. Clin. Biochem (in eng). 2023, vol. 121-122, 110656. [Google Scholar] [CrossRef] [PubMed]
- Lewis; Jiménez, L.; Chan, K. K.; Horton, S.; Wong, W. W. L. A Systematic Review of Cost-Effectiveness Studies on Pancreatic Cancer Screening," (in eng). Curr. Oncol. 2025, vol. 32(no. 4). [Google Scholar] [CrossRef] [PubMed]
- Ayoub; McHugh, J.; Hayward, J.; Rafi, I.; Qureshi, N. Polygenic risk scores: improving the prediction of future disease or added complexity? Br. J. Gen. Pract. 2022, vol. 72(no. 721), 396–398. [Google Scholar] [CrossRef] [PubMed]
- Moher, et al. Preferred reporting items for systematic review and meta-analysis protocols (PRISMA-P) 2015 statement. Syst. Rev. (in eng). 2015, vol. 4(no. 1), 1. [Google Scholar] [CrossRef] [PubMed]
- Page, M. J.; et al. The PRISMA 2020 statement: an updated guideline for reporting systematic reviews. BMJ (in eng). 2021, vol. 372, n71. [Google Scholar] [CrossRef] [PubMed]
- Moons, K. G.; et al. Critical appraisal and data extraction for systematic reviews of prediction modelling studies: the CHARMS checklist. PLoS Med. 2014, vol. 11(no. 10), e1001744. [Google Scholar]
- Prasad, M. Introduction to the GRADE tool for rating certainty in evidence and recommendations. Clin. Epidemiol. Glob. Health vol. 25, 101484, 2024/01/01/ 2024. [CrossRef]
- Wolff, R. F.; et al. PROBAST: A Tool to Assess the Risk of Bias and Applicability of Prediction Model Studies. Ann. Intern Med. 2019, vol. 170(no. 1), 51–58. [Google Scholar] [CrossRef] [PubMed]
- Jia, et al. Evaluating the Utility of Polygenic Risk Scores in Identifying High-Risk Individuals for Eight Common Cancers. JNCI Cancer Spectr. 2020, vol. 4(no. 3), pkaa021. [Google Scholar] [CrossRef] [PubMed]
- Ke, T. M.; Lophatananon, A.; Muir, K. R. An Integrative Pancreatic Cancer Risk Prediction Model in the UK Biobank. Biomedicines 2023, vol. 11(no. 12). [Google Scholar] [CrossRef] [PubMed]
- Zeng, L.; Wu, Z.; Yang, J.; Zhou, Y.; Chen, R. Association of genetic risk and lifestyle with pancreatic cancer and their age dependency: a large prospective cohort study in the UK Biobank. BMC Med. 2023, vol. 21(no. 1), 489. [Google Scholar] [CrossRef] [PubMed]
- Byrne, S.; Boyle, T.; Ahmed, M.; Lee, S. H.; Benyamin, B.; Hypponen, E. Lifestyle, genetic risk and incidence of cancer: a prospective cohort study of 13 cancer types. Int. J. Epidemiol. 2023, vol. 52(no. 3), 817–826. [Google Scholar] [CrossRef] [PubMed]
- Graff, R. E.; et al. Cross-cancer evaluation of polygenic risk scores for 16 cancer types in two large cohorts. Nat. Commun. 2021, vol. 12(no. 1), 970. [Google Scholar] [CrossRef] [PubMed]
- Kim, J.; et al. Genetic and Circulating Biomarker Data Improve Risk Prediction for Pancreatic Cancer in the General Population. Cancer Epidemiol. Biomark. Prev. 2020, vol. 29(no. 5), 999–1008. [Google Scholar] [CrossRef] [PubMed]
- Peduzzi, et al. Analysis of exposome and genetic variability suggests stress as a major contributor for development of pancreatic ductal adenocarcinoma. Dig. Liver Dis. 2024, vol. 56(no. 6), 1054–1063. [Google Scholar] [CrossRef] [PubMed]
- Rothwell, J. A.; et al. Metabolic Syndrome and Risk of Gastrointestinal Cancers: An Investigation Using Large-scale Molecular Data. Clin. Gastroenterol. Hepatol. 2022, vol. 20(no. 6), e1338–e1352. [Google Scholar] [CrossRef] [PubMed]
- Zhang, et al. Fasting Insulin and Risk of Overall and 14 Site-Specific Cancers: Evidence From Genetic Data. Front Oncol. 2022, vol. 12, 863340. [Google Scholar] [CrossRef] [PubMed]
- Meisner, et al. Combined Utility of 25 Disease and Risk Factor Polygenic Risk Scores for Stratifying Risk of All-Cause Mortality," (in eng). Am. J. Hum. Genet 2020, vol. 107(no. 3), 418–431. [Google Scholar] [CrossRef] [PubMed]
- Felici, et al. The local environment and germline genetic variation predict cancer risk in the UK Biobank prospective cohort," (in eng). Environ. Res. 2024, vol. 241, 117562. [Google Scholar] [CrossRef] [PubMed]
- Hu; Ye, Y.; Zhou, G.; Zhao, H. Using clinical and genetic risk factors for risk prediction of 8 cancers in the UK Biobank," (in eng). JNCI Cancer Spectr. 2024, vol. 8(no. 2). [Google Scholar] [CrossRef] [PubMed]
- Jiang, W.; et al. , "Plasma fatty acids, genetic risk, and incident pancreatic cancer: A prospective cohort study," (in eng). Pancreatology 2026, vol. 26(no. 1), 95–102. [Google Scholar] [CrossRef] [PubMed]
- Peduzzi, G.; Felici, A.; Pellungrini, R.; Campa, D. Explainable machine learning identifies a polygenic risk score as a key predictor of pancreatic cancer risk in the UK Biobank," (in eng). Dig. Liver Dis. 2025, vol. 57(no. 4), 915–922. [Google Scholar] [CrossRef] [PubMed]
- Peduzzi, G.; et al. , "Evaluating Sex Disparity in Pancreatic Ductal Adenocarcinoma Risk in the UK Biobank Cohort," (in eng). United Eur. Gastroenterol. J. 2025, vol. 13(no. 9), 1787–1802. [Google Scholar] [CrossRef] [PubMed]
- Prassas, et al. "Estimating Cancer Penetrance in Carriers of BRCA2 Pathogenic Variants Using Cancer-Specific Polygenic Scores," (in eng). Cancer Med. 2025, vol. 14(no. 11), e70990. [Google Scholar] [CrossRef] [PubMed]
- Sun, Y.; et al. Predicting Pancreatic Cancer in New-Onset Diabetes Cohort Using a Novel Model With Integrated Clinical and Genetic Indicators: A Large-Scale Prospective Cohort Study," (in eng). Cancer Med. 2024, vol. 13(no. 21), e70388. [Google Scholar] [CrossRef] [PubMed]
- Wu, et al. Risk assessment of digestive cancers with the modified EAT-Lancet diet pattern: a prospective cohort study based on UK Biobank," (in eng). BMC Gastroenterol. 2025, vol. 26(no. 1), 60. [Google Scholar] [CrossRef] [PubMed]
- Wu, Z.; Zeng, L.; Fang, Z.; Yuan, Y.; Zhou, Y.; Chen, R. Life's Essential 8, genetic susceptibility, and risk of incident pancreatic cancer: A prospective cohort study," (in eng). Int. J. Cancer 2025, vol. 156(no. 3), 566–574. [Google Scholar] [CrossRef] [PubMed]
- Yuan, Y.; et al. Liver diseases, transaminases, and hepatobiliary-pancreatic cancer risk: a cohort and Mendelian randomisation study using data from UK Biobank," (in eng). BMJ Open Gastroenterol. 2025, vol. 12(no. 1). [Google Scholar] [CrossRef] [PubMed]
- Zhou, Y.; Wu, Z.; Zeng, L.; Chen, R. Combining genetic and non-genetic factors to predict the risk of pancreatic cancer in patients with new-onset diabetes mellitus," (in eng). BMC Med. 2025, vol. 23(no. 1), 224. [Google Scholar] [CrossRef] [PubMed]
- Dite, G. S.; Spaeth, E.; Wong, C. K.; Murphy, N. M.; Allman, R. Predicting 10-Year Risk of Pancreatic Cancer Using a Combined Genetic and Clinical Model," (in eng). Gastro Hep Adv. 2023, vol. 2(no. 7), 979–989. [Google Scholar] [CrossRef] [PubMed]
- Al-Qahtani; Al-Ali, A.; John, B.; Kapila, K.; Al-Temaimi, R. Analysis of Pancreatic Cancer Genetic Risk Factors in a Multi-Ethnic Population Sample," (in eng). World J. Oncol. 2024, vol. 15(no. 5), 792–800. [Google Scholar] [CrossRef] [PubMed]
- Kim, S.; Scharpf, R. B.; Garcia-Closas, M.; Visvanathan, K.; Velculescu, V. E.; Chatterjee, N. Potential utility of risk stratification for multicancer screening with liquid biopsy tests. npj Precis Oncol. 2023, vol. 7(no. 1), 39. [Google Scholar] [CrossRef] [PubMed]
- Yuan, et al. The age-dependent association of risk factors with pancreatic cancer. Ann. Oncol. 2022, vol. 33(no. 7), 693–701. [Google Scholar] [CrossRef] [PubMed]
- Galeotti, A.; et al. Polygenic and multifactorial scores for pancreatic ductal adenocarcinoma risk prediction. J. Med. Genet 2021, vol. 58(no. 6), 369–377. [Google Scholar] [CrossRef] [PubMed]
- Gentiluomo, M.; et al. Genetically Determined Telomere Length Is Associated with Pancreatic Neuroendocrine Neoplasms Onset. Neuroendocrinology 2022, vol. 112(no. 12), 1168–1176. [Google Scholar] [CrossRef] [PubMed]
- Liu, et al. A Transcriptome-Wide Association Study Identifies Candidate Susceptibility Genes for Pancreatic Cancer Risk. Cancer Res. 2020, vol. 80(no. 20), 4346–4354. [Google Scholar] [CrossRef] [PubMed]
- Pierce, L.; Tong, L.; Kraft, P.; Ahsan, H. Unidentified genetic variants influence pancreatic cancer risk: an analysis of polygenic susceptibility in the PanScan study. Genet Epidemiol. 2012, vol. 36(no. 5), 517–24. [Google Scholar] [CrossRef] [PubMed]
- Shi, Z.; et al. Systematic evaluation of cancer-specific genetic risk score for 11 types of cancer in The Cancer Genome Atlas and Electronic Medical Records and Genomics cohorts. Cancer Med. 2019, vol. 8(no. 6), 3196–3205. [Google Scholar] [CrossRef] [PubMed]
- Klein, P.; et al. Genome-wide meta-analysis identifies five new susceptibility loci for pancreatic cancer," (in eng). Nat. Commun. 2018, vol. 9(no. 1), 556. [Google Scholar] [CrossRef] [PubMed]
- Wolpin, M.; et al. Genome-wide association study identifies multiple susceptibility loci for pancreatic cancer," (in eng). Nat. Genet 2014, vol. 46(no. 9), 994–1000. [Google Scholar] [CrossRef] [PubMed]
- Nodari, Y.; et al. Genetic and non-genetic risk factors for early-onset pancreatic cancer. Dig. Liver Dis. 2023, vol. 55(no. 10), 1417–1425. [Google Scholar] [CrossRef] [PubMed]
- Nakatochi, M.; et al. Prediction model for pancreatic cancer risk in the general Japanese population. PLoS ONE 2018, vol. 13(no. 9), e0203386. [Google Scholar] [CrossRef] [PubMed]
- Wang, X. Y.; et al. Single-nucleotide polymorphisms based genetic risk score in the prediction of pancreatic cancer risk. World J. Gastroenterol. 2020, vol. 26(no. 22), 3076–3086. [Google Scholar] [CrossRef] [PubMed]
- Zhu, M.; et al. "Polygenic risk scores for pan-cancer risk prediction in the Chinese population: A population-based cohort study based on the China Kadoorie Biobank," (in eng). PLoS Med. 2025, vol. 22(no. 2), e1004534. [Google Scholar] [CrossRef] [PubMed]
- Bogumil, et al. Replication and Genetic Risk Score Analysis for Pancreatic Cancer in a Diverse Multiethnic Population. Cancer Epidemiol. Biomark. Prev. 2020, vol. 29(no. 12), 2686–2692. [Google Scholar] [CrossRef] [PubMed]
- Wang, L.; et al. Performance of polygenic risk scores for cancer prediction in a racially diverse academic biobank," (in eng). Genet Med. 2022, vol. 24(no. 3), 601–609. [Google Scholar] [CrossRef] [PubMed]
- Aoki, M. N.; et al. Susceptibility loci for pancreatic cancer in the Brazilian population. BMC Med. Genom. 2021, vol. 14(no. 1), 111. [Google Scholar] [CrossRef] [PubMed]
- Antwi, S. O.; et al. Genetically Predicted Telomere Length is not Associated with Pancreatic Cancer Risk. Cancer Epidemiol. Biomark. Prev. 2017, vol. 26(no. 6), 971–974. [Google Scholar] [CrossRef] [PubMed]
- Klein, P.; et al. An absolute risk model to identify individuals at elevated risk for pancreatic cancer in the general population," (in eng). PLoS ONE 2013, vol. 8(no. 9), e72311. [Google Scholar] [CrossRef] [PubMed]
- Wand, H.; et al. Improving reporting standards for polygenic scores in risk prediction studies," (in eng). Nature 2021, vol. 591(no. 7849), 211–219. [Google Scholar] [CrossRef] [PubMed]
Figure 1.
PRISMA flowchart of the study selection process.
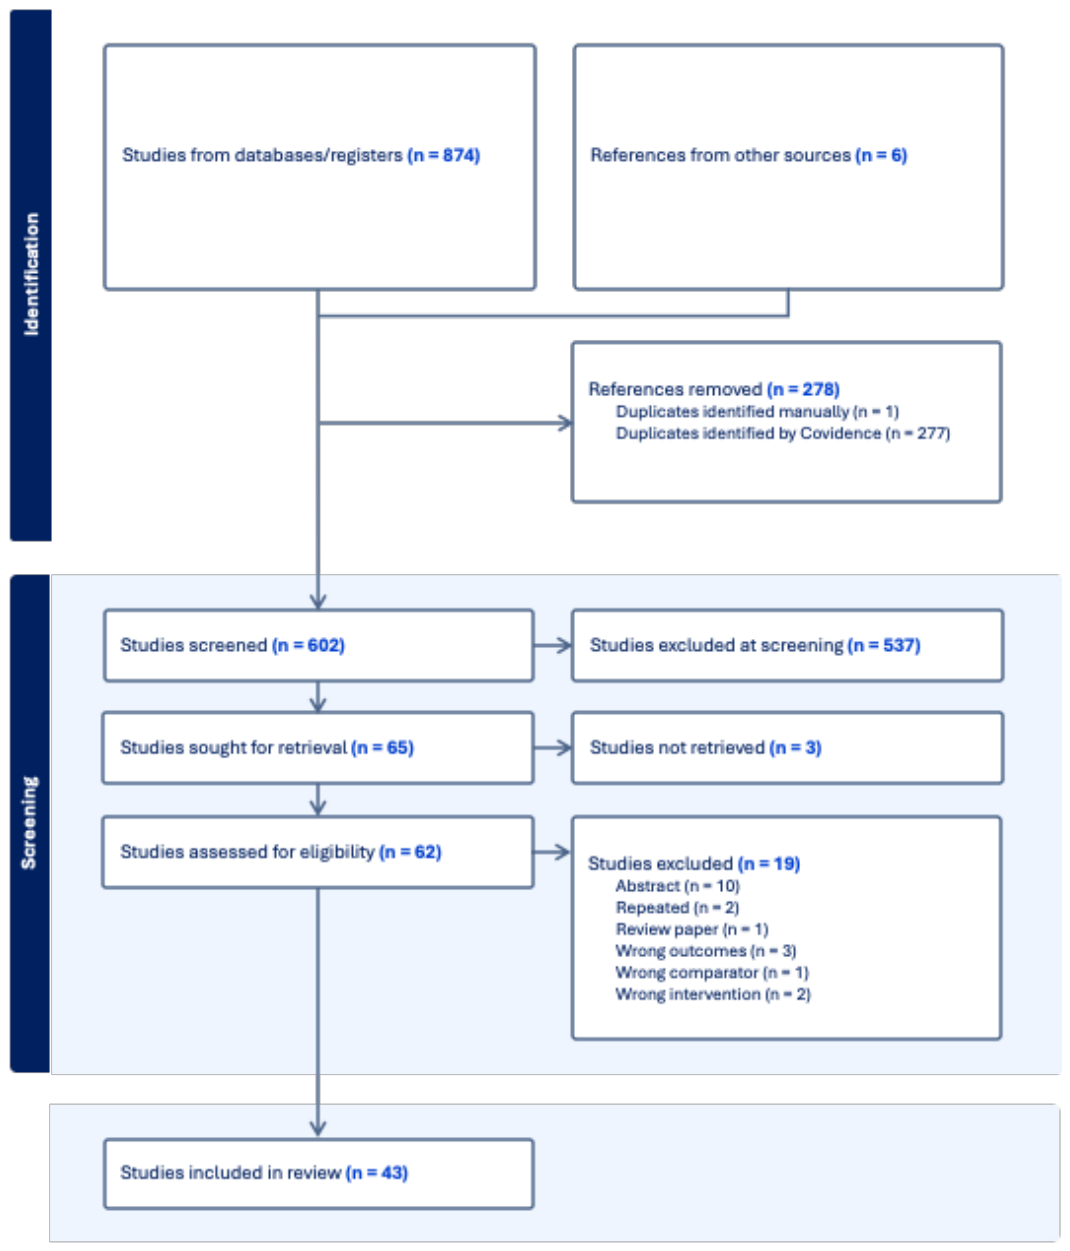
Table 1.
Proposed Measures for Assessing the Performance and Clinical Utility of Polygenic Risk Scores for Pancreatic Risk Prediction.
Table 1.
Proposed Measures for Assessing the Performance and Clinical Utility of Polygenic Risk Scores for Pancreatic Risk Prediction.
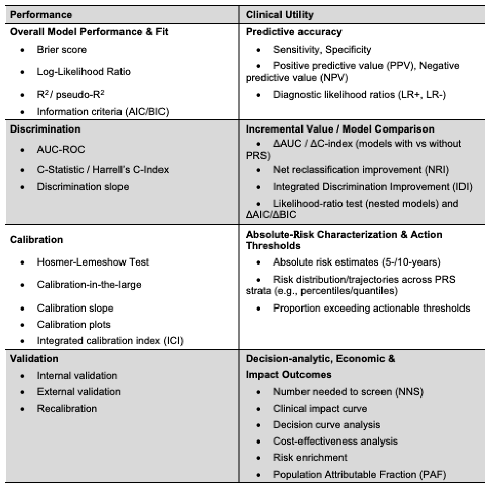 |
Table 2.
Characteristics of Studies Included in the Systematic Review.
| Author, Year | Aim/Objective | Study Design | Data Source | Number of study participants | Ancestry | Study Period | Participant Follow-up Time |
| Al-Qahtani, 2024 | To assess 10 candidate pancreatic cancer genetic variants (four GWAS-identified SNPs, two vitamin D receptor variants, four PRSS1 variants) for association with PDAC risk in a multi-ethnic Kuwaiti population, and to evaluate unweighted and weighted polygenic risk scores | Case-control | Archival formalin-fixed paraffin-embedded fine-needle aspirate cell blocks (PDAC cases) and laboratory biobank DNA (healthy controls) | 103 PDAC cases and 132 healthy controls | Multi-ethnic; cases 47.6% Kuwaiti, 52.4% non-Kuwaiti, predominantly West-Asian | 2016–2023 (specimen collection) | Not Reported |
| Antwi, 2017 | To assess the association between genetically inferred leukocyte telomere length, derived from telomere-related variants, and risk of pancreatic ductal adenocarcinoma. | Case-control | Mayo Clinic pancreatic cancer patient registry | 1,500 cases and 1,499 controls | Not Reported | 2000-2016 | NA |
| Aoki, 2021 | To evaluate 25 GWAS-identified SNPs and construct polygenic risk scores to assess genetic susceptibility to pancreatic adenocarcinoma in a Brazilian population. | Case-control | Academic Biobank of Research on Cancer | 78 cases and 256 controls | European, African, Asian | 2018-2019 | NA |
| Bogumil, 2020 | To replicate 31 GWAS-identified pancreatic cancer susceptibility variants and evaluate the predictive value of a polygenic risk score across multiple ethnic groups in the U.S. | Case-control | Multiethnic Cohort (MEC); Southern Community Cohort Study (SCCS) |
691 cases and 13,778 controls | MEC: African Americans, Japanese Americans, Latinos, Native Hawaiians, and Whites; SCCS: African Americans and Whites |
MEC: 1993-1996; SCCS: 2002- |
NA |
| Byrne, 2023 | To assess whether adherence to lifestyle recommendations modifies cancer risk across 13 cancer types, including pancreatic cancer, and to evaluate interactions with polygenic risk scores, | Cohort | UK Biobank | 195,822 Total study population 451 incident pancreatic cancer cases |
European | Baseline 2006-2010 with follow-up for incident cancers through linkage to national cancer registries until 2015–2019, depending on region | Median: 10.2 years |
| Dite, 2023 | To validate a combined 10-year absolute risk model integrating the Jia et al. 22-SNP PRS with clinical risk model for identifying asymptomatic adults at increased pancreatic cancer risk | Cohort | UK Biobank | 376,462 total (202,215 women; 174,247 men); 851 incident cases (399 women; 452 men) | European | Baseline 2006 to 2009; follow-up censored at 10 years or 31 July 2019 | 10-year window; mean 5.9 years (SD 2.9) to diagnosis in affected participants, 9.7 years (SD 1.0) in unaffected |
| Felici, 2024 | To evaluate gene-environment interactions between local environmental exposures and germline genetic variation, including a pancreas-specific PGS, on risk across 17 cancers including pancreatic ductal adenocarcinoma | Case-control | UK Biobank | 816 PDAC cases (390 female, 426 male) and 302,645 shared controls (from 355,915 individuals across 17 cancers) | European | See Byrne 2023 | NA |
| Galeotti, 2021 | To develop and validate polygenic risk scores for pancreatic ductal adenocarcinoma using 30 GWAS-identified SNPs and to explore multifactorial scores incorporating genetic and epidemiologic risk factors | Case-control | PANcreatic Disease ReseArch (PANDoRA) Consortium Validation set: Pancreatic Cancer Cohort Consortium (PanScan I–III), Pancreatic Cancer Case-Control Consortium (PanC4) |
PANDoRA consortium; 839 PDAC cases and 2,040 controls |
European | PANDoRA consortium recruitment across nine European countries (established 2013, exact years not specified); validation datasets from PanScan I–III and PanC4 GWAS (2007–2016) | NA |
| Gentiluomo, 2022 | To assess whether genetically determined telomere length, estimated via a polygenic “teloscore,” is associated with risk of pancreatic neuroendocrine neoplasms (PanNEN) | Case-control | PANcreatic Disease ReseArch (PANDoRA) Consortium | 291 cases and 1,686 controls | European | See Galeotti 2021 | NA |
| Graff, 2021 | To evaluate polygenic risk score (PRS)-specific pleiotropy across 16 cancer types and identify cross-cancer associations using two large cohorts | Case-control | GERA, UK Biobank | 665 cases, 410,354 controls | European | GERA: 2008-2011; UK Biobank: See Bryne 2023 |
NA |
| Hu, 2024 | To develop integrated risk-prediction models combining cancer-specific polygenic risk scores with clinical risk factors selected from 733 baseline UK Biobank traits, comparing standalone, clinical-only, and combined models across 8 cancers including pancreatic cancer | Cohort | UK Biobank | 409,532 total analytic population; 1,402 incident pancreatic cancer cases (407,388 controls in the pancreatic model) | European | See Byrne 2023 | Not reported |
| Jia, 2020 | To evaluate the utility of PRS in identifying high-risk individuals for eight common cancers | Cohort | UK Biobank | 400,812 Total population 432 cases |
European | See Byrne 2023 | Median: 5.8 years |
| Jiang, 2026 | To evaluate the association between plasma fatty acids and incident pancreatic cancer, and to assess interactions between plasma fatty acids and genetic risk (PRS) for pancreatic cancer | Cohort | UK Biobank | 249,165 Total population (main analysis); 233,535 with genotyping in the PRS/genetic-risk analysis; 776 incident pancreatic cancer cases | European | See Byrne 2023 (follow-up to November 10, 2021) | Median: 12.8 years |
| Kachuri, 2020 | To quantify the added predictive value of integrating cancer-specific PRS with family history and modifiable risk factors for 16 cancers | Cohort | UK Biobank | 413,753 Total population 493 cases |
European | See Byrne 2023 | Not Reported |
| Ke, 2023 | To build an integrative pancreatic cancer risk prediction model in the UK Biobank using lifestyle-, genetic-, medical history-related variables | Nested case-control | UK Biobank | 960 cases and 257,348 controls | European | See Byrne 2023 | Until December 5, 2022 |
| Kim, 2020 | To develop and evaluate absolute risk models for pancreatic cancer using clinical, genetic, and circulating biomarker data | Nested case-control | Cases: medical record review and tumor registry data; Controls: HPFS, NHS, PHS I, WHI; Absolute risk estimation: SEER 17, U.S. Mortality Data | 500 cases and 1,091 matched controls | European | Case: 1984-2010; Controls: HPFS (1986-), NHS (1976-), PHS I (1995-), WHI (1994-1998); SEER: 2001-2005; Mortality Data: 2007 | Full follow-up (maximum 26 years between data/blood collection and case diagnosis), 10-year follow-up |
| Kim, 2023 | To evaluate the utility of pan-cancer risk scores (PCRSs) defined by BMI, smoking, family history, and cancer-specific PRSs for non-invasive multicancer early detection liquid biopsy tests | Cohort | UK Biobank, USCS, NHGRI-EBI GWAS and PRS Catalogues | 249,037 Total population (133,830 females and 115,207 males) | European | See Byrne 2023 | 10-year follow up |
| Klein, 2018 | To identify new susceptibility loci for pancreatic cancer through genome-wide meta-analysis | Case-control | PanScan I-II, PanC4, PANDoRA | 3,933 cases and 3,651 controls (only used PanC4 for calculating PRS) | Caucasian | 2006-early 2010s | NA |
| Liu, 2020 | To perform a transcriptome-wide association study to investigate associations between genetically predicted gene expression in normal pancreas tissue and pancreatic cancer risk | Case-control | PanScan, PanC4, GTEx (v8) | 8,275 cases and 6,723 controls | European | Not explicitly mentioned | NA |
| Meisner, 2020 | To evaluate the combined utility of 25 disease and risk factor PRSs for stratifying risk of all-cause mortality | Cohort | UK Biobank | 337,138 participants: 181,027 women, 156,111 men | European | See Byrne 2023 | Mean follow-up: 8.8 years for women, 8.7 years for men |
| Nakatochi, 2018 | To replicate the associations of GWAS-identified SNPs with pancreatic cancer and develop a risk model for identifying high-risk individuals for pancreatic cancer in Japanese population | Case-control | Recruited from five hospitals in Japan and HERPACC | 664 cases and 664 controls | East Asian | Recruited from 2010-2014 | NA |
| Nodari, 2023 | To identify genetic and non-genetic risk factors specific to early-onset pancreatic cancer (EOPC) | Case-control | PanScan I-III, PanC4, PANDoRa | 912 cases and 10,222 controls | European | See Galeotti 2021 | NA |
| Peduzzi, 2024 | To analyze the interaction between exposome and known genetic susceptibility loci via PRS in relation to PDAC risk | Case-control | UK Biobank | 816 cases (390 females, 426 males) and 302,645 controls (161,049 females, 141,596 males) | European | See Byrne 2023 | NA |
| Peduzzi, 2025 UEG | To examine the role of hormone exposure and reproductive factors in males and females in PDAC susceptibility, and to evaluate their interaction with a polygenic risk score using epidemiological methods and machine learning | Case-control | UK Biobank | 816 cases (390 females, 426 males) and 302,645 controls (161,049 females, 141,596 males) | European | See Byrne 2023 | NA |
| Peduzzi, 2025 (DLD) | To develop an interpretable PDAC risk prediction model using 56 exposome variables and a 33-SNP polygenic risk score, comparing five machine-learning algorithms and two explainable AI methods | Case-control | UK Biobank | 816 cases (390 females, 426 males) and 302,645 controls (161,049 females, 141,596 males) | European | See Byrne 2023 | NA |
| Pierce, 2012 | To analyze unidentified genetic variants' influence on pancreatic cancer risk through PRS cross-validation method and power-replication approach | Case-control | PanScan-I and PanScan-II | 2,857 cases and 2,967 controls | European | Not explicitly mentioned | NA |
| Prassas, 2025 | To assess the spectrum of BRCA2-associated cancers and estimate the penetrance of BRCA2 pathogenic variants for these cancers, both independently and jointly with cancer-specific polygenic scores | Cohort | UK Biobank | 453,541 Total population (1,629 BRCA2 pathogenic-variant carriers); pancreatic cancer: 20 cases in carriers and 1,711 cases in non-carriers | European | See Byrne 2023 (registry access to June 12, 2023) | Not Reported (age used as the timescale; follow-up to June 12, 2023) |
| Rothwell, 2022 | To investigate the associations between metabolic syndrome and gastrointestinal cancer risk and perform stratified analyses using PRS for colorectal and pancreatic cancers | Cohort | UK Biobank | 366,016 Total population 4,238 incident gastrointestinal cancer cases |
European | See Byrne 2023 | Median: 7.1 years |
| Salvatore, 2021 | To combine and contrast a novel, time-restricted summary risk score, called a phenotype risk score (PheRS), with PRS at identifying high-risk individuals for having pancreatic cancer | Case-control | MGI (Discovery), UK Biobank (validation) | 1,088 cases and 430,570 controls (both cohorts) | European | UK Biobank - 2006-2010; MGI ongoing | Median: MGI - 4.44 years (cases), 5.42 years (controls); UK Biobank - 7 years |
| Sharma, 2022 | To compare performance of five PRS models in an independent cohort to determine if they can discriminate between new-onset diabetes mellitus (NODM) and long-standing DM patients with PDAC | Case-control | UK Biobank | 1,042 cases and 10,420 controls | European | See Byrne 2023 | Median: 109 months |
| Shi, 2019 | To test 11 cancer-specific genetic risk scores (GRSs) for association with the respective cancer type for the first time in TCGA and eMERGE cohorts | Case-control | TCGA, eMERGE | 163 cases and 13,427 controls | European | Not explicitly mentioned | NA |
| Sun, 2024 | To develop and internally validate a machine-learning model integrating clinical predictors and a 24-SNP genetic component to predict incident pancreatic cancer within a new-onset diabetes cohort | Cohort | UK Biobank | 12,735 NODM cohort; 100 pancreatic cancer-associated new-onset diabetes (PCAND) cases and 12,635 cancer-free T2DM controls | European | See Byrne 2023 | Not reported as a single median; follow-up from registration to PC diagnosis, death, or censoring (February 29, 2020) |
| Wang, 2020 | To evaluate the association between GRS and PDAC in the Chinese population | Case-control | Cases: Dept of Pancreatic Surgery in Huashan Hospital, Controls: a community population in East China | 254 cases and 1,200 controls | East Asian | Recruited Mar 2013-Aug 2014 | NA |
| Wang, 2022 | To evaluate the performance of PRSs for predicting 15 cancer types in patients of genetically-determined African and European ancestry | Case-control | Penn Medicine BioBank (PMBB) | European: 46 cases, 6,383 controls; African: 46 cases, 5,701 controls | European and African | Recruited 2004-2020 | NA |
| Wolpin, 2014 | To perform a multistage GWAS to identify susceptibility loci for pancreatic cancer | Case-control | PanScan I-III | 7,683 cases, 14,397 controls | European | Not explicitly mentioned | NA |
| Wu, 2025a Z | To assess the independent, joint, and interactive associations of the Life's Essential 8 cardiovascular health score and a 22-SNP polygenic risk score with incident pancreatic cancer | Cohort | UK Biobank | 234,102 Total population; 905 incident pancreatic cancer cases | European | See Byrne 2023 | Median: 13.62 years (IQR 12.92-14.29) |
| Wu, 2025b D | To modify the EAT-Lancet diet score into cancer-specific versions and evaluate their association with the risk of seven digestive cancers, including pancreatic cancer, with subgroup analyses by polygenic risk score | Cohort | UK Biobank | 111,785 Total population (62,313 females, 49,472 males); 325 incident pancreatic cancer cases | European | See Byrne 2023 (follow-up to October 13, 2022) | Median: 13.4 years (4,882 days); person-time accrued from a 3-year landmark |
| Yuan, 2022 | To investigate age-specific associations and attributable risks of pancreatic cancer for establisehd modifiable and non-modifiable risk factors | Case-control | NHS, HPFS, GWAS, PanScan/PanC4 I-III, SEER | 167,483 individuals from NHS, HPFS with 1190 incidence cases during follow-up; 5107 cases, 8845 controls from GWAS; 248,893 cases from SEER | European for GWAS; diverse US population in SEER | SEER: 2000-2017 | NA |
| Yuan, 2025 | To examine the associations between liver diseases, transaminase levels, transaminase polygenic risk scores, and hepatobiliary–pancreatic cancers (including pancreatic cancer), and to assess causal relationships using two-sample Mendelian randomization (MR) | Cohort | UK Biobank (cohort and PRS); FinnGen consortium (MR outcome data) | 449,815 Total population (209,672 men, 240,143 women); 1,544 incident pancreatic cancer cases (1,424 + 120) | European | See Byrne 2023 | Not Reported (follow-up to August 31, 2024) |
| Zeng, 2023 | To evaluate the independent and combined associations of PRSs and healthy lifestyle scores (HLS) with pancreatic cancer and assess their age-dependent effects | Cohort | UK Biobank | 340,631 Total population 1,129 cases |
European | See Byrne 2023 | Median: 13.05 years |
| Zhang, 2022 | To investigate the association between fasting insulin (FI) and overall cancer risk and 14 site-specific cancers using Mendelian randomization (MR) analysis, and to explore the role of FI as a mediator between type 2 diabetes mellitus and cancer | Case-control | MAGIC Consortium, FinnGen Biobank, BCAC, UKB, GERA, OCAC, ILCCO, UK Biobank (for PRS data), and other cancer consortia | 281,146 from MAGIC (Glycemin Traits Data), 1,400,000 (Type 2 Diabetes Data), >400 cases per cancer type (Cancer Consortia Data), subset of 500,000 participants (UK Biobank for PRS Analysis), 1,669 cases | European | Not explicitly mentioned | NA |
| Zhou, 2025 | To develop and validate a clinical risk prediction model that stratifies 3-year pancreatic cancer risk among patients with new-onset diabetes (NODM) by combining a novel NODM-specific polygenic risk score with routine clinical predictors | Nested case-control | UK Biobank | 15,063 NODM cohort; 238 NODM-PC cases and 14,825 cancer-free T2DM controls | European | See Byrne 2023 | Maximum 3 years after T2DM diagnosis |
| Zhu, 2025 | To construct polygenic risk scores for the 13 most common cancers in the Chinese population using seven schemes and to evaluate their independent and combined contribution with modifiable risk factors to cancer risk stratification (pancreatic cancer is one of the 13) | Cohort | China Kadoorie Biobank (CKB) | 100,219 Total population; 170 incident PDAC cases | East Asian | 2004-2008 recruitment; follow-up through December 31, 2017 | Median: 11.33 years (IQR 10.18-12.26) |
Table 3.
Model Characteristics of Included Studies in the Systematic Review.
| Author, Year | Number of SNPs | PRS Effect Size (95% CI) | Model Performance Measures (95% CI) | Clinical Utility Measures | Clinical Factors |
| Al-Qahtani, 2024 | 4 | Unweighted PRS: OR = 1.54 (1.23-1.94); Weighted PRS: OR = 3.35 (1.45-7.73); with age and sex, uwPRS: OR = 1.52 (1.17-1.96), wPRS: OR = 3.42 (1.33-8.80), per 1-unit PRS increase | AUC not reported; Nagelkerke R²: uwPRS 0.083, wPRS 0.049, uwPRS+age+sex 0.345, wPRS+age+sex 0.327 | Threshold-based classification: uwPRS alone accuracy 62.8%, sensitivity 32.4%, specificity 86.4%, PPV 64.7%, NPV 62.3%; wPRS alone accuracy 60.7%, sensitivity 27.5%, specificity 86.4%, PPV 60.8%, NPV 60.6%; uwPRS+age+sex accuracy 69.7%, sensitivity 64.7%, specificity 73.5%, PPV 65.3%, NPV 72.9%; wPRS+age+sex accuracy 70.5%, sensitivity 67.6%, specificity 72.7%, PPV 65.7%, NPV 74.4% |
Age, sex |
| Antwi, 2017 | 8 | Age- and sex-adjusted: OR = 1.02 (0.97-1.07); Multivariable-adjusted: OR = 1.03 (0.97-1.08) per 0.10 increase in kilobase pair of telomere length or per 1 short TL allele |
Not Reported | Not Reported | Age, sex, diabetes, smoking history, and BMI |
| Aoki, 2021 | 24 | OR = 8.13 (2.95-22.43) for Q5 vs Q1 | Not Reported | Not Reported | Tobacco smoking, diabetes and pancreatitis history |
| Bogumil, 2020 | 31 | OR = 2.25 (1.73-2.92) for Q5 vs Q3 | Not Reported | Not Reported | Age at sample collection, sex, study, BMI, and diabetes |
| Byrne, 2023 | 22 | HR = 1.51 (1.36-1.66) per SD increase | Not Reported | Not Reported | Age, sex, lifestyle index category, assessment centre, 40 PCs of ancestries, Townsend Index, education, birth location, and income |
| Dite, 2023 | 22 | HR = 1.328 (1.263-1.397) per SD of 10-year PRS risk; clinical risk score HR = 1.328 (1.265-1.394) per SD; combined score HR = 1.310 (1.264-1.357) per SD. Top decile of combined 10-year risk: SIR = 1.413 (1.242-1.607) versus population risk; 4.5-fold the bottom decile. | Harrell's C-index: • PRS = 0.702 (0.686-0.717) • Clinical risk score = 0.703 (0.687-0.720) • Combined = 0.714 (0.698-0.730) • Combined superior to PRS (z = 3.18, P = .001) and to clinical (z = 2.27, P = .02) Calibration slope: • PRS 0.988 (0.889-1.087) • Clinical 1.035 (0.925-1.145) • Combined 0.952 (0.865-1.039) Calibration-in-the-large (slope fixed at 1): • PRS -0.065 (-0.132 to 0.002) • Clinical -0.094 (-0.161 to -0.026) • Combined -0.089 (-0.156 to -0.021) • Calibration plots by decile • Cohort-level SIR 0.802 (0.750-0.858) |
10-year absolute risk. Prespecified thresholds: ≥0.36% increased risk and ≥0.64% high risk NRI combined vs PRS = 0.066 (0.035–0.098), events 0.080 (0.049–0.111), non-events −0.014 (−0.015 to −0.012) NRI combined vs clinical = 0.060 (0.027–0.094), events 0.075 (0.042–0.109), non-events −0.015 (−0.016 to −0.014) High-risk category (≥0.64%): combined score placed 17% of cases (143/851) and 5.5% of controls (20,655/375,611) above threshold, versus 11% (98/851) and 3.8% (14,331/375,611) for the clinical score SIR within high-risk category: combined 1.551 (1.316-1.827); clinical 1.493 (1.225-1.820); PRS 1.511 (1.247-1.831). Number needed to screen: 1 in 442 unselected; 1 in 145 (combined high-risk); 1 in 147 (clinical high-risk). |
Smoking status (former, current), diabetes diagnosed >3 years, heavy alcohol use (>3 drinks/day), BMI category, ABO genotype. Family history omitted (unavailable in UK Biobank). Absolute risk from sex-, age-, and calendar-year-specific England incidence and competing mortality. |
| Felici, 2024 | 34 | Highest vs lowest tertile (T3 vs T1): OR = 2.07 (1.72-2.49); T2 vs T1: OR = 1.65 (1.37-2.00); continuous PGS: OR = 1.10 (1.08-1.12) per unit; all adjusted for age and sex | Not Reported | Not reported; gene-environment interaction null for pancreas | Age, sex |
| Galeotti, 2021 | 30 | Weighted PRS: OR = 2.70 (1.99-3.68); Multifactorial Score: OR = 14.37 (5.57-37.09) for Q5 vs. Q1 |
Unweighted PRS: AUC = 0.59 (0.57-0.61); Multifactorial Score: AUC = 0.63 (0.59-0.67) |
Not Reported | All scores: age, sex, and country of origin; Multifactorial Score: smoking and Type 2 diabetes |
| Gentiluomo, 2022 | 11 | OR = 1.99 (1.33-2.98) for Q5 vs. Q3 | Not Reported | Not Reported | Age, sex, and country of origin |
| Graff, 2021 | 22 | OR = 1.44 per SD increase | Not Reported | Not Reported | Age, sex, first 10 ancestry PCs, reagent kit for genotyping, and genotyping array |
| Hu, 2024 | Genome-wide PRS via AnnoPred (best of five methods); pancreas discovery GWAS FinnGen R7, SNP-heritability estimate negative | Per-SD HR reported only graphically, not numerically extractable; association statistically significant below the Bonferroni threshold | PRS alone AUC = 0.549; PRS + clinical AUC = 0.689 (ΔAUC = +0.140); good calibration in the testing set (Hosmer-Lemeshow P > 0.05/8) | Risk stratification by high-PRS and high-clinical strata (early-onset ≤65 y: 12.4% high PRS, 2.0% both high; late-onset >65 y: 10.2% high PRS, 3.0% both high); | 40 traits selected by XGBoost from 733 candidates, dominated by anthropometric/body-composition measures and blood-cell indices, plus HbA1c, waist circumference, "cancer diagnosed by doctor," and selected dietary, psychological, and cognitive items; no smoking or explicit diabetes-diagnosis variable was selected for pancreas; age, sex, and top 10 PCs handled per the main text |
| Jia, 2020 | 22 | HR = 3.37 (2.39-4.76) for Q5 vs. Q1; HR = 2.31 (1.57-3.39) for Top 5% vs. average risk group in UK Biobank population | AUC = 0.639 (0.613-0.664) | Not Reported | Age,sex, birth cohort, genotyping array, and top 10 PCs for ancestry |
| Jiang, 2026 | 22 | PRS used as a tertile-based effect modifier (low, intermediate, high genetic risk); no marginal PRS-to-PC estimate reported. Joint SFAs%-by-genetic-risk model (reference, lowest SFAs% + lowest genetic risk): highest SFAs% + highest genetic risk HR 3.60 (2.38-5.45). SFAs%-by-genetic-risk interaction not significant (P-interaction = 0.18). The SFAs% effect strengthened with genetic risk (SFAs% Q4 vs Q1: HR 1.63 [1.19-2.23] at high genetic risk, 1.23 [0.75-2.01] at low genetic risk). | Not Reported | Not Reported | Age, sex, racial/ethnic group (white or non-white), Townsend Deprivation Index, smoking status, drinking status, total physical activity, BMI, diet-quality score, diabetes, aspirin use, antihypertensive medication, lipid-lowering medication, top 10 ancestry PCs, genotyping batch. |
| Kachuri, 2020 | 22 | HR = 1.49 (1.37-1.63) per SD increase | Age + sex: C-index = 0.692, AUC = 0.695; Age + sex + family history + other predictors: C-index = 0.714, AUC = 0.715; Age + sex + family history + other predictors + PRS: C-index = 0.743, AUC = 0.745 |
NRI = 0.228 (0.174, 0.284), Event NRI = 0.228 (0.173, 0.284), Non-event NRI = 0.001 (-0.002, 0.003) comparing most comprehensive conventional risk factor model vs. model with PRS in addition to these risk factors | Age, sex, BMI, smoking status, cigarette pack-years, family history of cancer (prostate, breast, lung or bowel) |
| Ke, 2023 | 40 | OR = 2.03 (1.65-2.50) for Q5 vs. Q1 | PRS only: AUC = 0.72 (0.708-0.737); Risk factors only: AUC = 0.76 (0.751-0.780); PRS + risk factors: AUC = 0.78 (0.762-0.790); Hosmer-Lemeshow test: p=0.1543; |
Not Reported | age, gender, smoking status, family history of bowel cancer (surrogate for pancreatic cancer), alcohol consumption, physical activity, BMI, Wasit-to-Hip ratio, pancreatitis, DM, Cholecystitis |
| Kim, 2020 | 22 | For full follow-up period (per SD increase): Clinical/genetic model: OR = 1.37 (1.22-1.53); Clinical/genetic/biomarker model: OR = 1.36 (1.21-1.52); For 0-10 years follow-up period (per SD increase): Clinical/genetic model: OR = 1.44 (1.25-1.67); Clinical/genetic/biomarker model: OR = 1.43 (1.23-1.65) |
For full follow-up period: • Clinical Model AUC = 0.61 • Clinical/genetic Model AUC = 0.65 • Clinical/genetic/biomarker Model AUC = 0.67, Cumulative absolute risk by age 80: 0.4% and 3.8% in 10th and 99th risk percentile among men, 0.4% and 3.6% among women; For 0-10 years follow-up period: • Clinical Model AUC = 0.61 • Clinical/genetic Model AUC = 0.67 • Clinical/genetic/biomarker Model AUC = 0.69, 10-year absolute risk among cancer-free 70-year-old: 0.2% and 2.0% in 10th and 99th risk percentile among men, 0.2% and 1.7% among women |
Not Reported | Clinical model: BMI, WHR, MET-hour/week of physical activity, and history of diabetes; Clinical/genetic/biomarker model: proinsulin, adiponectin, IL6, and total BCAAs; Adjusted for matching factors, age, cohort (also gender), race/ethnicity, smoking status, fasting status, and month/year of blood collection |
| Kim, 2023 | 19 | Females: HR = 1.37 (1.16-1.61), Males: HR = 1.39 (1.20–1.61) per SD increase | PRS only model: Female AUC: 0.58, Male AUC: 0.59, Risk factors only model: Female AUC: 0.55, Male AUC: 0.57, Combined PCRS model (best performance): Female AUC: 0.60, Male AUC: 0.62 |
PPV for MCED Tests: Galleri Test (Sensitivity: 51.5%, Specificity: 99.5%) - High-risk females (75 years, 90–95th PCRS percentile): PPV = 70.3% - Low-risk females (75 years, 5–10th PCRS percentile): PPV = 48.2% - Difference in PPV: 22.1% DETECT-A Test (Sensitivity: 27.1%, Specificity: 98.9%) - PPV varies by PCRS and age, requiring higher thresholds to be clinically useful |
Age (used as time scale), BMI, smoking status, pack years of smoking, and family history of cancer in non-adoptive first-degree relatives |
| Klein, 2018 | 22 | OR = 2.20 (1.83-2.65) for >90th vs 40-60th PRS percentile | Not Reported | Not Reported | Age, sex |
| Liu, 2020 | 21 | ORs only given for association between genetically predicted expression of single gene and risk | PRS1 model (w/ GWAS-identified risk variants): AUC = 0.621; PRS2 model (w/ GWAS + TWAS-identified risk variants): AUC = 0.633 |
Not Reported | Age, sex, top PCs |
| Meisner, 2020 | 18 | cPRS only (per SD increase): HR = 1.10 (1.05-1.16) in women, 1.15 (1.10-1.19) in men; cPRS + risk factors (per SD increase): HR = 1.06 (0.99-1.13) in women, 1.10 (1.04-1.15) in men |
Not Reported | Not Reported | Age, sex, BMI, smoking status, alcohol consumption, SBP, DBP, eGFR, total cholesterol, LDL cholesterol, HDL cholesterol, triglycerides, blood glucose, and sleep duration |
| Nakatochi, 2018 | 5 | Risk factors + PRS (Model A): OR = 1.98 (1.42-2.76) for Q5 vs. Q3 | Risk factors + PRS (Model A): AUC = 0.63 (0.60-0.66), AIC = 1764; PRS only (Model B): AUC = 0.61 (0.58-0.64), AIC = 1796 |
Not Reported | Smoking, family history of pancreatic cancer |
| Nodari, 2023 | 28 | PanScan + PanC4: OR = 4.93 (2.94-8.26) for ≤50 years, OR = 3.29 (2.84–3.81) for >50 years; PANDoRA: OR = 2.90 (1.17-7.17) for ≤50 years, OR = 2.44 (1.76-3.38) for >50 years, comparing Q5 vs. Q1 |
Not Reported | Not Reported | PanScan + PanC4: sex and eight principal components; PANDoRA: sex and country of origin |
| Peduzzi, 2024 | N/A | Univariate OR = 2.25 (1.73-2.95); Multivariate OR = 2.09 (1.66-2.64) for Q5 vs Q1 |
Not Reported | Not Reported | Age, sex for univariate analysis; All 347 exposure variables categorized into 28 groups (alcohol consumption, anthropometric measurement, asthma and allergies, blood cell ratio, blood group, blood metabolites, blood pressure, cognitive function, diabetes, diet, digestive health, drug consumption, early life factors, education, general health, lifestyle and stress, local environment, medication, mental health and traumatic events, occupation related risk, pancreatitis, physical activity, PRS, sexual factor, sleep habits, smoking, sun exposure, urine metabolites) in the multivariate; |
| Peduzzi, 2025 UEG | 33 | Tertile 3 vs 1, multivariable. Females: OR 2.16 (1.59-2.97); Males: OR 1.96 (1.48–2.62). | AUC 0.95 (females) and 0.92 (males); sensitivity 0.90/0.81; specificity 0.86/0.92; accuracy 0.89/0.88. These are the full XGBoost model (age plus PRS plus reproductive and hormonal features), not the PRS alone. No standalone PRS AUC or calibration is reported. SHAP ranked age first and the PRS among the top features. | Not Reported | Age, oral contraceptive use, hormone-replacement therapy, age at menarche, age at menopause, parity, SHBG, free testosterone, estradiol, male balding pattern, pancreatitis, diabetes, smoking, alcohol, BMI. |
| Peduzzi, 2025 (DLD) | 33 | Not reported as OR/HR | Machine-learning classifier AUC 0.88-0.92 across five algorithms on undersampled datasets (DS1 best CatBoost AUC = 0.92; DS2 best XGBoost AUC = 0.92); CIs not reported; calibration not reported (SHAP and Girp interpretability used instead) | Not reported as net benefit or absolute risk | 56 exposome and lifestyle variables, with age the top SHAP feature (also weight, recent illness/injury/bereavement/stress, whole-body fat-free mass, time spent outdoors, pancreatitis, water intake, whole-body water mass, among others) |
| Pierce, 2012 | N/A | ORs ranged from 0.90-1.20 per SD increase, depending on SNP inclusion threshold. | PRS had low predictive ability; R² 0.005-0.018, AUC 0.535-0.576. Sensitivity and specificity not significantly improved over baseline | Not Reported | Age, sex, and five principal components |
| Prassas, 2025 | 22 | Pancreatic PGS HR 1.40 (1.34-1.47) per SD, independent of BRCA2 carrier status. BRCA2 × PGS interaction HR 0.91 (0.59-1.39), p=0.65 (not significant; PGS effect similar in carriers and non-carriers for pancreas). The BRCA2 monogenic effect on pancreas, HR 3.57 (2.30-5.55), is a separate quantity. | Pancreatic PGS AUC 0.59 (UK Biobank) and 0.57 (Genomic Health Initiative validation). No calibration reported for pancreas | Probability of cancer by age 75 (P75) by PGS decile; pancreatic P75 was 1.96% in BRCA2 carriers | BRCA2 carrier status, sex, age (timescale), top 4 PCs (probability models) or top 10 PCs (hazard models) |
| Rothwell, 2022 | 26 | See Kachuri 2020 | Not Reported | Positive associations between harmonized MetS and pancreatic cancer were maintained within PRS strata; No evidence of interaction (P=0.69); | Abdominal obesity, elevated circulating triglycerides, reduced circulating HDL cholesterol, abnormal glucose metabolism, elevated BP, total physical activity, height, alcohol consumption frequency, smoking intensity, frequency of red and processed meat consumption, highest educational level, regular aspirin or ibuprofen use, ever use of hormone replacement therapy, fasting time (where necessary) |
| Salvatore, 2021 | 18 | PRS only, at 2-year follow-up - MGI: OR = 1.21 (0.74-1.97), UKB: 2.15 (1.76-2.52); PRS + covariates + risk factor, at 2-year follow-up - MGI: OR = 1.32 (0.80-2.20) per SD increase, UKB: OR = 2.17(1.77-2.65) per SD increase |
PRS only, at 2-year follow-up - MGI: AUC = 0.530 (0.476-0.584), Brier Score = 0.22370; UKB: AUC = 0.581 (0.560-0.603), Brier Score = 0.00166; PRS + covariates + risk factors, at 2-year follow-up - MGI: AUC = 0.611 (0.560-0.662), Brier Score = 0.2161, UKB: AUC = 0.711 (0.693-0.729), Brier Score = 0.00166 |
Not Reported | Covariates: sex, birthyear, genotyping batch, and the first four PCs from the genotype data; Risk factors: BMI (continuous), drinker (ever/never), and smoker (ever/never) |
| Sharma, 2022 | 49 | OR = 2.74 (2.23-3.37) for Q5 vs. Q1 | Clinical risk model: AUC = 0.791 (0.754-0.827); Combined PRS and clinical risk: AUC = 0.83 (0.80-0.86); p=0.0002 |
Predictive Performance (5th Quintile PRS): Sensitivity: 31.8% (all), 30.8% (no DM), 41.4% (LSDM), 28.9% (NODM) Specificity: 81.2% (all), 81% (no DM), 82.7% (LSDM), 91.4% (NODM) PPV: 14.4% (all), 11.9% (no DM), 23.9% (LSDM), 86.7% (NODM) |
Age at diagnosis, age at DM diagnosis, DM onset, waist circumference, first-degree family history of digestive cancer |
| Shi, 2019 | 9 | OR = 1.67 (1.10-2.53) for High vs. Average-risk | Not Reported | Not Reported | Not Reported |
| Sun, 2024 | 24 | Not reported as OR/HR | Combined clinical + genetic model (LR) AUC = 0.897 (0.865-0.929); genetic model alone AUC = 0.879 (0.842-0.915); clinical model alone AUC = 0.709 (0.656-0.762); LR model well calibrated; combined models well calibrated in 4 of 5 algorithms (excluding XGBoost) | Final combined model, two thresholds: • 1.28% cutoff sensitivity 76.0%, specificity 87.5%, PPV 4.6%, NPV 99.8%, 13.0% require definitive testing; • 5.26% cutoff sensitivity 46.0%, specificity 98.4%, PPV 18.1%, NPV 99.6%, 2.0% require definitive testing. • Risk-stratified event rates low 0.23%, intermediate 2.01%, high 18.11%. Decision-curve net benefit across threshold probabilities 0 to 0.76 |
Age, platelet count, systolic blood pressure, immature reticulocyte fraction, platelet crit, time from registration to diabetes diagnosis as a covariate |
| Wang, 2020 | 18 | OR = 1.99 (1.30-3.04) for high GRS (>2.0) vs. low GRS (<1.0) | AUC = 0.5675 (Model unspecified) | Not Reported | Age, sex |
| Wang, 2022 | 32 | African Ancestry: OR = 1.02 (0.76-1.38); European Ancestry: OR = 1.10 (0.82-1.47) per SD increase |
African Ancestry: Model w/ PCs, Age, Sex: AUC = 0.8096 (0.754-0.859); Full Model including PRS: AUC = 0.81 (0.756-0.859); AUC addition PRS = 0 (p = 0.75); European Ancestry: Model w/ PCs, Age, Sex: AUC = 0.736 (0.662-0.801); Full Model including PRS: AUC = 0.733 (0.664-0.796); AUC addition PRS = -0.003 (p = 0.4429); |
Not Reported | Age, sex |
| Wolpin, 2014 | 10 | OR = 0.55 (0.44-0.68) for those with ≤6 risk alleles; OR = 2.24 (1.80-2.80) for those with ≥14 risk alleles vs. those with the most prevalent number of risk alleles in controls (n=10) | Not Reported | Not Reported | Age, sex, geographic location, and significant PCs for Stage 1; Age, sex, study and significant PCs for Stage 2 of the PanScan III GWAS |
| Wu, 2025a Z | 22 | 1.44 (1.32-1.56) per SD increase; HR = 2.07 (1.75-2.46) for high vs low tertile; HR = 1.44 (1.21-1.73) for intermediate vs low tertile. Sensitivity analyses: excluding first 2 years of follow-up, high vs low HR = 1.91 (1.60-2.27); Fine-Gray competing-risk, high vs low HR = 2.19 (1.78-2.70) | Not reported | No AUC, calibration, decision-curve, NRI, or IDI. PRS distribution among incident PC cases: 22.2% low, 32.2% intermediate, 45.6% high tertile, versus 33.3% each in the full cohort (Table S6). Additive interaction with LE8: RERI 2.41 (0.38-4.44) for high PRS with low cardiovascular health; joint analysis, high LE8 with low PRS versus low LE8 with high PRS, HR = 0.19 (0.11-0.33) | Age, sex, education level, socioeconomic status (Townsend deprivation index), ethnicity, top 10 principal components of ancestry |
| Wu, 2025b D | 22 | PRS was used as a subgroup stratified (low, median, high) for the dietary score; no marginal PRS-to-PC estimate was reported. The pancreatic PRS-by-dietary-score interaction was neither additively nor multiplicatively significant. Within the median-PRS stratum, a low vs. high dietary score conferred a 213.3% higher risk (P_FDR < 0.05). | Not Reported | Not reported | Sex, age, ethnicity, BMI, smoking status, alcohol consumption frequency, total energy intake, and Townsend Deprivation Index. |
| Yuan, 2022 | 22 | Aged ≤60 years: OR = 6.91 (4.60-10.40); Aged >70 years: OR = 4.12 (3.08-5.52) for top vs. bottom 10% |
Not Reported | Not Reported | Age, sex, study site |
| Yuan, 2025 | 87 | High vs low PRS: ALT PRS HR 0.92 (0.83 - 1.03), AST PRS HR 0.94 (0.84 - 1.04). Top vs bottom quartile: ALT PRS HR 0.92 (0.80 - 1.07), AST PRS HR 0.92 (0.79-1.07). Trend p = 0.295 (ALT), 0.296 (AST). | Not Reported | Not Reported | Age, sex, BMI, smoking status, alcohol consumption frequency, diabetes status, medication use (statins, metformin, NSAIDs). |
| Zeng, 2023 | PRS 54=44, PRS 22=22, PRS 32=31 | HR = 1.58 (1.47-1.71) per SD increase; Aged ≤60 years: HR = 1.89 (1.30-2.73) for the highest third vs. the second third of the PRS |
PRS Only: AUC = 0.616 (0.600–0.632); Weighted Lifestyle Score: AUC = 0.605 (0.589–0.621); PRS + age ≤60 years: AUC = 0.623 (0.598-0.649) |
Not Reported | Age, sex, education level, first 5 PCs of ancestry |
| Zhang, 2022 | 35 | OR = 1.04 (0.47-2.30) per SD increase | Not Reported | Not Reported | Age, sex, BMI, drinking, smoking, and the first 10 genetic PCs |
| Zhou, 2025 | 33 (NODM-PC PRS); comparators PC PRS 49, T2DM PRS 424 | NODM-PC PRS HR = 8.49 (4.94-14.58) Q4 vs Q1; PC PRS HR = 2.95 (1.96-4.43) Q4 vs Q1; T2DM PRS HR = 0.50 (0.34-0.75) Q4 vs Q1 (inverse); all adjusted for age at T2DM diagnosis, sex, and top 10 principal components of ancestry | • AUC: NODM-PC PRS = 0.719 (0.687-0.751); PC PRS = 0.611 (0.575-0.646); T2DM PRS = 0.592 (0.555-0.628). • Harrell's C-index (IECV pooled): Model 2 = 0.823 (0.806-0.840); Model 1 = 0.782 (0.747-0.818); Model 3 = 0.749 (0.712-0.786). • Calibration (Model 2): slope = 0.994 (0.885-1.102), calibration-in-the-large = −0.006 (−0.115 to 0.102). PR-AUC: Model 2 = 0.080; Model 1 = 0.058; Model 3 = 0.046. • Continuous NRI (Model 2 vs 3): cases = 0.319 (0.207-0.436), controls = 0.309 (0.293-0.325). • IDI (Model 2 vs 3): 0.021 (0.015-0.028). |
Threshold-based performance. Model 2 (NODM-PC PRS + clinical): • Top 1% PPV 13.25%, sensitivity 8.40%, specificity 99.12%; • Top 5% PPV 9.55%, sensitivity 30.25%; • Top 10% PPV 7.37%, sensitivity 46.64%. Comparators at top 1%: Model 1 (PC + T2DM PRS + clinical) PPV 10.60%; Model 3 (clinical only) PPV 7.95%. • At top 5%, Model 1 PPV (6.50%) was below Model 3 (6.90%), indicating that adding standard PC and T2DM PRSs to clinical factors did not improve threshold-based performance, whereas the re-derived NODM-PC PRS did. Decision-curve analysis: • Model 2 gave the greatest net benefit at threshold probabilities below 10%, exceeding treat-all, treat-none, Model 1, and Model 3 |
Age at T2DM diagnosis, smoking status, HbA1c, sex, and the top 10 PCs in PRS association models. |
| Zhu, 2025 | 21 (PRS5, European-derived from the PGS Catalog; selected as the optimal pancreas PRS from six candidates: PRS1 8, PRS2 8, PRS3 17, PRS4 24, PRS5 21, PRS7 1,329 SNPs) | HR = 1.28 (1.10-1.48) per SD increase, adjusted (Model 2), P = 0.001; HR = 1.29 (1.11-1.49) unadjusted (Model 1); HR = 2.51 (1.47-4.27) for Q5 vs Q1; HR = 1.57 (1.13-2.20) for top 20% vs other 80% | C-index, PRS only (Model 1) = 0.586 (0.544-0.627); C-index, PRS + covariates and modifiable risk factors (Model 2) = 0.781 (0.748-0.814); calibration not reported | 10-year absolute-risk trajectories by age and PRS stratum; continuous NRI above 0.15 after adding PRS; explained relative risk PRS 4.7%, modifiable factors 7.6%; no decision-curve analysis or PPV | Age, sex, region, top 10 principal components, family history of cancer, and summarized modifiable risk factors (education, BMI, smoking, alcohol, physical activity, dietary habits, medical history) |
Disclaimer/Publisher’s Note: The statements, opinions and data contained in all publications are solely those of the individual author(s) and contributor(s) and not of MDPI and/or the editor(s). MDPI and/or the editor(s) disclaim responsibility for any injury to people or property resulting from any ideas, methods, instructions or products referred to in the content. |
© 2026 by the authors. Licensee MDPI, Basel, Switzerland. This article is an open access article distributed under the terms and conditions of the Creative Commons Attribution (CC BY) license (http://creativecommons.org/licenses/by/4.0/).
Copyright: This open access article is published under a Creative Commons CC BY 4.0 license, which permit the free download, distribution, and reuse, provided that the author and preprint are cited in any reuse.