

Submitted:
15 October 2026
Posted:
16 October 2026
You are already at the latest version
Abstract
Cybersecurity education must explain how awareness is associated with willingness to enact protective practices while maintaining a clear distinction between intentions and verified behavior. This study examines a Cisco-oriented awareness–appraisal–intention framework using 385 completed primary-survey records reported as collected from technology users in Bangladesh. Protection motivation theory motivates two parallel appraisal pathways between cybersecurity awareness and secure-practice intention. The analysis combines measurement diagnostics, standardized composite-score regression with heteroskedasticity-consistent inference, 10,000 bootstrap resamples, and ten repetitions of ten-fold cross-validation. Awareness is positively associated with threat appraisal and coping appraisal. In the intention equation, awareness, threat appraisal, and coping appraisal have coefficients of 0.213, 0.197, and 0.273, respectively, with R-squared of 0.294. The two indirect associations are 0.077 and 0.124, but their difference is uncertain. The full model reduces held-out root mean squared error from 0.473 to 0.400 on the original five-point scale. Internal consistency is low across all four scales, and substantial discriminant-validity problems limit confirmatory interpretation. Accordingly, the reported associations are exploratory evidence from the analyzed survey records, not proof of causal mechanisms or actual secure behavior. The findings motivate improved instrument validation, task-specific security measurement, and longitudinal evaluation.
Keywords:
protection motivation theory
; secure practice intention
; coping appraisal
; cybersecurity education
; discriminant validity
; predictive assessment
1. Introduction
Cybersecurity awareness becomes useful for institutional security when users can recognize relevant risks and act on feasible protective guidance. A student may recognize an unsafe network or suspicious message yet remain uncertain about the appropriate response. Conversely, confidence in operating a security tool may coexist with incomplete understanding of the threat. This article examines the relationship between awareness, appraisal, and secure-practice intention through a Cisco-oriented research model using reported primary survey responses. It distinguishes intention from verified security behavior and exploratory associations from causal inference.
Artificial intelligence changes the circumstances in which users assess digital threats. The United Kingdom National Cyber Security Centre has identified ways in which AI can assist malicious activity, including social engineering, and its assessment extending to 2027 describes additional risks associated with the growing use of AI systems [1,2]. These assessments concern the UK threat environment; they provide a rationale for examining contemporary security education rather than estimates of attack prevalence in Bangladesh. For university-level users, the relevant educational problem is how to evaluate suspicious requests, manage credentials, and apply security procedures while using increasingly complex digital services.
Networking education involves both knowledge and practical execution. Recognizing a weak configuration differs from knowing how to correct it. Cisco resources, including Packet Tracer, provide a context for procedural teaching [3]. The Cisco orientation identifies that educational context; it does not establish certification, product use, or commercial sponsorship for the survey profiles.
Bangladesh already has research on student cybersecurity awareness. Ahamed and colleagues examined cybersecurity knowledge, password security, perceived skills, and attitude among university students [4]. Subsequent work examined knowledge, social networking, risk perception, and awareness among Gen Z students in Dhaka [5]. These studies establish the relevance of examining student perceptions, but their outcomes and model structures differ from the awareness-to-intention framework developed here. The present educational study starts with awareness as an antecedent and treats secure-practice intention as the outcome.
The central problem is that awareness scores can be interpreted too quickly as evidence of secure adoption. Knowing that phishing exists, believing that an attack would be harmful, and intending to take a protective action describe related but distinct judgments. Actual adoption requires an action that can be observed or credibly recalled. The Group 9 workbook labels its outcome block Secure Practice Intention. Consequently, its numerical analysis concerns intentions; it cannot establish whether users enabled protective settings, configured secure connections, or consistently followed networking procedures. Retaining this distinction gives the research problem a testable scope.
A second problem concerns mechanism. Protection motivation theory separates evaluation of a threat from evaluation of the response available to the individual [6,7]. Awareness could be related to intention through either pathway. Treating the pathways as interchangeable may conceal whether a learner understands the danger or believes that protection is feasible. Yet assigning separate labels to three-item blocks does not itself establish distinct constructs. The instrument must demonstrate that the measured responses can support the theoretical distinctions imposed on them.
A second challenge concerns measurement and inference. Positive regression coefficients may appear persuasive even when the scales have weak reliability or overlap extensively. Appropriate analysis therefore evaluates the measurement structure before interpreting paths. The problem addressed here is methodological as well as substantive: how can an awareness-to-intention model be evaluated without treating statistical significance or a recognizable company name as proof of real-world effectiveness?
Prior information-security research connects protective intentions to efficacy beliefs, threat judgments, awareness, and organizational conditions [8,9,10]. The remaining question for this model is narrower than a claim that cybersecurity awareness has not been studied. It concerns whether awareness retains an association with networking intentions when both appraisal pathways are considered, whether one indirect association is larger than the other, and whether the combined model improves prediction over a simple awareness-only benchmark.
The measurement gap is equally important. Established instruments distinguish different aspects of security knowledge, attitudes, intentions, and reported practices [11,12,13]. The present workbook supplies construct labels and item codes but does not establish equivalence with those instruments. A Cisco-oriented study requires evidence that its items reflect the intended decision context. This article uses the survey-data exercise to identify the consequences of proceeding before that evidence is available. Its contribution is an analytical diagnosis and a defensible design for subsequent empirical research, without claiming a representative population estimate.
The general objective is to examine an awareness-to-intention framework through transparent analysis of 385 completed primary-survey records. Four questions guide the analysis. First, are cybersecurity awareness, threat appraisal, coping appraisal, and secure-practice intention sufficiently reliable and distinct for psychological interpretation? Second, how are the three antecedent composites associated with intention when estimated jointly? Third, what indirect associations arise through the two appraisal pathways, and does their difference exclude zero? Fourth, how much does the full model improve held-out prediction relative to simpler specifications? These questions align measurement, association, and prediction without assuming that any one form of evidence can substitute for the others.
The focused model excludes the shared workbook's adjacent topics of vendor reliability, relative advantage, and career readiness. Its distinctive elements are direct comparison of parallel indirect associations, benchmarked prediction, and measurement assessment that remains consequential when regression results look favorable.
The contribution is methodological and educational: predictive improvement does not prove theoretical validity, and a larger point estimate does not establish a stronger mechanism. Distinctiveness concerns the analytical design and topic focus. It does not imply superiority over other groups, whose comparison datasets are unavailable.
Section 2 develops the constructs, hypotheses, and conceptual framework. Section 3 describes record screening and the analytical methods. Section 4 reports the numerical results with their measurement qualifications. Section 5 relates the diagnostic findings to the theoretical model. Section 6 develops conditional educational and policy implications, and Section 7 outlines limitations and a future longitudinal or experimental design. Declarations, references, and analytical appendices complete the article.
2. Literature Review and Theoretical Foundation
A framework linking awareness to protective intention requires clarity about the judgments being measured and the theoretical reason for connecting them. This section first separates the principal constructs, then develops their relationships through protection motivation theory and a limited behavioral-intention perspective. The hypotheses are assessed using cross-sectional survey scores, with measurement limitations explicitly constraining their interpretation.
2.1. Conceptual Background
Cybersecurity awareness refers here to an individual's recognition of security risks and familiarity with protective principles. Awareness should be distinguished from objective knowledge, which requires a task or test with demonstrably correct responses. A self-reported awareness rating can reflect confidence, familiarity, or a favorable self-assessment. Security research therefore benefits from measuring the concept with a defined behavioral referent and comparing self-report with independently assessed performance. The HAIS-Q research offers an example of deliberate instrument development rather than assuming that general technological familiarity captures security competence [11].
Threat appraisal concerns perceived danger. In protection motivation theory, severity and vulnerability contribute to appraisal but are conceptually separable. A student could view credential theft as serious while believing that personal exposure is unlikely. Coping appraisal concerns the response to the danger, particularly whether a protective action is effective and whether the person can perform it. Response costs may also matter, such as time, effort, inconvenience, or reduced access to a desired service. The survey workbook provides broad TA and CAP blocks; those blocks do not separately identify each theoretical component.
Secure-practice intention is willingness or a plan to perform protective actions, distinct from their execution or persistence. SeBIS illustrates specification of concrete security domains [13]. Networking items should also reflect authority: choosing a connection differs from administering access rules. Combining these decisions could undermine interpretation even on a common scale.
2.2. Primary Theoretical Foundation
Protection motivation theory originated as an explanation of responses to fear appeals [6]. Its revised development incorporated self-efficacy into the assessment of protective responses [7]. For cybersecurity education, the framework directs attention to two questions: whether the risk warrants action and whether the action is feasible and effective. It offers a reason to expect that awareness is connected with intention through appraisals rather than through information exposure alone. Importantly, the complete theory contains more differentiated components than the four composite blocks available in this workbook.
Information-security applications demonstrate both the relevance and the limits of the theory. Johnston and Warkentin connect protective intentions to efficacy, severity, and social influence [8]. Boss and colleagues emphasize fuller attention to the theory's nomology and fear processes [14]. A meta-analysis of 92 published studies finds particularly important average relationships involving response efficacy and self-efficacy, alongside variation across settings [15]. These findings motivate investigation of coping-related pathways, but they do not justify declaring coping universally more influential or interpreting a weakly measured CAP block as a validated efficacy scale.
The theory fits networking decisions requiring understanding of a response's purpose and execution. This application excludes independently measured fear, response cost, maladaptive rewards, enforcement, and social influence. It is an appraisal-based exploratory empirical analysis rather than a test of the complete theory.
2.3. Supporting Perspectives and Theoretical Integration
Ajzen's theory of planned behavior distinguishes behavioral intention from realized behavior and identifies the importance of control over the action [16]. The present model uses this distinction to define its outcome. It does not claim to test the full theory because attitudes, subjective norms, and perceived behavioral control are not each operationalized. This limited use helps explain why networking intention is an appropriate intermediate outcome while actual adoption remains a separate empirical question.
Bandura's self-efficacy perspective clarifies the capability component of coping appraisal [17]. Confidence in performing a task differs from believing it will work. Both require measurement. The integrated perspective orders awareness, appraisal, intention, and later observed performance, without assigning overlapping theoretical labels to the same items.
2.4. Construct Specific Evidence
Awareness has been examined in organizational compliance research as part of the beliefs surrounding security requirements [10]. Its meaning depends on whether respondents assess general risks or specific policies. In this article, awareness is broad because only item codes and a construct label can be authenticated. That limitation prevents an assertion that the block measures Cisco security awareness specifically. A future instrument should define the networking situations to which each awareness statement refers and avoid mixing awareness with intention in the same item.
Threat-related relationships are context dependent. Herath and Rao place protective motivation alongside deterrence in organizational compliance [9], while Ifinedo integrates protection motivation with planned behavior [18]. Such models remind researchers that motivation may operate under rules and supervision. University users may face different levels of authority or support. Consequently, a future confirmatory study should measure the security task and institutional conditions rather than infer them from an education label or a company's association with the research topic.
Coping appraisal is a plausible bridge between awareness and intention because an understood risk still requires an executable response. The emphasis on efficacy in the broader security literature supports studying this bridge [15]. Related work on security fatigue describes the strain involved in repeated security decisions [19], while the compliance-budget perspective considers perceived costs and benefits [20]. These perspectives imply possible constraints on protective action. They are not measured moderators in the current study, and their contribution here is to identify what a future CAP instrument should distinguish.
The Bangladesh literature also makes it important to separate concepts. Ahamed and colleagues' 2024 model treats awareness as an outcome and considers attitude as an intervening variable [4]. Their 2026 study examines risk perception in the relationship between knowledge and awareness [5]. Hasan and colleagues provide a further student-awareness study [21]. The present model instead positions secure-practice intention downstream of awareness. This difference identifies a research question, but substantive conclusions must await a real survey with adequate construct validity.
2.5. Hypotheses Development
Awareness may be associated with threat appraisal because recognizing security problems can make their consequences and relevance easier to evaluate. A user who understands credential theft can interpret a suspicious login request in relation to personal exposure. Existing security research connects risk-related judgments with protective responses, although it also indicates variation across contexts [8,9]. Awareness could alternatively reduce exaggerated fear by clarifying which situations are genuinely risky. The proposed positive relationship therefore concerns recognition of relevant threats rather than indiscriminate anxiety. In a future validated instrument, examples should distinguish realistic susceptibility from generalized concern.
H1 proposes that cybersecurity awareness is positively associated with threat appraisal.
Awareness may also be related to coping appraisal when it includes knowledge of available protective procedures. Understanding why a measure is recommended can make its purpose clearer and increase confidence in applying it. Self-efficacy theory identifies capability beliefs as relevant to action [17], while the revised protection-motivation account distinguishes beliefs about performing the response from beliefs about its effectiveness [7]. Awareness is not equivalent to mastery, however. A future study should avoid assuming that familiarity with a networking term proves the ability to execute a secure configuration. The expected relationship is positive, but it remains contingent on meaningful measurement.
H2 proposes that cybersecurity awareness is positively associated with coping appraisal.
Threat appraisal can be associated with intention when users see a credible risk that deserves attention. The theoretical logic is that perceived danger gives protective action relevance. However, stronger threat messages can create concern without identifying a workable response, and compliance environments may contribute additional incentives [14,18]. In this model, threat appraisal is examined alongside coping appraisal to estimate its association conditional on the other composites. The relevant prediction is not that fear always helps, but that recognizing a consequential, plausible security risk accompanies stronger willingness to take a protective action.
H3 proposes that threat appraisal is positively associated with secure-practice intention, conditional on awareness and coping appraisal.
Coping appraisal can be associated with intention because a person is more likely to plan a response that seems effective and manageable. In networking education, knowing how to complete a secure procedure can reduce uncertainty about the action required. This reasoning aligns with efficacy-based protection-motivation accounts and research emphasizing the user's assessment of security recommendations [7,15]. Still, a favorable capability rating can be inaccurate. The relationship concerns a belief-intention association, and an empirical study should test whether the belief corresponds to performance. Estimating the pathway does not establish that training has increased either capability or behavior.
H4 proposes that coping appraisal is positively associated with secure-practice intention, conditional on awareness and threat appraisal.
An awareness-intention association may remain after appraisal is included. Awareness could encompass routines, familiarity with guidance, or recognition of institutional expectations that are not fully represented in the broad TA and CAP blocks. Organizational research connects awareness with compliance-related beliefs [10], and comparative work shows the value of distinguishing knowledge, awareness, and security behavior [22]. A residual direct association therefore warrants estimation. It should not automatically be interpreted as a separate causal process because incomplete measurement, shared response tendencies, and omitted variables can also generate it.
H5 proposes that cybersecurity awareness retains a positive association with secure-practice intention after both appraisal composites are included.
The final propositions concern two indirect associations. In the threat pathway, awareness is related to appraisal of danger, which is related to intention. In the coping pathway, awareness is related to evaluation of an available response, which is related to intention. These are parallel paths; the model does not assert that threat appraisal causes coping appraisal. Their products can be estimated and directly compared using resampling methods for multiple mediators [23]. In practice data, a positive product is a statistical feature of the recorded scores. Even a genuine cross-sectional survey would require additional temporal and causal assumptions before establishing psychological mediation [24].
H6 proposes a positive indirect association between awareness and intention through threat appraisal. H7 proposes a positive indirect association between awareness and intention through coping appraisal.
2.6. Conceptual Framework
Figure 1 organizes the seven propositions into a model with one upstream composite, two parallel appraisal composites, and one intention outcome. The framework separates the question of danger from the question of effective response, while retaining an awareness-intention path to avoid assuming complete mediation. Solid arrows indicate hypothesized statistical relationships. Their directions express theoretical ordering for future confirmatory study and do not establish temporal ordering in the survey records.
3. Methodology
The methodology reports the analytical procedures applied to the 385 completed primary-survey records, including record screening, measurement diagnostics, composite-score models, and prediction benchmarks. Survey provenance is reported on the basis of the researchers’ account; independent verification of recruitment and consent documentation was not possible from the manuscript alone. This sequence allows unfavorable psychometric results to constrain the interpretation of otherwise favorable paths.
3.1. Research Design and Analytical Scope
This is a cross-sectional quantitative empirical analysis of 385 completed survey records, described by the research team as collected directly from respondents in Bangladesh. The analysis uses a single survey-data workbook and is not a Monte Carlo simulation. Composite-score regression supplies the main associative calculations. Diagnostic confirmatory factor analysis evaluates the proposed reflective factors; its limitations prevent reporting a validated latent structural model, and PLS-SEM is not claimed. The sampling procedure, fieldwork dates, participant eligibility, questionnaire administration, and consent documentation require confirmation against the original study records.
Composite-score regression supplies the main associative calculations. Diagnostic confirmatory factor analysis evaluates the proposed reflective factors. Its limitations prevent reporting a validated latent structural model, and PLS-SEM is not claimed.
3.2. Intended Population and Research Context
The study concerns technology users in Bangladesh in a Cisco-oriented networking context. The survey workbook includes categories for age, education, current status, location, use frequency, experience length, and AI-feature experience. Current status includes students, employed users, freelancers, and other respondents. Thus, the entire dataset should not be described as a university-student-only sample. Education categories alone cannot establish enrollment, field of study, or experience with a specified Cisco service. The unit of analysis is one completed survey record. A student-status subset is examined as a sensitivity analysis rather than a separate representative sample.
3.3. Record Screening and Analytical Sample Size
The Data Entry sheet reserves 400 IDs. Screening identifies 385 records with all twelve primary indicators present; the final fifteen IDs contain no substantive responses. These unused slots are excluded because they are empty, not because they failed an attention check. The analysis retains all 385 completed records and checks core-item completeness, permitted scale values, ID duplication, repeated core profiles, and constant response patterns. The workbook's quality-control item expects the value 4, and every completed record contains that value. This is a property of the survey file rather than evidence of attentive human participation.
The codebook identifies 400 numbered entry slots, of which 385 contain complete core responses. The final fifteen unused slots do not represent excluded respondents. No recruitment denominator, response rate, sampling frame, or probability-based representativeness claim can be established from the workbook alone. The sample size therefore describes the analyzed survey records; the original recruitment and fieldwork documentation should be retained to support the study’s empirical provenance.
3.4. Construct Operationalisation and Item Provenance
Each primary composite is the arithmetic mean of three indicators on the workbook's five-point agreement scale, ranging from strongly disagree to strongly agree. CA1-CA3 represent Cybersecurity Awareness, TA1-TA3 Threat Appraisal, CAP1-CAP3 Coping Appraisal, and SPI1-SPI3 Secure Practice Intention. No reverse coding is applied because none is documented. Adjacent blocks concerning usefulness, reliability, relative advantage, readiness, and adoption or career intentions are excluded to maintain alignment with the assigned individual topic.
Table 1 identifies the codes used and distinguishes workbook provenance from literature that informs the theoretical interpretation. The cited literature is not presented as proof that the workbook copied or validated an existing instrument.
This mapping permits numerical replication but does not establish content validity. The full questionnaire statements and the item-adaptation history are not available in the analytical materials. Consequently, claims about wording, Bangla translation, expert review, or equivalence to HAIS-Q or SeBIS are not made. Appendix A reports indicator statistics and provides guidance for a future instrument without inventing administered questions. The unused CAI block also lacks a codebook definition and is not reinterpreted as a cybersecurity outcome.
3.5. Pilot Study and Data Handling
No separate pilot study is documented in the materials reviewed. The current psychometric assessment diagnoses the analyzed survey instrument and should not be presented as evidence that a pilot of 30–50 respondents occurred. Future instrument refinement should use cognitive interviews and a documented pilot to examine comprehension, task specificity, and separation between severity, vulnerability, response efficacy, self-efficacy, and response costs. Deleting items merely to increase reliability after inspecting the primary outcome would risk changing the scale’s meaning.
The source workbook is retained without imputation or alteration of recorded responses. Three repeated core-response profiles are retained because matching answers do not by themselves establish duplicate participation. Repeated comments require source verification before being interpreted as independently elicited qualitative testimony.
3.6. Measurement Assessment
Internal consistency is assessed with Cronbach's alpha [25]. Diagnostic composite reliability and average variance extracted are calculated from the standardized loadings of the four-factor model, with the model's estimation limitations reported alongside them [26]. Reliability of approximately 0.70 and AVE of 0.50 are used as interpretive reference points rather than automatic guarantees of validity. Reliability evaluation requires attention to model assumptions; an alternative coefficient cannot repair items that do not adequately represent distinct concepts [27].
Discriminant validity is examined using the heterotrait-monotrait ratio, with 0.85 and 0.90 treated as commonly used reference values [28]. A Gaussian maximum-likelihood CFA compares a four-factor simple structure with a one-factor diagnostic alternative. Both use standardized indicators, freely estimated residual variances, and fixed factor variances. Three starting values are used, and the four-factor correlation matrix is constrained to be positive definite through a normalized Cholesky parameterization. Fit indices are descriptive diagnostics for these ordinal survey indicators [29].
3.7. Associative and Predictive Analysis
All primary composites are standardized using the completed-record means and sample standard deviations. Two regressions estimate the awareness-appraisal relationships. A third estimates intention jointly from awareness, threat appraisal, and coping appraisal. HC3 heteroskedasticity-consistent standard errors are used, with two-sided t tests [30]. Variance inflation factors, R-squared, adjusted R-squared, and predictor-specific changes in explained variance are reported. Conventional effect-size reference points are considered cautiously because a score association is not a validated psychological effect [31].
Ten thousand row-resampling bootstrap draws estimate percentile 95% intervals for direct associations, indirect products, their sum, and the difference between the two indirect products [23,32]. Standardization is fixed to the original sample units across resamples. The difference between the coping and threat coefficients is also examined rather than inferred from their separate significance levels. Multiple testing is addressed with a conservative five-path Bonferroni sensitivity check. No retrospective power result is used to certify the model.
Prediction is evaluated using ten repetitions of ten-fold cross-validation with seed 20261001. Prespecified ordinary-least-squares models include awareness alone, both appraisals, the full model, and an exploratory appraisal interaction. Each training fold supplies its own intercept and, for the interaction, its own centering and scaling. The training-mean benchmark predicts each held-out outcome. Pooled RMSE, MAE, and a cross-validated squared-error improvement score are computed on the original scale. This is a composite-regression benchmark, not PLSpredict or blindfolding [33,34]. Prediction and explanation remain separate evaluation goals, and the repeated folds are not treated as independent new samples [35].
3.8. Ethical and Reporting Considerations
The researchers report that the 385 observations were obtained through primary survey fieldwork. Formal institutional ethics approval was not obtained because an applicable formal review mechanism was not available to the research team through their institution. The study was reported to follow internationally recognized research-ethics principles, including respect for participants, privacy, confidentiality, and responsible data handling.
4. Results
The results are presented in the order required to assess the model: record characteristics, score distributions, measurement quality, composite associations, indirect products, and prediction. All counts and statistics in this section refer to the 385 completed survey records. Favorable association estimates do not override the measurement problems reported below, and hypothesis decisions are described as exploratory associations rather than causal confirmation.
4.1. Record Audit and Profile Characteristics
The analysis contains 385 complete records, with no missing core-item values, invalid core-scale values, or duplicated IDs. No record has an identical answer across all twelve primary indicators. Three core-response profiles recur, but no basis exists for identifying them as duplicate participants. The attention-check value is 4 in all completed records, and the comments consist of ten distinct statements repeated across the file. These features are documented rather than treated as evidence of survey authenticity.
Table 2 summarizes the survey profiles most relevant to the intended research context. Its denominator is the 385 completed records, and percentages are calculated separately within each field.
The most common age category is 21-25 years, and 43.4% of profiles have Student as their current status. Undergraduate education accounts for 41.0%, while 33.2% are assigned to Dhaka. Several-times-weekly use is the most common frequency. AI-feature experience includes both users and profiles aware of features without having used them. These distributions explain why the full dataset is not labeled a student-only or confirmed-AI-user sample. They are properties of the survey dataset rather than prevalence estimates for Bangladesh.
4.2. Descriptive Statistics
The composite means are above the scale midpoint, with secure-practice intention having the highest mean and coping appraisal the lowest. Table 3 reports the distributions and the number of records whose three-item mean is at least 4. This threshold summarizes agreement in the file and is not a validated cutoff for safe behavior.
Intention averages 4.037, compared with coping appraisal at 3.690. The mean difference does not establish an individual awareness-action gap or a lack of competence, because intention and coping beliefs are different quantities. Score variation is sufficient for regression, although the concentration toward agreement limits the interpretation of small differences. The Pearson correlations among the four composites range from 0.389 to 0.467. Correlated composite scores alone do not show whether the item blocks are discriminantly valid.
4.3. Reliability and Convergent Validity
Measurement diagnostics provide the principal constraint on substantive interpretation. Table 4 presents alpha, diagnostic CFA-based composite reliability, AVE, and loading ranges. The CFA-derived quantities are reported for transparency and inherit the limitations of a four-factor solution with a boundary condition.
Alpha ranges from 0.358 to 0.466, and diagnostic composite reliability ranges from 0.427 to 0.473. AVE ranges from 0.199 to 0.232. Every block falls below the stated reliability and convergence reference points. Standardized loadings are approximately 0.403-0.550. These results do not support treating the blocks as reliable reflective measures for a confirmatory psychological test. No item is removed to manufacture acceptable values, and rho_A is not reported because a PLS model is not estimated.
4.4. Discriminant Validity and Dimensionality
To determine whether separate labels correspond to separable constructs, Table 5 reports the HTMT ratios. A value greater than one is possible for this sample-based ratio and is retained without truncation.
Five of the six ratios exceed 0.90, and the remaining ratio, CA-TA, is 0.871. Thus, none meets the stricter 0.85 reference. Ratios involving CAP exceed one, raising substantial concern about the separation of coping appraisal from the other blocks. The issue is not equivalent to predictor collinearity in regression; it concerns whether the items can distinguish theoretical concepts.
Table 6 compares the four-factor and one-factor CFA diagnostics to show why acceptable global fit does not resolve these problems.
Both specifications fit the survey covariance matrix closely. The four-factor solution produces very high factor correlations, approximately 0.861-0.973, and one correlation-parameter bound is reached. Its smallest factor-correlation eigenvalue is approximately 0.0011, indicating a nearly singular solution. The one-factor diagnostic also fits closely. Accordingly, the four-factor global indices do not establish that the theoretical constructs are distinct. Because the larger model reaches a boundary, an ordinary nested chi-square difference test is not used to declare a preferred factor structure. The Gaussian ordinal-item approximation further limits confirmatory interpretation.
4.5. Composite Associations
Despite the measurement limitations, the arithmetic composites permit a transparent regression demonstration. Table 7 combines the five direct associations with HC3 tests and percentile bootstrap intervals. A positive, non-zero interval indicates compatibility within these scores; it does not validate a latent mechanism.
Awareness is associated with threat appraisal at 0.389 and coping appraisal at 0.454. Their respective R-squared values are 0.151 and 0.206. In the joint intention equation, the awareness, threat, and coping coefficients are 0.213, 0.197, and 0.273. The equation has R-squared 0.294 and adjusted R-squared 0.289. Predictor VIFs range from 1.327 to 1.440. Predictor-specific f-squared values are 0.048, 0.041, and 0.073, respectively. All five HC3 p values remain below 0.05 after a five-test Bonferroni correction. Nevertheless, the coping-minus-threat coefficient difference of 0.076 has a bootstrap interval crossing zero, so relative superiority is not established.
4.6. Parallel Indirect Associations
Table 8 reports the two indirect products, their sum, the residual direct association, and the contrast between the indirect products. The intervals arise from joint row resampling of the complete model.
The threat indirect association is 0.077 and the coping indirect association is 0.124. Both intervals are positive. Their sum is 0.201, while the awareness-intention total association is 0.413. The contrast is 0.047, with an interval from -0.015 to 0.114. Therefore, the coping product is numerically larger without a resolved difference. The decomposition is a property of linear composite equations, not evidence that changing awareness causes a particular amount of psychological mediation. No causal mediation percentage is reported.
Figure 2 displays the indirect products and their paired contrast on the same coefficient scale. The contrast interval makes the comparative uncertainty visible without treating two separately positive effects as proof of a difference.
4.7. Prediction and Sensitivity Analyses
Table 9 compares held-out performance on the original intention scale. All specifications use identical splits, which permits a fair benchmark comparison within the survey file.
The full model has RMSE 0.400 and MAE 0.313, compared with benchmark RMSE 0.473 and MAE 0.370. Awareness alone has RMSE 0.432, and the appraisal-only model has RMSE 0.409. The full model's squared-error improvement score is 0.282. Adding the interaction yields RMSE 0.401, providing no useful improvement. The interaction coefficient is -0.021 with HC3 p = 0.614 and an R-squared increase of 0.00045.
Table 10 summarizes the scope of two further sensitivity checks alongside the baseline model. The adjusted specification includes age, grouped gender, current status, and AI-feature-experience categories. It estimates score associations rather than demographic effects on actual security behavior.
Adjustment preserves similar primary coefficients. In the 167 Student profiles, the threat coefficient is 0.136 with p = 0.052, whereas awareness and coping remain positive with smaller p values. This change indicates uncertainty under a narrower profile definition. It is not evidence of a between-group difference because no formal interaction or invariance analysis establishes one. Overall, the results demonstrate predictive and associative patterns while identifying measurement deficiencies that prevent confirmatory theoretical claims.
5. Discussion
The discussion integrates the numerical findings with the research questions and the limits of the material. Its central interpretation is that favorable regressions and useful prediction can coexist with an inadequate measurement model. The exercise therefore informs how a Cisco-oriented awareness study should be designed and interpreted, rather than determining how actual Bangladeshi students behave.
5.1. Awareness and Appraisal Pathways
Awareness is positively associated with both appraisal composites. This is compatible with the proposed theoretical ordering: recognition of security issues can accompany judgments about danger and protective capability. Protection-motivation research provides a reason to examine both processes [6,7], and security applications show that motivational judgments involve more than familiarity with a technology [8]. The current survey-score associations are consistent with this account but cannot confirm the theoretical mechanisms because the measures show weak reliability and discriminant validity.
The relationship also needs a narrower substantive interpretation. CA is a self-report-style agreement composite, not an objective cybersecurity test. A future researcher could incorrectly infer that a higher CA score means that the person identifies threats correctly. The exercise offers no basis for that inference. For Bangladesh-focused networking education, empirical measurement should combine perceived awareness with short scenario questions and practical tasks. The difference between perceived and demonstrated competence would then become a researchable question instead of an assumption embedded in the scale label.
5.2. Coping Appraisal and Protective Intention
The coping-intention coefficient is the largest of the three predictors, and the coping indirect product is larger than the threat product. This ordering is compatible with a capability-oriented educational explanation: learners may be more willing to act when they understand a protective response and feel able to complete it. Efficacy-related reasoning is well grounded theoretically [7,17]. The survey analysis therefore identifies a sensible candidate mechanism for later empirical evaluation. It does not show that coping-based training outperforms threat-based instruction.
Both relevant contrasts cross zero. The appropriate conclusion is that the current exercise cannot resolve the difference between the two appraisal pathways. Stating that coping is the strongest driver on the basis of its point estimate would conceal the uncertainty that the contrast calculation was designed to reveal. A future intervention should compare instruction conditions directly and estimate changes in validated outcomes. Such a design could establish whether procedural demonstrations increase efficacy beliefs and whether those beliefs precede observed protective action.
5.3. Residual Awareness Association and Model Coverage
The positive direct awareness-intention association remains after the appraisal composites are included. Several explanations are possible. Awareness may capture familiarity with routine precautions or guidance that is only partly reflected in the mediators. Alternatively, inadequate measurement of the appraisals may leave part of their intended content in the residual awareness association. Shared agreement tendencies and unmeasured contextual features could also contribute. The exercise cannot select among these explanations. A direct coefficient should therefore be interpreted as conditional association rather than evidence of an additional causal route.
This interpretation is relevant to theoretical integration. Research combining protection motivation with compliance and planned-behavior perspectives includes institutional and behavioral considerations that extend beyond the restricted framework [9,18]. The four-composite model is deliberately parsimonious, but parsimony does not prove sufficiency. Future work should select additional constructs through a clearly defined security task and decision setting. Adding every Cisco-workbook scale would instead risk mixing protective intentions, vendor adoption, and career readiness in a model that answers no single coherent question.
5.4. Measurement Failure and Favorable Global Fit
The low reliabilities and high HTMT ratios are the most consequential findings. They indicate that the available blocks cannot be confidently treated as distinct reflective constructs. A four-factor CFA can fit well when its factors become highly correlated, and that is what the diagnostic exercise approaches here. The nearly singular factor-correlation matrix and boundary condition reinforce the warning. A one-factor model's favorable fit does not prove a substantive general-security factor or diagnose a single source of bias. It shows that the observed covariance does not require the proposed distinctions convincingly.
This finding has an immediate methodological implication. Improving bootstrap precision, switching software, or expanding the sample would not supply missing construct meaning. The exact questionnaire, response referents, and item-development process must be evaluated first. HTMT and convergence diagnostics are intended to challenge a model when necessary [26,28]; they should not become procedural boxes checked before automatically interpreting paths. This study's measurement results warrant revisiting the instrument, not changing thresholds until it appears acceptable.
5.5. Prediction Without Theoretical Confirmation
The full model predicts the intention composite better than the training-mean and awareness-only benchmarks. This establishes an internal predictive pattern in the survey records. It is useful for evaluating the numerical contribution of the appraisal scores, but it does not show that the proposed psychological constructs are valid. Models can predict an imperfectly measured outcome, and shared response structure can improve prediction without identifying a causal mechanism. The distinction between prediction and explanation is therefore substantive rather than a difference in terminology [33].
Cross-validation strengthens the benchmark comparison by evaluating held-out records and using training-only fitting. It does not create independent external validation or overcome uncertain data provenance. An empirical extension should test prediction in a later cohort or another institution, while retaining the same measurement definitions. The interaction specification adds no performance advantage here. Retaining that null result avoids promoting a more complicated model merely because it sounds advanced. Additional complexity should earn its place through substantive justification and demonstrable performance.
5.6. Contextual and Integrated Interpretation
The student-profile analysis weakens the threat-intention estimate sufficiently for its p value to exceed 0.05. This may reflect changed score relationships, reduced precision, or both. It cannot establish that students respond differently from employed profiles. Comparable constructs and a direct group comparison would be required. Bangladesh-specific empirical research already offers distinct models of awareness and risk perception [4,5]. The current exercise complements those questions conceptually by focusing on downstream intention, while providing no representative evidence about national or institutional prevalence.
Taken together, the findings favor a restrained interpretation. Awareness and appraisals carry predictive information in the survey dataset, but the item blocks do not adequately sustain the distinct psychological meanings proposed in the diagram. The empirical associations provide a basis for instrument refinement and further testing; they should not be represented as causal evidence of protective behavior.
6. Theoretical and Practical Implications
Implications are derived at the level supported by the evidence. The survey-data analysis supports methodological recommendations and identifies educational interventions worth testing. It does not establish the effectiveness of any proposed program, the superiority of a vendor, or the behavior of university users in Bangladesh. This distinction connects the discussion to actionable research and teaching decisions.
6.1. Theoretical Implications
The first theoretical implication concerns the level of construct specification. A broad threat-appraisal score can combine severity and vulnerability, while a coping-appraisal score can combine efficacy and costs. Those components are not interchangeable. The current instrument's overlap illustrates why an appraisal label must be supported by item content and discriminant evidence. A future model should measure the relevant components separately, then determine whether a higher-order representation is justified. Doing so would improve correspondence with the theory rather than simply increasing the number of paths.
Second, competing mechanisms require direct comparison. Two positive indirect products do not imply that one mechanism dominates. The unresolved contrast in this exercise demonstrates the value of asking a comparative question and reporting its uncertainty. A future longitudinal or experimental study could evaluate whether awareness develops threat judgments, response beliefs, or both, and whether these precede protective behavior. That approach would transform an associative decomposition into a more credible investigation of a psychological process.
Third, the model's contextual boundaries are theoretical boundaries. Cisco-oriented education, personal account protection, and organizational policy compliance may involve different control over actions and different incentives. A Bangladesh-focused empirical extension should specify who can perform the action and which institutional conditions apply. AI exposure should be measured if its role is tested. It cannot become a theoretical extension merely by appearing in the title. Likewise, intention should remain separate from observed adoption until a behavior measure is included.
6.2. Educational and Managerial Implications
University educators can use the model to organize testable instructional components. One component would teach recognition of realistic networking threats; another would demonstrate a feasible protective procedure and allow supervised practice. Packet Tracer and related Cisco learning resources offer a context for practical exercises [3]. Tasks should match learner responsibilities. Administrators may practice access-control decisions in a laboratory, while ordinary users practice connection verification and account protection. Success should be defined through a task rubric rather than a favorable agreement score.
A training evaluation should record baseline knowledge, task performance, validated intention, and later behavior where ethically accessible. The proposed exercise might examine whether students can detect a suspicious request, explain why it is unsafe, and complete the protective response. These outcomes correspond to distinct learning goals and should not be collapsed automatically. Research on cybersecurity training models and case-based learning provides relevant educational approaches for designing such evaluations [37,38]. The current data do not select the best approach.
Managers should also consider whether security guidance is practical. Repeated warnings can impose decision burden, and compliance involves perceived costs [19,20]. These insights suggest testing concise guidance, clear escalation routes, and usable defaults. They do not imply that additional warnings are universally harmful or that convenience should override necessary controls. Any operational change should be evaluated with real outcome data and attention to the role in which the user acts.
6.3. Policy and Societal Implications
Institutional policy can connect learning objectives with cybersecurity risk management. NIST's Cybersecurity Framework 2.0 and its learning-program guidance provide useful reference structures for organizing responsibilities and evaluation [39,40]. Their role here is advisory, not a statement about binding requirements in Bangladesh. A future university program should evaluate locally appropriate examples and accessible teaching formats before claiming effectiveness.
At a societal level, the immediate implication is accurate evidence communication. A cross-sectional survey without an established probability sampling frame should not be reported as a nationally representative estimate. Clear provenance, transparent ethics reporting, and proportionate claims are integral to cybersecurity scholarship. Institutions can encourage these practices by emphasizing reproducibility, measurement evaluation, and interpretation rather than rewarding only statistically significant paths.
7. Conclusion Limitations and Future Research
The article closes by integrating the theoretical framework with the quantitative findings and measurement diagnostics. The 385 completed survey records provide exploratory empirical associations, while weaknesses in reliability and construct separation limit confirmatory interpretation. These conclusions motivate a stronger follow-up design.
This study develops a Cisco-oriented framework linking cybersecurity awareness with secure-practice intention through threat and coping appraisals. Analysis of 385 completed primary-survey records produces positive direct and indirect associations and better held-out prediction for the combined model than for simpler benchmarks. It also reveals low internal consistency, inadequate convergence, and extensive construct overlap. The appraisal-path contrasts remain uncertain, and an exploratory interaction offers no predictive benefit. These findings do not justify claiming validated protection-motivation mechanisms, causal effects, or observed secure adoption among Bangladeshi users.
The overall message is that quantitative analysis must evaluate measurement, association, and prediction together. A model can predict survey intention scores while remaining unsuitable for strong psychological explanation. The findings are exploratory and require validation using improved measures and independently documented field procedures.
The article contributes an exploratory empirical examination of an awareness-to-intention model with parallel appraisal pathways, direct contrasts, and cross-validation. Its focus differs from adjacent Cisco topics concerned with vendor reliability or career readiness. Its central methodological finding is that favorable coefficients, acceptable global fit, and predictive improvement can coexist with weak measurement validity. This provides a basis for stronger confirmatory investigation.
The survey workbook alone does not establish the recruitment method, fieldwork dates, informed-consent documentation, or sampling frame. The full questionnaire and adaptation history were not available in the materials reviewed. The broad appraisal scales have poor psychometric properties. CFA uses a Gaussian approximation for ordinal indicators, and the four-factor solution reaches a parameter bound. Composite regressions retain measurement error and possible shared-response structure. No observed adoption, longitudinal ordering, experimental manipulation, or external validation cohort is available. These limitations restrict population inference and causal interpretation.
Future research should begin with precisely defined security tasks and a fully documented questionnaire. Separate measures of severity, vulnerability, self-efficacy, response efficacy, and response costs would permit a closer test of protection motivation theory. Cognitive interviews, expert review, and a documented pilot should precede confirmatory data collection. Recruitment should document institutional coverage and eligibility, while analysis planning should specify primary paths, contrast tests, and prediction benchmarks before examining outcomes.
A stronger follow-up could compare threat-focused information with information plus supervised procedural practice. Measurements at multiple time points would assess whether changes in appraisals precede intention and whether intention predicts behavior. Laboratory tasks or consented security telemetry could provide performance outcomes while avoiding unnecessary personal data. Validation in a later university cohort would assess transportability. Such evidence would support more credible claims about secure networking adoption in Bangladesh.
Declarations
The following declarations distinguish the authors’ account of primary survey collection from institutional ethics review and specify the limits of the available documentation.
Author Contributions
Sidratul Muntaha Upoma: conceptualization, primary-survey research activities, data organization, formal analysis, interpretation, and original manuscript drafting. Prof. Dr Kazi Abdul Mannan: research supervision, methodological guidance, critical interpretation, manuscript review, and editing. Both authors contributed to the intellectual development of the article and are responsible for reviewing and approving the submitted version.
Funding and competing interests
No external funding or commercial sponsorship is reported for this research. The reference to Cisco identifies the educational networking context and does not imply corporate sponsorship, endorsement, or product evaluation. The authors declare no competing interests.
Ethics approval and informed consent
This research is reported by the authors as a primary, questionnaire-based survey involving 385 respondents in Bangladesh. Formal approval from an institutional ethics review board was not obtained because the researchers did not have access to an applicable formal review mechanism through their university. The researchers state that the study followed internationally recognized ethical principles for voluntary human-participant research, including respect for participants, confidentiality, privacy, and responsible handling of survey responses.
Data availability
The quantitative analysis uses 385 complete responses in the Group-9-BUS-Database-Summer 2026.xlsx workbook, described by the authors as primary survey data. Construct codes, screening criteria, analytical specifications, and aggregate findings are reported in this article. The individual-level dataset is not publicly deposited; any sharing should follow participant privacy commitments, applicable permissions, and appropriate de-identification. Data-access requests may be directed to the corresponding author, subject to these safeguards.
Appendix A. Measurement Documentation
Table A1 provides indicator-level summaries to support the reliability discussion in Section 4. It reports the available codes and does not reconstruct the administered questionnaire.

Table A1.
Indicator statistics and diagnostic standardized loadings.
| Item code | Mean | SD | Diagnostic loading |
| CA1 | 3.888 | 0.743 | 0.432 |
| CA2 | 3.847 | 0.700 | 0.457 |
| CA3 | 3.917 | 0.680 | 0.550 |
| TA1 | 3.912 | 0.731 | 0.476 |
| TA2 | 3.943 | 0.690 | 0.443 |
| TA3 | 3.901 | 0.711 | 0.450 |
| CAP1 | 3.670 | 0.713 | 0.459 |
| CAP2 | 3.660 | 0.715 | 0.437 |
| CAP3 | 3.740 | 0.757 | 0.442 |
| SPI1 | 4.060 | 0.695 | 0.499 |
| SPI2 | 4.060 | 0.695 | 0.488 |
| SPI3 | 3.992 | 0.679 | 0.403 |
Source: survey-data calculations; n = 385. Loading estimates inherit the four-factor CFA boundary limitation. The table does not provide or reconstruct questionnaire statements.
The full question wording should be obtained before an empirical instrument is finalized. Future awareness items should assess recognition without incorporating willingness to act. Threat items should separately address severity and susceptibility. Coping items should distinguish perceived response efficacy from self-efficacy and response cost. Intention items should specify an action, context, and timeframe. These are proposed design principles, not statements that were administered to the survey profiles. Language adaptation and expert review would require documentation.
Appendix B. Additional Analytical Results
Table B1 records the composite correlations so that the primary score relationships can be inspected independently of the model diagram. The matrix uses Pearson correlations and the same 385 survey records.
Table B1.
Pearson correlations of the primary composite scores.
| Composite | CA | TA | CAP | SPI |
| CA | 1.000 | 0.389 | 0.454 | 0.413 |
| TA | 0.389 | 1.000 | 0.467 | 0.407 |
| CAP | 0.454 | 0.467 | 1.000 | 0.462 |
| SPI | 0.413 | 0.407 | 0.462 | 1.000 |
Source: three-item arithmetic means for the same 385 survey records. These composite correlations differ from the item-based HTMT ratios in Table 5.
These moderate composite correlations coexist with the high HTMT ratios because the two calculations assess different quantities. The primary-score VIFs therefore cannot be substituted for discriminant-validity evidence. For a model with three intention predictors, f-squared is the difference between full and reduced R-squared divided by one minus full R-squared. For the cross-validation benchmark, the reported improvement is one minus the full model's held-out squared-error sum divided by the training-mean benchmark's held-out squared-error sum. It is denoted Q-squared CV for this exercise and is not a blindfolding statistic.
Appendix C. Reproducibility and Source Alignment
The input workbook is preserved and screened on the twelve primary item columns. The analytical seed is 20261001, with 10,000 bootstrap draws and 100 cross-validation splits. Each coefficient interval uses the 2.5th and 97.5th percentiles. HC3 tests use residual degrees of freedom. The CFA uses sample-standardized indicators and the sample covariance matrix; its reported SRMR uses off-diagonal standardized residuals. Standardized beta values in the subgroup analysis retain the full-sample scale, permitting inspection of coefficient sensitivity without implying measurement invariance.
The audit identifies 400 reserved IDs, 385 completed records, and fifteen unused slots corresponding to IDs 386-400. No missing-value imputation, reverse coding, or item deletion is performed. Gender categories with very small counts are combined as Other or undisclosed in the adjusted model to avoid a singleton category producing a leverage-one observation and undefined HC3 inference. The adjusted model includes four age contrasts, two gender contrasts, three current-status contrasts, and three AI-experience contrasts.
The study focuses on cybersecurity awareness, appraisal, and secure-practice intention in a Cisco-oriented educational context.
The workbook Codebook supplies the primary construct labels and 1-5 agreement coding. The Data Entry sheet supplies the numerical records and profile categories. The source file checksum is recorded in the analysis audit to distinguish this workbook snapshot from later revisions. No change to the supplied observations is required to reproduce the reported calculations.
References
- National Cyber Security Centre. The near-term impact of AI on the cyber threat, 2024. Available online: https://www.ncsc.gov.uk/report/impact-of-ai-on-cyber-threat.
- National Cyber Security Centre, Impact of AI on cyber threat from now to 2027, 2025. Available online: https://www.ncsc.gov.uk/report/impact-ai-cyber-threat-now-2027.
- Cisco Networking Academy, What is Cisco Packet Tracer. Available online: https://www.netacad.com/cisco-packet-tracer (accessed on Oct. 1 2026).
- Ahamed, B.; et al. Empowering students for cybersecurity awareness management in the emerging digital era: The role of cybersecurity attitude in the 4.0 industrial revolution era. SAGE Open 2024, vol. 14(no. 1). [Google Scholar] [CrossRef]
- Ahamed, B.; Polas, M. R. H.; Falahat, M.; Karim, R.; Tabash, M. I. Cybersecurity knowledge, social networking, and awareness among Gen Z university students. Discov. Educ. 2026, vol. 5(no. 77). [Google Scholar] [CrossRef]
- Rogers, R. W. A protection motivation theory of fear appeals and attitude change. J. Psychol. 1975, vol. 91(no. 1), 93–114. [Google Scholar] [CrossRef] [PubMed]
- Maddux, J. E.; Rogers, R. W. Protection motivation and self-efficacy: A revised theory of fear appeals and attitude change. J. Exp. Soc. Psychol. 1983, vol. 19(no. 5), 469–479. [Google Scholar] [CrossRef]
- Johnston, C.; Warkentin, M. Fear appeals and information security behaviors: An empirical study. MIS Q. 2010, vol. 34(no. 3), 549–566. Available online: https://aisel.aisnet.org/misq/vol34/iss3/10/. [CrossRef]
- Herath, T.; Rao, H. R. Protection motivation and deterrence: A framework for security policy compliance in organisations. Eur. J. Inf. Syst. 2009, vol. 18(no. 2), 106–125. [Google Scholar] [CrossRef]
- Bulgurcu, B.; Cavusoglu, H.; Benbasat, I. Information security policy compliance: An empirical study of rationality-based beliefs and information security awareness. MIS Q. 2010, vol. 34(no. 3), 523–548. [Google Scholar] [CrossRef]
- Parsons, K.; McCormac, A.; Butavicius, M.; Pattinson, M.; Jerram, C. Determining employee awareness using the Human Aspects of Information Security Questionnaire (HAIS-Q). Comput. Secur. 2014, vol. 42, 165–176. [Google Scholar] [CrossRef]
- Parsons, K.; et al. The Human Aspects of Information Security Questionnaire (HAIS-Q): Two further validation studies. Comput. Secur. 2017, vol. 66, 40–51. [Google Scholar] [CrossRef]
- Egelman, S.; Peer, E. Scaling the security wall: Developing a Security Behavior Intentions Scale (SeBIS). Proceedings of CHI 2015, 2015; pp. 2873–2882. [Google Scholar] [CrossRef]
- Boss, S. R.; Galletta, D. F.; Lowry, P. B.; Moody, G. D.; Polak, P. What do systems users have to fear? Using fear appeals to engender threats and fear that motivate protective security behaviors. MIS Q. 2015, vol. 39(no. 4), 837–864. [Google Scholar] [CrossRef]
- Mou, J.; Cohen, J. F.; Bhattacherjee, A.; Kim, J. A test of protection motivation theory in the information security literature: A meta-analytic structural equation modeling approach. J. Assoc. Inf. Syst. 2022, vol. 23(no. 1), 196–236. [Google Scholar] [CrossRef]
- Ajzen. The theory of planned behavior. Organ. Behav. Hum. Decis. Process. 1991, vol. 50(no. 2), 179–211. [Google Scholar] [CrossRef]
- Bandura. Self-efficacy: Toward a unifying theory of behavioral change. Psychol. Rev. 1977, vol. 84(no. 2), 191–215. [Google Scholar] [CrossRef] [PubMed]
- Ifinedo, P. Understanding information systems security policy compliance: An integration of the theory of planned behavior and the protection motivation theory. Comput. Secur. 2012, vol. 31(no. 1), 83–95. [Google Scholar] [CrossRef]
- Stanton, B.; Theofanos, M. F.; Prettyman, S. S.; Furman, S. Security fatigue. IT Prof. 2016, vol. 18(no. 5), 26–32. [Google Scholar] [CrossRef] [PubMed]
- Beautement, A.; Sasse, M. A.; Wonham, M. The compliance budget: Managing security behaviour in organisations. In Proceedings of the New Security Paradigms Workshop, 2008; pp. 47–58. [Google Scholar] [CrossRef]
- Hasan, M.; Sampa, M. A.; Mahmud, M. K. Understanding cybersecurity awareness among students in Bangladesh: A data-driven approach. Soc. Sustain. 2025, vol. 7(no. 1), 67–76. [Google Scholar] [CrossRef]
- Zwilling, M.; Klien, G.; Lesjak, D.; Wiechetek, L.; Cetin, F.; Basim, H. N. Cyber security awareness, knowledge and behavior: A comparative study. J. Comput. Inf. Syst. 2022, vol. 62(no. 1), 82–97. [Google Scholar] [CrossRef]
- Preacher, J.; Hayes, A. F. Asymptotic and resampling strategies for assessing and comparing indirect effects in multiple mediator models. Behav. Res. Methods 2008, vol. 40(no. 3), 879–891. [Google Scholar] [CrossRef] [PubMed]
- Maxwell, S. E.; Cole, D. A. Bias in cross-sectional analyses of longitudinal mediation. Psychol. Methods 2007, vol. 12(no. 1), 23–44. [Google Scholar] [CrossRef] [PubMed]
- Cronbach, J. Coefficient alpha and the internal structure of tests. Psychometrika 1951, vol. 16, 297–334. [Google Scholar] [CrossRef]
- Fornell, C.; Larcker, D. F. Evaluating structural equation models with unobservable variables and measurement error. J. Mark. Res. 1981, vol. 18(no. 1), 39–50. [Google Scholar] [CrossRef]
- Dunn, T. J.; Baguley, T.; Brunsden, V. From alpha to omega: A practical solution to the pervasive problem of internal consistency estimation. Br. J. Psychol. 2014, vol. 105(no. 3), 399–412. [Google Scholar] [CrossRef] [PubMed]
- Henseler, J.; Ringle, C. M.; Sarstedt, M. A new criterion for assessing discriminant validity in variance-based structural equation modeling. J. Acad. Mark. Sci. 2015, vol. 43, 115–135. [Google Scholar] [CrossRef]
- Hu; Bentler, P. M. Cutoff criteria for fit indexes in covariance structure analysis: Conventional criteria versus new alternatives. Struct. Equ. Model. 1999, vol. 6(no. 1), 1–55. [Google Scholar] [CrossRef]
- MacKinnon, J. G.; White, H. Some heteroskedasticity-consistent covariance matrix estimators with improved finite sample properties. J. Econom. 1985, vol. 29(no. 3), 305–325. [Google Scholar] [CrossRef]
- Cohen, J. Statistical Power Analysis for the Behavioral Sciences, 2nd ed.; Lawrence Erlbaum Associates: Hillsdale, NJ, 1988. [Google Scholar]
- Efron, B. Bootstrap methods: Another look at the jackknife. Ann. Stat. 1979, vol. 7(no. 1), 1–26. [Google Scholar] [CrossRef]
- Shmueli, G. To explain or to predict? Stat. Sci. 2010, vol. 25(no. 3), 289–310. [Google Scholar] [CrossRef]
- Shmueli, G.; et al. Predictive model assessment in PLS-SEM: Guidelines for using PLSpredict. Eur. J. Mark. 2019, vol. 53(no. 11), 2322–2347. [Google Scholar] [CrossRef]
- Varma, S.; Simon, R. Bias in error estimation when using cross-validation for model selection. BMC Bioinform. 2006, vol. 7(no. 91). [Google Scholar] [CrossRef] [PubMed]
- Podsakoff, P. M.; MacKenzie, S. B.; Lee, J. Y.; Podsakoff, N. P. Common method biases in behavioral research: A critical review of the literature and recommended remedies. J. Appl. Psychol. 2003, vol. 88(no. 5), 879–903. [Google Scholar] [CrossRef] [PubMed]
- Taherdoost, H. Towards an innovative model for cybersecurity awareness training. Information 2024, vol. 15(no. 9, Art. no. 512). [Google Scholar] [CrossRef]
- Anderson, A.; Ahmad, A.; Chang, S. Case-based learning for cybersecurity leaders: A systematic review and research agenda. Inf. Manag. 2024, vol. 61(no. 5). [Google Scholar] [CrossRef]
- National Institute of Standards and Technology. The NIST Cybersecurity Framework CSF 2.0, NIST CSWP 29, 2024. [CrossRef]
- Merritt, M.; et al. Building a Cybersecurity and Privacy Learning Program, NIST SP 800-50 Rev. 1, 2024. [CrossRef]
Figure 1.
Proposed awareness appraisal and intention framework. Solid arrows represent hypotheses for score associations. The dashed double-headed connection allows appraisal residual covariance. H6 and H7 are path products. AI and Cisco identify context; actual adoption is not measured. The upper branch of Figure 1 represents H1 and H3: awareness is associated with threat appraisal, and threat appraisal is associated with intention after awareness and coping appraisal are included. The lower branch represents H2 and H4 under the corresponding conditional interpretation. H5 is the retained direct path. H6 is the product of H1 and H3, and H7 is the product of H2 and H4. The model allows the unexplained portions of the two appraisals to covary, rather than claiming that they are unrelated simply because they appear on separate branches. No serial arrow links the two appraisals. The figure's limits are explicit. AI is contextual; Cisco identifies the educational orientation; intention is the measured endpoint. Product performance, AI effects, and actual adoption are not estimated. The methods now evaluate whether the item blocks can support this restricted framework.
Figure 1.
Proposed awareness appraisal and intention framework. Solid arrows represent hypotheses for score associations. The dashed double-headed connection allows appraisal residual covariance. H6 and H7 are path products. AI and Cisco identify context; actual adoption is not measured. The upper branch of Figure 1 represents H1 and H3: awareness is associated with threat appraisal, and threat appraisal is associated with intention after awareness and coping appraisal are included. The lower branch represents H2 and H4 under the corresponding conditional interpretation. H5 is the retained direct path. H6 is the product of H1 and H3, and H7 is the product of H2 and H4. The model allows the unexplained portions of the two appraisals to covary, rather than claiming that they are unrelated simply because they appear on separate branches. No serial arrow links the two appraisals. The figure's limits are explicit. AI is contextual; Cisco identifies the educational orientation; intention is the measured endpoint. Product performance, AI effects, and actual adoption are not estimated. The methods now evaluate whether the item blocks can support this restricted framework.
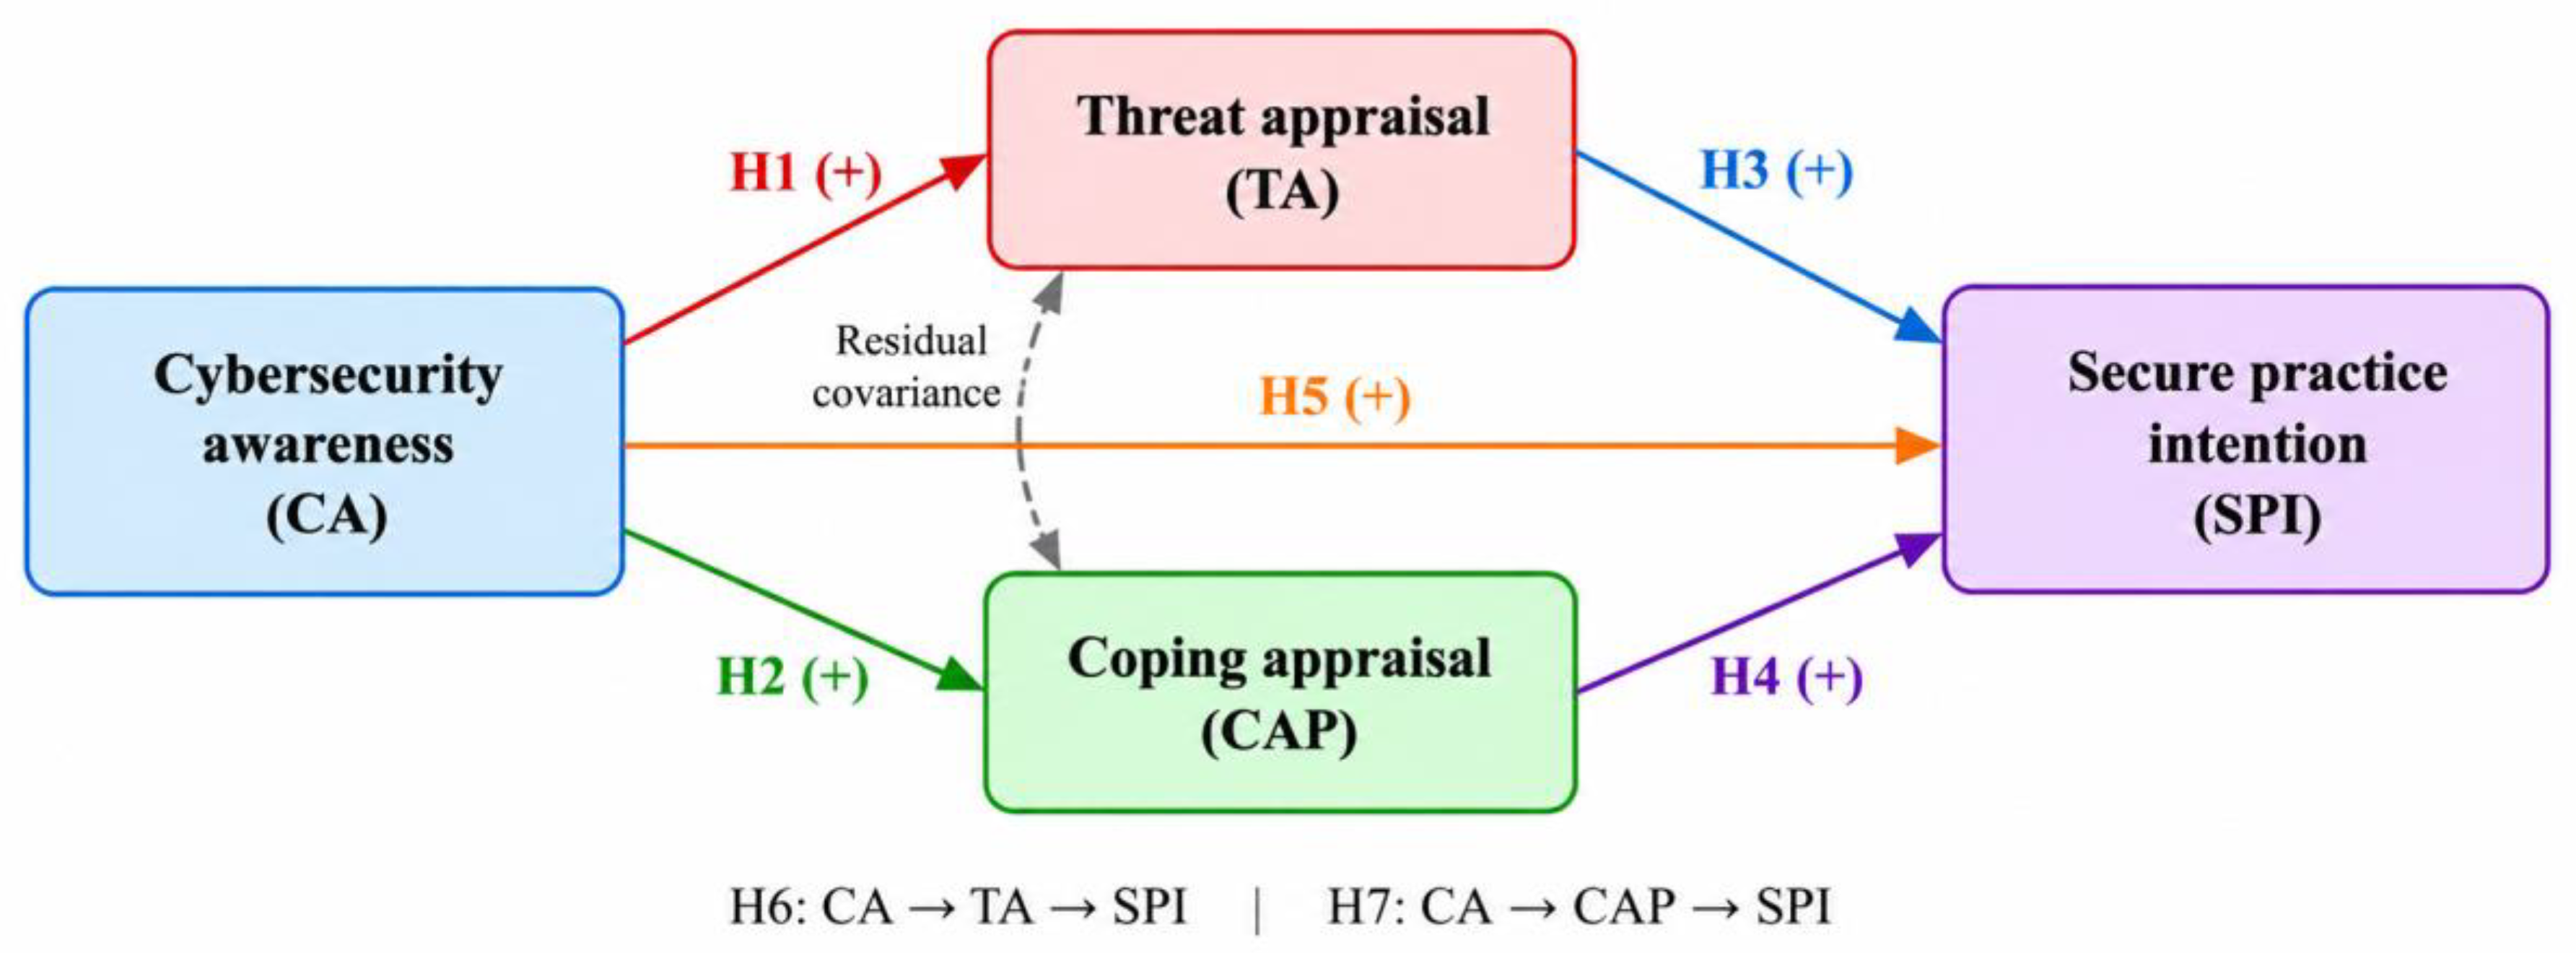
Figure 2.
Bootstrap intervals for indirect products and their contrast. Points are estimates and horizontal bars are percentile 95% intervals from 10,000 row-resampling draws. The dashed vertical line marks zero. Survey-data products do not establish psychological mediation. Both pathway intervals lie above zero, while the contrast interval includes zero. The figure therefore supports describing two positive survey-score products and an unresolved ordering, subject to the measurement constraints already established.
Figure 2.
Bootstrap intervals for indirect products and their contrast. Points are estimates and horizontal bars are percentile 95% intervals from 10,000 row-resampling draws. The dashed vertical line marks zero. Survey-data products do not establish psychological mediation. Both pathway intervals lie above zero, while the contrast interval includes zero. The figure therefore supports describing two positive survey-score products and an unresolved ordering, subject to the measurement constraints already established.
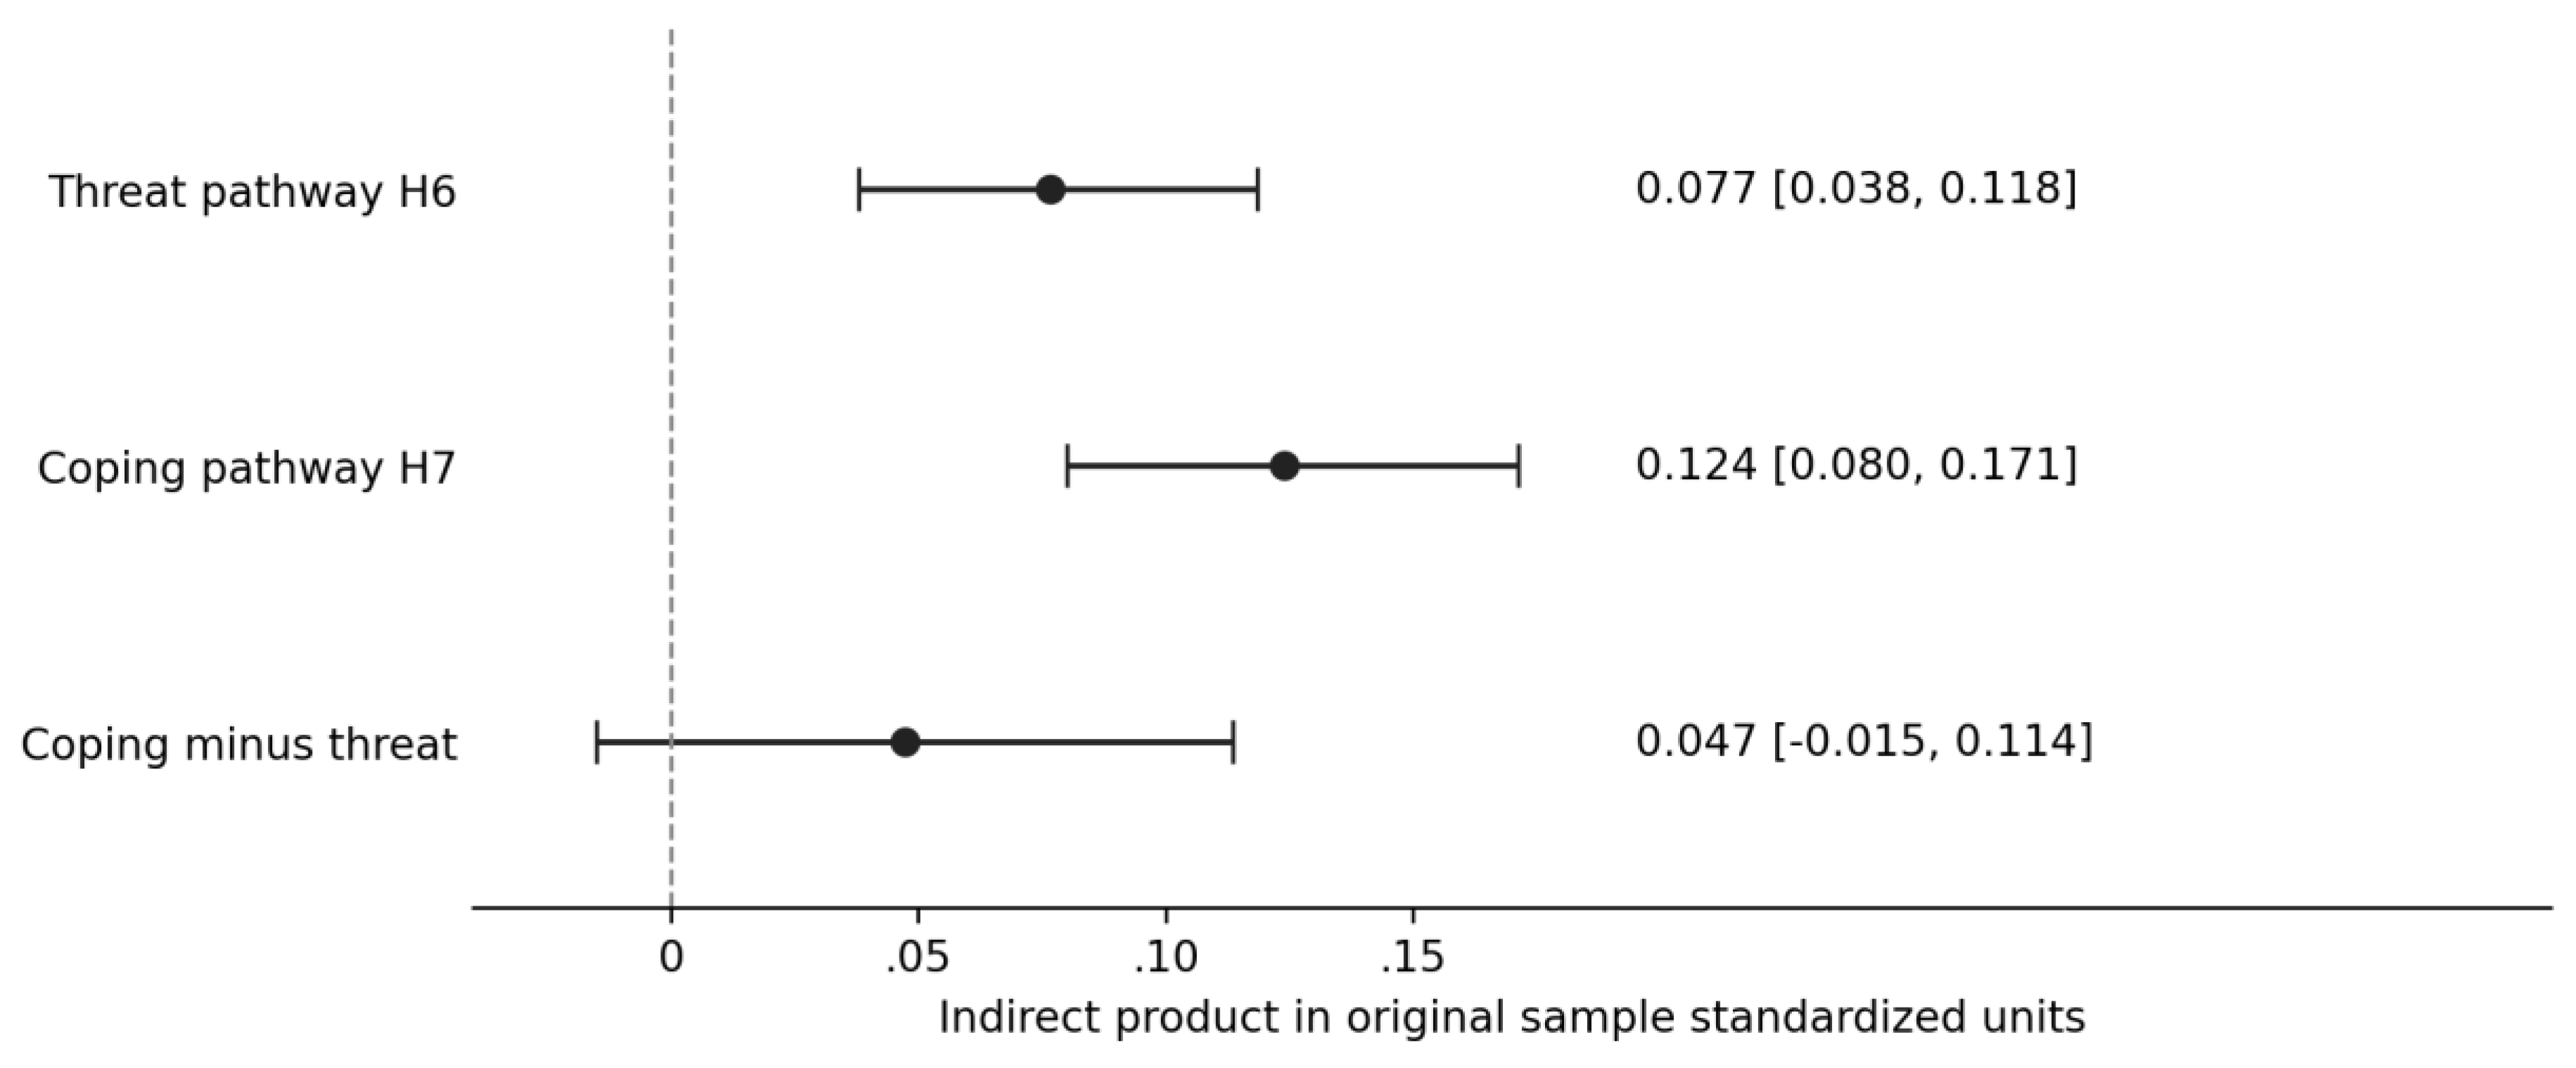
Table 1.
Primary constructs item codes and conceptual grounding.
| Construct | Codes | Statistical role | Grounding and provenance |
| Cybersecurity awareness | CA1-CA3 | Antecedent composite | Workbook Codebook rows 10-12; conceptual grounding in [10,11]. |
| Threat appraisal | TA1-TA3 | Parallel appraisal composite | Codebook rows 13-15; theoretical grounding in [6,8]. |
| Coping appraisal | CAP1-CAP3 | Parallel appraisal composite | Codebook rows 16-18; theoretical grounding in [7,17]. |
| Secure practice intention | SPI1-SPI3 | Outcome composite | Codebook rows 19-21; intention distinction informed by [13,16]. |
Source: Group 9 workbook and cited literature. Each composite averages three five-point items. Conceptual references do not establish item adaptation or validation.
Table 2.
Demographic and usage categories of completed survey records.
| Field | Category | n | % |
| Age | 21-25 | 161 | 41.8 |
| 26-30 | 93 | 24.2 | |
| 31-40 | 61 | 15.8 | |
| 18-20 | 46 | 11.9 | |
| 41 or above | 24 | 6.2 | |
| Gender | Male | 247 | 64.2 |
| Female | 131 | 34.0 | |
| Other or undisclosed | 7 | 1.8 | |
| Current status | Student | 167 | 43.4 |
| Employed | 134 | 34.8 | |
| Self-employed/Freelancer | 63 | 16.4 | |
| Other | 21 | 5.5 | |
| Education | Undergraduate | 158 | 41.0 |
| Graduate | 113 | 29.4 | |
| Postgraduate | 101 | 26.2 | |
| Other | 13 | 3.4 | |
| Use frequency | Several times/week | 149 | 38.7 |
| Daily | 111 | 28.8 | |
| Weekly | 69 | 17.9 | |
| Less often | 56 | 14.5 | |
| AI feature experience | Occasional user | 168 | 43.6 |
| Aware but not used | 99 | 25.7 | |
| Regular user | 84 | 21.8 | |
| Not sure/not aware | 34 | 8.8 | |
| Location | Dhaka | 128 | 33.2 |
| Other listed locations | 257 | 66.8 |
Source: workbook calculations; n = 385 survey records. Gender categories are grouped for display; full categories remain in the source. Percentages within each field may differ from 100 by rounding.
Table 3.
Descriptive statistics of primary composites.
| Composite | Mean | SD | Min | Max | Mean ≥ 4 n (%) |
| CA | 3.884 | 0.492 | 2.667 | 5.000 | 215 (55.8) |
| TA | 3.919 | 0.486 | 2.333 | 5.000 | 222 (57.7) |
| CAP | 3.690 | 0.482 | 2.667 | 5.000 | 159 (41.3) |
| SPI | 4.037 | 0.472 | 2.333 | 5.000 | 265 (68.8) |
Source: calculations on 385 survey records. Scores are three-item means on a 1-5 scale; the agreement threshold is descriptive.
Table 4.
Internal consistency and diagnostic convergence assessment.
| Block | Alpha | Diagnostic CR | Diagnostic AVE | Loading range |
| CA | 0.466 | 0.473 | 0.232 | 0.432-0.550 |
| TA | 0.429 | 0.441 | 0.208 | 0.443-0.476 |
| CAP | 0.358 | 0.427 | 0.199 | 0.437-0.459 |
| SPI | 0.432 | 0.451 | 0.216 | 0.403-0.499 |
Source: calculations on survey records. CR and AVE derive from a four-factor diagnostic CFA with a correlation-parameter boundary; they are not validated PLS estimates. All blocks fall below the stated reference values.
Table 5.
Heterotrait monotrait ratios among primary constructs.
| Block | CA | TA | CAP | SPI |
| CA | — | |||
| TA | 0.871 | — | ||
| CAP | 1.109 | 1.185 | — | |
| SPI | 0.926 | 0.945 | 1.174 | — |
Source: survey-item correlations. The lower triangle is shown. Reference values of 0.85 and 0.90 are discussed in the text; ratios exceeding one are retained.
Table 6.
Factor structure diagnostics and global fit.
| Model | Chi square | df | CFI | RMSEA | SRMR |
| Four factors | 50.584 | 48 | 0.995 | 0.012 | 0.036 |
| One factor | 52.998 | 54 | 1.000 | 0.000 | 0.036 |
Source: Gaussian ML diagnostics on standardized survey indicators. Four-factor p = 0.372; one-factor p = 0.513. SRMR uses off-diagonal residuals. Four-factor latent correlations are 0.861-0.973, with a parameter boundary and nearly singular correlation matrix.
Table 7.
Standardized direct associations and hypothesis compatibility.
| Hypothesis and path | Beta | HC3 t | p | Bootstrap 95% CI | Assessment |
| H1 CA → TA | 0.389 | 8.328 | < .001 | [0.298, 0.480] | Positive score association |
| H2 CA → CAP | 0.454 | 10.617 | < .001 | [0.372, 0.535] | Positive score association |
| H3 TA → SPI | 0.197 | 4.154 | < .001 | [0.102, 0.289] | Positive score association |
| H4 CAP → SPI | 0.273 | 5.601 | < .001 | [0.178, 0.369] | Positive score association |
| H5 CA → SPI | 0.213 | 4.152 | < .001 | [0.116, 0.313] | Positive score association |
Source: composite regressions on 385 survey records. Two-sided HC3 tests and 10,000-resample percentile intervals. Results are compatible with H1-H5 in the survey scores; theoretical confirmation is precluded by measurement deficiencies.
Table 8.
Parallel indirect associations and paired contrast.
| Association | Estimate | Bootstrap 95% CI | Assessment |
| H6 CA → TA → SPI | 0.077 | [0.038, 0.118] | Positive product |
| H7 CA → CAP → SPI | 0.124 | [0.080, 0.171] | Positive product |
| Total indirect | 0.201 | [0.145, 0.259] | Positive sum |
| Residual direct CA → SPI | 0.213 | [0.116, 0.313] | Positive conditional association |
| H7 minus H6 | 0.047 | [-0.015, 0.114] | Difference unresolved |
Source: 10,000 row bootstrap draws; seed 20261001. Coefficients use fixed original-sample standardization. Products do not establish causal mediation or adoption.
Table 9.
Repeated cross validation performance of intention models.
| Model | RMSE | MAE | Q squared CV |
| Training mean benchmark | 0.473 | 0.370 | 0.000 |
| Awareness only | 0.432 | 0.341 | 0.166 |
| Two appraisals | 0.409 | 0.320 | 0.252 |
| Awareness and appraisals | 0.400 | 0.313 | 0.282 |
| Full model and interaction | 0.401 | 0.313 | 0.279 |
Source: ten repetitions of ten-fold cross-validation, with identical splits; 3,850 held-out predictions per model. Errors are on the 1-5 composite scale. Q squared CV is squared-error improvement relative to the fold training-mean benchmark; it is not blindfolding Q squared.
Table 10.
Sensitivity of the primary intention equation.
| Specification | n | CA beta | TA beta | CAP beta | R squared |
| Baseline | 385 | 0.213 | 0.197 | 0.273 | 0.294 |
| Adjusted categories | 385 | 0.223 | 0.201 | 0.273 | 0.305 |
| Student profiles | 167 | 0.311 | 0.136 | 0.248 | 0.301 |
Source: survey-composite regressions. Adjustment includes age, grouped gender, status, and AI-feature experience. Student-profile coefficients use full-sample scaling. Student TA p = 0.052; no between-group difference or measurement invariance is established.
Disclaimer/Publisher’s Note: The statements, opinions and data contained in all publications are solely those of the individual author(s) and contributor(s) and not of MDPI and/or the editor(s). MDPI and/or the editor(s) disclaim responsibility for any injury to people or property resulting from any ideas, methods, instructions or products referred to in the content. |
© 2026 by the authors. Licensee MDPI, Basel, Switzerland. This article is an open access article distributed under the terms and conditions of the Creative Commons Attribution (CC BY) license (http://creativecommons.org/licenses/by/4.0/).
Copyright: This open access article is published under a Creative Commons CC BY 4.0 license, which permit the free download, distribution, and reuse, provided that the author and preprint are cited in any reuse.