

Submitted:
15 October 2026
Posted:
16 October 2026
You are already at the latest version
Abstract
Steel platforms carrying construction traffic are subjected to repeated moving loads, while their structural response is commonly assessed through periodic inspection rather than continuous measurement. This study presents an Internet of Things (IoT)-enabled framework for monitoring the operational strain response of a sloped steel platform subjected to repeated haul-truck movements. Fifteen vibrating wire strain gauges (VWSGs) were installed on selected rafters, longitudinal members, columns, and diagonal braces. Time-stamped strain measurements were transmitted through a TH-RTU-C IoT gateway and a 4G network to a cloud-based monitoring platform and linked to a sensor-driven digital shadow. An event-preserving processing framework was applied to separate slowly varying strain components from truck-induced transient strain increments and to identify candidate loading events from temporally coordinated multi-sensor responses. A time-stamped field photograph independently documented a reference truck event. Complete-duration event-level distributions showed a strongly nonuniform but recurring spatial response pattern, with these three channels consistently exhibiting the largest local strain increments. The documented event provided a physical reference for interpreting the broader candidate-event distributions observed during routine operation. The sensor-driven digital shadow integrates platform geometry, VWSG locations, near-real-time strain histories, historical event review, and local strain-demand indicators. The interface allows monitored responses to be compared with adopted engineering strain limits and visualized using Normal, Attention, and Critical operational states. The results show that event-level statistical characterization and IoT data transmission can establish operational strain-response envelopes, identify governing monitored locations, and convert continuous strain measurements into operationally interpretable information for steel structures.
Keywords:
steel platform
; vibrating wire strain gauge (VWSG)
; Internet of Things
; structural health monitoring
; haul-truck loading
; event-level strain response
; digital shadow
; construction safety monitoring
; intelligent safety assessment
1. Introduction
Steel platforms are widely constructed on large-scale earthwork, tunnelling, and foundation sites to provide working surfaces and transportation routes for heavy construction vehicles where permanent access is unavailable or impractical [1,2]. During operation these platforms are subjected to repeated moving loads whose magnitude, speed, and transverse position may vary between successive vehicle passages. The resulting structural response is spatially nonuniform and may include short-duration strain transients that are difficult to capture through periodic visual inspection alone. Unlike permanent bridges and buildings, steel platforms are designed for a limited-service life, are often rapidly assembled under tight construction schedules, and may be modified or relocated as site conditions change. Their structural performance under repeated heavy-vehicle loading may therefore benefit from continuous monitoring as a supplement to conventional periodic inspection [3,4]. Related construction-stage research has also demonstrated the use of active-control systems to maintain structural stability during segmental erection [5], the present study is limited to monitoring and does not implement active structural control.
Structural health monitoring (SHM) provides a complementary approach to periodic inspection by continuously measuring structural responses and transforming them into quantitative information that can support condition assessment and operational decision-making. SHM has evolved from isolated sensor measurements toward integrated systems that combine sensing, signal processing, statistical interpretation, and engineering assessment [6,7,8,9]. Farrar and Worden [6] formalized SHM as a pattern-recognition problem encompassing operational evaluation, data acquisition, feature extraction, and statistical modelling. Brownjohn reviewed [7] applications to civil infrastructure and emphasized the need for long-term continuous data to distinguish damage-related changes from normal operational variability. Ko and Ni [8] demonstrated the scale of SHM deployments on large bridges, whereas Spencer et al. [9] highlighted the role of smart sensing technology in enabling distributed, scalable monitoring.
The emergence of wireless sensor networks and the Internet of Things (IoT) has significantly expanded the scope and practical feasibility of civil-infrastructure monitoring. Early wireless SHM studies demonstrated that distributed sensor nodes could substantially reduce cabling requirements and support scalable data acquisition from multiple structural locations [10,11,12,13]. Lynch and Loh [10]provided one of the first comprehensive reviews of wireless sensors and networks for SHM, identifying communication reliability, power management, and data synchronization as key challenges. Kim et al. [11] and Pakzad and Fenves [12] demonstrated wireless sensor network deployments on bridges with hundreds of sensors, whereas Whelan and Janoyan [13] developed high-rate wireless platforms capable of capturing dynamic structural responses. Subsequent IoT-based frameworks incorporated communication gateways, remote databases, cloud or fog computing, automated data processing, and web-based visualization [14,15,16]. Recent developments optimized data-acquisition strategies for constructing three-dimensional deformation fields [17] and data-driven prediction of temporal faults in industrial equipment [18], reflecting the broader movement toward automated interpretation of continuous monitoring data.
Tokognon, Gao [14] surveyed IoT-based SHM architecture and identified interoperability, data security, and real-time processing as critical requirements. Mishra et al. [15] reviewed IoT-enabled SHM for civil structures and noted that most implementations focused on permanent infrastructure rather than modular structures. More recently, Hassan et al. [16] proposed integrated fog–cloud architectures for distributing real-time data-acquisition and computational tasks. Despite these advances, a practical IoT monitoring system must address data quality, synchronization, transmission continuity, sensor malfunction, and the distinction between statistically unusual measurements and structural responses that approach an engineering limit.
Recent research in transportation, industrial monitoring, and sensing demonstrates the increasing use of data acquisition, artificial intelligence, and connected-system technologies to characterize complex operating conditions. Within transportation systems, tachograph measurements, field sensing, computer vision, and spatial data mining have been applied to accident-scenario reconstruction, characterization of train-induced environmental conditions, obstacle detection, vehicle recognition, and identification of crash clusters [19,20,21,22,23]. Artificial-intelligence and data-driven methods have also been applied to vision-based safety inspection, driver-state monitoring, hybrid-variable process monitoring, prediction of dynamic stress–strain behaviour, multi-sensor fault diagnosis, and temporal-fault prediction [18,24,25].
Complementary developments in sensing and data acquisition include flexible omnidirectional strain sensors, physics-informed calibration of sensor arrays, optimized acquisition of three-dimensional deformation fields, guided-wave defect localization, pressure-sensor-array interpretation, and fibre-optic detection of mechanical stress waves [17,26,27,28,29,30]. Connected vehicle–road–cloud architectures have further demonstrated the integration of distributed communication and computational-resource management [31]. These studies illustrate the broader shift toward multi-sensor acquisition, automated interpretation, and connected monitoring environments. In the present study, direct strain measurement was selected because it provides a quantitative indication of the local structural response associated with repeated haul-truck loading.
Strain measurements are particularly useful for monitoring vehicle-induced structural responses because they provide a direct local indication of deformation at the instrumented location. Recent flexible-sensor research has demonstrated the feasibility of decoupled omnidirectional strain measurement [26], although these sensors were developed for applications other than long-term monitoring of civil structures. Among the available strain-sensing technologies, vibrating-wire strain gauges (VWSGs) have been widely applied to steel and concrete structures for long-term field monitoring because of their reported long-term stability, resistance to electromagnetic interference, and suitability for harsh construction environments [26,32,33,34,35]. Park et al. [32] demonstrated the practical application of wireless VWSGs to mega-truss monitoring, while Glisic [34] provided a historical overview of strain-sensing technologies spanning a century of civil-engineering applications. Lee and Park [33] developed methods for extracting maximum strain from VWSG measurements on steel beams, and Neild et al. [35] extended VWSG applications to small-strain measurements in concrete. Long-term strain records have also been used to investigate fatigue-sensitive bridge details and relationships between structural response and environmental variation [36,37].
Strain-based monitoring under moving vehicles has been studied extensively in the context of bridge weigh-in-motion systems. Beginning with the instrumented-bridge method proposed by Moses [38], subsequent studies developed long-term implementations, simplified field procedures, flexural- and shear-strain approaches, and algorithms for estimating gross vehicle or axle weights [39,40]. Yu et al. [40] provided a state-of-the-art review of bridge weigh-in-motion technology, summarizing the importance of sensor location, influence-line calibration, vehicle speed, axle configuration, and multiple-vehicle presence. Measured traffic data have also been used to construct probabilistic live-load models and estimate extreme bridge-load effects [41,42].These studies demonstrate the value of structural strain measurements for characterizing moving loads; however, full B-WIM identification generally requires calibrated influence lines, known or estimated vehicle speeds, and sufficient sensor coverage. The present study does not attempt to estimate truck weight or axle load. Instead, it focuses on detecting and statistically characterizing local transient strain increments associated with candidate truck-passage events on a sloped steel platform.
A major difficulty in long-term strain monitoring is separating load-induced responses from slowly varying environmental and operational components. Temperature changes, sensor drift, gradual structural movement, and variations in operating conditions can produce baseline fluctuations that are comparable to or larger than the short-duration responses of interest. Previous SHM research has examined a range of techniques for addressing this challenge, including environmental normalization[43], outlier analysis [44], autoregressive modelling [45], cointegration [46], regime-switching models [47], and missing-data approaches [48]. Sohn [49] provided a comprehensive discussion of the effects of environmental and operational variability on SHM data interpretation. Robust statistical estimators are especially valuable in this context because short loading events appear as sparse, high-amplitude observations within much longer quiet records. The median absolute deviation (MAD) provides a resistant measure of background variability that is substantially less affected by isolated peaks than the conventional standard deviation [50]. Accordingly, calculating statistics directly from all baseline-corrected samples may be misleading: long quiet periods force the mean and median toward zero, while the engineering information associated with truck loading remains concentrated in the distribution tails. A more meaningful analysis can be obtained through two linked stages: MAD-standardized multi-sensor characterization of the documented reference event and channel-specific extraction of signed, reference-consistent peaks from the complete monitoring record.
The integration of monitoring data with a geometric or information representation of the physical asset is increasingly discussed within the digital-twin research community. Existing classifications distinguish digital models, digital shadows, and digital twins according to the direction and degree of data exchange between the physical and virtual systems [51]. Civil-engineering studies have extended this concept through semantic information models[52], construction information systems[53], sensor assimilation and probabilistic state updating [54,55], predictive maintenance [56], and structural decision support [57]. Sakr and Sadhu [58] demonstrated the integration of IoT and building information modelling for visualizing structural measurements in web-based environments. In the present system, data are transferred from the monitored platform to the digital representation, but the virtual representation does not automatically control or modify the physical structure. The interface is therefore described as a sensor-driven digital shadow rather than a fully bidirectional digital twin.
Despite these advances, continuous monitoring of steel platforms presents several technical challenges. First, short-duration vehicle-related strain increments must be separated from slowly varying environmental effects, baseline drift, and operational variability. Second, coordinated structural responses must be distinguished from isolated sensor disturbances and missing or unreliable measurements. Third, the 9 s sampling interval and the absence of continuous vehicle records limit axle-level response characterization and definitive identification of every loading source. Fourth, conventional sample-wise statistics are dominated by long quiet periods and may obscure the relatively sparse event-response population. These challenges require an event-preserving, multi-sensor framework that maintains a clear distinction between statistical event-screening criteria and project-specific engineering limits.
Accordingly, this study develops an IoT-enabled VWSG framework for near-real-time monitoring and event-level assessment of a sloped steel platform carrying haul trucks. The specific objectives are to: (1) separate transient strain increments from slowly varying baseline behaviour; (2) characterize the documented reference event using MAD-standardized multi-sensor responses and use its amplitudes to screen the complete monitoring record; (3) construct channel-wise distributions using peak increment per event and sensor; and (4) integrate the monitoring results into a sensor-driven digital shadow for visualization and historical review. The framework incorporates event-preserving baseline correction, robust multi-sensor event characterization, independent documentation of reference truck passage using a time-stamped field photograph, extraction of one signed peak strain increment per event and sensor, and visualization and historical review through a sensor-driven digital shadow.
In Hong Kong, substantial structural-health-monitoring (SHM) deployment and research have been established for long-span permanent highway bridges, with progressively developed multi-sensor systems, data-acquisition platforms, and data-driven frameworks supporting long-term structural assessment and asset management [59,60]. More recently, sensor-enabled digitalization has also been extended to the building-construction sector, including IoT–BIM platforms and multi-sensing systems for Modular Integrated Construction (MiC) components during production, logistics, assembly, and operation[61,62]. Nevertheless, field-oriented monitoring studies targeting large, sloped steel work platforms subjected to repetitive heavy haul-truck traffic remain scarce in the local practice and published literature. Current Hong Kong construction-safety provisions for large working structures continue to place substantial emphasis on competent-person inspections, prescribed inspection intervals, and documented confirmation of safe working condition rather than continuous strain-based quantitative structural monitoring [63,64]. Against this background, there remains a distinct need for monitoring frameworks that integrate event-preserving signal processing, reference-event calibration using independent field evidence, and sensor-driven digital-shadow representation specifically for large construction-site steel facilities. The principal innovation of this study lies in integrating continuous IoT-enabled VWSG monitoring with event-oriented statistical processing and a sensor-driven digital shadow for a sloped steel platform. The main contributions are: (1) an event-preserving baseline-correction procedure for isolating short-duration strain increments from slowly varying responses; (2) a robust multi-sensor approach for characterizing coordinated candidate loading events; (3) channel-wise event-response distributions constructed using one signed peak increment per merged event, thereby preventing long quiet periods from dominating the statistics; and (4) integration of sensor location, response history, and local strain-demand information within a sensor-driven digital shadow. A time-stamped photograph independently documented one reference truck passage and supported its physical interpretation but was not treated as validation of all candidate events.
2. Steel Platform and IoT-Enabled Monitoring System
2.1. Platform Geometry and Structural Configuration
The monitored structure was a sloped steel platform used to support repeated haul-truck movements during construction. Figure 1a presents the overall three-dimensional platform geometry, the location of the monitored structural module, and the VWSG assignments within that module. Figure 1b provides representative field views of the platform and installed VWSGs. The monitored module had an in-plane span of 4.50 m, with clear heights of 3.00 m and 2.25 m at the higher and lower sides, respectively. Two out-of-plane bays along the Y-axis, each 3.50 m long, formed a total monitored width of 7.00 m, and a 0.20 m slab component was included in the structural representation. The elevation difference of 0.75 m over the 4.50 m span corresponded to a nominal slope of 1V:6H, or approximately 9.5°. For visualization, the monitored module was embedded within a longer platform model containing one contextual bay before the monitored region and three contextual bays after it. These additional bays were included solely to represent the overall platform geometry and the approach and departure paths of the haul trucks. They contained no monitoring sensors and were not included as independent observations in the event-level statistical analysis. The principal structural system consisted of columns, transverse sloping rafters, longitudinal members, and diagonal braces. The columns, transverse sloping rafters, longitudinal members were represented by 305 × 305 × 97 UC sections fabricated from S355 steel. The diagonal braces were represented by 125 × 65 × 15 channel sections fabricated from S275 steel, while 100 × 50 × 10 S275 channels were used at the platform edges.
Figure 2 illustrates the IoT-based data-acquisition and transmission architecture. The structure was defined using a Cartesian coordinate system in which the X-axis followed the in-plane sloping direction of truck travel, the Y-axis represented the out-of-plane transverse direction across the frames, and the Z-axis represented elevation.

Table 1.
Principal geometric and structural parameters of the monitored platform.
| Parameter | Description |
|---|---|
| Monitored in-plane span | 4.50 m |
| Monitored out-of-plane width | 2 × 3.50 m = 7.00 m |
| Higher and lower clear heights | 3.00 m and 2.25 m |
| Slab thickness | 0.20 m |
| Nominal platform slope | 1V:6H, approximately 9.5° |
| Sloping rafters, columns and Longitudinal members | 305 × 305 × 97 UC, S355 |
| Diagonal braces | 125 × 65 × 15 channel, S275 |
2.2. VWSG Layout and Instrumentation
An IoT-enabled VWSG monitoring system was installed to continuously record the local longitudinal strain response of the principal load-transfer members. A total of 15 VWSGs were installed on selected flange surfaces of three sloping rafters, four longitudinal members, four columns, and four diagonal braces. Each VWSG was assigned a unique label and linked to its corresponding structural member and three-dimensional position in the monitoring model. The monitored-member arrangement followed the nomenclature shown in Figure 1b. The sensor assignments followed the project monitoring layout and are summarized in Table 2.
2.3. IoT Data Acquisition and Transmission
The field-installed VWSGs were connected to a TH-RTU-C IoT data gateway, which linked the physical sensors to the remote monitoring platform. The gateway collected time-stamped measurements from the individual VWSG channels and transmitted them through a 4G wireless communication network to a cloud-based data-management platform. The 4G-enabled remote-acquisition architecture allowed measurements to be acquired remotely without manual retrieval at the construction site.
Because the VWSG sampling interval was approximately 9 s, the system provided approximately six to seven readings per minute and is more appropriately described as a near-real-time operational strain-monitoring system than as a high-frequency dynamic acquisition system. Consequently, a short truck passage may have been represented by only one or several discrete measurements. The extracted event peaks therefore represent the largest recorded sampled increments, not necessarily the continuous-time maximum dynamic strain.
At the cloud-platform level, the transmitted VWSG measurements were organized by sensor identity, measurement time, and structural location. The platform supported near-real-time visualization, historical data storage, data-quality checks, anomaly identification, and event logging. The sensor-to-member mapping also allowed each measured strain response to be associated with its corresponding structural component and displayed in the monitoring interface. The complete IoT data pathway is shown in Figure 2.
This architecture formed a sensor-driven digital shadow of the monitored platform: measurements from the physical structure were transferred continuously to its digital representation for visualization and subsequent analysis. Because the system did not automatically modify or control the physical structure, it is described as a digital shadow rather than a fully bidirectional digital twin.
2.4. Reference Truck Event and Operational Conditions
A continuously synchronized camera system was not available during the monitoring period. Instead, a time-stamped field photograph was obtained while a haul truck was present on the monitored platform. The photograph timestamp was aligned manually with the corresponding VWSG records to identify a temporally coincident multi-sensor strain response during the documented truck presence. The photograph therefore provided independent documentation of one truck passage and was used to support the physical interpretation of the selected reference response.
Haul trucks travelled predominantly along the sloping X-direction. During the typical construction cycle, trucks generally travelled uphill before being loaded and returned downhill after loading. Because neither travel direction nor payload was recorded independently for every passage, these conditions were treated as operational-cycle states rather than as verified loaded and unloaded vehicle classes. Consequently, statistical event detection was based on the measured VWSG response rather than assumed truck weight or loading condition.
The combined structural representation, IoT-enabled VWSG network, wireless gateway, cloud-based data platform, time-stamped photographic reference, and three-dimensional monitoring interface provided the basis for identifying truck-related transient strain events and quantitatively comparing the response of individual structural members. In the subsequent analysis, the VWSG measurements were used to characterize local transient strain increments associated with the detected candidate events at the instrumented locations.
Because each measurement was obtained from a single uniaxial VWSG, the recorded response was not interpreted independently as the complete member axial force, bending moment, shear force, or utilization. Instead, each record represented the local longitudinal strain at the gauge position and could reflect a combination of axial action, bending, connection restraint, and other local structural effects. Conversion of these measurements into member forces or utilization ratios would require additional sectional measurements, structural calibration, and a validated load–response model.
3. Proposed Real-Time Monitoring and Strain-Based Safety Intelligent Assessment Framework
The proposed framework converts continuous vibrating wire strain gauge (VWSG) measurements into truck-event information, quantitative local strain responses, and real-time operational safety indicators for the sloped steel platform. As shown in Figure 3, this framework comprises of real-time IoT monitoring, data reading and channel synchronization, data-quality control, event-preserving baseline estimation, independent documentation of reference truck event using a time-stamped field photograph, multi-sensor event detection, quantitative strain-response assessment, comparison with an allowable local strain threshold, and visualization with historical event review through a sensor-driven digital shadow. This intelligent workflow starts from field based real-time IoT monitoring, followed by data collection, synchronization, and multi-stage data quality screening. Baseline estimation separates slowly varying background strain from truck induced transient strain increments. Multi-sensor consensus detection identifies genuine truck passage events by cross-checking temporal responses across valid sensor channels. Quantitative statistical assessment characterizes event level strain distributions for instrumented structural members. Capacity assessment computes local elastic stress increments and member level strain demand ratios, comparing measured responses against project specific allowable strain thresholds. Two conditional feedback loops adapt data processing parameters when data quality fails or when strain excursions lack photographic confirmation of truck presence. Warning/critical alerts are triggered if local member limits are exceeded; otherwise, the system maintains normal operational state logging. All measurements, event records and safety states persisted within an IoT driven real-time 3D digital shadow historical database for visualization, live response review and retrospective event analysis. Note that this implementation follows a sensor driven digital shadow paradigm: data flows unidirectionally from the physical steel platform to its virtual counterpart without automatic actuation or closed-loop control over the physical structure.
Because only one uniaxial VWSG was installed at each monitored location, the measured strain cannot uniquely resolve the axial force, bending moment, and shear force acting in corresponding member. The framework therefore evaluates the local strain increment and associated linear-elastic stress increment at the gauge location. These quantities are interpreted as sensor-level member-associated response indicators rather than direct measurements of section forces or complete member utilization.
The measurements were transmitted from the data-acquisition system to the online monitoring platform and were stored with their channel labels and timestamps. Each channel was linked to its physical sensor, monitored member, and position in the three-dimensional structural model. Prior to the event analysis, records from all valid channels were aligned to a common monitoring timeline. Duplicate timestamps, missing measurements, isolated implausible values, and flat or inactive channels were identified during data-quality control. Channels with insufficient valid information were excluded from the multi-sensor assessment.
Let εs(t) denote the strain measured by sensor s at time t and let denote the selected pre-event interval. Let ms denote the background median of sensor s over B. It was calculated as
ms = mediant∈[εs(t)]
Let MADs denote the median absolute deviation of sensor s within B and let σs denote the corresponding normally consistent robust scale. These quantities were calculated as
MADs = mediant∈|εs(t) − ms|,
σs = 1.4826MADs
Let denote the baseline-corrected reference-interval strain increment and let Zs(t) denote its standardized absolute magnitude. They were calculated as
Channels classified as flat or having a non-positive robust scale were not assigned a standardized response. Let valid denote the set of valid channels, let 1[·] denote the indicator function, and let A(t) denote the number of active channels at time t. A descriptive threshold of Zs(t) ≥ 3 was used to identify responses that were prominent relative to the corresponding channel’s pre-event variation:
Let Top5{·} denote the five largest available standardized channel responses at time t and let G5(t) denote their median. The global reference-event response was summarized as
G5(t) = median(Top5{Zs(t):s ∈ valid})
The activity count A(t) and G5(t) were used as descriptive corroboration of the documented reference event. They were not used as a generalized detector for the complete monitoring record, and the implemented code did not apply separate onset, ending, minimum-duration, or hysteresis thresholds to these indices.
Let ref denote the documented reference-event interval. For each valid sensor s, let s* denote the maximum absolute response within ref, and let rs denote the signed increment at :
Let Δεs,p2p denote the peak-to-peak strain increment for sensor ref. It was calculated as
For sensor s, let qs denote the median increment over the immediate post-event interval, and let Rs denote the descriptive immediate-recovery fraction. It was calculated as
Because the post-event interval contained only two observations, Rs was interpreted as a immediate unloading indicator and not as evidence of long-term recovery or the absence of permanent deformation. Baseline sensitivity was evaluated separately by comparing the pre-event-median peak with the peak obtained from a local linear baseline joining the median pre-event and immediate post-event levels.
For the complete monitoring record, the measured strain at sensor s and measurement index k was represented as
where bs,k is the slowly varying baseline, Δεs,k is the sampled transient increment, and νs,k represents measurement noise and other short-term disturbances.
εs,k = bs,k+Δεs,k + νs,k,
For sensor s at index k, let j denote an observation index and let denote the set of indices available at or before k within the applicable continuous data segment. The framework calculates the causal rolling-median baseline bs,k independently for each sensor and segment as
When the framework is processed for a single day, it loads preceding measurements only to establish the baseline near the beginning of that day. The signed full-record increment Δεs,k is then calculated as
Δεs,k = εs,k − bs,k
The signed reference increments rs obtained from the documented reference event were used to screen the complete monitoring record. For sensor s at index k, let ρs,k denote the ratio of Δεs,k to rs:
A reading was classified as reference-consistent when the signed ratio satisfied
0.50 ≤ ρs,k ≤ 1.50
The signed merged-event peaks were used to construct channel-wise distributions. The boxplots summarize the median, interquartile range, mean, and individual merged-event peaks. Long quiet periods do not enter these event-level distributions. However, because the distributions contain only responses satisfying Equation (15), they characterize the reference-consistent population and not the unrestricted operational envelope. The 50-150% of the bands shown in the plots are the same intervals used for candidate screening; they are not independent validation bands, abnormal-response criteria, or engineering acceptance limits.
Let denote the selected dashboard time window and s a sensor channel. Let denote the signed baseline-corrected strain increment having the largest absolute magnitude in sensor channel s. The sign of is retained to distinguish tensile from compressive local responses. Let E denote the adopted elastic steel modulus in MPa and let denote the corresponding local stress increment in MPa. Assuming linear-elastic steel behaviour and expressing in microstrain (με), Hooke’s law gives
where E is the adopted elastic modulus of steel expressed in MPa and is expressed in microstrain (με). Consequently, is obtained in MPa. The calculated value represents only the local normal-stress increment at the gauge position.
For each instrumented section s, the project-approved structural capacity was expressed, through the approved structural assessment, as an equivalent allowable local normal-stress threshold, σallow,s, at the corresponding VWSG location. Thus, σallow,s is section-specific and should not be interpreted as a single common material limit for all monitored channels. Let εallow,s denote the associated dimensionless allowable local strain. Assuming linear-elastic behaviour, it was calculated as
Let denote the same allowable strain expressed in microstrain. It was calculated as
The prototype dashboard also permits an allowable strain to be entered directly, as demonstrated in Figure 11. For operational use, the value assigned to each channel should be the project-approved allowable strain for its corresponding instrumented section or member group. A common allowable-strain input should be applied to several channels only when the same threshold has been approved for those sections. The allowable threshold should be established using an approved structural analysis, controlled loading test, or calibrated numerical model that relates the governing section capacity to the expected strain at the actual VWSG location.
Let fy,s denote the nominal yield strength applicable to monitored member s and let denote the corresponding yield-based reference strain in microstrain.
This yield-based value should not automatically be treated as the allowable monitoring threshold because stability, buckling, connection behaviour, local stress concentration, combined force effects, and project-specific safety margins may govern before local material yielding occurs.
Let Dε,s, denote the absolute incremental local strain-demand ratio for sensor s over W and let Us, denote the corresponding percentage usage displayed by the dashboard. They are calculated as
Let Dσ,s, denote the corresponding absolute local stress-demand ratio. It is calculated as
When the stress and strain thresholds are mutually consistent and the monitored response remains linear elastic, the two ratios are equivalent:
Dε,s, = Dσ,s,
A ratio below 1.0 indicates only that the monitored incremental local response is below the adopted section-specific allowable threshold. A ratio equal to or greater than 1.0 indicates that this threshold has been reached or exceeded. Neither condition, considered alone, establishes complete member safety, global structural adequacy, remaining capacity, or a structural safety factor because initial dead-load strain, temperature-related strain, residual stress, connection demand, and other existing actions are not included in the incremental measurement.
Let Ss, denote the operational state displayed for sensor s over W. For visualization, the prototype dashboard assigns Ss, from Us, as
These levels reproduce the green, yellow, and red bands implemented in the prototype interface. They are prototype operational-warning settings rather than independently validated project safety classifications and must be approved or replaced through project-specific engineering assessment before operational deployment. A Critical display indicates that the selected prototype warning level has been reached; it does not, by itself, demonstrate yielding, instability, connection failure, or structural failure.
The MAD-based standardized response Zs(t) and the activity threshold Zthr= 3, applied through the criterion |Zs(t)| ≥ Zthr, which were used to characterize the photograph-documented reference event, the signed reference-consistency interval 0.50 ≤ ρs,k ≤ 1.50, which was used for complete-duration candidate screening, and the engineering demand ratio Dε,s, serve different purposes and were therefore kept separate. The first two criteria identify statistically prominent or reference-consistent responses, whereas Dε,s, compares the monitored local strain increment with a project-approved engineering threshold. Statistical prominence or similarity to the reference event does not indicate proximity to an engineering limit.
The final output for each detected event included the event start, peak, and end times; active sensors; signed peak strain increments; maximum tensile and compressive responses; peak-to-peak strain; post-event recovery; governing sensor; associated structural member; local elastic stress increment; incremental strain-demand ratio; and assigned operational state. These outputs were stored in the historical monitoring database and displayed through the sensor-driven digital-shadow. The interface links each measurement to its physical position in the platform model, thereby allowing review of the spatial distribution of the monitored response and historical candidate truck-passage events to be reviewed. The visualization is described as a sensor-driven digital shadow rather than a digital twin because data flow from the physical platform to the virtual representation without automatic bidirectional control of the platform.
4. Results
Before the complete-record candidate-screening procedure was applied, one reference truck passage was documented using a time-stamped field photograph. The reference-event dataset comprised measurements recorded on 29 April 2026. The mean sampling interval was 9.39 s, corresponding to an effective sampling frequency of 0.106 Hz. These measurements provided discrete samples of short-duration or quasi-static operational strain increments rather than axle-level vibration responses. The photograph documented the presence of a haul truck on the monitored platform during the selected interval from 13:03:00 to 13:06:00. The interval from 13:03:43 to 13:04:20 was adopted as the pre-event baseline, whereas the interval from 13:05:17 to 13:05:26 was used to assess immediate recovery. The measurement at 13:05:35 was excluded from the recovery interval because the multi-sensor response had already begun to increase again, indicating the possible onset of a second, undocumented response.
Figure 4 presents the field evidence and corresponding strain response. Figure 4(a) documents the haul truck on the platform, and Figure 4(b) shows the raw strain histories of all 13 recorded channels used for the initial data-quality assessment. The large differences in absolute strain among channels reflect sensor-specific offsets and initial structural conditions; therefore, the raw values were not interpreted directly as truck-induced strain demand. CH2-1 and CH14-1 remained constant at zero and were classified as flat or unresponsive. These channels were retained in the raw-data presentation for transparency but were excluded from the subsequent multi-sensor analysis.
Figure 4(c) presents the baseline-corrected responses of the 11 valid channels. The fixed pre-event-median correction described in Section 3 was applied separately to each channel. The corrected histories show a spatially nonuniform response, with positive and negative strain increments at different sensor locations. The strongest coordinated response occurred at approximately 13:04:58, when several channels reached their maximum absolute values. A subsequent increase appeared near 13:05:35; because neither the photograph nor another operational record independently documented this response, it was excluded from the reference-event analysis.
Figure 5 compares the signed maximum strain increment recorded by each valid sensor. This comparison shows the magnitude, direction, and spatial variability of the local response across the monitored locations. CH6-1 produced the largest increment, approximately +10.4 με, followed by CH2-2 with −5.25 με and CH3-1 with +4.48 με. CH4-1 exhibited a secondary negative response, whereas the remaining valid channels showed smaller absolute increments. Seven channels reached their maximum absolute responses at 13:04:58, supporting the interpretation of a coordinated structural response. The positive and negative signs indicate local strain changes at the VWSG locations; they do not establish that the associated members were subjected to pure tension or compression.
Figure 6 assesses whether each measured response was distinguishable from its channel-specific pre-event variability. The peak standardized response for each channel, denoted by Z, was calculated using the robust noise formulation described in Section 3. Ten of the 11 valid channels exceeded the descriptive activity threshold defined at Z = 3. CH6-1 exhibited the largest standardized response, followed by CH3-1 and CH2-2. CH9-1 remained below the threshold, indicating that its small response was not clearly distinguishable from its local background variation. CH11-1 had a small absolute strain increment but exceeded the threshold because its baseline noise was particularly low. Accordingly, Z was interpreted as an indicator of statistical prominence, not as a measure of structural utilization or safety.
Figure 7 examines whether the documented response represented a coordinated multi-sensor event rather than isolated channel noise. The global response index and active-channel count were calculated from all 11 valid channels using the formulations described in Section 3. The global index increased during the photograph-documented interval and reached a maximum of 32.17 at 13:04:58. At the same timestamp, nine of the 11 valid channels satisfied Z ≥ 3. This simultaneous response supports the interpretation of a spatially distributed response coincided with the documented truck presence and shows that the event characterization did not depend solely on the three largest-response sensors.
Figure 8 evaluates the immediate decrease in strain following the documented truck event. The absolute event peak was compared with the median absolute residual strain during the immediate-recovery interval. The dominant channels showed substantial immediate recovery: CH6-1, CH3-1, and CH2-2 recovered by approximately 99.6%, 96.4%, and 94.6%, respectively. Several lower-amplitude channels exhibited lower normalized recovery. These differences may reflect local structural response, baseline variation, or the sensitivity of a normalized recovery ratio to small event amplitudes. Because the recovery interval contained only two measurements, Figure 8 indicates immediate unloading behaviour but does not establish long-term residual strain or permanent deformation.
Figure 9 assesses the sensitivity of the extracted peak values to the adopted baseline method. Peak increments obtained using the pre-event median were compared with those obtained using a local linear baseline connecting the pre-event and immediate-recovery levels. The larger-magnitude responses remained close to the 1:1 line, indicating that their magnitude and ranking were not strongly affected by the baseline method. Greater relative differences occurred among several low-amplitude channels because small baseline adjustments represented larger proportions of the measured responses at these channels.
Overall, the selected interval contained a statistically prominent, spatially distributed, and temporally coordinated strain response that coincided with independently documented truck presence. The principal evidence comprised a common peak time for seven channels, activation of nine of the 11 valid sensors, and a maximum global response index of 32.17. These results also show the value of assessing the complete valid sensor network rather than only the sensors with the largest absolute increments. This assessment supports the physical interpretation of the selected reference event. Its signed channel-specific peak increments were subsequently used as reference amplitudes to screen the complete monitoring record.
Figure 10 summarizes the channel-specific candidate strain responses retained over the complete monitoring period after causal rolling-median correction, signed 50–150% reference-consistency screening, minute-level peak selection, and temporal merging. These candidates were not individually verified as truck passages; each channel-wise distribution contains responses whose signed amplitudes resembled those of the photograph-documented reference event. The blue markers represent individual merged candidates, whereas the box-and-whisker distributions, means, and medians describe the conditional response distributions of the VWSG channels.
A spatially nonuniform strain-response pattern was observed within the screened candidate population. CH6-1 exhibited the largest retained positive strain increments, with most responses concentrated between approximately 5 and 15 με. CH2-2 showed the largest retained negative response, with most merged-candidate increments distributed approximately between −8 and −3 με, while CH3-1 exhibited the next-largest retained positive response, generally ranging between approximately 2 and 7 με. These channels therefore exhibited the largest responses among candidates retained by the adopted reference-consistency rule.
The remaining channels exhibited substantially smaller retained strain increments. CH4-1 and CH5-1 showed moderate negative responses, whereas CH8-1, CH1-1, CH10-1, CH7-1, and CH9-1 showed relatively small positive increments. CH11-1 exhibited only a minor negative response. The comparatively narrow distributions at these channels describe variability within the screened population only and should not be interpreted as complete operational loading ranges.
Sign agreement with the reference event was imposed by the signed-ratio screening rule and therefore cannot be interpreted as independent confirmation. The documented event defined the channel-specific signed screening intervals; consequently, its responses of approximately +10.4 με at CH6-1, −5.25 με at CH2-2, and +4.48 με at CH3-1 lie within the retained distributions by construction. The yellow bands show the channel-specific 50–150% selection intervals. These intervals are components of the reference-consistency screening procedure, not abnormal-response criteria, engineering acceptance limits, or structural safety thresholds. Figure 10 therefore characterizes conditional distributions of reference-consistent candidate responses rather than an unbiased distribution of all truck passages.
An IoT-enabled monitoring dashboard was developed to integrate platform geometry, VWSG locations, measured strain histories, and local strain-based warning information within a single sensor-driven digital-shadow interface. The dashboard supports both continuous operational monitoring and retrospective review of recorded responses. Each measurement channel was associated with its corresponding sensor location and monitored structural component, allowing the temporal strain response to be interpreted together with its physical position on the platform. This implementation follows the data-management framework described in Section 3, in which aligned VWSG measurements and event-response indicators are linked to the three-dimensional structural representation.
Figure 11 presents the dashboard layout. Panel (a) shows the complete geometry of the sloped steel platform and provides the overall structural context of the monitoring system. Panel (b) presents the instrumented platform module and the spatial assignment of the VWSGs. This spatial representation allows the operator to identify the physical location associated with each monitoring channel and to relate an elevated strain response to the corresponding rafter, longitudinal member, column, or diagonal brace.
Figure 11.
IoT enabled digital-shadow dashboard for the sloped steel platform: (a) complete platform geometry, (b) VWSG monitoring layout, (c) continuously updated strain histories with live-follow and historical-review functions, and (d) near-real-time sensor-wise peak strain increments, local strain-demand ratios, and operational states.
Figure 11.
IoT enabled digital-shadow dashboard for the sloped steel platform: (a) complete platform geometry, (b) VWSG monitoring layout, (c) continuously updated strain histories with live-follow and historical-review functions, and (d) near-real-time sensor-wise peak strain increments, local strain-demand ratios, and operational states.
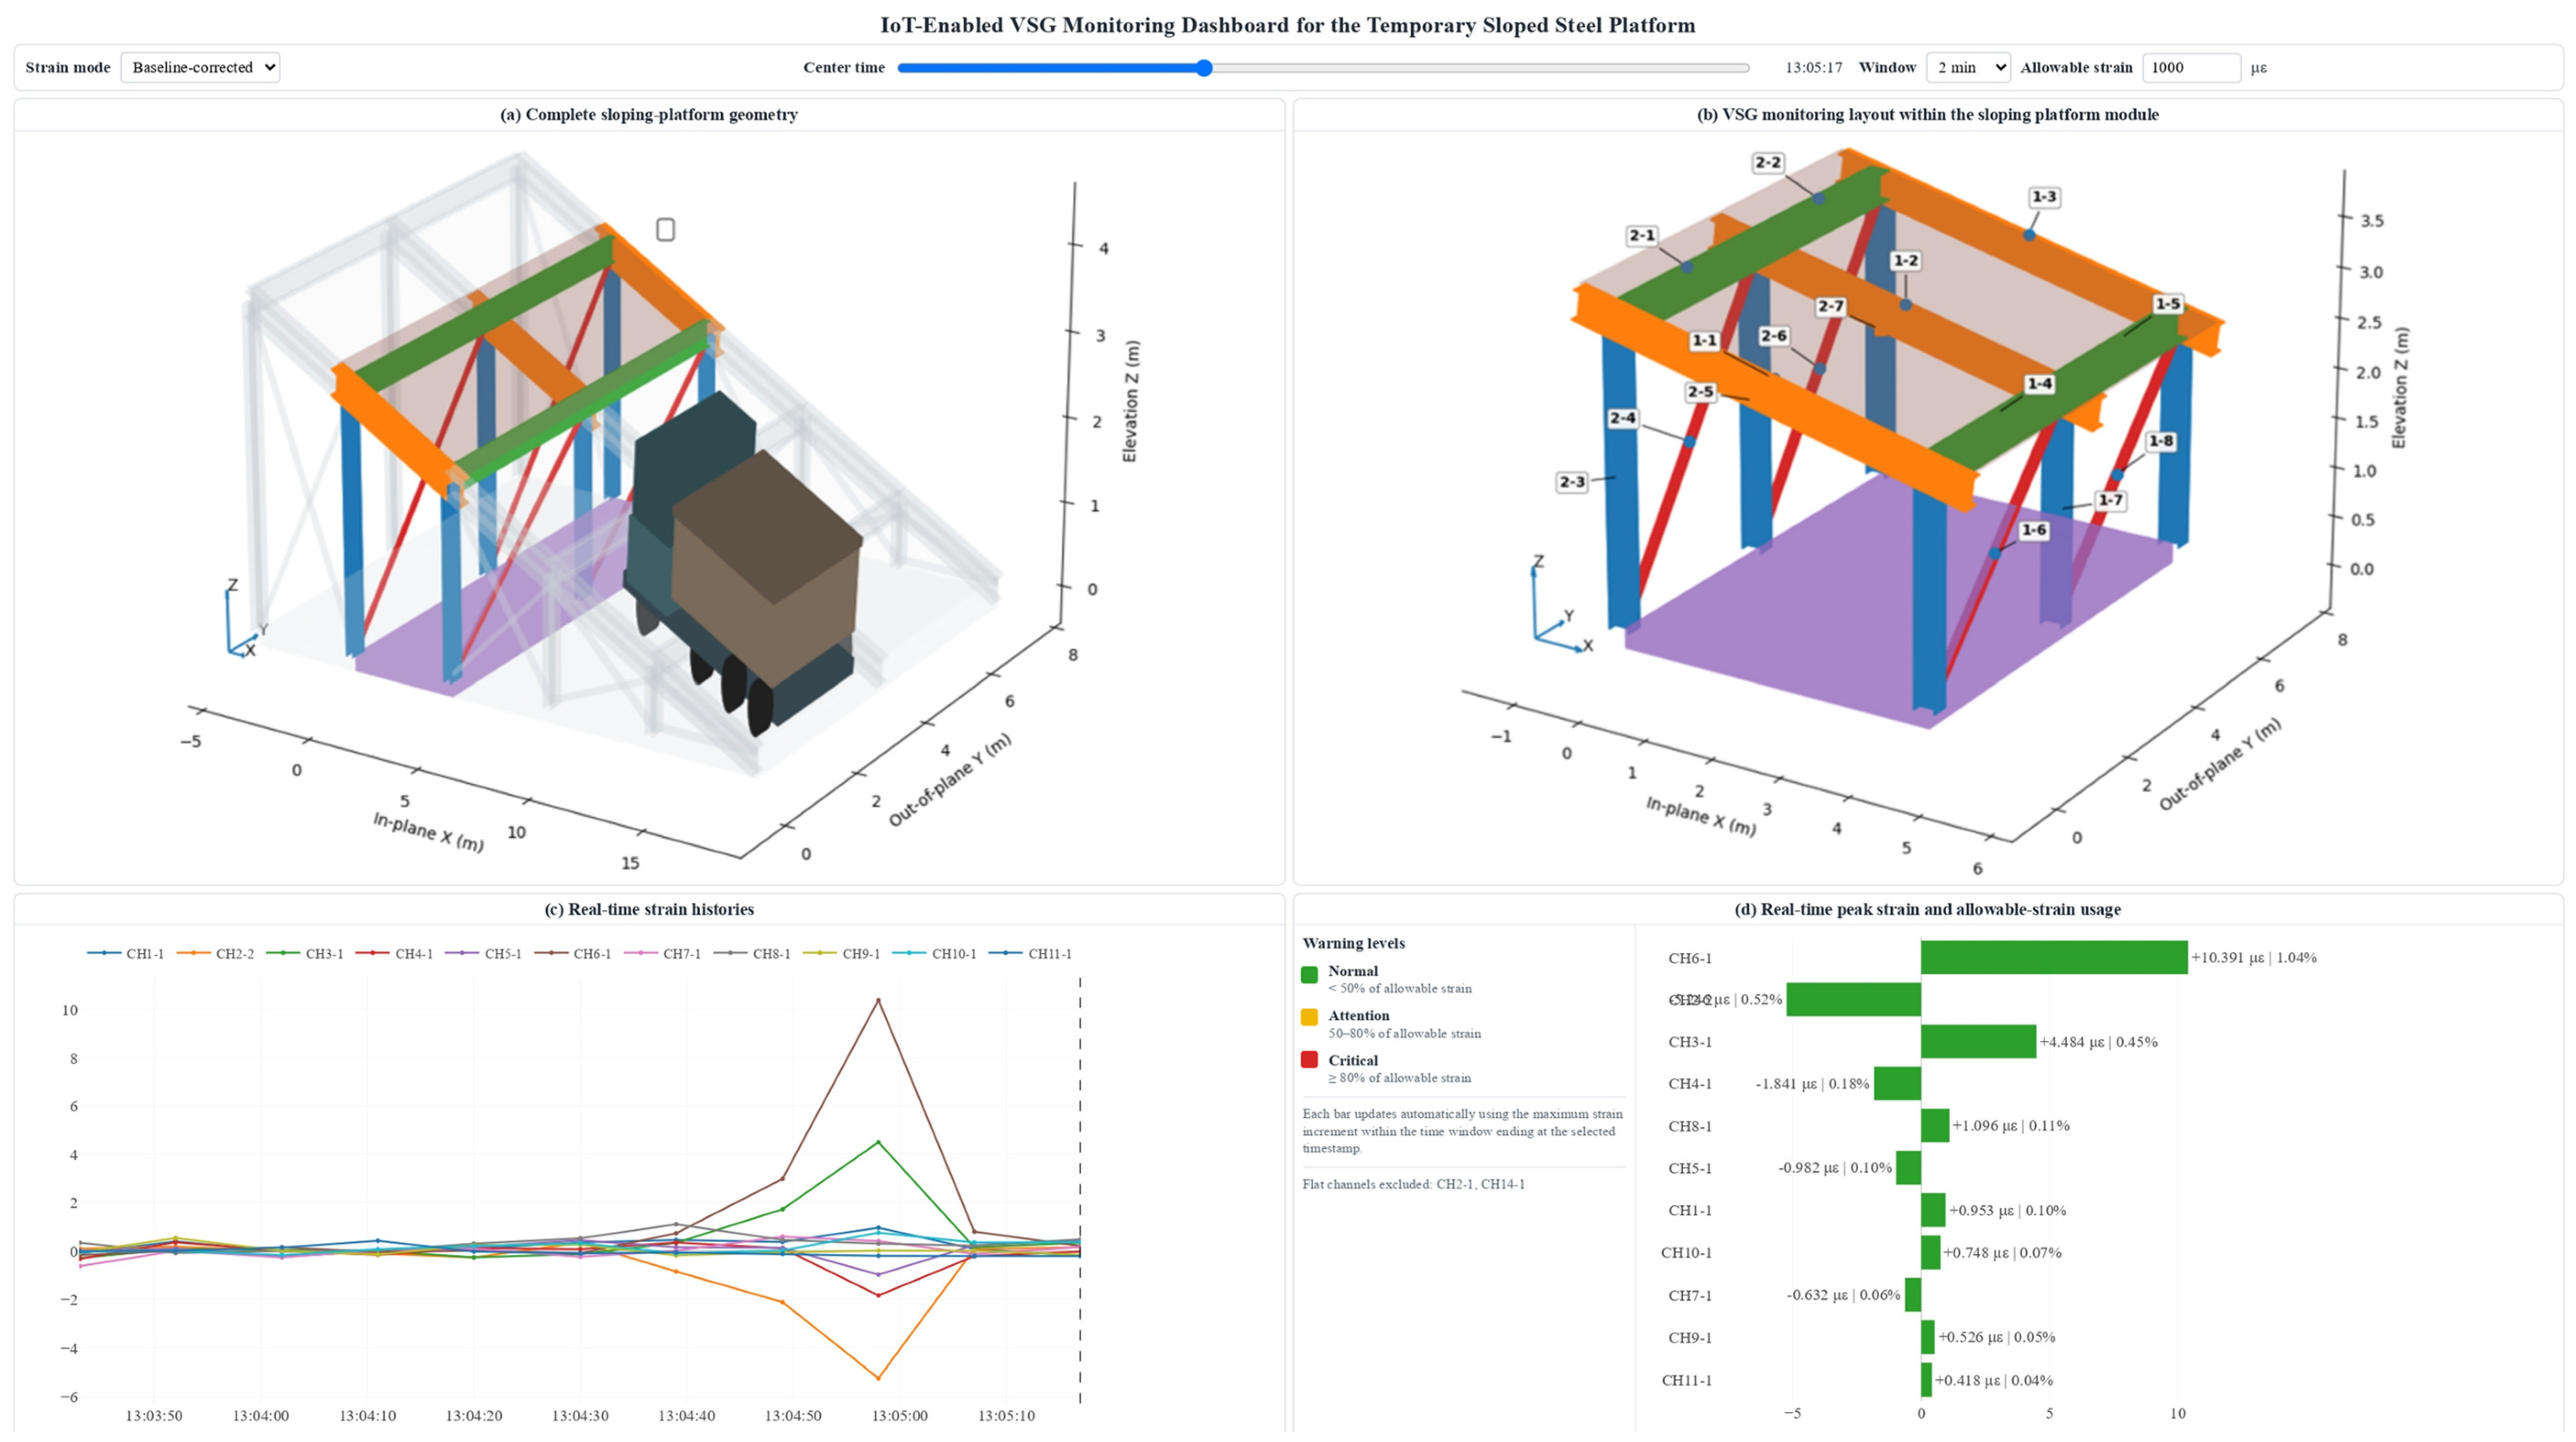
Panel (c) displays the continuously updated strain histories of all valid VWSG channels. The operator can switch between raw strain and baseline-corrected strain increments. The raw histories retain the complete measured response, including channel-specific offsets and slowly varying components, whereas the corrected histories emphasize short-duration strain changes relative to the estimated event-free baseline. The baseline-correction procedure follows the event-preserving method defined in Section 3 and is performed independently for each valid channel.
Under normal operation, the monitoring timestamp advances automatically whenever a new VWSG record is received. The displayed time window therefore follows the latest available measurement and presents only data recorded up to the current monitoring time. Measurements occurring after the displayed timestamp are not shown. This live-follow function prevents future information from appearing in the operational view and allows the dashboard to reproduce the information available to an operator at each monitoring instant.
The operator may also pause the live-follow function and enter a historical-review mode. In this mode, an earlier timestamp can be selected, and the response can be examined within a user-defined 2–60 min window ending at that time. The historical-review function allows an unusual strain response to be examined retrospectively without changing the original monitoring data. It also enables comparison of short-duration candidate-event responses with longer-term strain trends.
For the present prototype, the live-follow operation was demonstrated through chronological replay of the recorded field measurements. Thus, the monitoring timestamp advances through the previously collected data in the same order in which the measurements were originally acquired. In a field-connected implementation, the replayed records would be replaced by measurements received directly from the IoT data-acquisition system, while the visualization and assessment procedures would remain unchanged.
Panel (d) provides the real-time sensor-wise response and warning assessment. For each valid VWSG channel, the dashboard calculates the signed maximum baseline-corrected strain increment within the same moving time window displayed in Panel (c). The calculation is updated automatically whenever the monitoring timestamp advances, the review window is changed, or a historical timestamp is selected. Positive and negative bars indicate the direction of the local strain increment at the sensor position, while the bar length represents its magnitude.
The measured peak response is also compared with the specified allowable local strain. The displayed percentage is calculated using the incremental local strain-demand ratio introduced in Section 3. The ratio represents the local event-related strain increment relative to the adopted allowable strain at the sensor location. It does not represent complete member utilization, remaining capacity, or a global safety factor unless the initial dead-load strain, thermal effects, residual stress, and other existing demands are also quantified.
The bar colors provide an immediate operational indication of the measured local response. In the prototype interface, green denotes a normal state below 50% of the allowable strain, yellow denotes an Attention state from 50% to less than 80%, and red denotes a Critical state at or above 80%. These percentages are demonstration thresholds for the interface and do not constitute project-approved safety limits. Before operational deployment, they should be replaced by thresholds derived from structural analysis, controlled load testing, or a calibrated numerical model rather than from monitoring data alone.
The operational-state classification in Panel (d) is an engineering comparison and remains separate from the statistical thresholds used for event identification. The statistical indices indicate whether a response is distinguishable from background variation, whereas the allowable-strain comparison indicates whether the measured local response approaches an approved engineering limit. A response may therefore be statistically prominent while remaining well below the allowable strain.
The synchronized operation of Panels (c) and (d) provides three complementary functions. First, the moving strain histories show the temporal development of the monitored response. Second, the sensor-wise bar chart identifies the channel with the largest local increment in the current monitoring window. Third, the strain-demand percentage provides an immediate comparison with the adopted local strain threshold. During historical review, both panels are recalculated using only measurements available up to the selected timestamp, allowing previous responses to be reproduced and assessed consistently.
The interface is described as a sensor-driven digital shadow rather than a digital twin. Monitoring information is transferred from the physical platform to the virtual representation, but the dashboard does not automatically modify or control the physical structure. The system therefore supports visualization, warning assessment, historical review, and engineering decision-making without claiming bidirectional autonomous control.
Overall, the dashboard demonstrates how IoT-based VWSG measurements can be transformed into interpretable monitoring output. The combined presentation of the complete platform geometry, sensor assignments, advancing strain histories, and near-real-time local strain-demand indicators allows the largest recorded local response and its physical location to be identified rapidly.
5. Limitations and Engineering Implications
The VWSGs were sampled at approximately 9 s intervals; therefore, the measured responses provide sampled estimates of short-duration operational strain increments rather than high-frequency vibration or wheel-by-wheel dynamic effects. Detailed operational information, including truck weight, axle load, speed, payload, and exact wheel path, was not available for event, and variations in strain magnitude therefore may reflect the combined effects of actual site operating conditions.
Each monitoring location contained a single uniaxial VWSG; therefore, the measurements represent local longitudinal strain and cannot independently determine complete member axial force, bending moment, shear force, or utilization. The analysis also depended on causal baseline estimation, MAD-based characterization of the documented event, signed reference-consistency screening, minute-level peak selection, and channel-specific temporal merging. Statistical event-identification thresholds were kept separate from engineering allowable limits. The signed 50–150% interval relative to each channel's documented reference response was used to select reference-consistent candidates and support visual comparison; it did not represent a structural acceptance criterion. Consequently, the resulting distributions characterize a reference-conditioned candidate population rather than an unbiased record of all truck passages.
Despite these limitations, the complete-record reference-consistent candidate distributions provide a quantitative description of the monitored operational response within the screened population. CH6-1, CH2-2, and CH3-1 exhibited the largest recurring strain increments among the retained candidates. The channel-specific distributions provide reference ranges against which future measurements could be compared. Persistent changes in the median, upper percentiles, response direction, or variability could serve as screening indicators of unusual operating conditions requiring engineering review and, where practicable, independent field verification.
The event-level approach is useful because each merged channel-specific candidate contributes one signed maximum-absolute response, preventing long quiet periods from dominating the statistical results. Integration of the VWSGs with the TH-RTU-C IoT gateway, 4G transmission, cloud storage, and AI based sensor-driven digital shadow enables near-real-time visualization, historical event review, and channel-wise comparison. With project-approved, location-specific allowable-strain or stress thresholds, the framework could support threshold-based operational warnings and incremental local strain-demand assessment for steel platforms subjected to repeated construction traffic.
6. Conclusions
This study developed and demonstrated an IoT-enabled VWSG monitoring framework for real-time quantitatively assessing a sloped steel platform subjected to repeated haul-truck movements. Fifteen VWSGs were installed on selected rafters, longitudinal members, columns, and diagonal braces, and the time-stamped measurements were transmitted through a TH-RTU-C IoT gateway and a 4G network to a cloud-based monitoring platform. The sensor locations were linked to a structural representation, to form a sensor-driven digital shadow for near-real-time visualization and historical response review.
An event-oriented processing framework was used to separate slowly varying strain components from transient operational responses. The documented event was characterized by using coordinated multi-sensor responses and complete-record channel-specific candidates were extracted through signed reference-consistency screening and temporal merging. A time-stamped photograph provided independent verification of a reference truck passage. During this event, the most pronounced responses occurred at CH6-1, CH2-2, and CH3-1, with strain increments of approximately +10.4, −5.25, and +4.48 με, respectively. These measurements provided the channel-specific signed reference responses used for subsequent complete-record candidate screening.
The complete-record quantitative assessment revealed a spatially nonuniform strain pattern within the reference-consistent candidate population. CH6-1 exhibited the largest recurring positive response, CH2-2 exhibited the largest negative response, and CH3-1 exhibited the next-largest positive response. The remaining channels generally showed substantially smaller and narrower strain distributions. The measured responses remained concentrated within characteristic channel-specific operational ranges, and no pronounced abnormal escalation of event-level strain was evident within the candidate-event population.
The results further show that event-level statistics are more informative than statistics calculated directly from the complete raw record when characterizing intermittent operational loading. Extracting one representative peak from each merged channel-specific candidate event prevents long quiet periods from dominating the distribution and enables meaningful comparison of channel-wise medians, variability, upper percentiles, and extreme responses. Because the complete-record candidates were screened using signed ratios relative to the documented reference responses, agreement between the reference event and the retained distributions indicates internal consistency of the screening procedure rather than independent validation of all candidate events.
The proposed framework should not be interpreted as a direct measure of complete member forces or utilization because each monitored location is represented by a single uniaxial VWSG. Moreover, the statistical thresholds used for event identification are distinct from engineering allowable limits. Nevertheless, combining IoT-based strain monitoring, event-level statistical characterization, independent documentation of a reference-event, and intelligent visualization through a sensor-driven digital-shadow provides a practical means of identifying governing response locations and establishing quantitative reference-consistent operational response envelopes for steel structures. With project-approved section-specific engineering limits, independently documented events, and additional vehicle-operational information, the framework could be extended to support intelligent operational warnings and local condition-screening applications.
Acknowledgements
This work was supported by the China State Construction International Holdings Limited (CSCI) with Grant No.CSCI-2023-Z-19 (“R&D of Intelligent Auxiliary Design Platform for Temporary Structures based on Human-Inspired Building Structure Concept”). The authors also acknowledge the construction site team Tao Jia, Jingxi Yang, Ruiqin Zhang for facilitating field monitoring tests and providing on-site operational records. The research team members Haoyue Qiao, Ziqi Li, Xi Li from Structures Research Hub of China State Construction Engineering (Hong Kong) Ltd are thanked for their assistance in sensor installation, IoT monitoring platform development and data analysis.
References
- Code of Practice for Temporary Works Procedures and the Permissible Stress Design of Falsework. 2019. BS 5975:2019.
- Rosignoli, M., Temporary structures in construction, in Bridge Construction Equipment. 2013, ICE Publishing: London, UK. p. 1–42.
- Ratay, R.T., Temporary Structures in Construction. 3rd ed. 2012, New York, NY, USA: McGraw-Hill.
- André, J., R. Beale, and A.M. Baptista, A survey of failures of bridge falsework systems since 1970. Proceedings of the Institution of Civil Engineers - Forensic Engineering, 2012. 165: p. 161–172. [CrossRef]
- Zhang, C. and H. Li, Active Control for Construction Stability of Suspension Arch Rib Segments Based on ARID System. International Journal of Structural Stability and Dynamics, 2024. 25(24): p. 2540009. [CrossRef]
- Farrar, C.R. and K. Worden, An introduction to structural health monitoring. Philosophical Transactions of the Royal Society A, 2007. 365: p. 303–315.
- Brownjohn, J.M.W., Structural health monitoring of civil infrastructure. Philosophical Transactions of the Royal Society A, 2007. 365: p. 589–622.
- Ko, J.M. and Y.Q. Ni, Technology developments in structural health monitoring of large-scale bridges. Engineering Structures, 2005. 27: p. 1715–1725. [CrossRef]
- Spencer, B.F., Jr., M.E. Ruiz-Sandoval, and N. Kurata, Smart sensing technology: Opportunities and challenges. Structural Control and Health Monitoring, 2004. 11: p. 349–368. [CrossRef]
- Lynch, J.P. and K.J. Loh, A summary review of wireless sensors and sensor networks for structural health monitoring. Shock and Vibration Digest, 2006. 38: p. 91–128.
- Kim, S., et al. Health monitoring of civil infrastructures using wireless sensor networks. in Proceedings of the 6th International Conference on Information Processing in Sensor Networks. 2007. Cambridge, MA, USA.
- Pakzad, S.N., et al., Design and implementation of scalable wireless sensor network for structural monitoring. Journal of Infrastructure Systems, 2008. 14: p. 89–101. [CrossRef]
- Whelan, M.J. and K.D. Janoyan, Design of a robust, high-rate wireless sensor network for static and dynamic structural monitoring. Journal of Intelligent Material Systems and Structures, 2009. 20: p. 849–863. [CrossRef]
- Tokognon, C.A., et al., Structural health monitoring framework based on Internet of Things: A survey. IEEE Internet of Things Journal, 2017. 4: p. 619–635. [CrossRef]
- Mishra, M., P.B. Lourenço, and G.V. Ramana, Structural health monitoring of civil engineering structures by using the Internet of Things: A review. Journal of Building Engineering, 2022. 48: p. 103954. [CrossRef]
- Hassan, M., et al., Optimizing structural health monitoring systems through integrated fog and cloud computing within IoT framework. IEEE Access, 2024. 12: p. 89628–89646. [CrossRef]
- Liu, F., et al., A Three-Step Data Acquisition Optimization Algorithm for Hourly 3-D Deformation Field Construction Based on GNSS-InBSAR. IEEE Transactions on Geoscience and Remote Sensing, 2026. 64: p. 1–16. [CrossRef]
- Bai, J., et al., A Temporal Convolutional Network-Bidirectional Long Short-Term Memory (TCN-BiLSTM) Prediction Model for Temporal Faults in Industrial Equipment. Applied Sciences, 2025. 15(4): p. 1702. [CrossRef]
- Zhao, J., et al., A Tachograph-Based Approach to Restoring Accident Scenarios From the Vehicle Perspective for Autonomous Vehicle Testing. IEEE Transactions on Intelligent Transportation Systems, 2025. 26(9): p. 13909–13926. [CrossRef]
- Gao, H., et al., Turbulence correlation between moving trains and anemometer towers: Theoretical analysis, field measurements and simulation. Journal of Wind Engineering and Industrial Aerodynamics, 2024. 255: p. 105949. [CrossRef]
- Lu, Z., et al., SFEP-YOLO: A Track Obstacle Detection Model for Autonomous Electric Locomotives in Underground Mine. IEEE Transactions on Vehicular Technology, 2026. 75(6): p. 9687–9700. [CrossRef]
- Yu, Y., et al., Embedding Pose Information for Multiview Vehicle Model Recognition. IEEE Transactions on Circuits and Systems for Video Technology, 2022. 32(8): p. 5467–5480. [CrossRef]
- Zhang, Z., Y. Ming, and G. Song, Identify Road Clusters with High-Frequency Crashes Using Spatial Data Mining Approach. Applied Sciences, 2019. 9(24): p. 5282. [CrossRef]
- Junjie, J., et al., Enhanced YOLO-IASE for robust safety inspection in complex substation environments. Signal, Image and Video Processing, 2025. 19(9): p. 686. [CrossRef]
- Huang, Y., et al., Dynamic graph meta-learning with multi-sensor spatial dependencies for cross-category small-sample fault diagnosis in ZDJ9-RTAs. Advanced Engineering Informatics, 2026. 70: p. 104132. [CrossRef]
- Chen, J., J. Li, and Y. Liu, An Integrated Flexible Sensor for Decoupled Omnidirectional Strain and Human Motion Monitoring. Materials Today Advances, 2025. 28: p. 100641. [CrossRef]
- Zhang, Y., et al., Directionally Regularized Two-Stage Calibration for Cross-Shaped MGT Sensor Arrays With Physics-Inspired Error Modeling. IEEE Transactions on Instrumentation and Measurement, 2026. 75: p. 1–12. [CrossRef]
- Hu, S., et al., Defect localization in switch rail foot with variable width via spatial mapping of SH0-like guided wave time-of-flight. NDT & E International, 2026. 162: p. 103743. [CrossRef]
- Wei, H., et al., A novel interpretable intelligent attitude perception system for underwater vehicles based on pulsating pressure sensor array. Ocean Engineering, 2026. 364: p. 127176. [CrossRef]
- He, Y., et al., Detection and Analysis of Mechanical Stress Waves in IGBTs Using a Fiber-Optic Ring Acoustic Emission Sensor. IEEE Transactions on Instrumentation and Measurement, 2026: p. 1–1. [CrossRef]
- He, X., et al., Agent-Based Network Architecture and Resource Management for Vehicle-Road-Cloud Collaboration. IEEE Communications Magazine, 2026. 64(4): p. 34–41. [CrossRef]
- Park, H.S., et al., A practical monitoring system for the structural safety of mega-trusses using wireless vibrating wire strain gauges. Sensors, 2013. 13: p. 17346–17361. [CrossRef]
- Lee, H.M. and H.S. Park, Measurement of maximum strain of steel beam structures based on average strains from vibrating wire strain gages. Experimental Techniques, 2013. 37: p. 23–29. [CrossRef]
- Glisic, B., Concise historic overview of strain sensors used in the monitoring of civil structures: The first one hundred years. Sensors, 2022. 22: p. 2397. [CrossRef]
- Neild, S.A., M.S. Williams, and P.D. McFadden, Development of a vibrating wire strain gauge for measuring small strains in concrete beams. Strain, 2005. 41: p. 3–9. [CrossRef]
- Deng, Y., et al., Investigation of fatigue performance of welded details in long-span steel bridges using long-term monitoring strain data. Structural Control and Health Monitoring, 2015. 22: p. 1343–1358. [CrossRef]
- Peng, L., et al., Temperature and strain correlation of bridge parallel structure based on vibrating wire strain sensor. Sensors, 2020. 20: p. 658. [CrossRef]
- Moses, F., Weigh-in-motion system using instrumented bridges. Transportation Engineering Journal of ASCE, 1979. 105: p. 233–249. [CrossRef]
- Cardini, A.J. and J.T. DeWolf, Implementation of a long-term bridge weigh-in-motion system for a steel girder bridge in the interstate highway system. Journal of Bridge Engineering, 2009. 14: p. 418–423. [CrossRef]
- Yu, Y., C.S. Cai, and L. Deng, State-of-the-art review on bridge weigh-in-motion technology. Advances in Structural Engineering, 2016. 19: p. 1514–1530. [CrossRef]
- Enright, B. and E.J. O'Brien, Monte Carlo simulation of extreme traffic loading on short and medium span bridges. Structure and Infrastructure Engineering, 2013. 9: p. 1267–1282. [CrossRef]
- Nowak, A.S., Live load model for highway bridges. Structural Safety, 1993. 13: p. 53–66. [CrossRef]
- Peeters, B. and G. De Roeck, One-year monitoring of the Z24-Bridge: Environmental effects versus damage events. Earthquake Engineering & Structural Dynamics, 2001. 30: p. 149–171.
- Worden, K., G. Manson, and N.R.J. Fieller, Damage detection using outlier analysis. Journal of Sound and Vibration, 2000. 229: p. 647–667. [CrossRef]
- Carden, E.P. and J.M.W. Brownjohn, ARMA modelled time-series classification for structural health monitoring of civil infrastructure. Mechanical Systems and Signal Processing, 2008. 22: p. 295–314. [CrossRef]
- Cross, E.J., K. Worden, and Q. Chen, Cointegration: A novel approach for the removal of environmental trends in structural health monitoring data. Proceedings of the Royal Society A, 2011. 467: p. 2712–2732. [CrossRef]
- Shi, H., K. Worden, and E.J. Cross, A regime-switching cointegration approach for removing environmental and operational variations in structural health monitoring. Mechanical Systems and Signal Processing, 2018. 103: p. 381–397. [CrossRef]
- Kullaa, J., Eliminating environmental or operational influences in structural health monitoring using the missing data analysis. Journal of Intelligent Material Systems and Structures, 2009. 20: p. 1381–1390. [CrossRef]
- Sohn, H., Effects of environmental and operational variability on structural health monitoring. Philosophical Transactions of the Royal Society A, 2007. 365: p. 539–560. [CrossRef]
- Rousseeuw, P.J. and C. Croux, Alternatives to the median absolute deviation. Journal of the American Statistical Association, 1993. 88: p. 1273–1283.
- Kritzinger, W., et al., Digital twin in manufacturing: A categorical literature review and classification. IFAC-PapersOnLine, 2018. 51: p. 1016–1022. [CrossRef]
- Boje, C., et al., Towards a semantic construction digital twin: Directions for future research. Automation in Construction, 2020. 114: p. 103179. [CrossRef]
- Sacks, R., et al., Construction with digital twin information systems. Data-Centric Engineering, 2020. 1: p. e14. [CrossRef]
- Jiang, F., et al., Digital twin and its implementations in the civil engineering sector. Automation in Construction, 2021. 130: p. 103838. [CrossRef]
- Pregnolato, M., et al., Towards Civil Engineering 4.0: Concept, workflow and application of digital twins for existing infrastructure. Automation in Construction, 2022. 141: p. 104421. [CrossRef]
- Chiachío, M., et al., Structural digital twin framework: Formulation and technology integration. Automation in Construction, 2022. 140: p. 104333. [CrossRef]
- Torzoni, M., et al., A digital twin framework for civil engineering structures. Computer Methods in Applied Mechanics and Engineering, 2024. 418: p. 116584. [CrossRef]
- Sakr, M. and A. Sadhu, Visualization of structural health monitoring information using Internet-of-Things integrated with building information modeling. Journal of Infrastructure Intelligence and Resilience, 2023. 2: p. 100053. [CrossRef]
- Wong, K.Y., Instrumentation and health monitoring of cable-supported bridges. Structural Control and Health Monitoring, 2004. 11(2): p. 91–124. [CrossRef]
- Zhang, L., et al., Over 25-year monitoring of the Tsing Ma suspension bridge in Hong Kong. Journal of Civil Structural Health Monitoring, 2025. 15(1): p. 263–283. [CrossRef]
- Zhai, Y., et al., An Internet of Things-enabled BIM platform for modular integrated construction: A case study in Hong Kong. Advanced Engineering Informatics, 2019. 42: p. 100997. [CrossRef]
- Arshad, H. and T. Zayed, A Multi-Sensing IoT System for MiC Module Monitoring during Logistics and Operation Phases. Sensors, 2024. 24(15): p. 4900. [CrossRef]
- Labour Department, H.K.S.A.R.G., Construction Sites (Safety) Regulations: Summary of provisions on safe places of work and inspection of scaffolds.
- Labour Department, H.K.S.A.R.G., Reference Manual for Inspection Reports on Construction Sites. Labour Department, Hong Kong SAR Government.
Figure 1.
(a) Overall three dimensional geometry of the sloped steel platform and location of the monitored structural module; (b) VWSG assignments within the instrumented platform module.
Figure 1.
(a) Overall three dimensional geometry of the sloped steel platform and location of the monitored structural module; (b) VWSG assignments within the instrumented platform module.
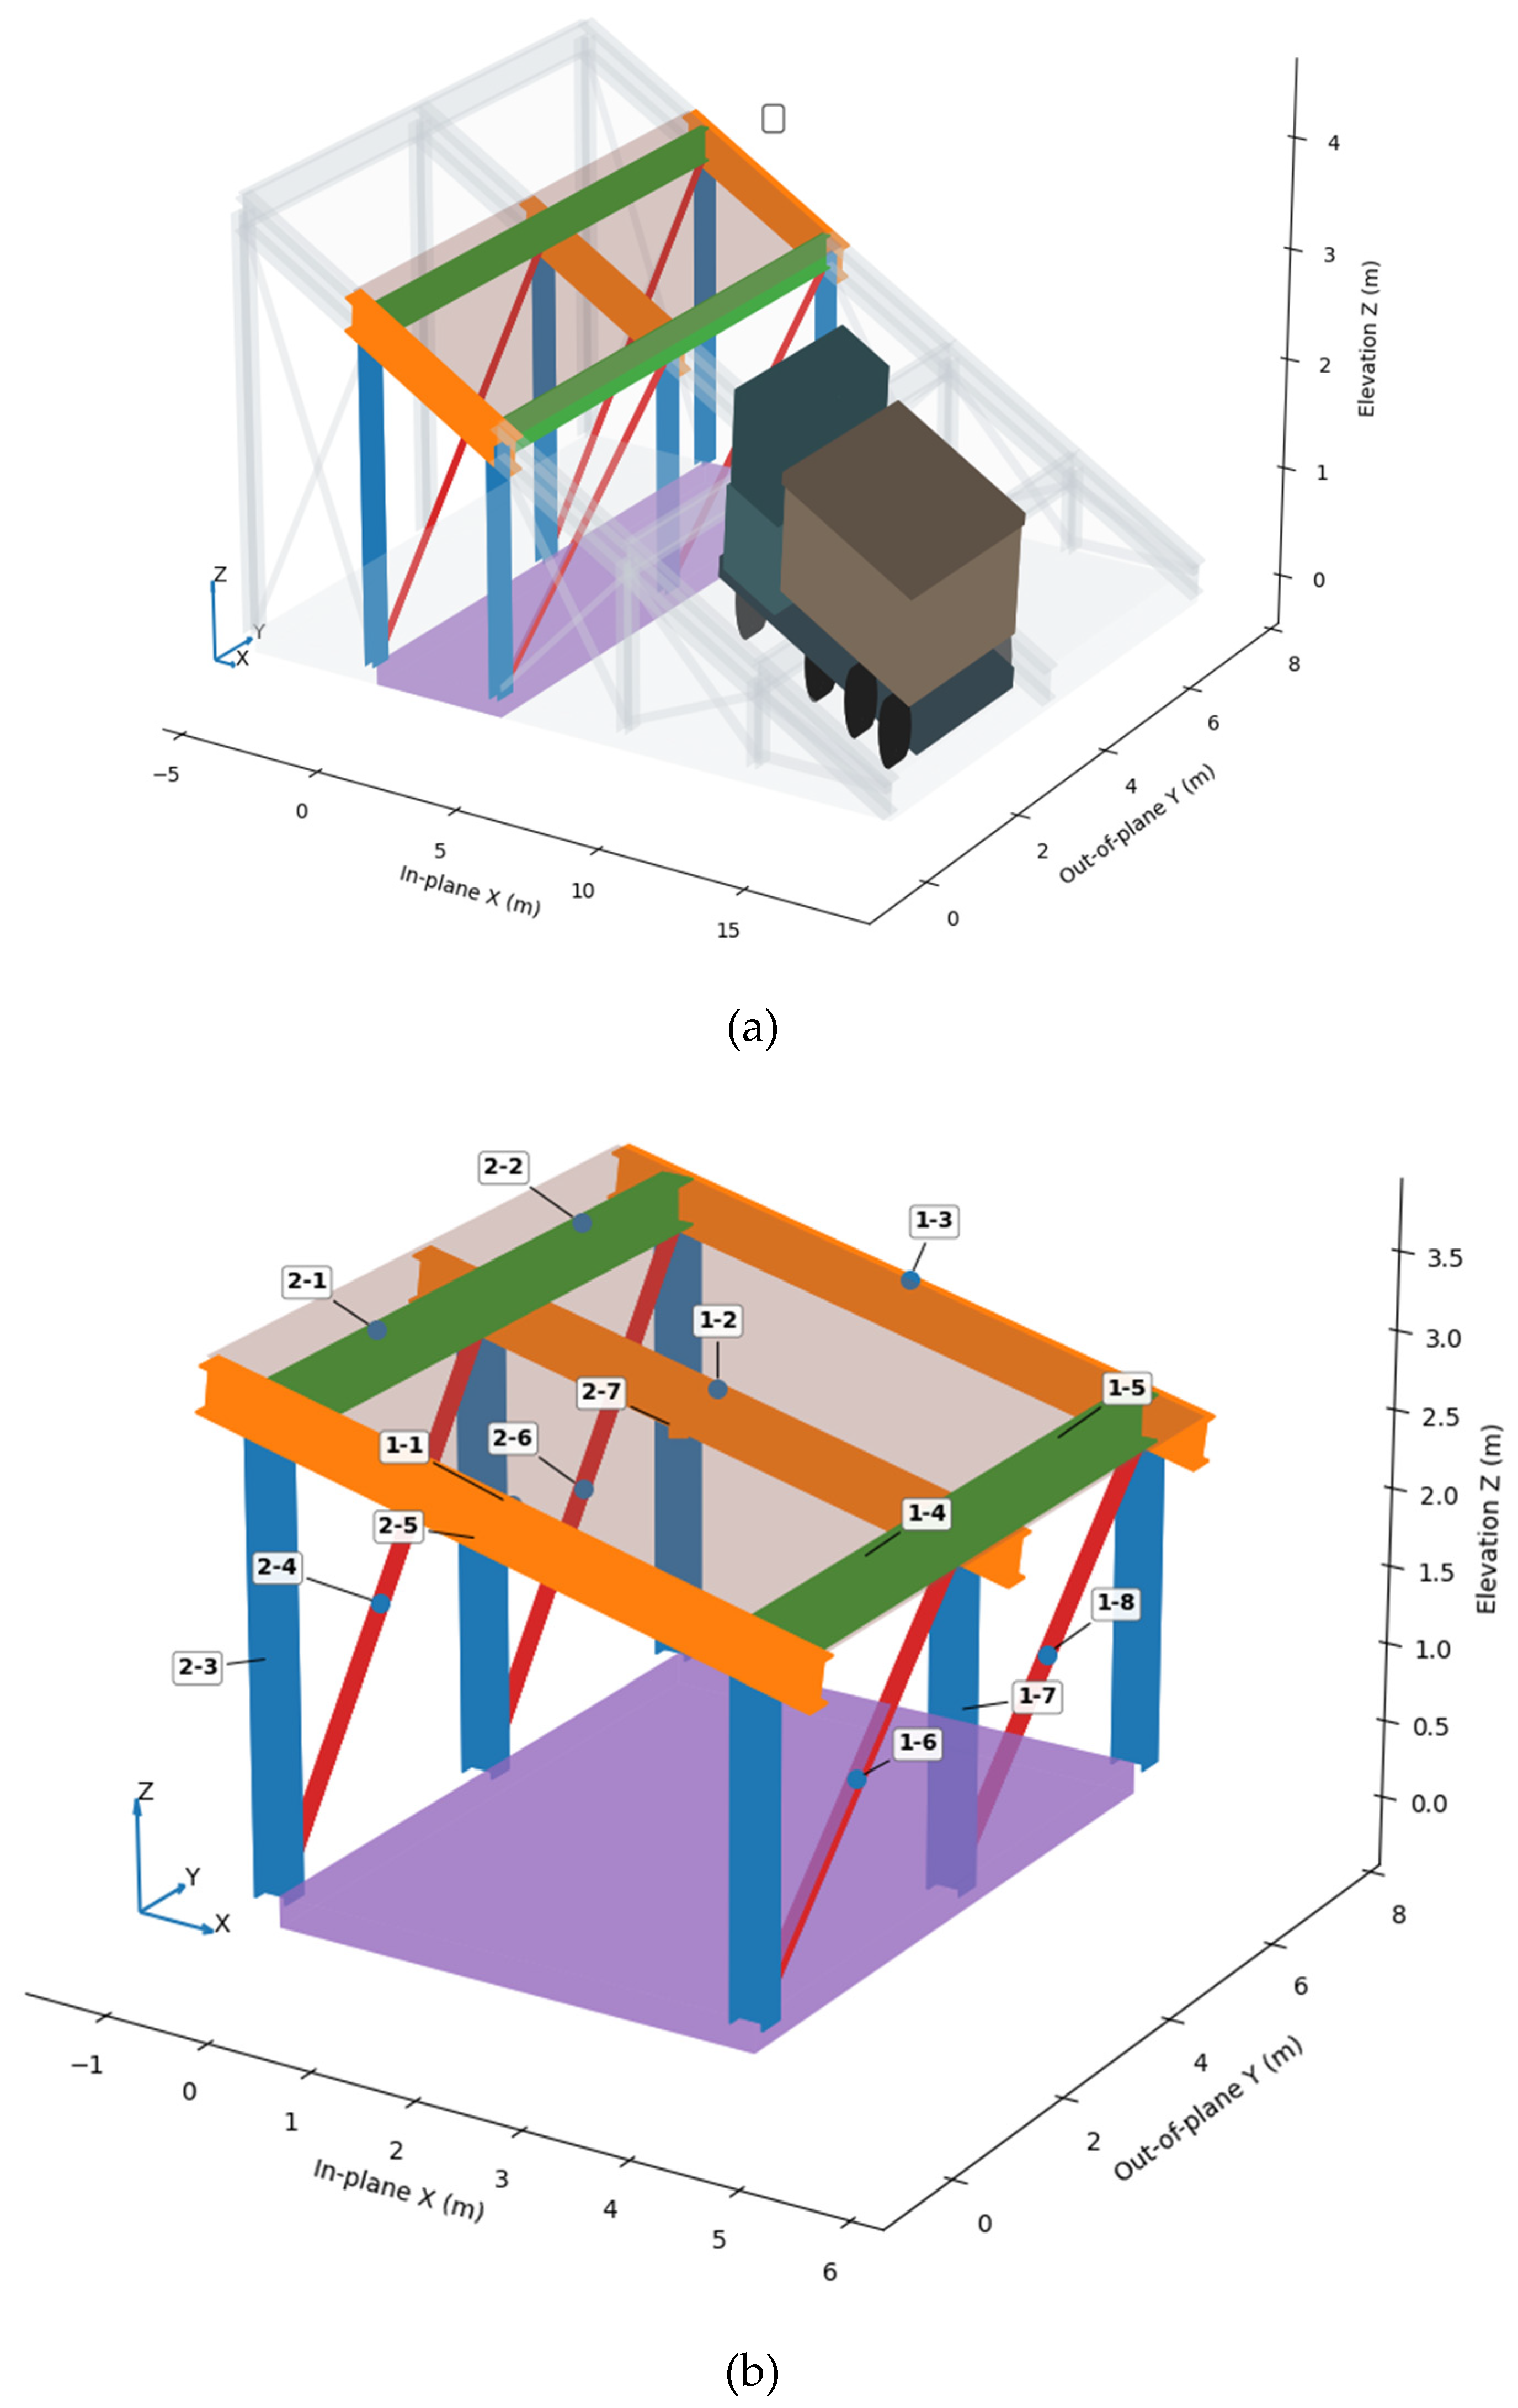
Figure 2.
IoT-based strain-monitoring architecture: TH-RTU-C field data gateway, cloud-based monitoring platform and data-transfer pathway from the field sensors to the digital-shadow interface.
Figure 2.
IoT-based strain-monitoring architecture: TH-RTU-C field data gateway, cloud-based monitoring platform and data-transfer pathway from the field sensors to the digital-shadow interface.
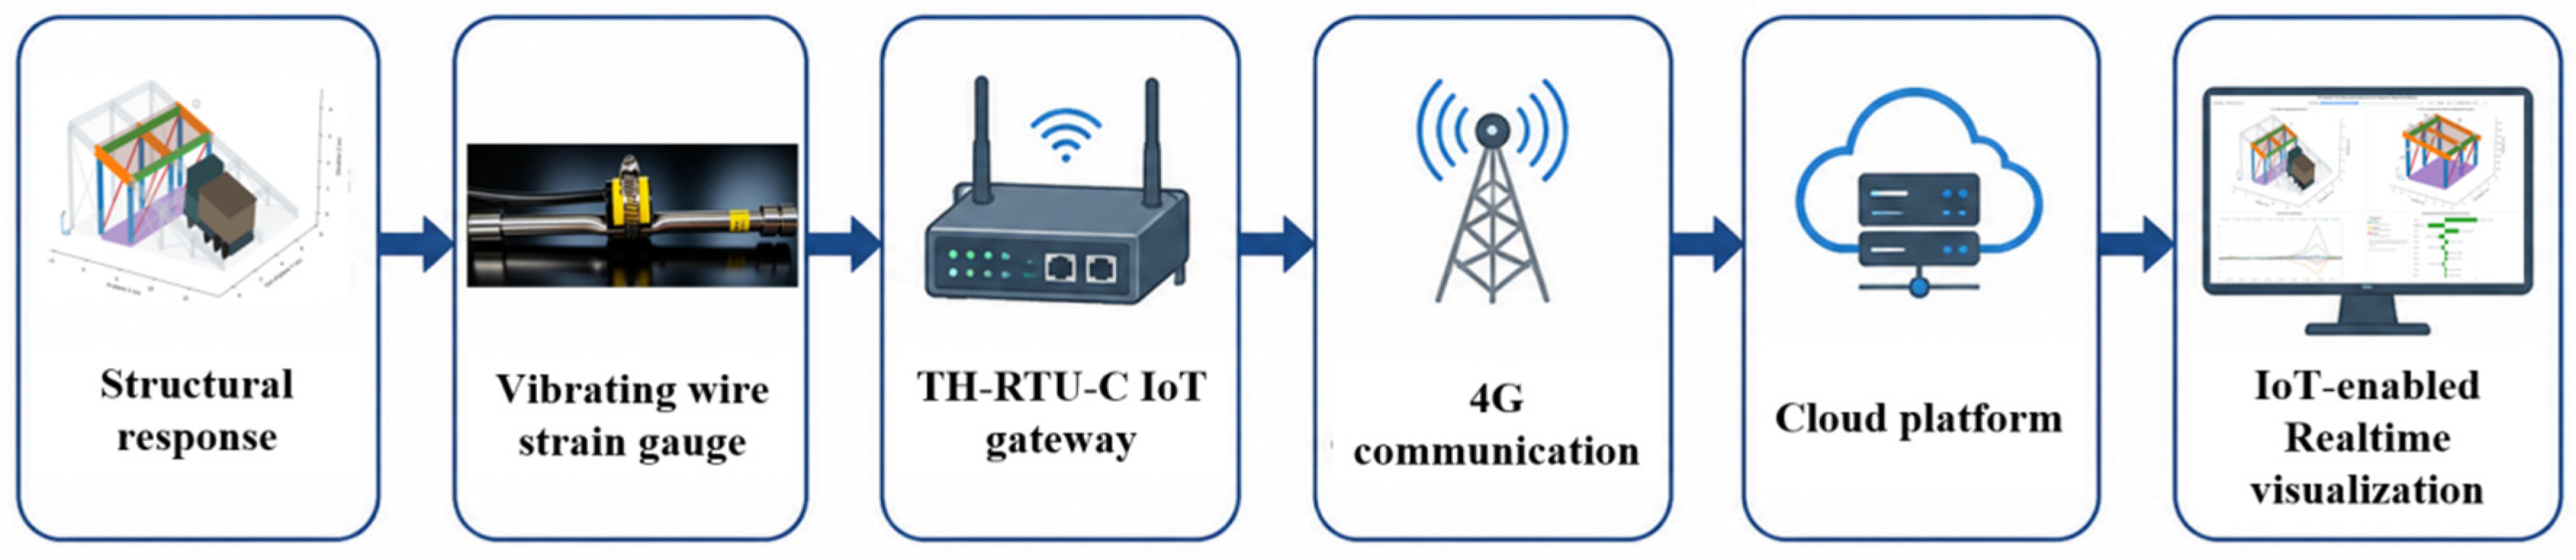
Figure 3.
Proposed IoT-enabled framework for real-time VWSG monitoring and local strain-based safety assessment of the sloped steel platform.
Figure 3.
Proposed IoT-enabled framework for real-time VWSG monitoring and local strain-based safety assessment of the sloped steel platform.
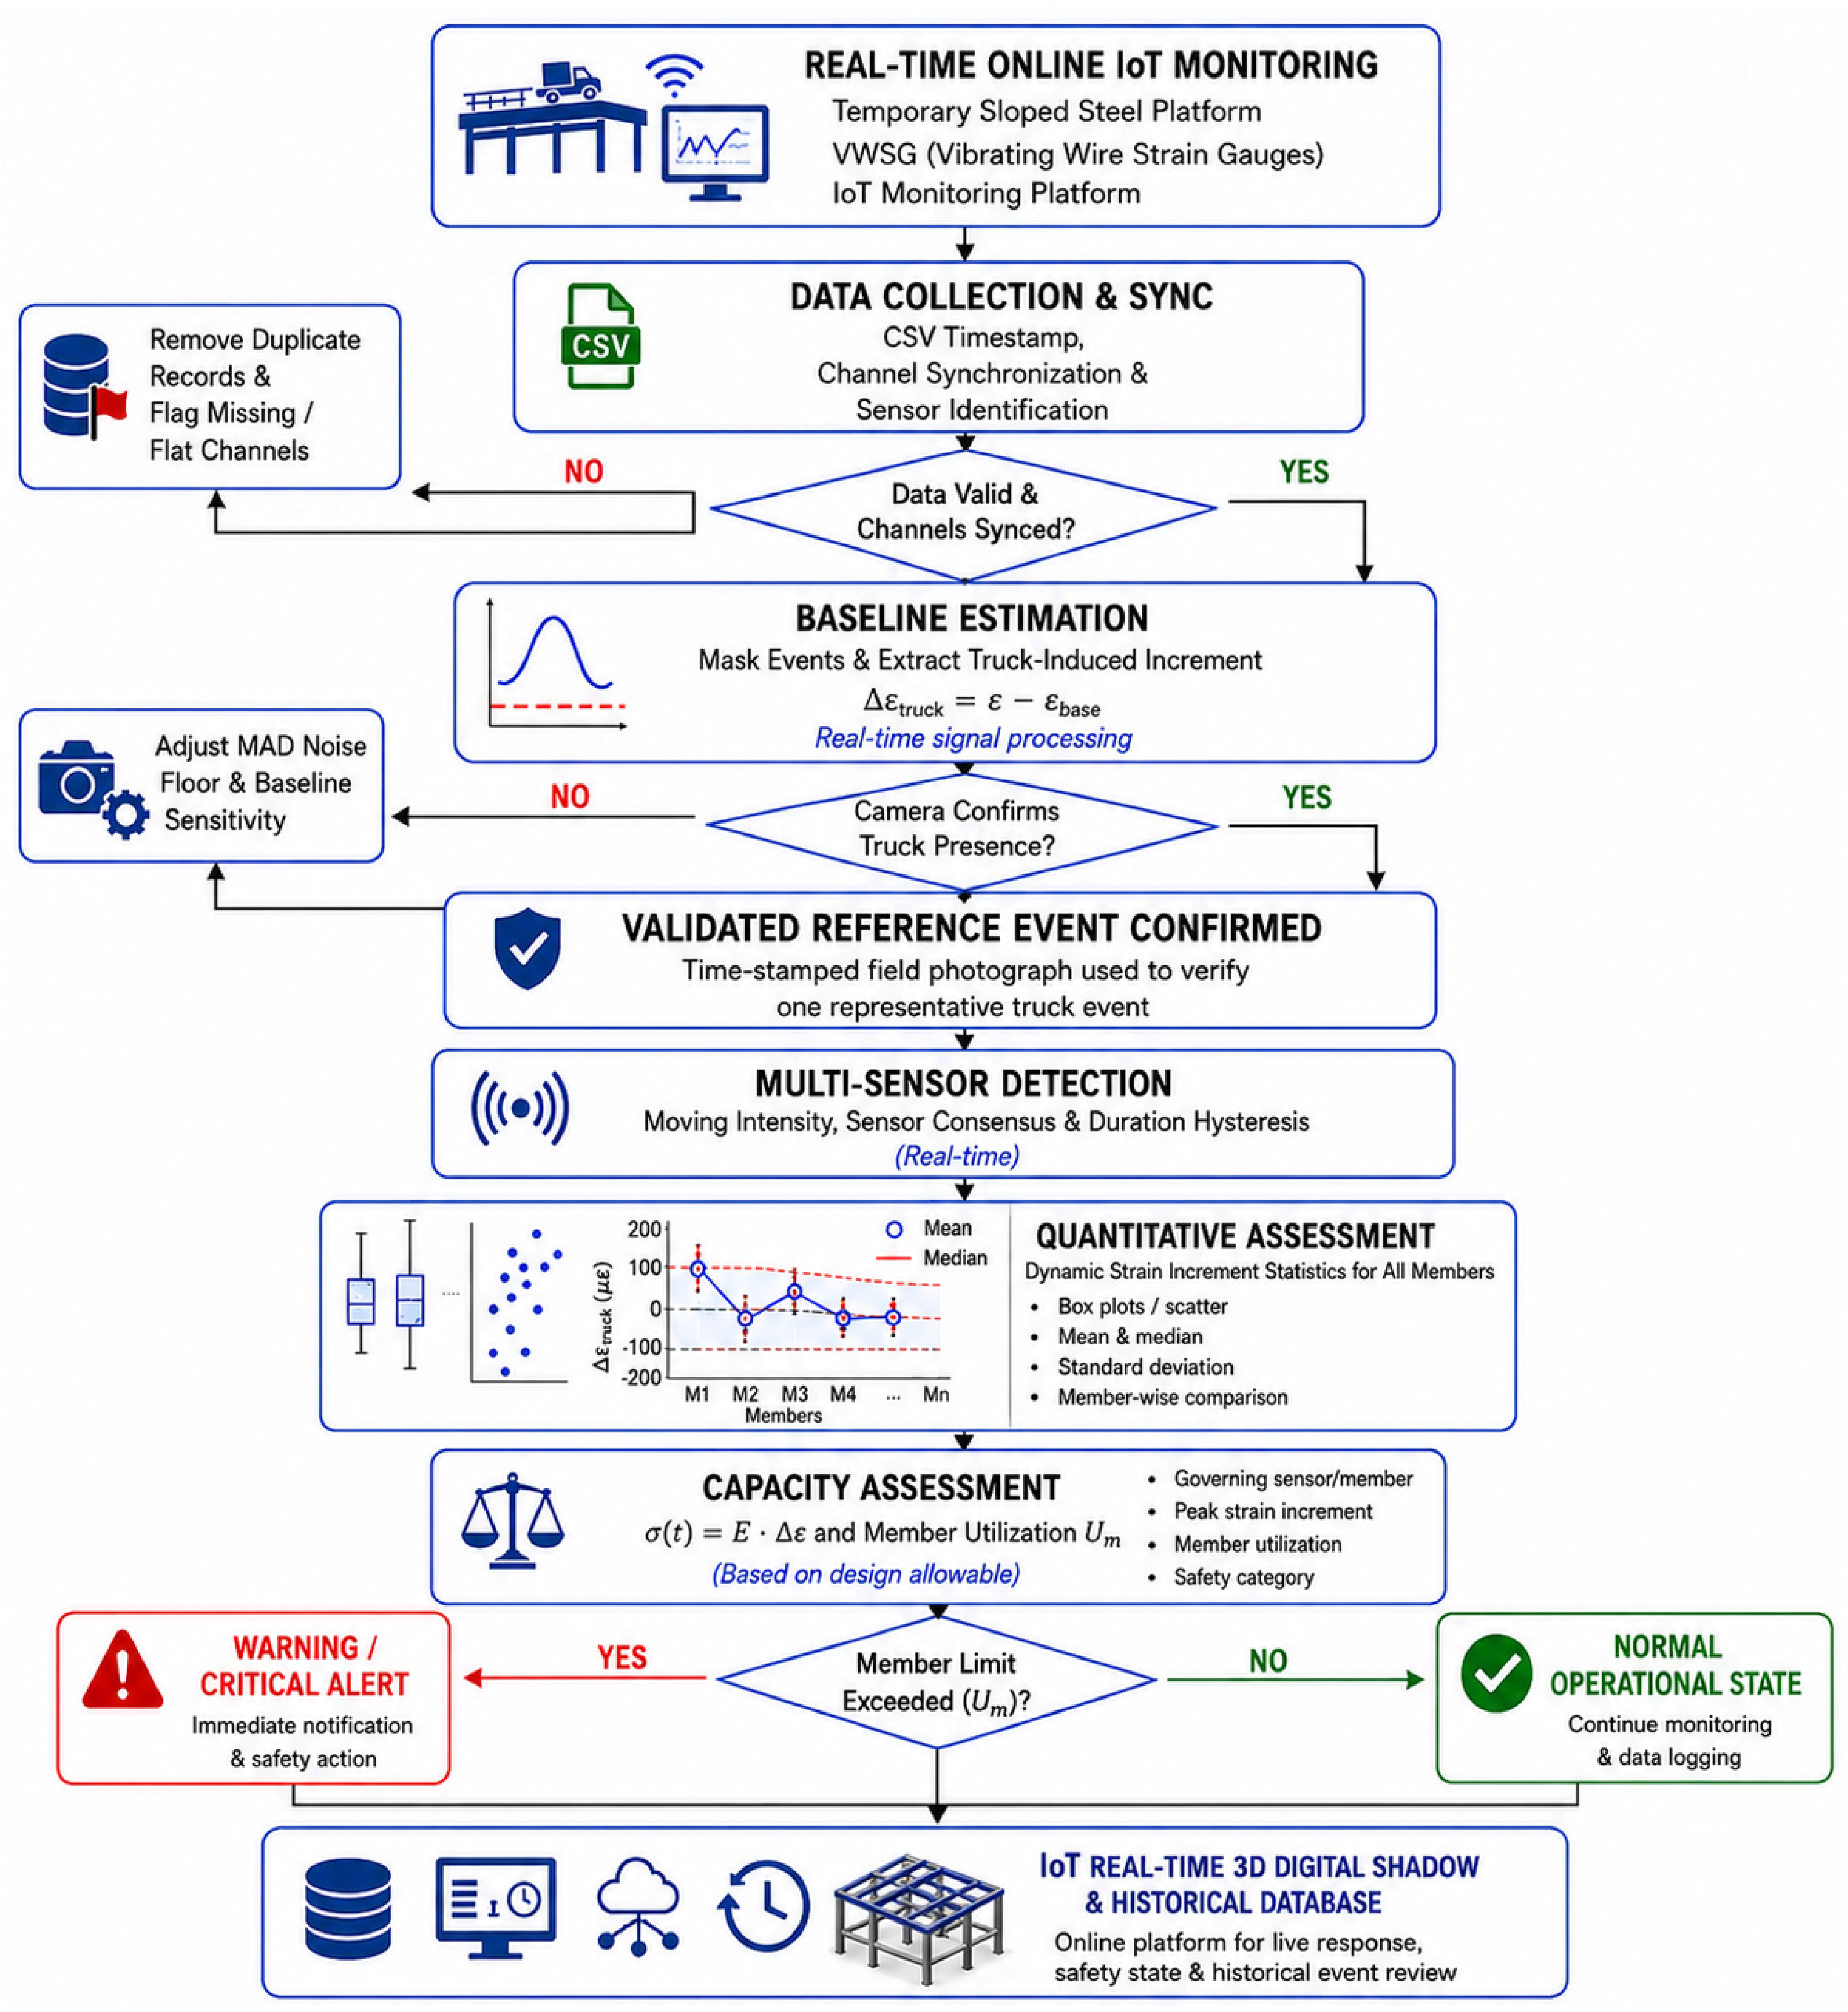
Figure 4.
Photograph-documented truck event and corresponding VWSG responses: (a) field photograph, (b) raw strain histories, and (c) baseline-corrected strain increments with the baseline, truck-event, and recovery intervals highlighted.
Figure 4.
Photograph-documented truck event and corresponding VWSG responses: (a) field photograph, (b) raw strain histories, and (c) baseline-corrected strain increments with the baseline, truck-event, and recovery intervals highlighted.
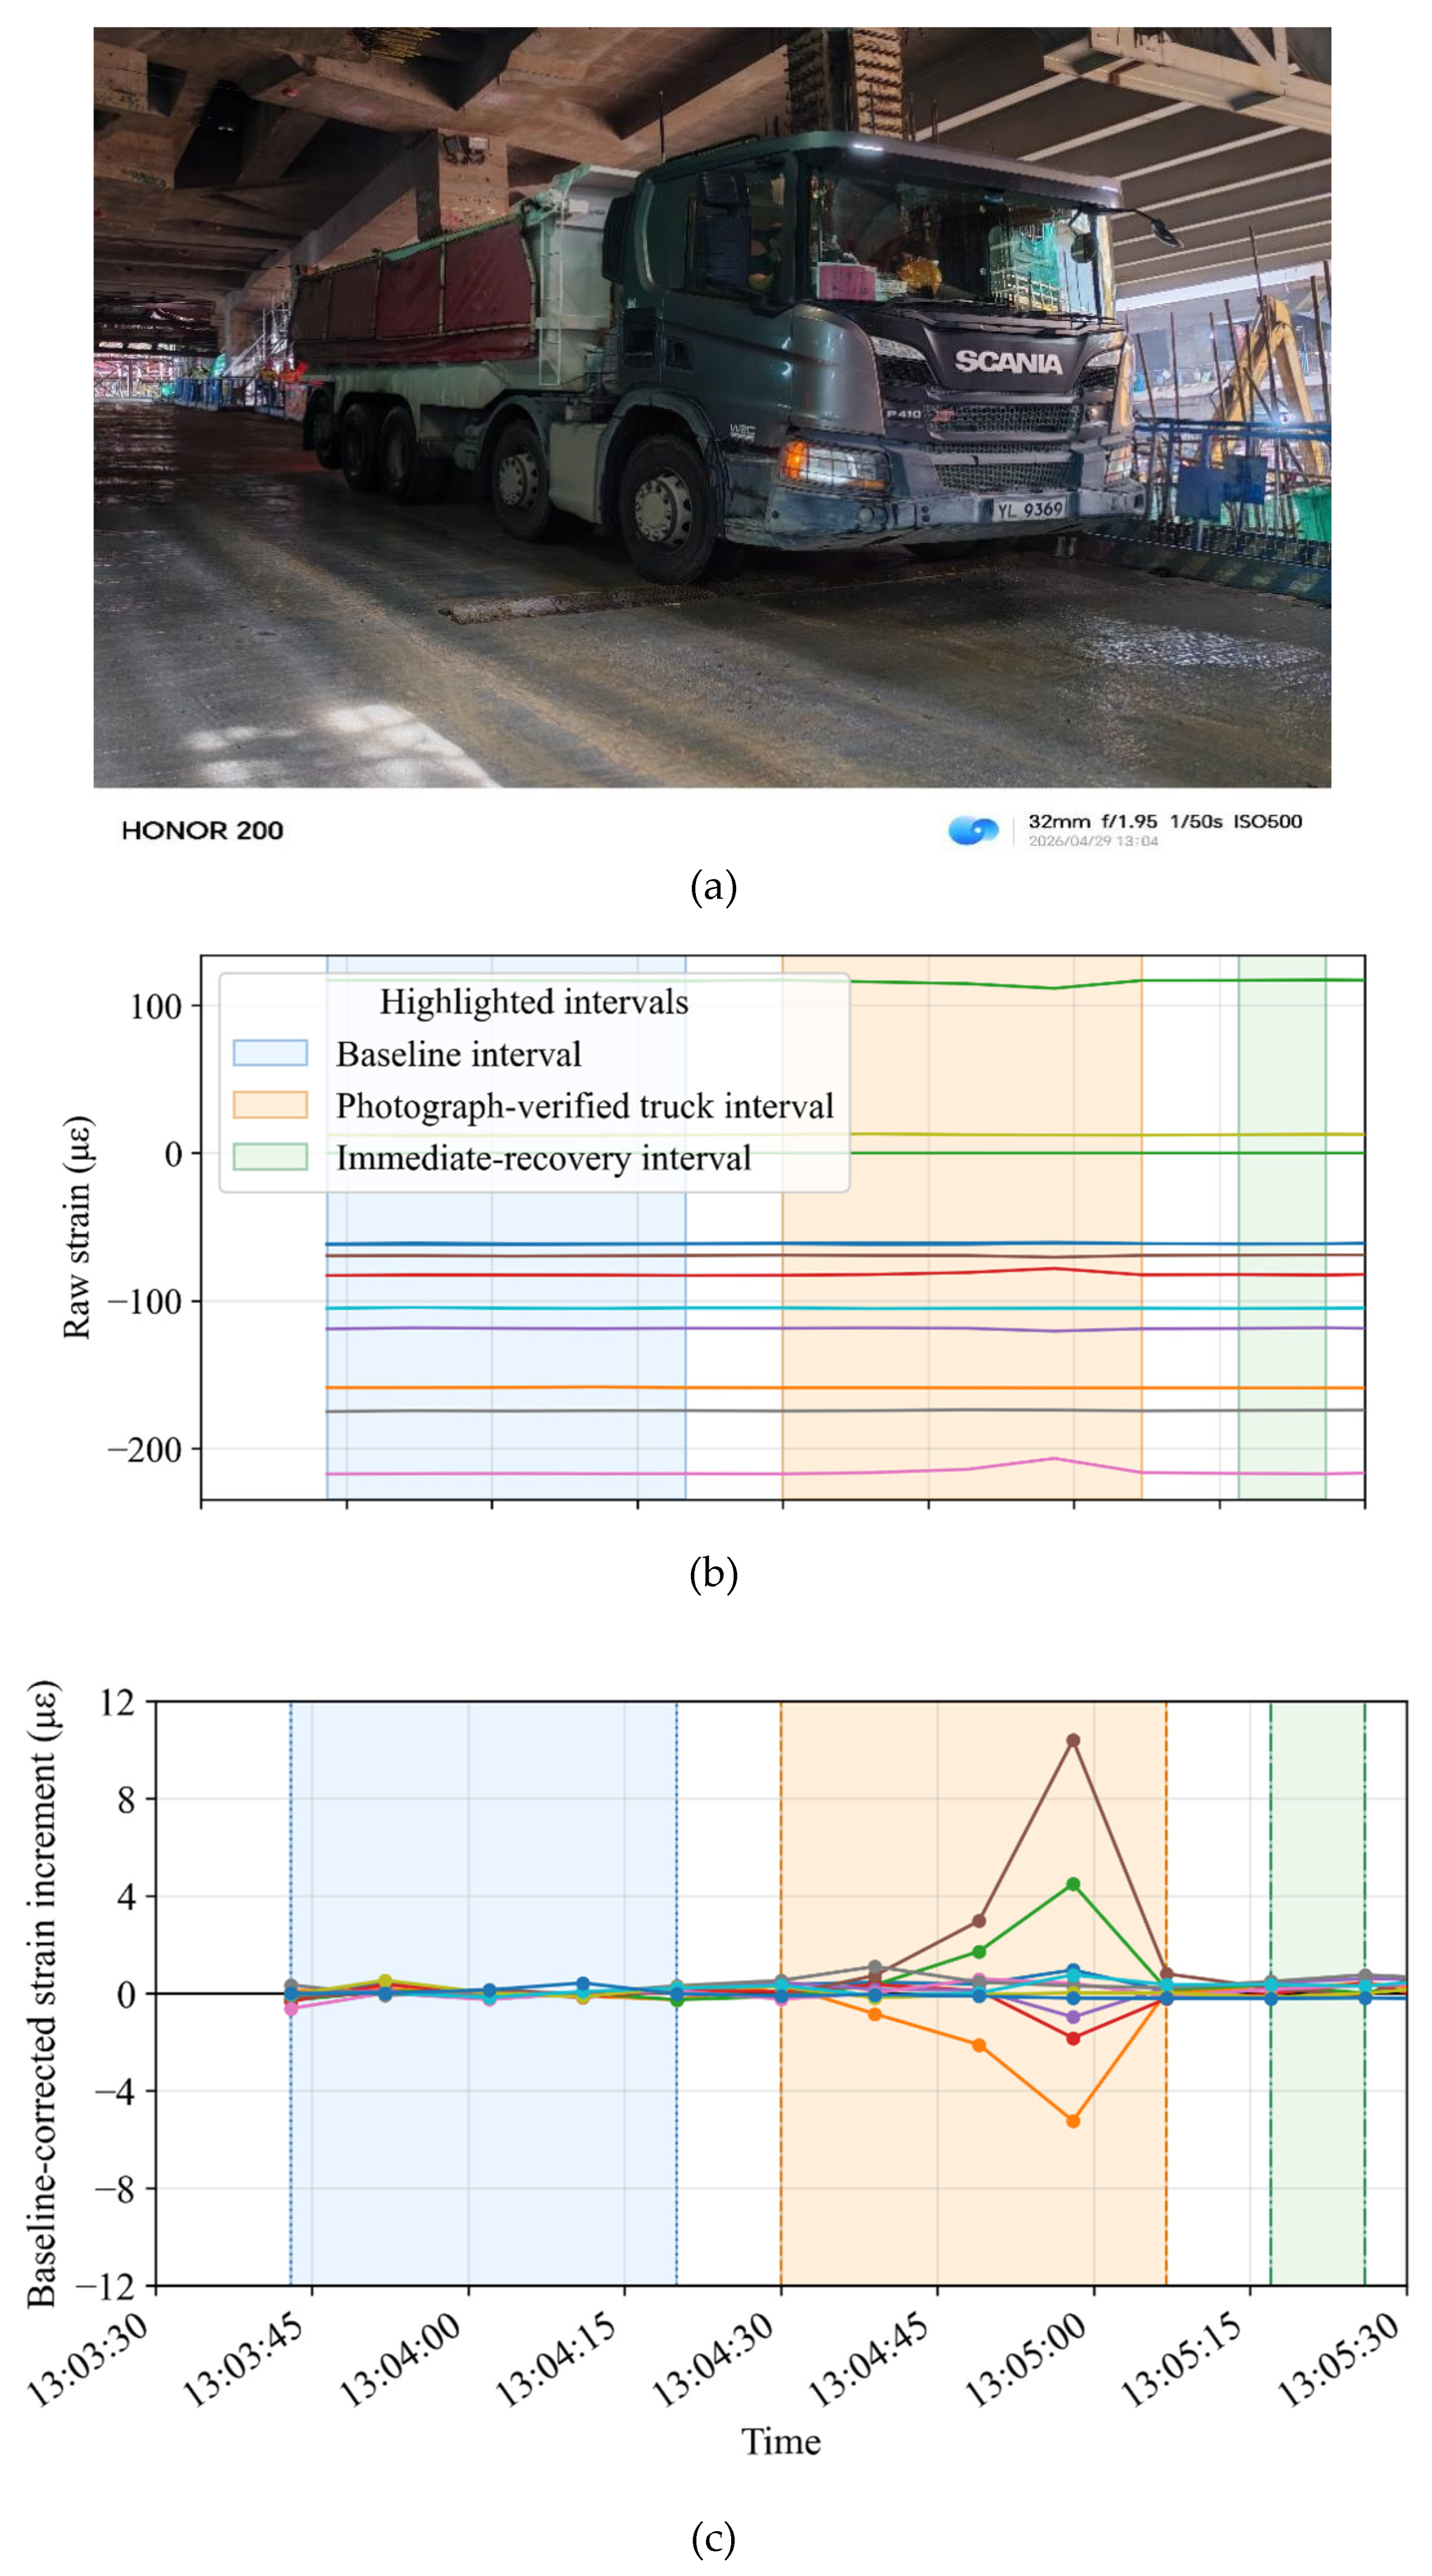
Figure 5.
Signed maximum strain increment recorded by each valid VWSG channel during the photograph-documented reference event.
Figure 5.
Signed maximum strain increment recorded by each valid VWSG channel during the photograph-documented reference event.
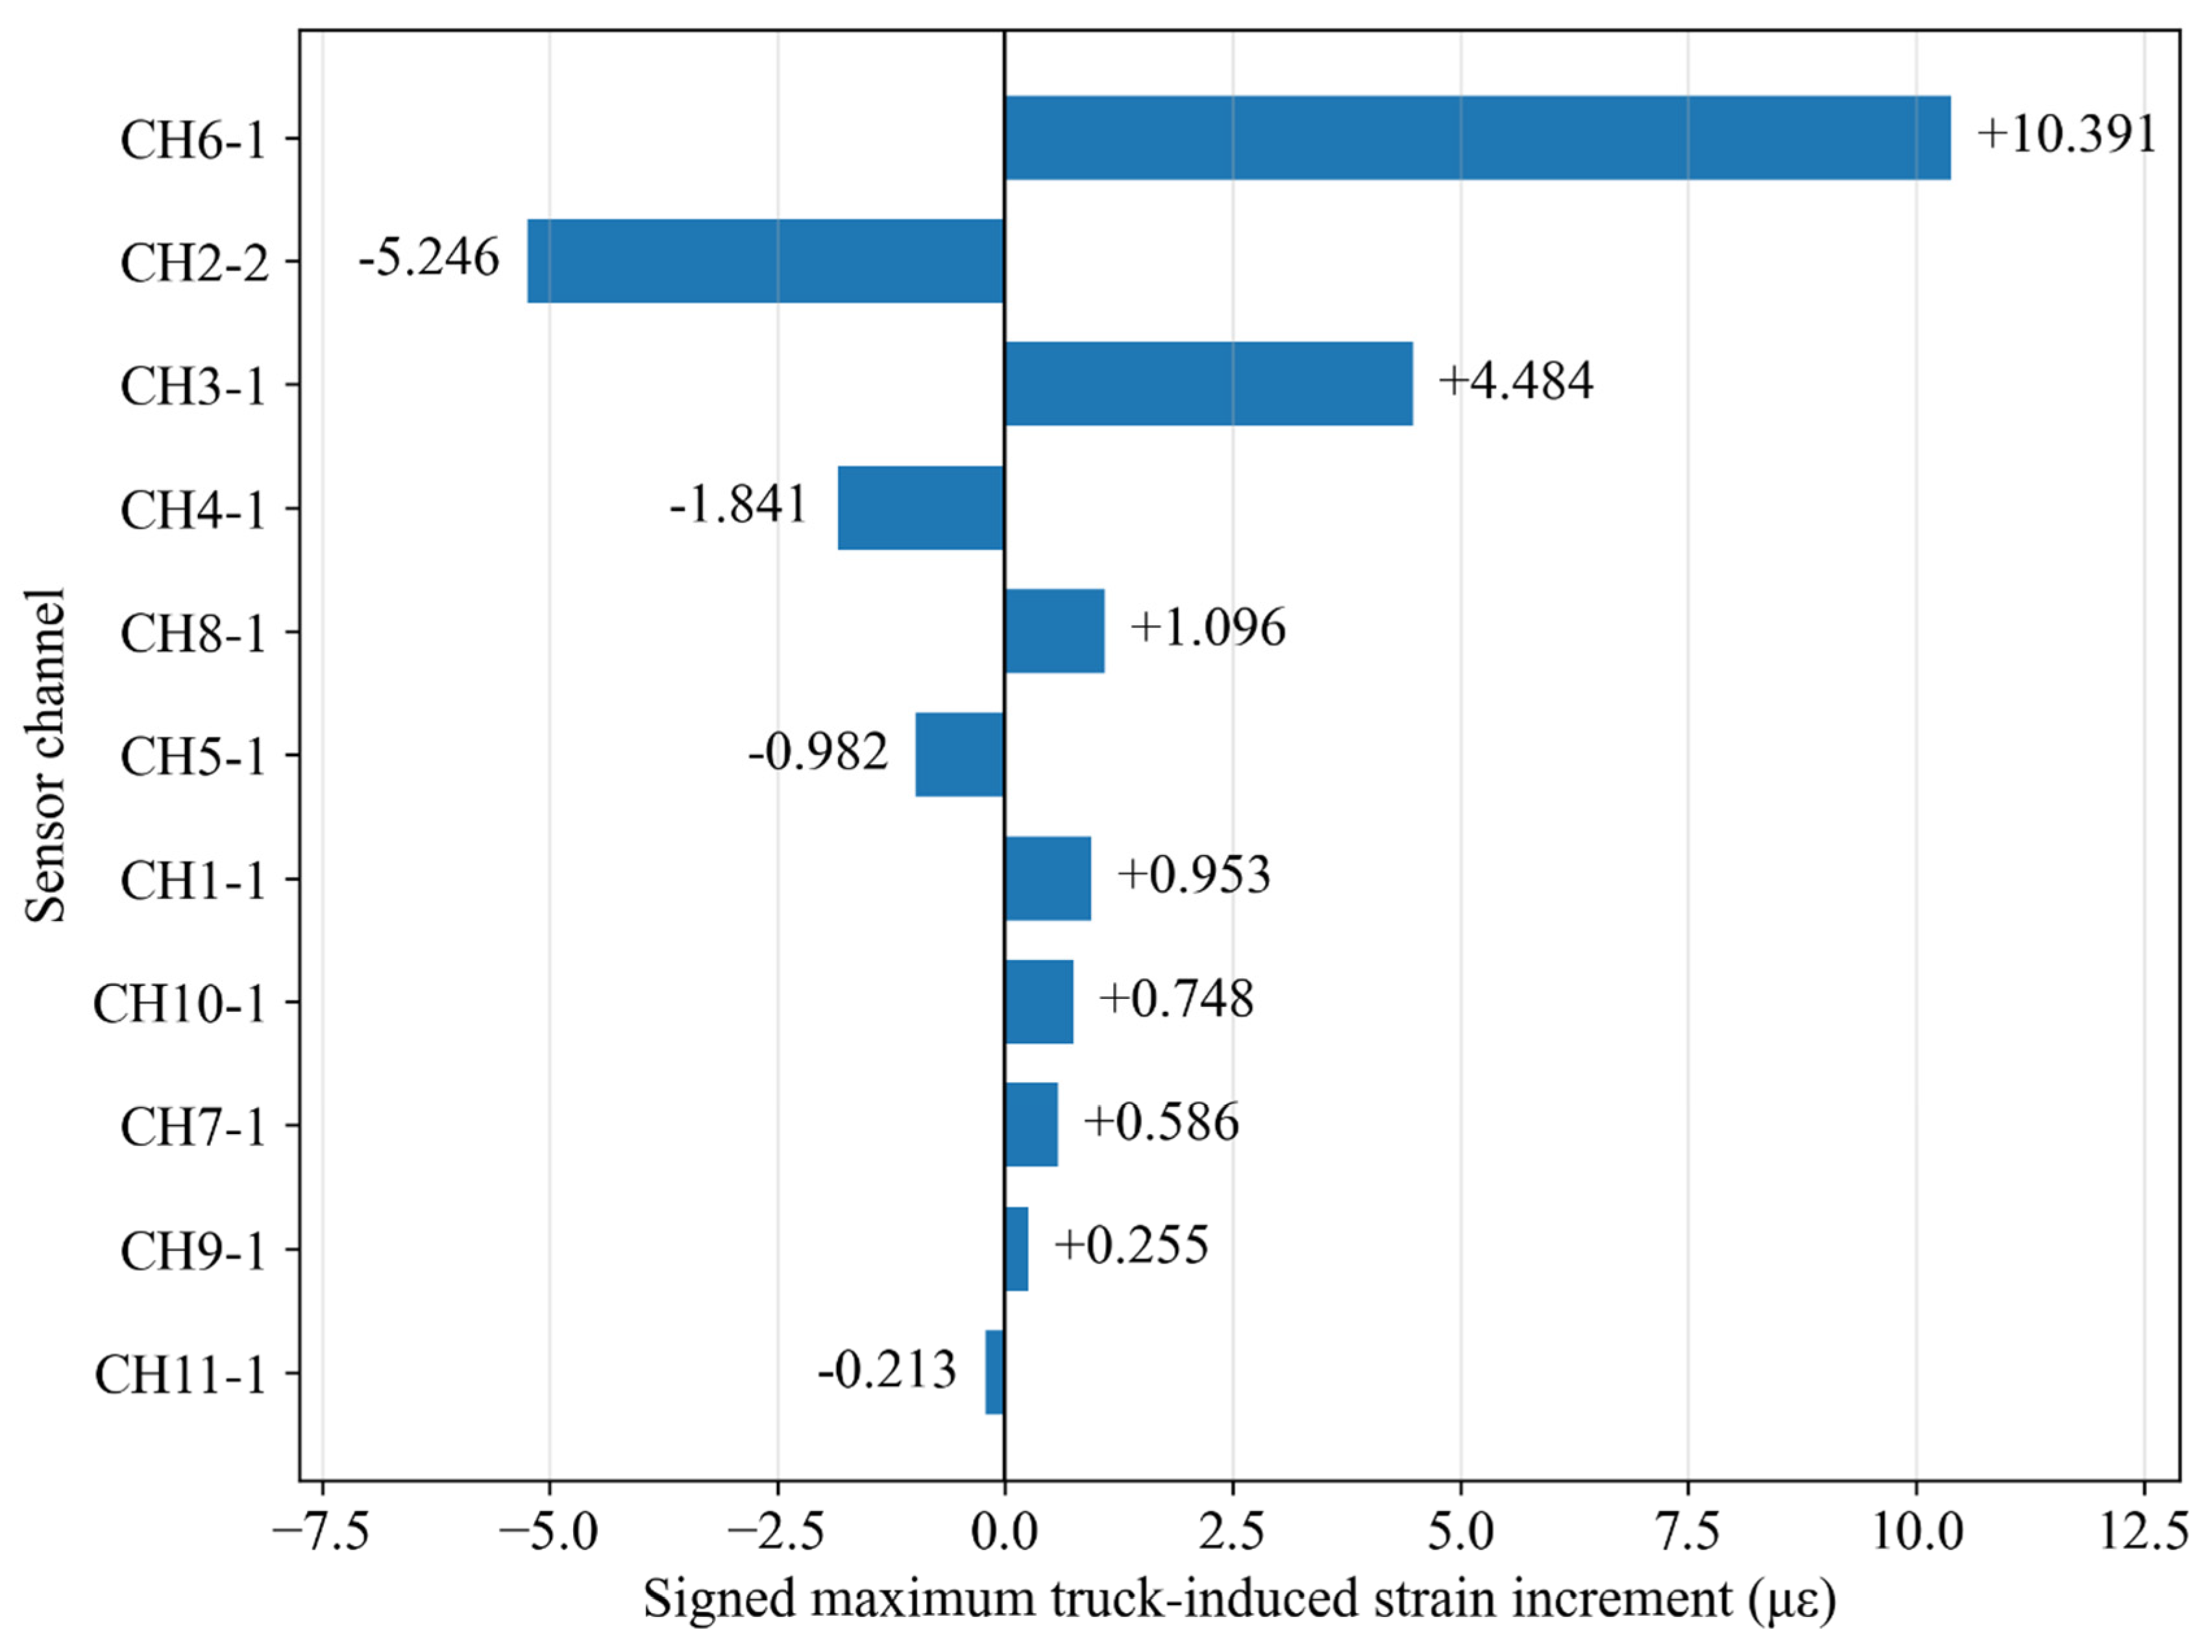
Figure 6.
Peak standardized response of each valid VWSG channel relative to its pre-event background variation.
Figure 6.
Peak standardized response of each valid VWSG channel relative to its pre-event background variation.
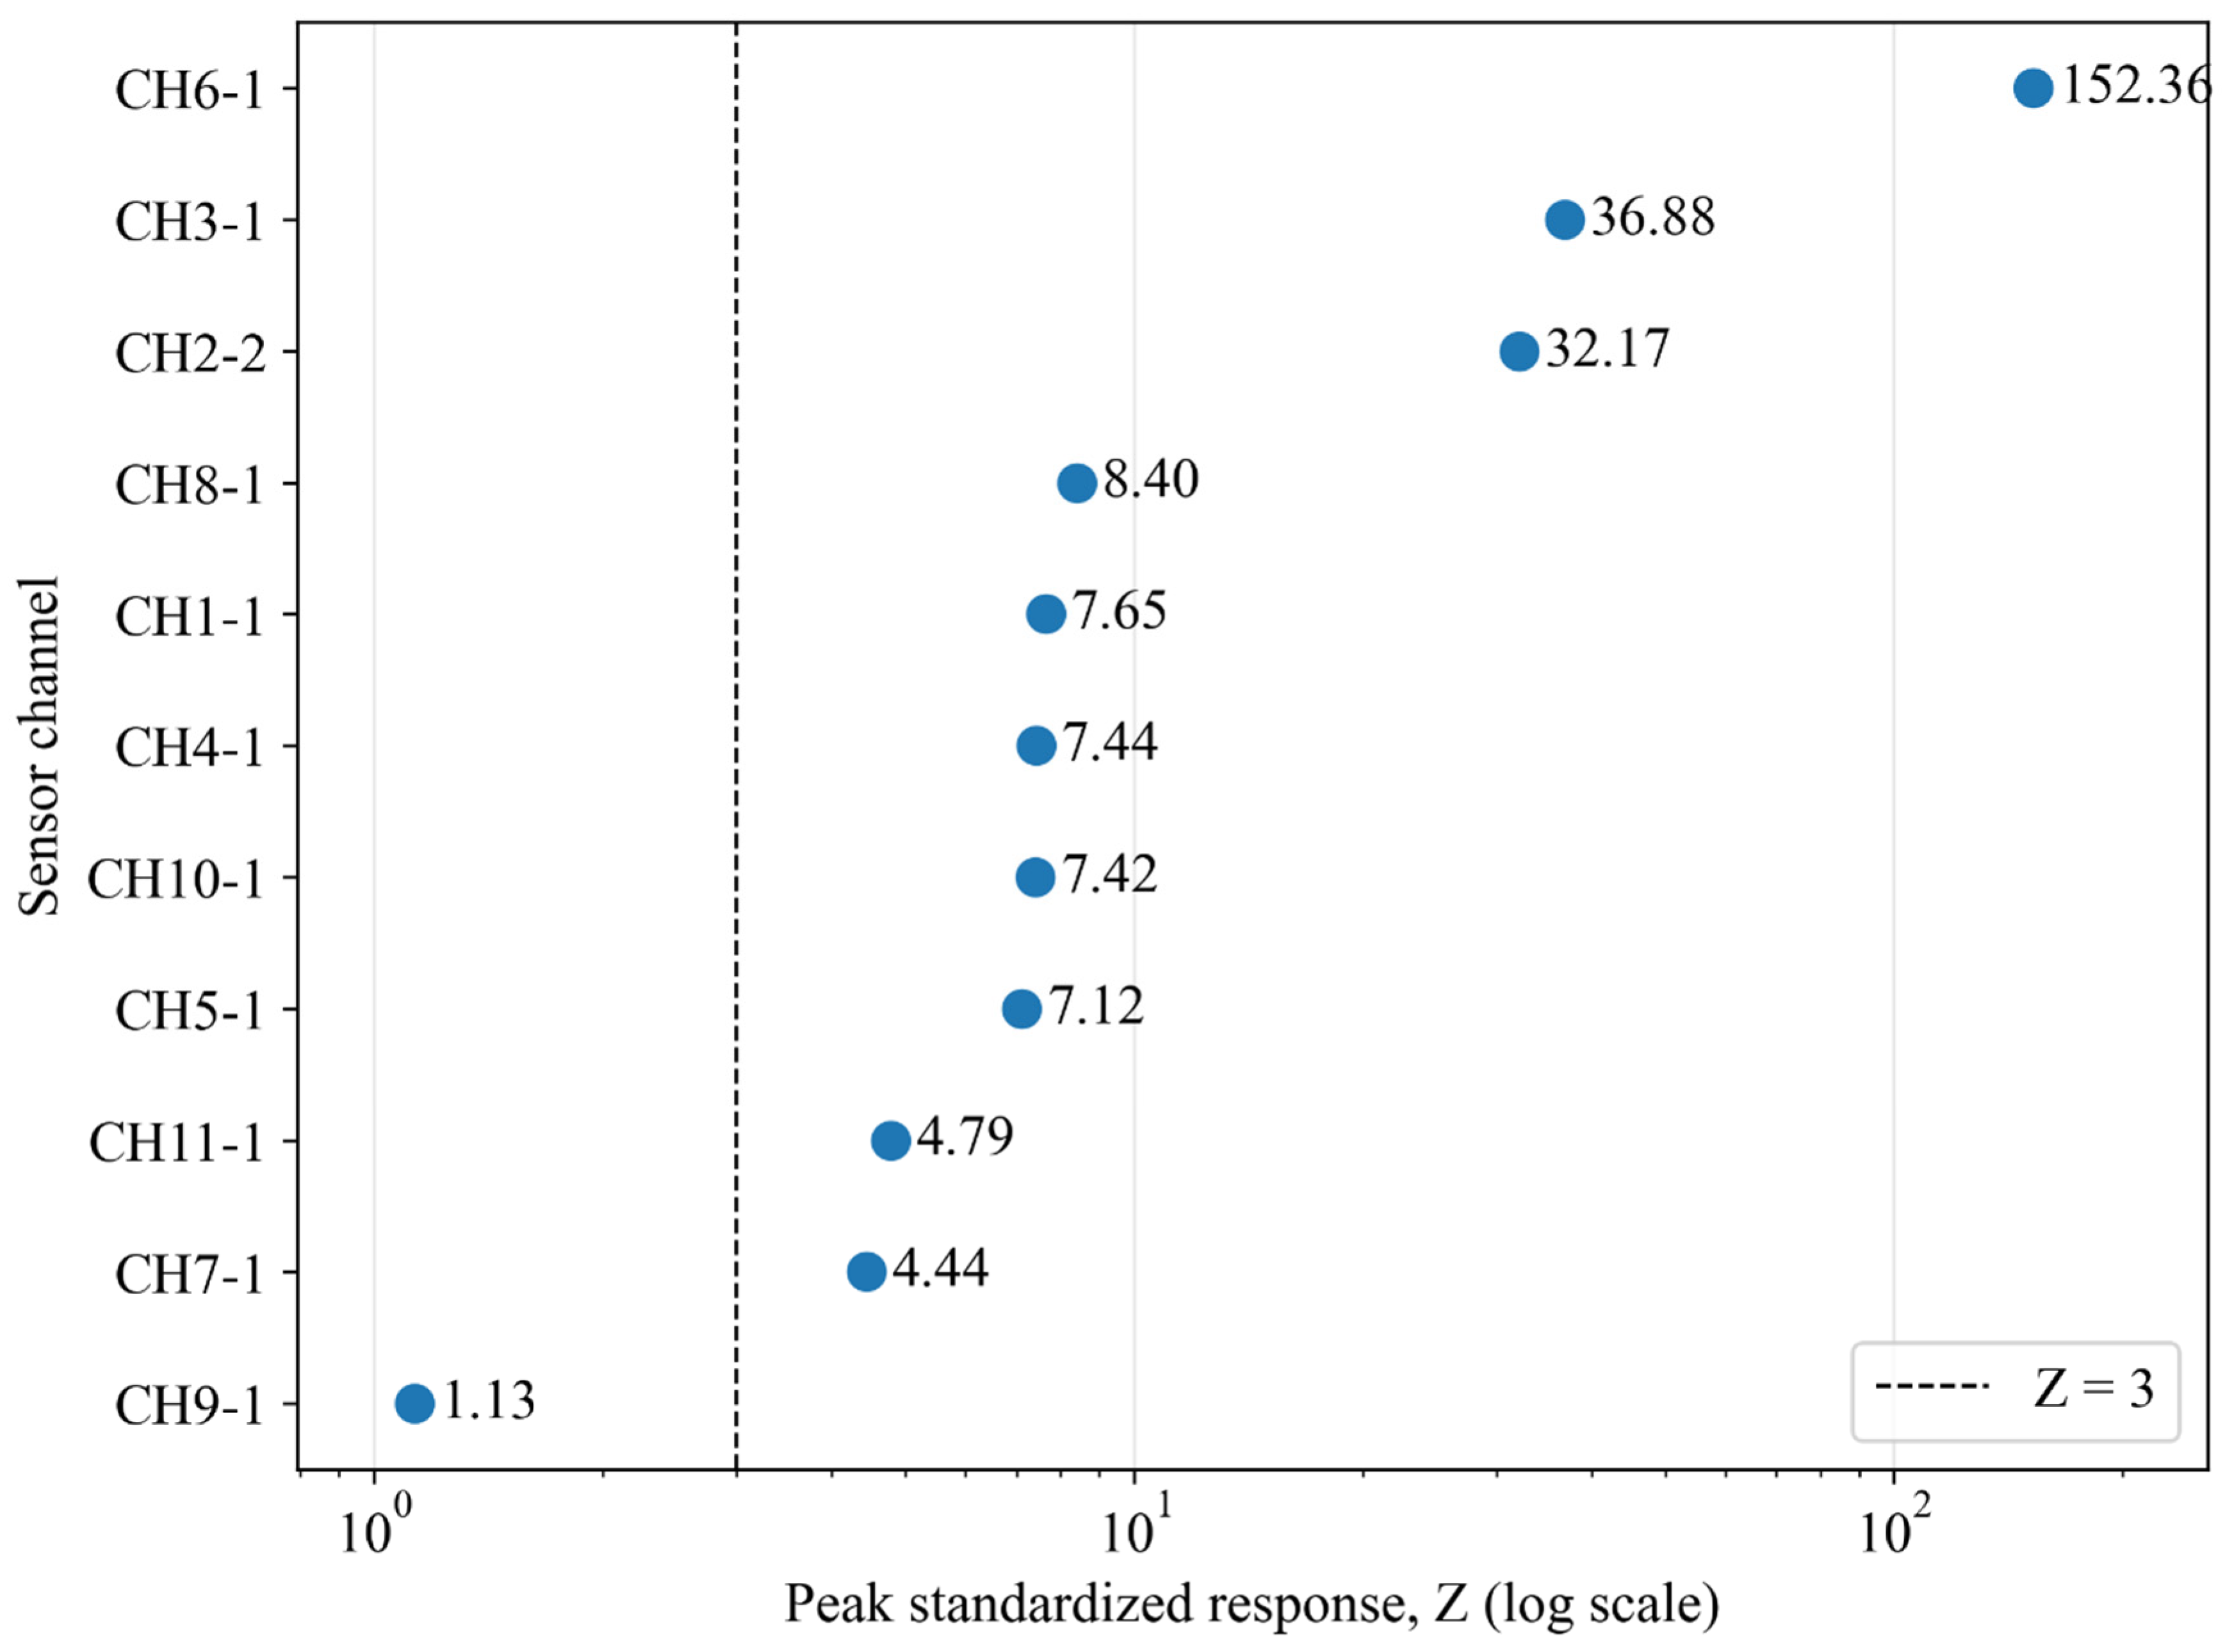
Figure 7.
Top five global standardized response index and active-channel count calculated from all 11 valid VWSG channels.
Figure 7.
Top five global standardized response index and active-channel count calculated from all 11 valid VWSG channels.
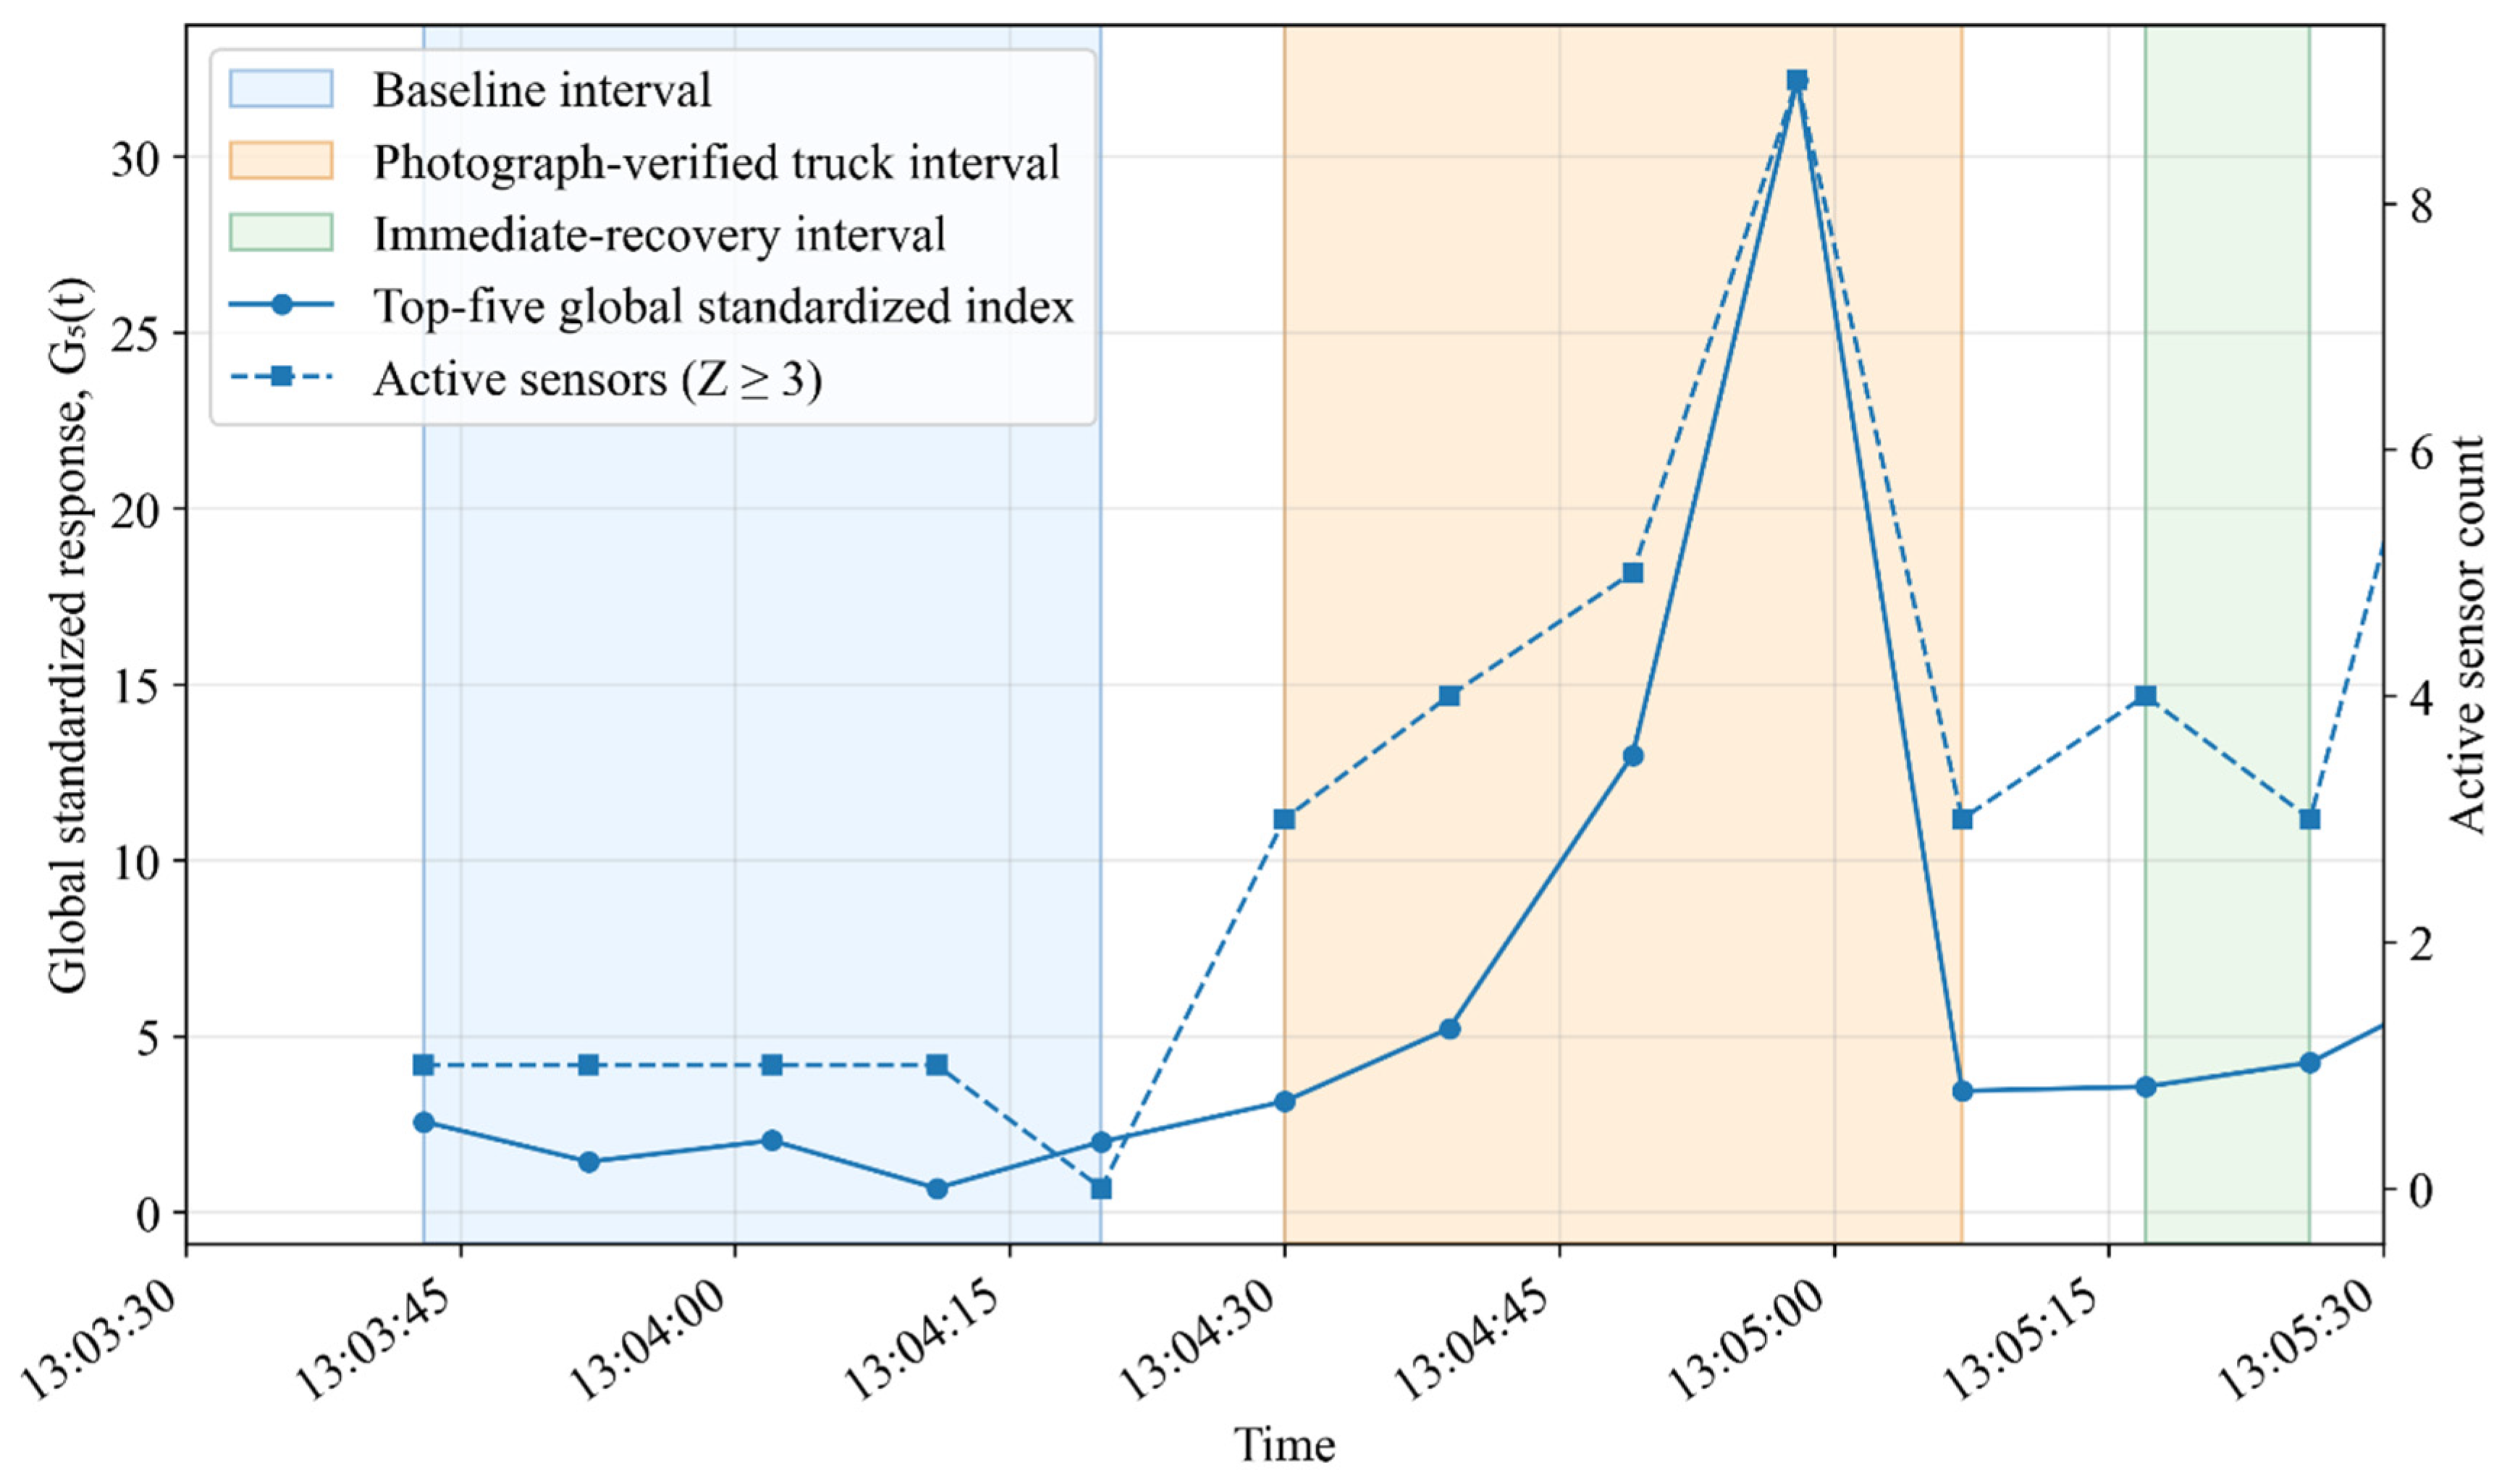
Figure 8.
Comparison of the absolute event peak and immediate residual strain for each valid VWSG channel.
Figure 8.
Comparison of the absolute event peak and immediate residual strain for each valid VWSG channel.
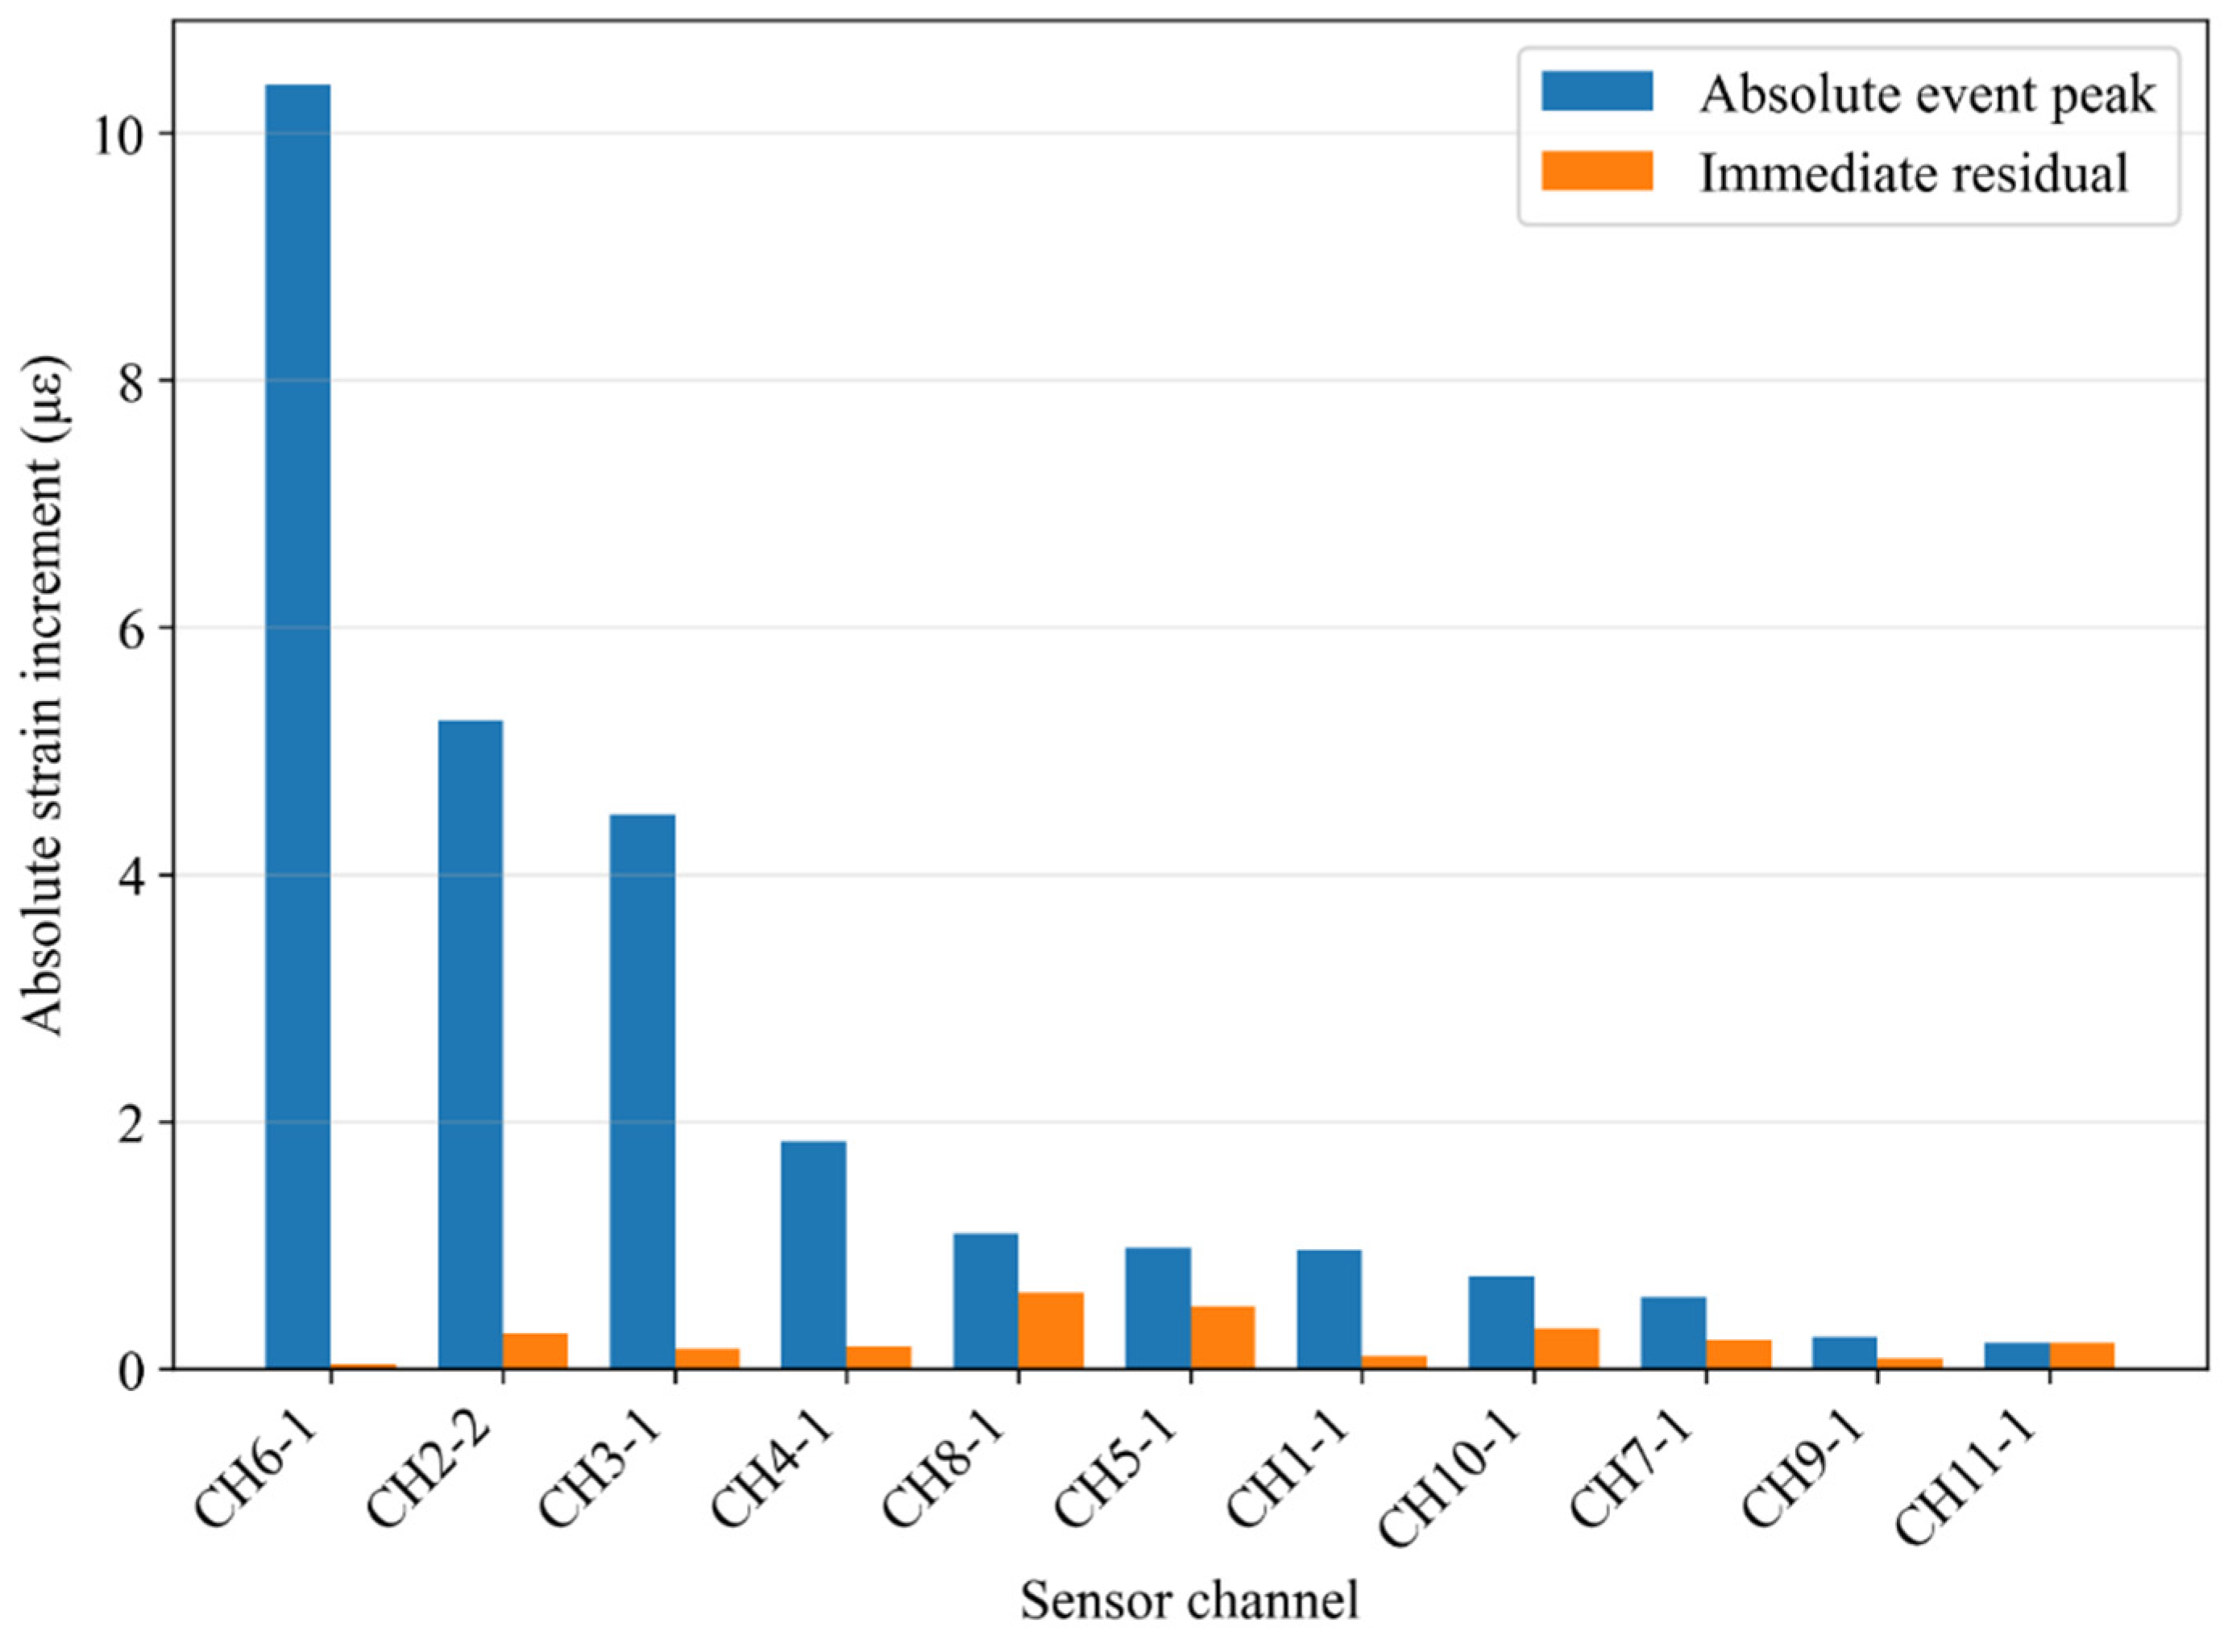
Figure 9.
Sensitivity of the extracted peak strain increments to the adopted baseline method; the dashed line represents 1:1 agreement.
Figure 9.
Sensitivity of the extracted peak strain increments to the adopted baseline method; the dashed line represents 1:1 agreement.
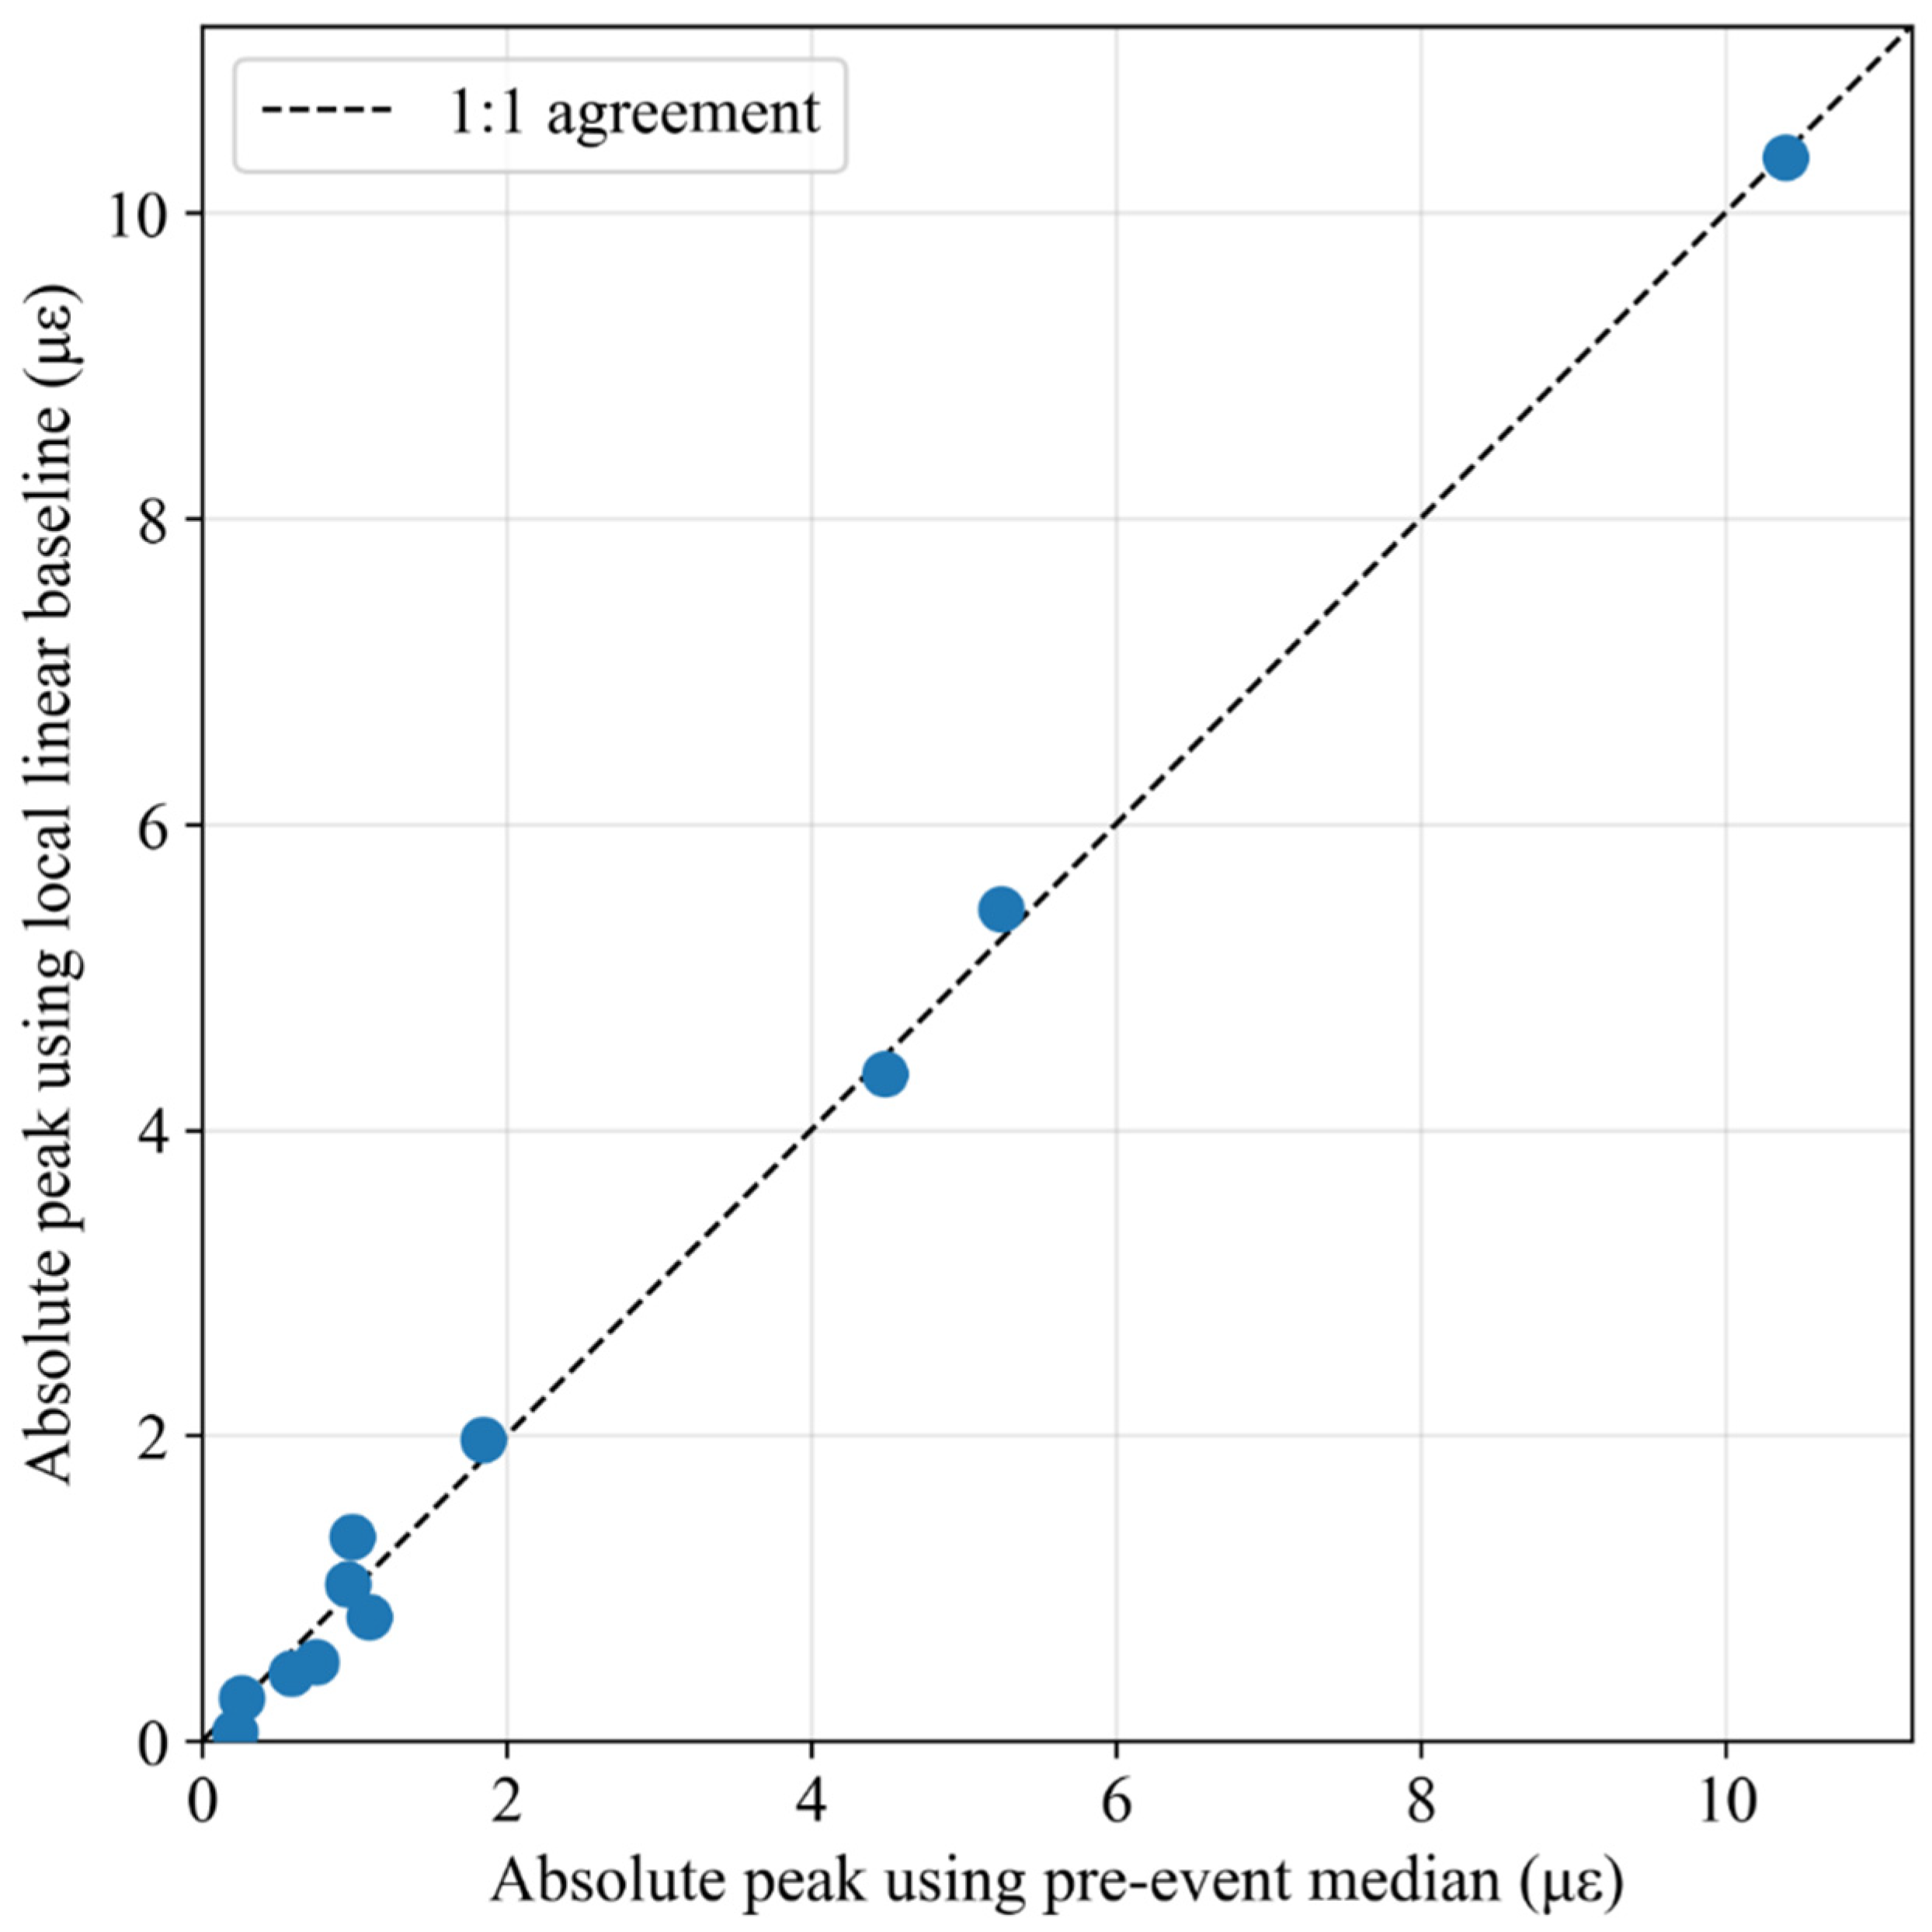
Figure 10.
Complete-record distributions of reference-consistent candidate strain increments for the monitored VWSG channels.
Figure 10.
Complete-record distributions of reference-consistent candidate strain increments for the monitored VWSG channels.
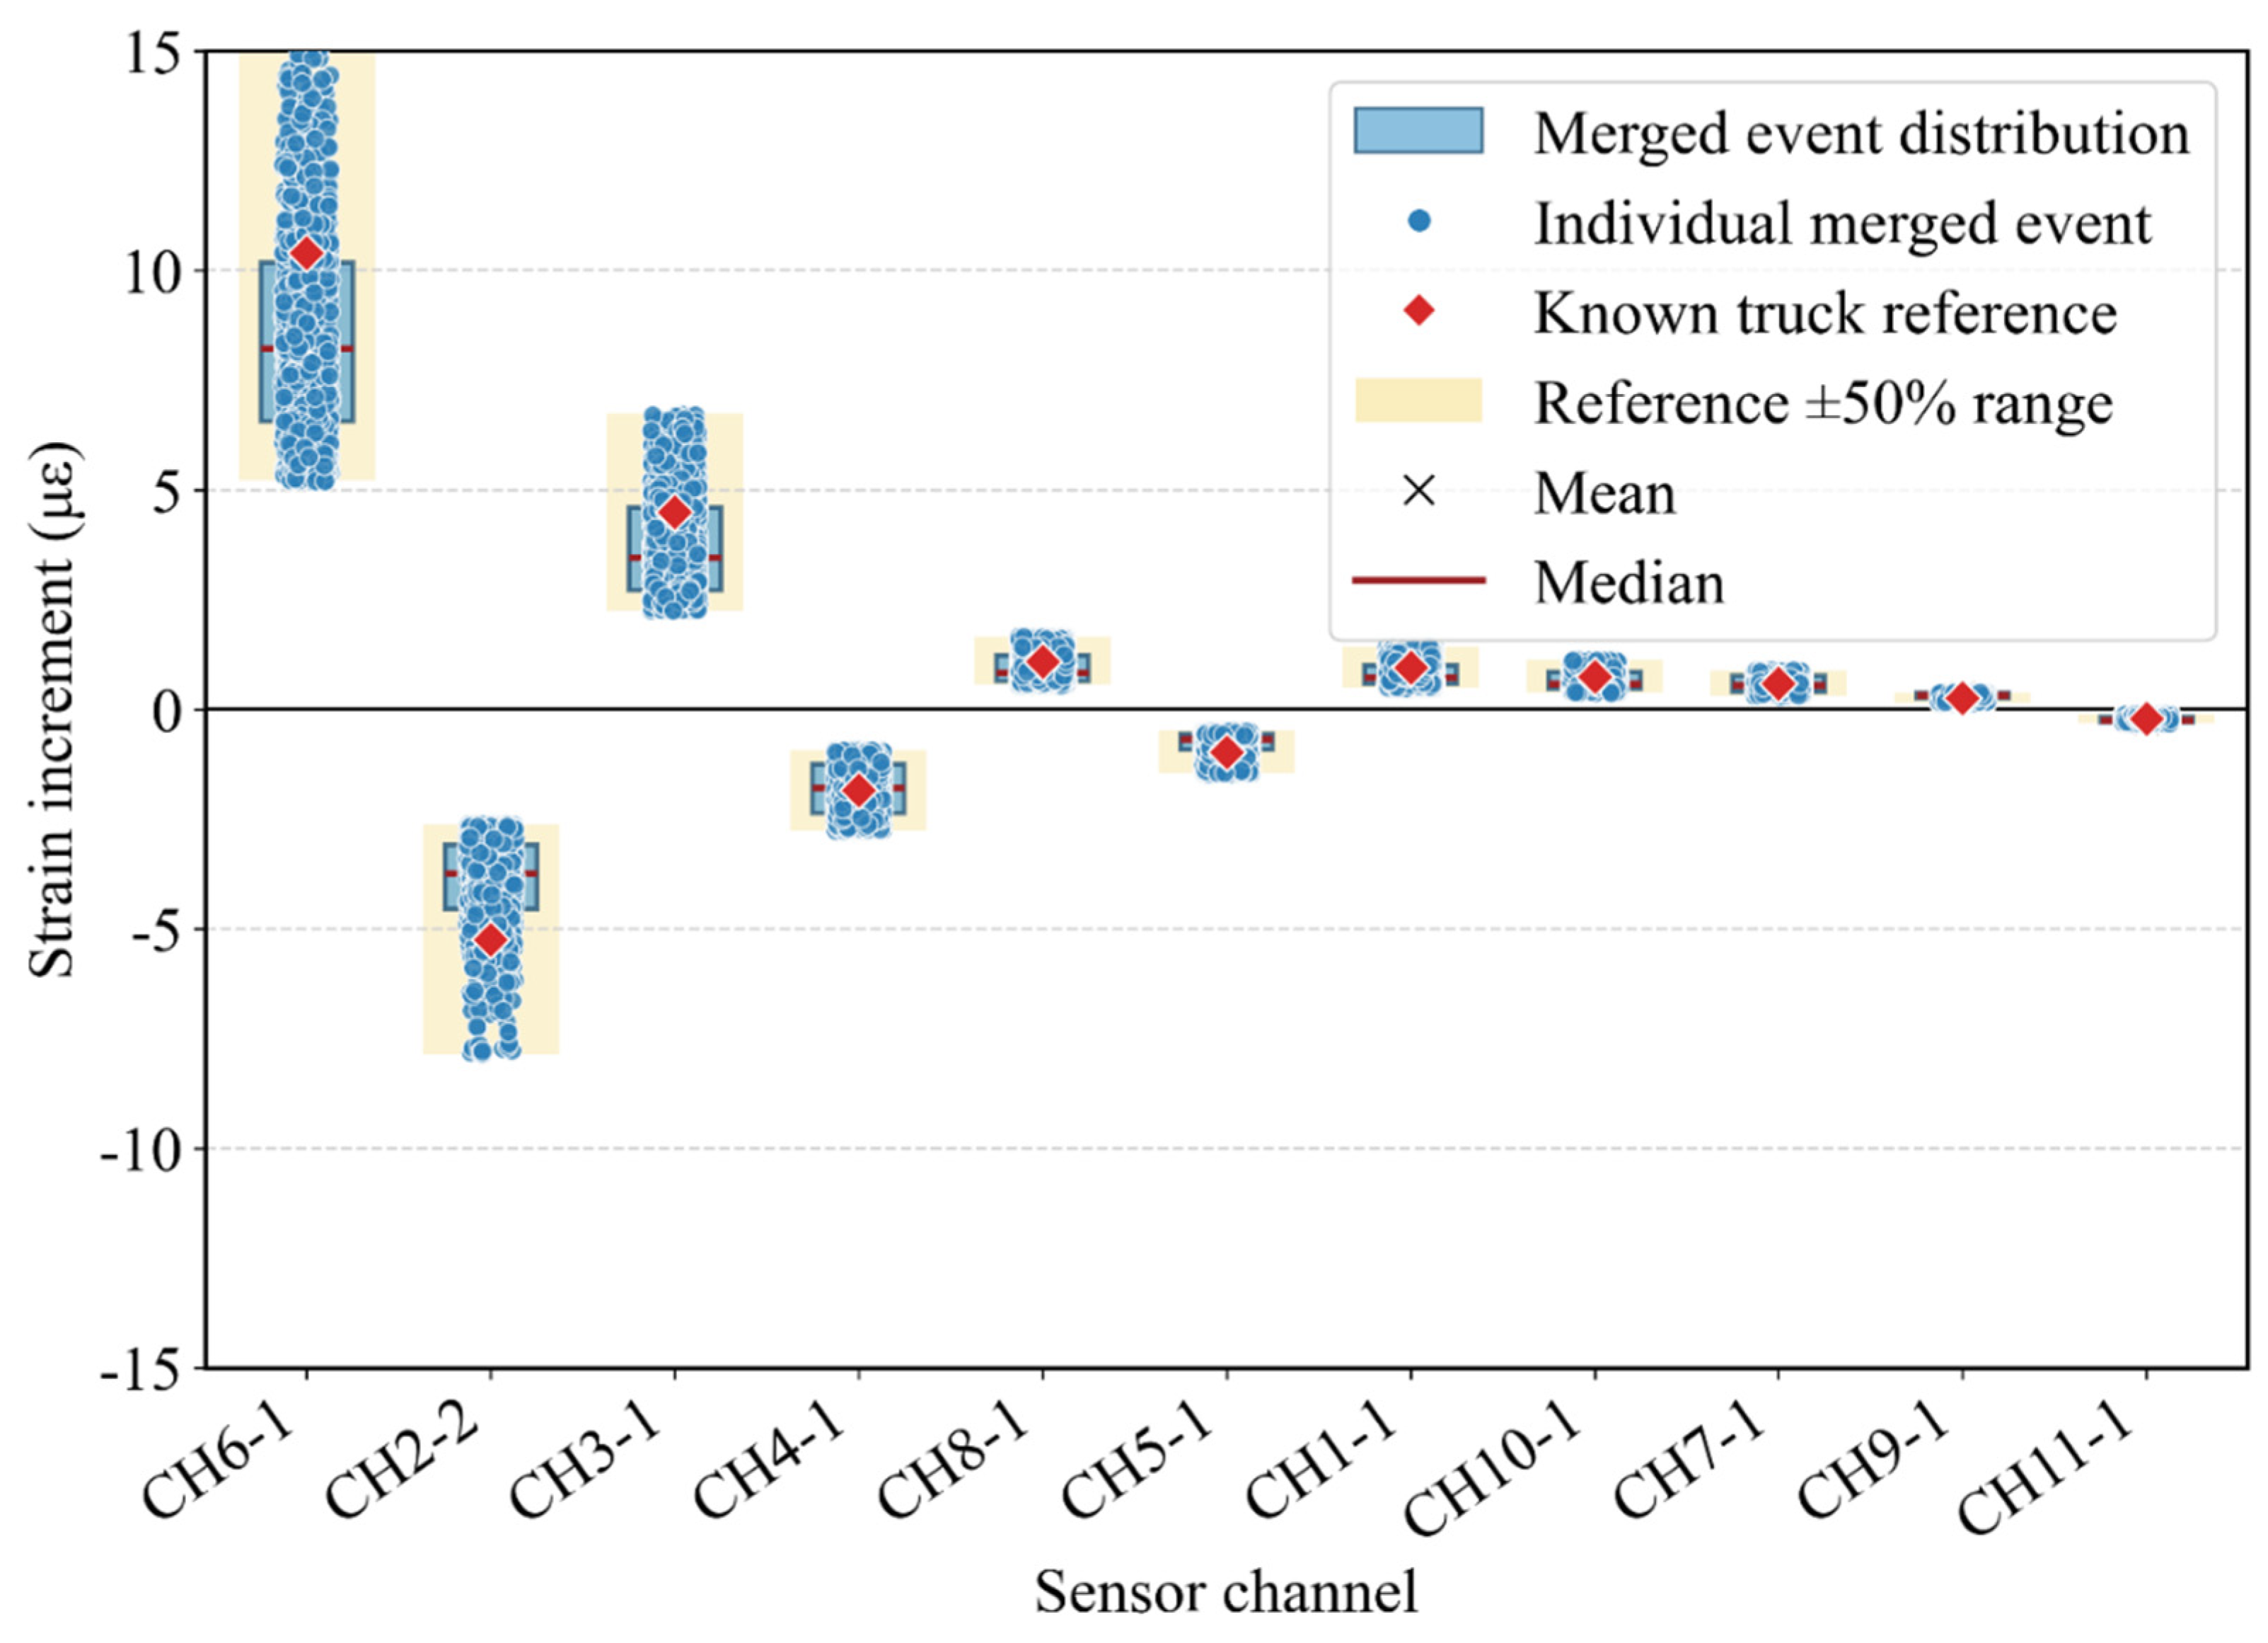
Table 2.
VWSG assignments to the monitor structural components.
| Monitored component | VWSG labels |
|---|---|
| Sloping rafters | 1-1, 1-2, 1-3 |
| Longitudinal members | 2-1, 2-2, 1-4, 1-5 |
| Columns | 2-3, 2-5, 2-7, 1-7 |
| Diagonal braces | 2-4, 2-6, 1-6, 1-8 |
Disclaimer/Publisher’s Note: The statements, opinions and data contained in all publications are solely those of the individual author(s) and contributor(s) and not of MDPI and/or the editor(s). MDPI and/or the editor(s) disclaim responsibility for any injury to people or property resulting from any ideas, methods, instructions or products referred to in the content. |
© 2026 by the authors. Licensee MDPI, Basel, Switzerland. This article is an open access article distributed under the terms and conditions of the Creative Commons Attribution (CC BY) license (http://creativecommons.org/licenses/by/4.0/).
Copyright: This open access article is published under a Creative Commons CC BY 4.0 license, which permit the free download, distribution, and reuse, provided that the author and preprint are cited in any reuse.