
Submitted:
14 October 2026
Posted:
16 October 2026
You are already at the latest version
Abstract
Background/Objectives: Associations between the Dietary Inflammatory Index (DII) and cardiovascular disease (CVD) in the National Health and Nutrition Examination Survey (NHANES) have usually relied on selected cycles, short-term recalls, and prevalent disease. This study examined the association’s consistency across survey periods, its dependence on recall measurement error, and reverse causation. Methods: Adults aged ≥20 years in NHANES 2005–2018 with two 24 h recalls (n = 30,579) were analyzed with survey-weighted logistic regression of self-reported CVD on a 27-parameter DII. Pre-specified analyses were an equivalence test of 2005–2010 versus 2011–2018, regression calibration using the replicate recall, restrictions for post-diagnosis dietary change, and survey-weighted Cox models for mortality through 2019 in 27,239 adults free of CVD. Results: Each 1-unit higher DII was associated with higher odds of CVD (odds ratio [OR] 1.09, 95% CI 1.03–1.15). Period-specific ORs were 1.09 and 1.08, but equivalence within ±10% was not established (interaction-model ratio of ORs per SD 0.94, 90% CI 0.85–1.04). After calibration, ORs per unit of usual DII were 1.17 (1.07–1.27) for the two-day mean and 1.20 (1.10–1.31) for day one. Excluding special diets or restricting to diagnoses within 5 or 10 years did not attenuate the association. Hazard ratios were 1.09 (0.98–1.21) for CVD mortality and 1.09 (1.04–1.14) for all-cause mortality. Post hoc, cycle-specific estimates showed no evidence of heterogeneity, and each DII unit was associated with 13% higher serum C-reactive protein. Conclusions: The DII–CVD association was modest, similar across survey periods and recall strategies, and larger after correction for recall error; restriction analyses did not indicate that post-diagnosis dietary change created it, and the CVD mortality estimate was concordant but imprecise. Formal equivalence across periods, a CVD mortality association, and causation were not established.
Keywords:
dietary inflammatory index
; cardiovascular disease
; NHANES
; dietary recall
; measurement error
; regression calibration
; equivalence testing
; reverse causation
; mortality
1. Introduction
Cardiovascular diseases remain the leading global cause of death, and dietary risks, elevated blood pressure, tobacco exposure, and metabolic factors account for a substantial share of their burden [1,2]. Chronic nonresolving inflammation contributes to endothelial dysfunction, atherosclerotic plaque progression, and thrombotic complications [3,4], and the reduction in recurrent cardiovascular events achieved by interleukin-1β inhibition in a randomized trial supports a causal role for inflammation in atherothrombosis [5]. These observations have motivated dietary-pattern measures that summarize the combined inflammatory potential of multiple nutrients and foods rather than evaluating single components in isolation.
The literature-derived Dietary Inflammatory Index (DII) assigns higher scores to more pro-inflammatory dietary patterns [6] and was associated with elevated high-sensitivity C-reactive protein in its construct validation [7]; its developers have since described refinements and common misapplications of the score [8]. Meta-analyses and umbrella reviews generally associate higher DII with cardiovascular events and mortality, although effect sizes and certainty vary by outcome and design [9,10,11,12], and prospective cohorts in Spain and France have reported higher incidence of cardiovascular events or myocardial infarction with more pro-inflammatory diets [13,14,15]. The overall DII–CVD association itself is therefore not a new hypothesis.
This prior literature is densest in NHANES. Wirth and colleagues evaluated self-reported circulatory conditions in NHANES 2005–2010 using a single 24 h recall and the same five-condition composite considered here [16]. Subsequent NHANES studies extended the literature to coronary heart disease, atherosclerotic CVD, CVD in dysglycemia, and stroke, while also reporting sex differences and component heterogeneity [17,18,19,20,21]. Analyses using the NHANES mortality linkage have related DII to all-cause and cardiovascular mortality in the general adult population [22,23,24,25], most recently with a two-recall 27-parameter score that was also associated with prevalent CVD in the same sample [25], and an analysis of NHANES III linked higher DII to CVD mortality among adults with prediabetes [26]. More broadly, a systematic review of NHANES-derived single-factor association studies documented a rapid increase in formulaic analyses, selective use of limited date ranges or cohort subsets without clear justification, and inattention to false discoveries [27]. Re-estimating the pooled association over additional cycles without a distinct validation question would therefore add limited scientific value.
Three methodological questions are more informative. First, it is unclear whether estimates from early NHANES cycles remain similar in later, nonoverlapping cycles under a harmonized analytic specification. The macronutrient composition and quality of the US diet changed between 1999 and 2016 [28], and dietary data collection in NHANES has been refined across cycles [29]; moreover, a nonsignificant interaction test does not show that two estimates are the same [30,31]. Second, DII estimates derived from one or two 24 h recalls may differ because short-term recalls contain substantial within-person variation and imperfectly represent usual diet [32,33,34]. Such error attenuates diet–disease associations and reduces statistical power [35]. The choice of recall days also determines the eligible sample and the appropriate NHANES dietary weight, so similar regression estimates could coexist with unstable individual exposure classification. Third, prevalent self-reported CVD cannot distinguish a diet that preceded disease from dietary change after diagnosis, so a cross-sectional association may partly reflect reverse causation.
The study was therefore framed as a temporal-consistency and dietary-measurement analysis with a prospective extension. The primary objectives were to (1) estimate the association between a uniform 27-parameter, two-day DII and prevalent CVD; (2) assess whether estimates were similar in 2005–2010 and 2011–2018, including a formal equivalence test; (3) compare one-day and two-day dietary strategies using per-unit and standardized effect estimates, true day-to-day repeatability, reclassification after incorporating a second recall, and regression calibration for within-person variation; and (4) evaluate reverse causation through restriction analyses and through mortality follow-up of adults free of CVD at baseline. Secondary analyses examined prevalence ratios and marginal prevalence differences, dose-response shape, clinical-covariate extension, literature-defined targets for sex and CVD components, sensitivity to socioeconomic and physical-activity adjustment, selection into the two-day sample, and overlap between DII components and model covariates.
2. Materials and Methods
2.1. Study Design, Data Source, and Ethics
NHANES is a continuous, nationally representative survey of the noninstitutionalized U.S. population that uses a stratified, multistage probability design [36]. Seven complete prepandemic 2-year cycles from 2005–2006 through 2017–2018 were combined. NHANES protocols were approved by the National Center for Health Statistics (NCHS) Research Ethics Review Board (Protocol #2005-06 for 2005–2010, Protocol #2011-17 for 2011–2016 and until 26 October 2017, and Protocol #2018-01 thereafter), and all participants provided documented informed consent [37]. This secondary analysis used publicly available, deidentified data and follows the Strengthening the Reporting of Observational Studies in Epidemiology (STROBE) guidance [38]. The equivalence margins, measurement-error model, restriction analyses, and mortality models were fixed in a written analysis plan, available from the corresponding author, before any of these analyses were run, although the period-specific estimates and the interaction test were already available. Deviations from that plan and analyses added after it are identified as such in Section 2.5 and Section 2.7.2, Section 2.7.3, Section 2.7.4, Section 2.7.5, Section 2.7.6 and Section 2.7.7.
2.2. Study Population
The source files contained 70,190 participants. Adults aged 20 years or older (n = 39,749) with valid yes or no responses for all five CVD-history items (n = 39,354) were retained. For the primary two-day analysis, participants additionally required a calculable 27-parameter DII on both recall days, a positive two-day dietary weight, and complete core covariates. The resulting primary sample comprised 30,579 adults, including 3,291 with prevalent CVD; 50 otherwise eligible adults lacked a core covariate and are described in Table A1. The clinical extension included the 30,258 adults with a measured body mass index (BMI); diabetes and hypertension were classified for all participants from the criteria available to each (Section 2.6). A separate day-one analysis included 34,910 adults. The mortality cohort comprised the 27,239 adults in the primary sample who were eligible for mortality linkage and free of self-reported CVD (Figure 1).
2.3. Dietary Inflammatory Index
Dietary intake was assessed by interviewer-administered 24 h recalls using the Automated Multiple-Pass Method; the first recall was collected in person at the mobile examination center and the second 3 to 10 days later by telephone [29,39]. Only recalls meeting the NHANES minimum criteria for completeness and reliability were used. For each recall day, DII was computed using the published literature-derived algorithm [6] and cross-checked against the dietaryindex implementation [40]. For each dietary parameter, intake was standardized to the published global reference mean and standard deviation, converted to a centered percentile score (2Φ(z) − 1), multiplied by its inflammatory-effect score, and summed. Higher values represent greater inflammatory potential. The score was not the energy-adjusted DII (E-DII); total energy intake was included as a model covariate [41].
The primary score used the 27 parameters available consistently in all seven cycles, namely alcohol, vitamins B12 and B6, beta-carotene, caffeine, carbohydrate, cholesterol, energy, total fat, fiber, folic acid, iron, magnesium, monounsaturated fat, niacin, omega-3 fatty acids, omega-6 fatty acids, protein, polyunsaturated fat, riboflavin, saturated fat, selenium, thiamin, vitamins A, C, and E, and zinc. Omega-3 fatty acids were the sum of octadecatrienoic, octadecatetraenoic, eicosapentaenoic, docosapentaenoic, and docosahexaenoic acids, omega-6 fatty acids the sum of octadecadienoic and eicosatetraenoic acids, and caffeine was converted from milligrams to grams to match the global reference scale. Vitamin D was excluded from every cycle because it was unavailable in 2005–2006. All 27 parameters were required on each included recall day. The two day-specific scores were averaged for the primary exposure. Sensitivity analyses used a cycle-specific 27- or 28-parameter score that included vitamin D when available and recomputed DII after excluding its energy component, alcohol component, or both components.
2.4. Cardiovascular Disease
Prevalent CVD was defined from the Medical Conditions Questionnaire. Participants were classified as having CVD if they reported that a doctor or other health professional had ever told them they had congestive heart failure, coronary heart disease, angina or angina pectoris, heart attack (myocardial infarction), or stroke. Valid responses to all five items were required. Each condition was also analyzed separately as a replication target. For the restriction analyses, the age at which each reported condition was first diagnosed was taken from the same questionnaire, and years since first diagnosis were computed as age at interview minus the earliest reported age at diagnosis.
2.5. Mortality Follow-Up
Vital status was obtained from the NCHS 2019 public-use Linked Mortality Files [42], which link NHANES participants to the National Death Index through 31 December 2019 [43]. CVD death was defined as an underlying cause of death in the national leading-cause categories for diseases of the heart or cerebrovascular diseases, with deaths from other causes censored. The 51 participants (0.17%) of the primary sample who were ineligible for linkage were excluded without reweighting; NCHS notes that ignoring linkage ineligibility may bias mortality estimates depending on the number of ineligible participants [43], which was small here. Follow-up time was counted in months from the mobile examination center visit, at which the first dietary recall was collected, to death or 31 December 2019. In the public-use files, synthetic values replace follow-up time or underlying cause of death for selected records to limit disclosure risk, whereas vital status is not perturbed [43]. For the 2015–2016 and 2017–2018 cycles the public-use files distinguish only heart disease and cancer among causes of death [43], so cerebrovascular deaths in these two cycles could not be identified. This coding limitation was recognized after the primary mortality estimates had been obtained; the pre-specified definition was retained, and two analyses with uniform coding were added (Section 2.7.5).
2.6. Covariates
The core model included age modeled with a four-degree-of-freedom natural spline; sex; race and ethnicity; educational attainment (less than high school, high school or equivalent, or more than high school); marital or partnership status; smoking status (never, former, or current); alcohol detected on either included recall day; total energy intake; and survey cycle. These variables were selected to address demographic, socioeconomic, behavioral, secular, and dietary confounding without automatically conditioning on plausible cardiometabolic intermediates. Because alcohol and energy also contribute to the 27-parameter DII, component-exclusion sensitivity analyses assessed this partial overlap. A separate model replaced recall-day alcohol with questionnaire-reported habitual alcohol frequency, harmonized across questionnaire versions as drinking days in the past year (none, fewer than one per week, one to fewer than three per week, or three or more per week). The clinical extension additionally included BMI, diabetes, and hypertension, which incorporated self-report, medication information, examination measures, and laboratory criteria as available. Diabetes was defined by a self-reported diagnosis, use of insulin or oral glucose-lowering medication, glycated hemoglobin of 6.5% or higher, or fasting plasma glucose of 126 mg/dL or higher, with fasting glucose measured only in the morning fasting subsample; hypertension was defined by a self-reported diagnosis, current antihypertensive medication, or a mean measured systolic pressure of 140 mmHg or higher or diastolic pressure of 90 mmHg or higher. Poverty-income ratio (PIR) and physical activity were added in separate complete-case sensitivity models; physical activity was expressed as metabolic equivalent minutes per week from the Global Physical Activity Questionnaire (inactive, fewer than 600, or 600 or more) and was available from 2007–2008 onward.
2.7. Statistical Analysis
2.7.1. Primary Cross-Sectional Models
All analyses incorporated NHANES strata, primary sampling units, and dietary weights. The primary two-day analysis used WTDR2D divided by seven; the day-one analysis used WTDRD1 divided by seven. NCHS constructs the two-day weight from the day-one weight with additional adjustment for nonresponse to the second recall and for the distribution of weekday and weekend recall days [44], so selection into the two-day sample on the characteristics used in that adjustment is accounted for by design. Period-specific analyses divided the corresponding weight by three for 2005–2010 and by four for 2011–2018. Survey domains were used for subgroup estimation, and Taylor linearization estimated variances, consistent with NCHS guidance [39,45,46,47,48].
Survey-weighted logistic regression estimated odds ratios (ORs) and 95% confidence intervals (CIs). DII was analyzed continuously and in weighted quartiles (cut points for the two-day DII −0.300, 0.962, and 2.077; quartiles and SDs for other exposures were computed within their own analytic design); trend tests assigned the weighted within-quartile median. For comparisons across recall strategies, continuous ORs were also expressed per survey-weighted standard deviation (SD) and per survey-weighted interquartile range (IQR) calculated within each analytic design. To improve interpretation for a prevalent outcome, a survey-weighted Poisson model with robust variance estimated prevalence ratios [49]. Model standardization estimated the average marginal prevalence difference for a 1-unit higher DII by averaging model-predicted probabilities over the survey-weighted primary analytic population; the standard error used the full coefficient covariance matrix and the delta method with survey design degrees of freedom. A natural spline with knots at the weighted 5th, 35th, 65th, and 95th percentiles tested departure from linearity.
2.7.2. Temporal Consistency and Equivalence
Temporal consistency was evaluated by estimating the same core model separately in 2005–2010 and 2011–2018 and testing a DII-by-period interaction; failure to reject the interaction was interpreted as no detected heterogeneity, not proof of equivalence. To test consistency formally, the interaction was re-expressed per pooled weighted SD of DII, giving the logarithm of the ratio of ORs between periods, and evaluated with two one-sided tests [31]. The pre-specified equivalence margin was a ratio of ORs between 0.91 and 1.10 (that is, within a factor of 1.10 in either direction); a stricter margin of 1.05 was secondary. Equivalence was declared when the 90% CI, based on survey design degrees of freedom, lay entirely within the margin. The smallest symmetric margin compatible with equivalence, obtained by back-transforming the larger absolute value of the two 90% confidence limits on the log scale, is also reported so that readers can apply their own margin. The same procedure was applied to day-one DII with the day-one weight. Because this interaction model constrains covariate effects, including that of total energy, which is correlated with DII, to be common to both periods, a fully interacted model in which all covariate effects could differ by period was fitted post hoc; it is equivalent to contrasting the separately estimated period-specific models.
2.7.3. Dietary-Recall Strategy, Repeatability, and Measurement-Error Correction
Dietary-measurement sensitivity was assessed using (1) day-one DII in the full day-one sample with WTDRD1, (2) the primary two-day mean with WTDR2D, (3) day-one DII within the common two-day sample while holding weights and covariates constant, and (4) the cycle-specific 27- or 28-parameter DII. True day-to-day repeatability compared day-one with day-two DII using the survey-weighted Pearson correlation, exact quartile agreement, and survey-weighted nominal Cohen κ without ordinal weighting. Design-based 95% CIs for all three metrics used Taylor-linearized covariance estimates, the delta method where required, and t quantiles on the survey design degrees of freedom. Reclassification after incorporating a second recall was evaluated separately by comparing day-one quartiles with quartiles of the two-day mean. Potential selection into the two-day analytic sample was assessed by comparing adults eligible for the primary two-day analysis with otherwise eligible adults included only in the day-one analysis, using WTDRD1 and survey-adjusted tests.
Regression calibration was used to estimate associations per unit of usual, that is long-term average, DII [50,51,52]. Under a classical measurement-error model, each recall-day DII equals the participant’s usual DII plus a day-specific mean shift and a random error that is independent across days. Because total energy is a model covariate derived from the same recalls and its day-to-day error is correlated with that of DII, DII and energy were calibrated jointly. The single-recall error covariance matrix of DII and energy was estimated as half the survey-weighted covariance of the day-one minus day-two differences in the primary sample, and the two-day mean was assigned half of this error covariance. This estimator assumes equal error variance on the two recall days for the day-one calibration, whereas the error covariance of the two-day mean depends only on the sum of the two day-specific error variances and is therefore unaffected by unequal variances. Each error-prone variable was regressed on the remaining covariates, and calibrated values were obtained as the fitted value plus Λ multiplied by the residual vector, where Λ equals the residual covariance matrix minus the error covariance, post-multiplied by the inverse of the residual covariance matrix. The outcome model was then refitted with calibrated DII and calibrated energy. The same procedure was applied to day-one DII in the day-one sample, using the error covariance estimated in the two-day sample. The diagonal element of Λ for DII is reported as the attenuation factor, and the SD of usual DII was estimated as the square root of the weighted variance of the two-day mean minus half the single-recall error variance. Confidence intervals were obtained from 500 Rao–Wu rescaling bootstrap replicates of the survey design [53], with all calibration parameters re-estimated in each replicate. The analysis plan had specified a univariate calibration with energy treated as error-free; it was replaced by the joint calibration before calibrated effect estimates were examined, because the correlated recall errors of DII and energy make the univariate model misspecified when recall energy is a covariate. Regression calibration corrects for random within-person variation only and not for person-specific reporting bias [35].
2.7.4. Reverse-Causation Analyses
Two restriction analyses addressed dietary change after diagnosis. First, participants reporting that they were following a special diet, a question asked with the day-one recall, were excluded. Second, cases were restricted by time since first diagnosis (within 2, 5, or 10 years) while all non-cases were retained; cases with an unknown age at diagnosis were excluded from these analyses, and cases diagnosed more than 5 years earlier were analyzed post hoc as a contrast. Both restrictions were also combined (no special diet and diagnosis within 5 years). The interpretation was fixed in advance. If a long-standing diagnosis had led to a healthier diet, restricted estimates would be further from the null than the primary estimate; estimates closer to the null would leave reverse causation in the opposite direction possible.
2.7.5. Mortality Analyses
Among participants free of CVD at baseline, survey-weighted Cox proportional hazards models [48,54] estimated hazard ratios (HRs) for CVD mortality and for all-cause mortality, using the core covariates and the two-day dietary weight. Cause-specific hazards, with deaths from other causes censored, were used because the question was etiologic; subdistribution hazards, which describe absolute risk in the presence of competing deaths, were not estimated [55]. DII was analyzed per unit, per weighted SD, and in weighted quartiles with a trend test. Pre-specified sensitivity analyses excluded deaths in the first 24 months of follow-up, added the clinical covariates, analyzed the whole primary sample with adjustment for baseline CVD, and used the regression-calibrated two-day DII. Because of the cause-of-death coding described in Section 2.5, heart-disease mortality, which is coded uniformly across all cycles, and CVD mortality restricted to 2005–2014 were analyzed as additional sensitivity analyses. Proportional hazards were assessed with Schoenfeld residuals [56] in a weighted model; because the global test indicated departures for covariates, the models were refitted post hoc with the baseline hazard stratified by sex and with attained age as the time scale, the age spline being removed from the covariates in the latter. Mortality analyses were not split by period because the 2017–2018 cycle contributes at most 37 months of follow-up.
2.7.6. Secondary Analyses and Software
Sex interaction and five component outcomes were literature-defined targets based on prior NHANES findings; component P values were adjusted using the Benjamini–Hochberg false discovery rate [57]. Further sensitivity models added PIR, added physical activity, replaced recall-day alcohol with habitual alcohol frequency, and restricted the sample to mean energy intake of 500 to 5000 kcal per day; each was compared with the core model in the identical complete-case sample. The contribution of each DII component was described by its weighted mean score in participants with and without CVD and by leave-one-component-out estimates. Tests were two-sided, except for the two one-sided tests of equivalence. Analyses used R 4.6.1 with survey 4.5, survival 3.8.6, haven 2.5.5, and data.table 1.18.6 [47,58], and figures were drawn with Python 3.14 and matplotlib 3.10.
2.7.7. Post Hoc Additions
After the pre-specified and secondary analyses had been completed, five analyses were added in response to a pre-submission review and are reported as post hoc. First, the core model was estimated separately in each of the seven survey cycles, each with its own two-day dietary weight, and heterogeneity of the DII coefficient across cycles was tested with a design-based Wald test of the DII-by-cycle interaction in the pooled model. Second, day-two DII was analyzed as the exposure in the common two-day sample, holding weights and covariates constant, as the counterpart of the day-one common-sample analysis. Third, the core model was re-estimated after excluding women who were pregnant at examination and, separately, participants reporting a cancer diagnosis. Fourth, as a construct check of the 27-parameter score, the natural logarithm of serum C-reactive protein (CRP) was regressed on two-day DII with the core covariates in the five cycles with CRP measurements; CRP was measured by latex-enhanced nephelometry in 2005–2010 and by high-sensitivity assays in 2015–2018 and was not measured in 2011–2014, so era-specific estimates were also obtained, the two-day weight was divided by the number of cycles analyzed, and values above 10 mg/L were excluded in a sensitivity analysis. Results are expressed as the percentage difference in CRP per DII unit, and the odds of CRP above 3 mg/L were estimated by logistic regression. Fifth, E-values, the minimum strength of association that an unmeasured confounder would need with both DII and the outcome, beyond the measured covariates, to explain away an estimate, were computed for the prevalence ratio and the mortality HRs [59].
3. Results
3.1. Participant Characteristics
The primary sample included 30,579 adults, of whom 3,291 reported at least one CVD condition. The survey-weighted prevalence of CVD was 8.4% (95% CI, 7.9–8.9%). Participants with CVD were older, more often male and non-Hispanic White, and more likely to be former smokers and to have diabetes or hypertension. Mean two-day DII was 1.11 among adults with CVD and 0.80 among those without CVD (Table 1).
3.2. Primary Association
Each 1-unit higher two-day DII was associated with higher odds of prevalent CVD in the core confounder model (OR, 1.09; 95% CI, 1.03–1.15; P = 0.001). The estimate attenuated modestly after adding BMI, diabetes, and hypertension (OR, 1.07; 95% CI, 1.02–1.13; P = 0.013). Compared with the lowest weighted quartile, the OR for the highest quartile was 1.37 (95% CI, 1.10–1.69), with a graded trend (P for trend = 0.003). The core-model prevalence ratio was 1.07 (95% CI, 1.03–1.12), and the average marginal prevalence difference was 0.57 percentage points (95% CI, 0.22–0.92) per 1-unit higher DII (Table 2).
3.3. Temporal Consistency and Equivalence
The two-day association was similar in the early period that overlapped the original NHANES report (2005–2010; OR, 1.09; 95% CI, 1.03–1.16) and in the later, nonoverlapping period (2011–2018; OR, 1.08; 95% CI, 1.00–1.17). There was no evidence that the DII slope differed by period (P for interaction = 0.30), and day-one estimates were also similar across periods (P for interaction = 0.73; Figure 2 and Table 3). In the equivalence test, the ratio of the 2011–2018 to the 2005–2010 OR per pooled SD was 0.94 (90% CI, 0.85–1.04) for the two-day DII. Because the lower limit fell below the margin, equivalence could not be declared at the pre-specified ±10% margin or at the stricter ±5% margin; the smallest symmetric margin compatible with equivalence was ±18.2%. For day-one DII, the corresponding ratio was 1.02 (90% CI, 0.93–1.12), again inconclusive, with a smallest compatible margin of ±12.1%. In the fully interacted model, the ratio was 0.99 (90% CI, 0.87–1.12) for two-day DII and 1.04 (90% CI, 0.94–1.15) for day-one DII; neither met the ±10% margin. The difference between the two parameterizations was accounted for mainly by total energy, whose coefficient differed between periods (log OR per 1000 kcal −0.16 in 2005–2010 and 0.05 in 2011–2018); allowing only the energy effect to differ by period gave ratios of 1.00 (90% CI, 0.88–1.12) for two-day DII and 1.05 (90% CI, 0.95–1.17) for day-one DII. Figure 2A shows the period-specific ORs, and Figure 2B shows the ratios of ORs with their 90% CIs against the shaded ±5% and ±10% equivalence margins. In the post hoc cycle-specific analysis, ORs per unit ranged from 0.98 in 2017–2018 to 1.29 in 2013–2014, with wide CIs in every cycle and no evidence of heterogeneity (P for heterogeneity = 0.18; Table A2).
3.4. Dietary-Recall Sensitivity, Repeatability, and Measurement-Error Correction
The day-one analysis in 34,910 eligible adults produced an OR of 1.07 (95% CI, 1.03–1.10) per DII unit, compared with 1.09 (95% CI, 1.03–1.15) for the two-day mean. Because the recall-specific DII distributions differed, standardized comparisons were more informative. The OR per weighted SD was 1.13 (95% CI, 1.06–1.21) for day one (SD 1.89) and 1.15 (95% CI, 1.06–1.25) for the two-day mean (SD 1.62); the corresponding ORs per weighted IQR (2.84 and 2.38) were 1.20 (95% CI, 1.09–1.33) and 1.22 (95% CI, 1.08–1.38). Within the common two-day sample, day-one DII gave 1.07 (95% CI, 1.03–1.11) per unit, whereas day-two DII, collected by telephone, gave 1.04 (95% CI, 1.00–1.08) per unit and 1.08 (95% CI, 1.00–1.17) per its weighted SD (1.92); the cycle-specific score gave estimates similar to the primary analysis (Table 3).
True day-to-day individual ranking was substantially less consistent (Figure 3A; Table A3 and Table A4). The survey-weighted Pearson correlation between day-one and day-two DII was 0.45 (95% CI, 0.43–0.46); exact quartile agreement was 38.4% (95% CI, 37.4–39.3%), and survey-weighted nominal Cohen κ was 0.18 (95% CI, 0.17–0.19). In the separate reclassification analysis, 58.3% remained in the same quartile when the two-day mean replaced day one. Among day-one Q1 participants, 24.3% moved to Q2 under the two-day mean; among day-one Q4 participants, 22.7% moved to Q3 (Table A5).
Regression calibration estimated attenuation factors of 0.55 for the two-day mean and 0.36 for day one (Table 4). After calibration, the OR per unit of usual DII was 1.17 (95% CI, 1.07–1.27) for the two-day mean and 1.20 (95% CI, 1.10–1.31) for day one, compared with uncorrected estimates of 1.09 (95% CI, 1.04–1.14) and 1.07 (95% CI, 1.03–1.10) in the same bootstrap framework. The ratio of the day-one to the two-day per-unit OR was 0.98 (95% CI, 0.95–1.01) before calibration and 1.03 (95% CI, 0.96–1.10) after calibration. Per SD of usual DII (1.28 units), the calibrated ORs were 1.22 (95% CI, 1.09–1.36) and 1.26 (95% CI, 1.13–1.42). Figure 3A shows the weighted row percentages of day-two quartiles within each day-one quartile, and Figure 3B compares observed and calibrated estimates per 1-unit DII with bootstrap CIs, which differ slightly from the design-based CIs reported elsewhere.
Eligibility for the two-day analysis was selective. Compared with 4,331 adults included only in the day-one analysis, the 30,579 adults eligible for the primary two-day analysis were older (weighted mean, 48.0 vs 42.4 years), less often male (47.2% vs 54.5%), more often educated beyond high school (61.8% vs 52.7%), less often current smokers (19.4% vs 28.7%), and had a slightly higher WTDRD1-weighted prevalence of CVD (8.6% vs 7.2%); all listed comparisons were statistically significant (Table A6). The corresponding primary-sample prevalence was 8.4% when weighted with WTDR2D.
3.5. Reverse-Causation Analyses
Excluding the 4,844 participants who reported following a special diet and 6 with a missing response left 25,729 adults with 2,410 cases, and the association was stronger than in the primary analysis (OR, 1.12; 95% CI, 1.05–1.19). When cases were restricted to those first diagnosed within 5 years before the interview (1,213 cases), the OR was 1.13 (95% CI, 1.02–1.24); restriction to diagnoses within 10 years gave 1.11 (95% CI, 1.04–1.20), and restriction to diagnoses within 2 years, which retained only 676 cases, gave 1.06 (95% CI, 0.96–1.16). Cases diagnosed more than 5 years earlier showed the weakest association (OR, 1.05; 95% CI, 1.00–1.11). Combining both restrictions gave 1.19 (95% CI, 1.06–1.34). Thus, apart from the imprecise within-2-years restriction, excluding special diets or restricting cases to recent diagnoses did not move the estimate toward the null (Figure 4). In Figure 4, squares denote ORs for prevalent CVD, circles denote HRs for mortality, and horizontal lines show 95% CIs.
3.6. Mortality
During 210,319 person-years of follow-up (unweighted median, 7.8 years), 2,139 deaths occurred among the 27,239 adults free of CVD at baseline, including 529 CVD deaths. The HR for CVD mortality per 1-unit higher DII was 1.09 (95% CI, 0.98–1.21; P = 0.13), and the HR comparing the highest with the lowest quartile was 1.48 (95% CI, 0.93–2.36; P for trend = 0.14). For all-cause mortality, the corresponding HRs were 1.09 (95% CI, 1.04–1.14; P < 0.001) and 1.44 (95% CI, 1.15–1.79; P for trend = 0.005) (Table 5). Per weighted SD of DII (1.62 in this cohort), the HRs were 1.14 (95% CI, 0.96–1.36) for CVD mortality and 1.15 (95% CI, 1.06–1.24) for all-cause mortality. CVD mortality estimates were similar after excluding deaths in the first 24 months (HR, 1.07; 95% CI, 0.96–1.20) and after adding clinical covariates (HR, 1.08; 95% CI, 0.96–1.20). Heart-disease mortality, coded uniformly across all cycles, gave 1.08 (95% CI, 0.95–1.22; 430 deaths), and CVD mortality restricted to the 2005–2014 cycles gave 1.12 (95% CI, 1.01–1.24; 503 deaths). In the whole primary sample with adjustment for baseline CVD, the HR for CVD mortality was 1.10 (95% CI, 1.02–1.18). The regression-calibrated HR for CVD mortality was 1.16 (95% CI, 0.95–1.42). The Schoenfeld test did not indicate departure from proportional hazards for DII (P = 0.37), although the global test indicated departures for covariates such as age and sex (global P = 0.005); HRs for CVD mortality were 1.09 (95% CI, 0.98–1.21) with the baseline hazard stratified by sex and 1.09 (95% CI, 0.98–1.22) with attained age as the time scale, and the corresponding HRs for all-cause mortality were 1.09 (95% CI, 1.04–1.14) and 1.09 (95% CI, 1.04–1.15).
3.7. Secondary and Sensitivity Analyses
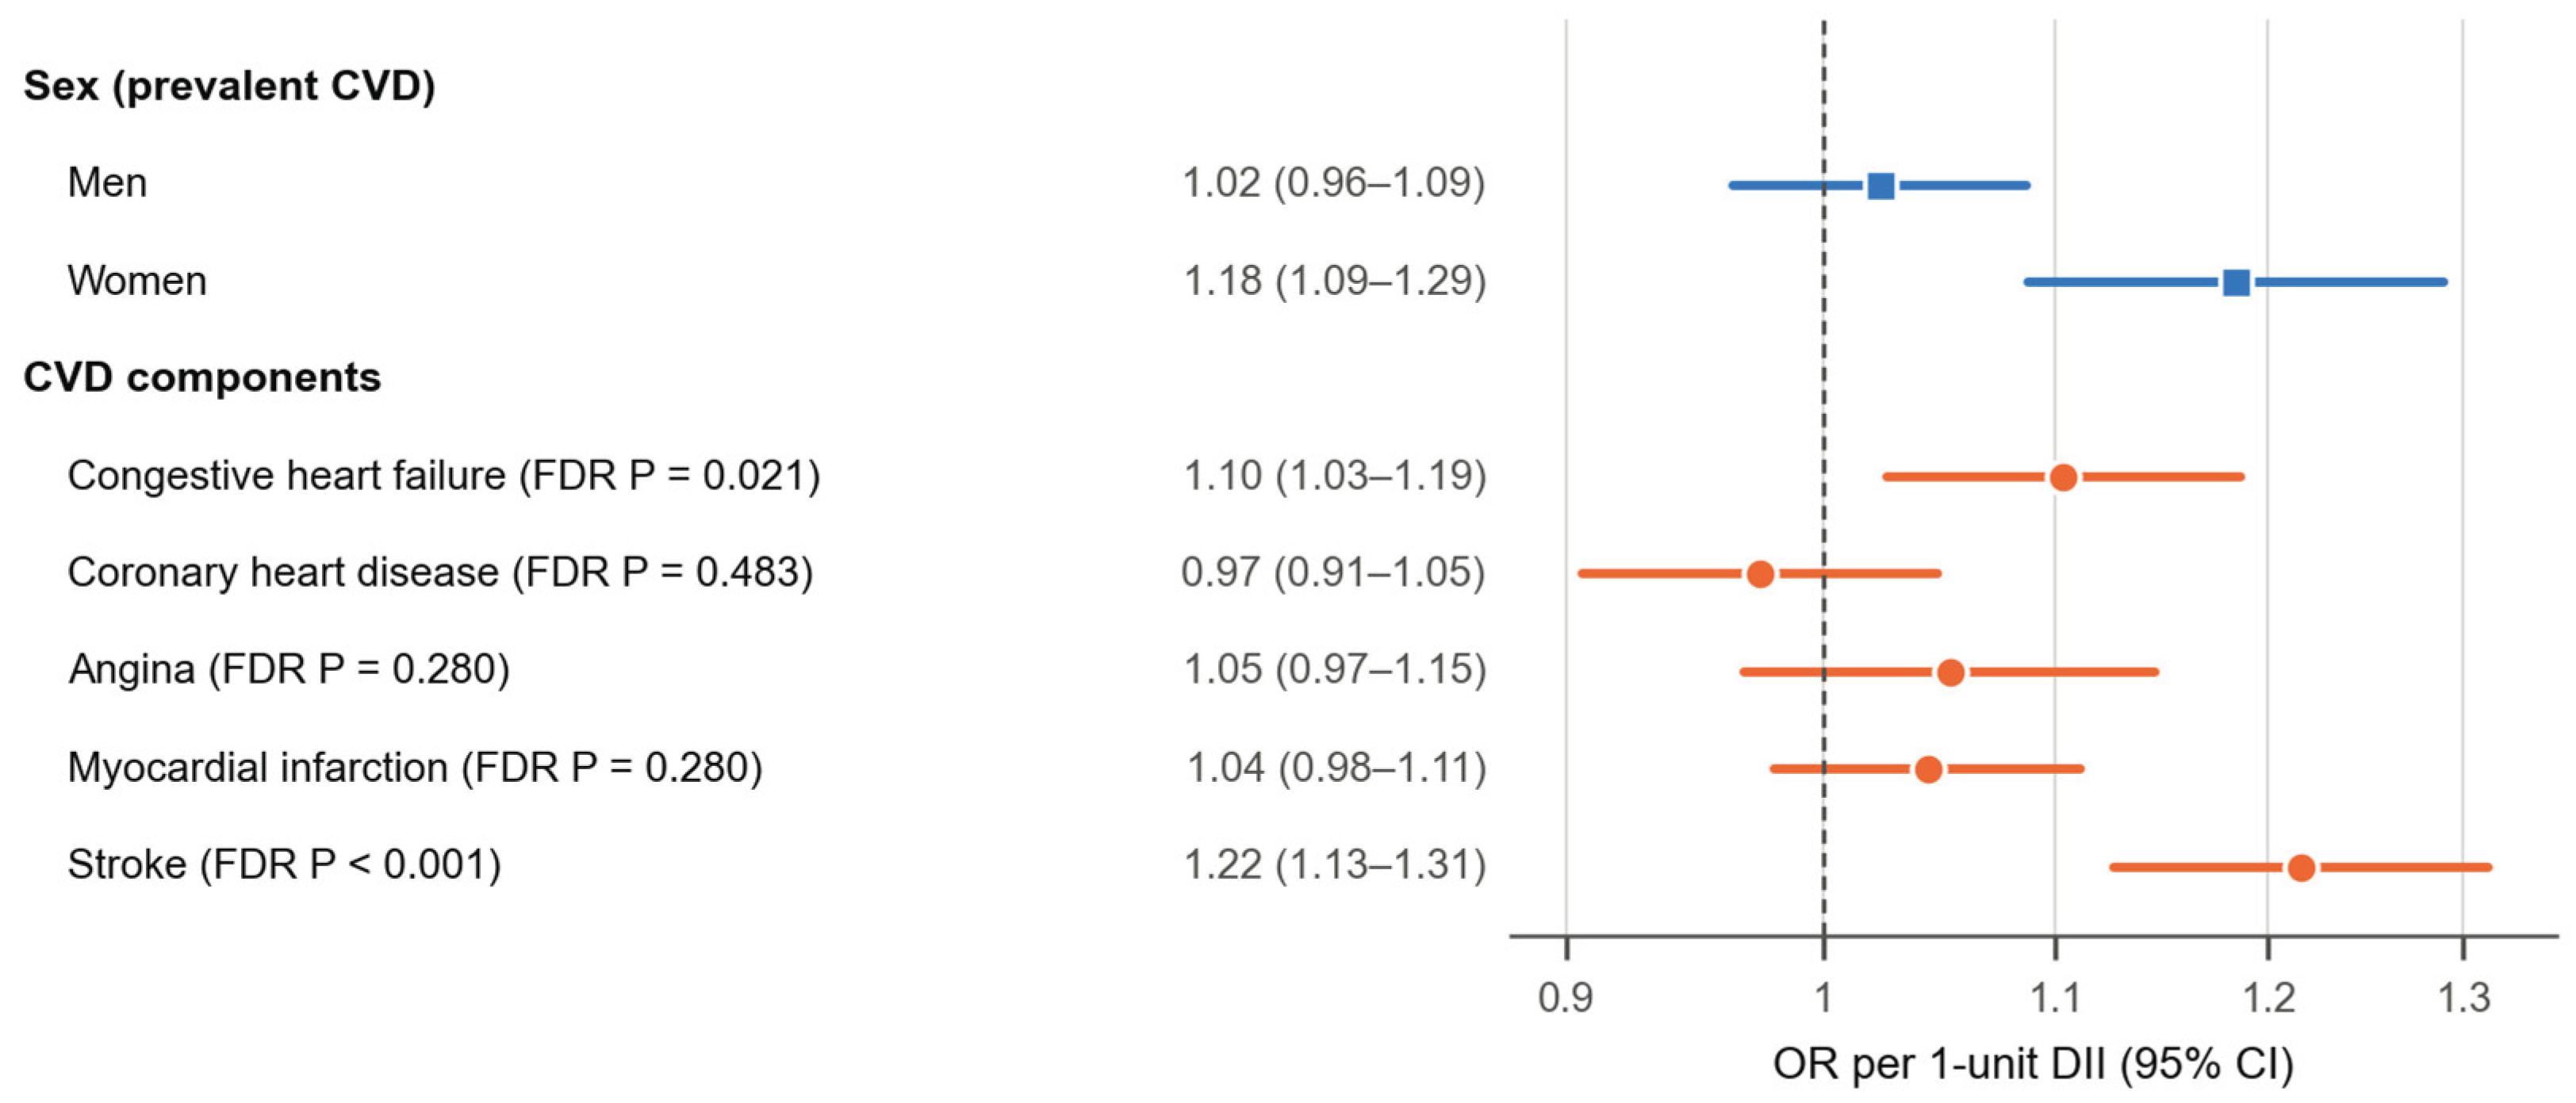
There was no statistical evidence of departure from linearity (P for nonlinearity = 0.23; Figure A1, in which the spline used knots at the weighted 5th, 35th, 65th, and 95th percentiles of −2.055, 0.247, 1.625, and 3.246 with the weighted median as reference). In identical complete-case samples, the core and additionally adjusted ORs were 1.09 versus 1.07 after adding PIR and 1.08 versus 1.06 after adding physical activity. Replacing recall-day alcohol with habitual alcohol frequency yielded an OR of 1.08, compared with 1.09 for the core model in the same 28,973 adults. The estimate was also similar after restriction to mean energy intake of 500 to 5000 kcal per day (OR, 1.09; 95% CI, 1.03–1.14), and excluding the 578 women who were pregnant at examination (OR, 1.09; 95% CI, 1.03–1.15) or the 3,037 participants reporting a cancer diagnosis (OR, 1.08; 95% CI, 1.02–1.15) left it essentially unchanged. Per weighted SD, estimates remained stable when the DII energy component was excluded (OR, 1.16; 95% CI, 1.06–1.26), the alcohol component was excluded (OR, 1.14; 95% CI, 1.05–1.23), or both were excluded (OR, 1.15; 95% CI, 1.06–1.25); all component-exclusion models retained the complete 30,579-person primary sample (Table A7 and Table A8). As a literature-defined target, the association was stronger among women (OR, 1.18; 95% CI, 1.09–1.29) than men (OR, 1.02; 95% CI, 0.96–1.09; P for interaction < 0.001). After false-discovery-rate correction across five components, associations remained for stroke (OR, 1.22; 95% CI, 1.13–1.31; FDR P < 0.001) and congestive heart failure (OR, 1.10; 95% CI, 1.03–1.19; FDR P = 0.021), but not for coronary heart disease, angina, or myocardial infarction (Table A9 and Figure A2). The fiber and magnesium components made the two largest contributions to the higher mean DII among participants with CVD (0.12 of the 0.31-unit difference), reflecting lower intakes of these nutrients, and no single component accounted for the association in leave-one-component-out analyses (Table A10). In the 20,825 participants with a CRP measurement, each unit of two-day DII was associated with 13.1% (95% CI, 10.4–15.9%) higher CRP (11.9% in 2005–2010 and 15.2% in 2015–2018), with an OR of 1.18 (95% CI, 1.14–1.23) for CRP above 3 mg/L; the estimate was 11.2% (95% CI, 8.9–13.6%) after values above 10 mg/L were excluded (Table A11). The E-value for the core prevalence ratio was 1.35 (1.20 for its lower confidence limit), and that for all-cause mortality was 1.40 (1.23); for CVD mortality the point E-value was 1.39, but the lower confidence limit already included the null.
4. Discussion
In this design-consistent analysis of NHANES 2005–2018, a uniform 27-parameter two-day DII was modestly associated with prevalent CVD, and the score was associated with higher serum CRP in the five cycles with biomarker data. The main contribution is not a new claim that dietary inflammatory potential is related to CVD. Rather, estimates were similar in 2005–2010 and 2011–2018 under the same model, weight, and exposure definition, with no evidence of temporal heterogeneity, and standardized estimates were similar when DII was derived from one or two dietary recalls. At the same time, weak day-to-day quartile agreement showed that stable population-level estimates do not imply precise individual dietary classification. The additional analyses qualify these findings. A formal equivalence test could not rule out period differences of practical size; regression calibration indicated that day-to-day recall variation substantially attenuated the observed association; restriction analyses gave little indication that dietary change after diagnosis produced the association; and the prospective estimate for CVD mortality had the same direction and magnitude as the cross-sectional estimate but was imprecise.
The magnitude of the cross-sectional estimate was consistent with the early NHANES study by Wirth et al., which evaluated the same five previously diagnosed circulatory conditions in 2005–2010 using a single recall [16], and with later analyses of coronary disease, atherosclerotic CVD, dysglycemia, and stroke [17,18,19,20,21], including the per-unit OR of 1.06 reported with a two-recall 27-parameter score in NHANES 1999–2018 [25]. It also matched the pooled estimate of about 8% higher risk per one-point increase in DII reported in a meta-analysis that combined cohort and other designs [9]. Because measurement error biases per-unit estimates toward the null, the calibrated estimates (1.17 and 1.20 per unit of usual DII) are the more relevant comparison for cohorts with more extensive dietary assessment; the calibrated OR per SD of usual DII (1.22) was similar in magnitude to the HR of 1.22 per SD reported for incident CVD in PREDIMED [13], although differences in design, population, and dietary instrument preclude a direct comparison.
By separating 2005–2010 from 2011–2018, the present analysis offers an internal temporal-consistency assessment rather than presenting the pooled DII–CVD association as a first report. Similar slopes and nonsignificant interaction tests across both the two-day and day-one strategies reduce concern that the association is confined to the earliest cycles. Cycle-specific estimates, added post hoc, varied between 0.98 and 1.29 without evidence of heterogeneity, but single cycles were too imprecise to establish or refute consistency on their own, which is the reason for pooling cycles into periods. The equivalence test, however, shows how little a nonsignificant interaction establishes [30,31]. With 13,615 and 16,964 adults in the two periods, the data remained compatible with a later-period OR per SD between 0.85 and 1.04 times the earlier one in the pre-specified interaction model, and between 0.87 and 1.12 times when all covariate effects were allowed to differ by period. This matters for the NHANES literature, in which analyses of particular ranges of cycles without stated justification have been documented [27]. An association reproduced in another set of cycles is not thereby shown to be stable, and claims of consistency require either formal equivalence testing with a stated margin or substantially larger samples. Changes in US dietary composition over the same years [28] provide a plausible reason why exposure distributions, and possibly associations, could drift across cycles.
The dietary-measurement findings add a distinct caution. Twenty-four-hour recalls capture short-term intake and are affected by within-person variation, reporting error, day of week, season, and episodic consumption [32,33,34]. Averaging two recalls can reduce some random variation but does not recover an individual’s long-term usual diet. In these data, day-one and day-two quartiles agreed exactly for only 38.4% of participants and nominal κ was 0.18. The separate day-one-to-two-day-mean analysis answered a different question, with 58.3% remaining in the same quartile after the second recall was incorporated; keeping these comparisons separate avoids the mathematical coupling created when day one is compared with an average that contains day one. Regression calibration quantified the consequence for effect estimation. Attenuation factors of 0.55 and 0.36 imply that the observed log ORs captured roughly half of the association with usual DII for the two-day mean and about a third for a single recall. Per-unit estimates from one and two recalls are not directly comparable because the two exposures are attenuated to different degrees; calibration places both on the scale of usual DII, on which they were similar (ratio of ORs, 1.03; 95% CI, 0.96–1.10), although no equivalence margin was specified for this comparison. Because uncorrected tests remain approximately valid under nondifferential error [35], the attenuation affects the size of the association more than its detection. Pooling per-unit DII estimates from single-recall NHANES analyses with estimates from studies using other instruments may therefore understate effects and inflate apparent heterogeneity. These corrections rest on classical error assumptions, treat the two recalls as exchangeable apart from a mean shift although the second is collected by telephone, and do not address person-specific reporting bias, which recovery-biomarker studies have shown to be substantial for 24 h recalls [60,61], or errors in the recall-day alcohol indicator [35,52]. The post hoc day-two analysis gave a weaker observed association than day one in the same sample, which is compatible with larger or differently structured error in the telephone recall and cautions against treating the two days as fully exchangeable. If the telephone recall is noisier, the equal-variance assumption understates the day-one attenuation factor, so the calibrated day-one estimate (1.20 per unit) may be over-corrected; the calibration of the two-day mean is unaffected because it depends only on the sum of the two day-specific error variances.
Reverse causation is a central concern for cross-sectional analyses of prevalent CVD because a diagnosis can prompt dietary change. If people with long-standing disease had adopted less inflammatory diets, the association should be weaker among them and stronger among recent cases and among people not following a special diet. This pattern was largely, but not uniformly, observed. The association was stronger among participants not following a special diet and among cases diagnosed within 5 or 10 years, strongest when both restrictions were combined, and weakest among cases diagnosed more than 5 years earlier. The estimate for cases diagnosed within 2 years, however, was closer to the null and imprecise because few such cases were available, so the ordering by time since diagnosis was not monotonic. These results are compatible with post-diagnosis dietary change biasing the cross-sectional estimate toward the null rather than creating it, but differences in case mix by time since diagnosis offer an alternative explanation, and reverse causation in the opposite direction cannot be excluded for the most recent diagnoses. The prospective analysis addressed temporality directly. Among adults free of CVD, the HR per unit of DII for CVD mortality was nearly identical to the cross-sectional OR, but with 529 deaths its confidence interval included the null; the association with all-cause mortality was clearer. Because the public-use files do not identify cerebrovascular deaths in 2015–2018, the CVD mortality outcome was incompletely captured in those cycles, and the estimate restricted to 2005–2014, where coding was complete, was somewhat larger. Per-unit HRs for CVD mortality of 1.12 with a two-recall 27-parameter score in NHANES 1999–2018 [25] and 1.17 over 5 years of follow-up in NHANES 2007–2014 [22] have been reported in samples that retained adults with prevalent CVD, and category contrasts in other continuous NHANES cohorts pointed in the same direction [23,24]; the present estimates among adults free of CVD at baseline, and the whole-sample estimate adjusted for baseline CVD, are compatible with these values while separating prevalent from incident disease. Excluding participants with a cancer diagnosis, whose diets may change for reasons unrelated to CVD, left the cross-sectional estimate unchanged. These sensitivity results support the direction of the primary estimate but do not establish a causal effect, and an earlier NHANES III analysis that reported higher CVD mortality with higher DII among adults with prediabetes used a different population and exposure categorization [26].
The sex and component findings should be interpreted as replication targets, not newly discovered subgroups. The stronger estimate among women agrees with prior NHANES reports [16,17,18], while the stroke association is consistent with recent stroke-focused analyses [20,21]. Congestive heart failure also survived multiplicity correction, whereas three other cardiac components did not. The null estimate for coronary heart disease differs from the positive association reported in NHANES 1999–2018 [17]; that analysis used a single recall and adjusted for BMI, diabetes, and hypertension, which the core model here deliberately omits, so the two estimates are not directly comparable. These differences argue against treating a broad self-reported CVD composite as biologically homogeneous and support outcome-specific prospective work. They do not justify diagnosis-specific causal claims from the present data. The component analysis showed that the fiber and magnesium components, reflecting lower intakes of these nutrients, made the two largest contributions to the difference in mean DII between participants with and without CVD, but no single component explained the association.
The core model deliberately excluded BMI, diabetes, and hypertension because they may partly lie downstream of long-term diet; adding them in a clinical extension modestly attenuated the estimate. Age was modeled flexibly, survey cycle and total energy were included, and odds ratios were supplemented with prevalence ratios and marginal prevalence differences. Because energy and alcohol are both DII components and model covariates, DII was recomputed without either component and recall-day alcohol was replaced with habitual alcohol frequency; standardized estimates changed little. These checks lessen concern about mechanical overlap but do not convert the non-energy-adjusted DII into E-DII or fully measure long-term alcohol use. The resulting absolute association was small, approximately 0.57 percentage points higher adjusted prevalence per DII unit, so statistical significance should not be confused with large clinical impact. An unmeasured confounder would need associations of at least 1.35 with both DII and prevalent CVD, beyond the measured covariates, to explain away the prevalence ratio, and of at least 1.40 to explain away the all-cause mortality association [59]; confounding of this size by overall diet quality, medication use, or lipid levels cannot be excluded.
The one-day and two-day analytic samples were not exchangeable. Adults eligible for the primary two-day analysis were older, less often male or current smokers, more often educated beyond high school, and had a modestly higher day-one-weighted CVD prevalence than adults included only in the day-one analysis. Because the two-day weight incorporates the NCHS adjustment for second-recall nonresponse, differences on the characteristics used in that adjustment are accounted for by design, and the full day-one analysis partially evaluates sensitivity to residual selection; neither can remove selection bias from unmeasured differences. Accordingly, similarity between the one-day and two-day estimates should be interpreted as an empirical sensitivity result rather than evidence that eligibility for the two-day analysis was ignorable.
4.1. Strengths and Limitations
Strengths include a large nationally representative sample; a harmonized 27-parameter score; use of the dietary weight corresponding to each recall strategy; flexible age and survey-cycle adjustment; assessment of temporal consistency in nonoverlapping periods with a pre-specified equivalence margin; per-unit, per-SD, and per-IQR estimates; explicit separation of day-to-day repeatability from reclassification after adding a second recall; measurement-error correction that accounted for the correlated errors of DII and energy and propagated calibration uncertainty through the survey design; restriction analyses and mortality follow-up addressing reverse causation; a construct check of the score against serum CRP; alternate outcome scales; and false-discovery-rate control for component outcomes.
Several limitations remain. First, the primary design is cross-sectional, and although the restriction and mortality analyses address reverse causation, they cannot exclude it completely. Second, CVD was based on self-reported lifetime clinician diagnosis, did not capture event timing or disease severity, and ages at diagnosis were recalled. Third, two recalls remain imperfect measures of usual diet; regression calibration relies on classical, nondifferential error, assumes equal error variance across the two recall days for the day-one estimate, and does not correct systematic reporting bias. Eligibility for the two-day analysis was associated with demographic, behavioral, and CVD differences; the full day-one analysis addressed sample sensitivity but not unmeasured selection. Fourth, the 27-parameter DII omits parameters not measured consistently in NHANES and was not E-DII; although it was associated with serum CRP, that check was cross-sectional and confined to the five cycles with measurements. Although total energy and recall-day alcohol were included as covariates and component-exclusion and habitual-alcohol analyses were similar, residual overlap and imperfect measurement remain possible. Fifth, temporal consistency within NHANES is an internal cross-period comparison, not validation in an independent cohort, and the equivalence margins, although fixed in advance, involve judgment. Sixth, CVD mortality analyses were limited by the number of deaths, by perturbation of follow-up time and cause of death for some records in the public-use files, and by the absence of cerebrovascular cause coding in 2015–2018. Seventh, PIR and physical activity were incomplete, medication and lipid information were not fully modeled, and residual confounding remains possible. Finally, interaction and component estimates require independent prospective confirmation despite multiplicity adjustment.
5. Conclusions
The association between a more pro-inflammatory diet and prevalent CVD was modest, similar across early and later NHANES periods and across one-day and two-day dietary strategies on standardized scales, and larger per unit of usual DII after correction for day-to-day recall variation; restriction analyses did not indicate that post-diagnosis dietary change created it, the score was associated with higher serum CRP, and mortality follow-up gave estimates in the same direction that were imprecise for CVD death. Formal equivalence across periods could not be established, so temporal stability was not demonstrated, and weak day-to-day quartile agreement and selective eligibility for the two-day analysis show meaningful measurement and selection uncertainty. The results do not establish causation or clinical predictive value and support prospective studies with repeated dietary assessment, validated incident cardiovascular outcomes, and pre-specified tests of consistency.
Funding
This research received no external funding.
Institutional Review Board Statement
The study was conducted in accordance with the Declaration of Helsinki. NHANES protocols were approved by the NCHS Research Ethics Review Board (Protocols #2005-06, #2011-17, and #2018-01). This secondary analysis used only publicly available, deidentified data.
Informed Consent Statement
Informed consent was obtained from all NHANES participants by NCHS.
Data Availability Statement
The data analyzed in this study are publicly available. NHANES data are available from the National Center for Health Statistics [36], and the public-use Linked Mortality Files from the same agency [42]. The pre-specified analysis plan and the analysis code are available from the corresponding author on reasonable request. The analyses, interpretations, and conclusions are those of the author and not of NCHS, which is responsible only for the initial data.
Conflicts of Interest
The author declares no conflicts of interest.
Appendix A

Table A1.
Unweighted comparison of included adults with adults excluded for a missing core covariate.
Table A1.
Unweighted comparison of included adults with adults excluded for a missing core covariate.
| Group | n | Mean age, years | Female, % | CVD, % |
|---|---|---|---|---|
| Included | 30,579 | 49.8 | 52.5 | 10.8 |
| Excluded after exposure and outcome eligibility | 50 | 54.7 | 48.0 | 12.0 |
This table is unweighted because only a small number of otherwise eligible records lacked a core covariate; it documents complete-case attrition rather than population characteristics.
Table A2.
Cycle-specific associations between the two-day DII and prevalent CVD.
| Cycle | n | Cases | OR per unit (95% CI) | P |
|---|---|---|---|---|
| 2005–2006 | 4,021 | 416 | 1.17 (1.05–1.31) | 0.006 |
| 2007–2008 | 4,618 | 543 | 1.03 (0.96–1.11) | 0.37 |
| 2009–2010 | 4,976 | 516 | 1.08 (0.95–1.23) | 0.20 |
| 2011–2012 | 4,269 | 423 | 1.05 (0.91–1.20) | 0.50 |
| 2013–2014 | 4,452 | 453 | 1.29 (1.05–1.57) | 0.018 |
| 2015–2016 | 4,155 | 458 | 1.06 (0.91–1.23) | 0.46 |
| 2017–2018 | 4,088 | 482 | 0.98 (0.83–1.15) | 0.76 |
Post hoc analysis. Each cycle was analyzed with its own two-day dietary weight and the core covariates without the cycle term. The design-based Wald test of the DII-by-cycle interaction in the pooled model gave P for heterogeneity = 0.18 (F = 1.52 on 6 and 80 degrees of freedom).
Table A3.
Day-to-day repeatability of DII classification in the primary two-day sample.
| Metric | Estimate (95% CI) |
|---|---|
| Pearson correlation, day one vs day two | 0.45 (0.43–0.46) |
| Exact quartile agreement, day one vs day two | 38.4% (37.4–39.3%) |
| Nominal Cohen κ, day one vs day two | 0.18 (0.17–0.19) |
| Same quartile, day one vs two-day mean | 58.3% |
All metrics are survey-weighted; κ is nominal without ordinal distance weights. Confidence intervals use Taylor-linearized covariance estimates and the delta method. The last row compares day one with a mean that contains day one and is not a reliability statistic.
Table A4.
Weighted day-one versus day-two DII quartile distribution (row percentages).
| Day-one quartile | Day-two Q1 | Day-two Q2 | Day-two Q3 | Day-two Q4 |
|---|---|---|---|---|
| Q1 | 47.4% | 27.3% | 15.7% | 9.6% |
| Q2 | 27.0% | 30.4% | 25.6% | 17.0% |
| Q3 | 16.8% | 24.6% | 30.5% | 28.1% |
| Q4 | 8.9% | 17.6% | 28.3% | 45.1% |
Table A5.
Weighted reclassification from day-one to two-day-mean DII quartiles (row percentages).
| Day-one quartile | Two-day-mean Q1 | Two-day-mean Q2 | Two-day-mean Q3 | Two-day-mean Q4 |
|---|---|---|---|---|
| Q1 | 72.5% | 24.3% | 3.2% | 0.0% |
| Q2 | 23.3% | 44.9% | 29.4% | 2.4% |
| Q3 | 4.1% | 24.6% | 44.7% | 26.7% |
| Q4 | 0.3% | 6.1% | 22.7% | 71.0% |
Table A6.
Survey-weighted comparison of adults eligible for the two-day analysis with adults in the day-one analysis only.
Table A6.
Survey-weighted comparison of adults eligible for the two-day analysis with adults in the day-one analysis only.
| Characteristic | Two-day analysis | Day-one analysis only | P |
|---|---|---|---|
| Unweighted sample, n | 30,579 | 4,331 | |
| Age, years | 48.0 (16.9) | 42.4 (16.8) | <0.001 |
| Sex | <0.001 | ||
| Male | 14,513 (47.2%) | 2,400 (54.5%) | |
| Female | 16,066 (52.8%) | 1,931 (45.5%) | |
| Race and ethnicity | <0.001 | ||
| Non-Hispanic White | 13,441 (68.3%) | 1,482 (57.2%) | |
| Mexican American | 4,602 (8.0%) | 848 (12.4%) | |
| Non-Hispanic Black | 6,659 (11.3%) | 919 (12.2%) | |
| Other Hispanic | 2,831 (5.2%) | 477 (7.3%) | |
| Other race | 3,046 (7.2%) | 605 (10.9%) | |
| Education | <0.001 | ||
| More than high school | 16,478 (61.8%) | 1,820 (52.7%) | |
| Less than high school | 7,070 (14.8%) | 1,484 (22.5%) | |
| High school or equivalent | 7,031 (23.4%) | 1,027 (24.8%) | |
| Smoking | <0.001 | ||
| Never | 16,991 (55.4%) | 2,343 (52.4%) | |
| Current | 6,006 (19.4%) | 1,140 (28.7%) | |
| Former | 7,582 (25.2%) | 848 (18.9%) | |
| Prevalent CVD | 3,291 (8.6%) | 407 (7.2%) | 0.021 |
Values are unweighted n (survey-weighted %) or survey-weighted mean (SD). Comparisons used WTDRD1 and retained the NHANES strata and primary sampling units, so CVD prevalence among adults eligible for the two-day analysis is 8.6% here, compared with 8.4% in the primary analysis weighted with WTDR2D.
Table A7.
Alternative effect scales and sensitivity analyses for the two-day DII.
| Analysis | Estimate (95% CI) | P | n |
|---|---|---|---|
| Primary core model | 1.09 (1.03–1.15) | 0.001 | 30,579 |
| Clinical extension | 1.07 (1.02–1.13) | 0.013 | 30,258 |
| PIR subset, core model | 1.09 (1.03–1.15) | 0.001 | 28,143 |
| PIR subset, PIR added | 1.07 (1.01–1.12) | 0.014 | 28,143 |
| Physical-activity subset, core model | 1.08 (1.02–1.14) | 0.010 | 26,457 |
| Physical-activity subset, physical activity added | 1.06 (1.00–1.13) | 0.041 | 26,457 |
| Habitual-alcohol subset, core model | 1.09 (1.03–1.14) | 0.002 | 28,973 |
| Habitual-alcohol subset, frequency covariate | 1.08 (1.02–1.13) | 0.005 | 28,973 |
| Energy intake 500 to 5000 kcal per day | 1.09 (1.03–1.14) | 0.002 | 30,297 |
| Pregnant women excluded (post hoc) | 1.09 (1.03–1.15) | 0.001 | 30,001 |
| Cancer history excluded (post hoc) | 1.08 (1.02–1.15) | 0.006 | 27,542 |
| Core-model prevalence ratio | 1.07 (1.03–1.12) | 0.001 | 30,579 |
| Average marginal prevalence difference per unit, percentage points | 0.57 (0.22–0.92) | 0.002 | 30,579 |
| Spline test for departure from linearity | 0.23 | 30,579 |
Estimates are odds ratios per 1-unit DII unless stated otherwise. Each PIR, physical-activity, and habitual-alcohol model is paired with the core model estimated in exactly the same complete-case sample; physical activity was available from 2007–2008 onward. The post hoc exclusions removed 578 women pregnant at examination and 3,037 participants reporting a cancer diagnosis. PIR, poverty-income ratio.
Table A8.
Sensitivity to overlap between DII components and model covariates.
| DII specification | Weighted SD | OR per SD (95% CI) | P |
|---|---|---|---|
| Primary 27-parameter DII | 1.62 | 1.15 (1.06–1.25) | 0.001 |
| Excluding energy | 1.69 | 1.16 (1.06–1.26) | 0.001 |
| Excluding alcohol | 1.60 | 1.14 (1.05–1.23) | 0.002 |
| Excluding energy and alcohol | 1.66 | 1.15 (1.06–1.25) | 0.001 |
Rows other than the first recompute DII without the stated component or components. All models used the core covariate specification, including total energy and recall-day alcohol, in all 30,579 participants.
Table A9.
Literature-defined replication targets by sex and individual CVD component.
| Group or outcome | OR per unit (95% CI) | Raw P | FDR P | n | Cases |
|---|---|---|---|---|---|
| Sex | |||||
| Men | 1.02 (0.96–1.09) | 0.45 | 14,513 | 1,863 | |
| Women | 1.18 (1.09–1.29) | <0.001 | 16,066 | 1,428 | |
| CVD component | |||||
| Congestive heart failure | 1.10 (1.03–1.19) | 0.008 | 0.021 | 30,579 | 982 |
| Coronary heart disease | 0.97 (0.91–1.05) | 0.48 | 0.48 | 30,579 | 1,257 |
| Angina | 1.05 (0.97–1.15) | 0.22 | 0.28 | 30,579 | 772 |
| Myocardial infarction | 1.04 (0.98–1.11) | 0.18 | 0.28 | 30,579 | 1,277 |
| Stroke | 1.22 (1.13–1.31) | <0.001 | <0.001 | 30,579 | 1,172 |
Sex interaction P < 0.001. Component P values were adjusted across five outcomes with the Benjamini–Hochberg procedure. FDR, false discovery rate.
Table A10.
Contribution of individual DII components to the DII difference and the association with prevalent CVD.
Table A10.
Contribution of individual DII components to the DII difference and the association with prevalent CVD.
| Component | Difference | P | Leave-one-out OR per SD (95% CI) |
|---|---|---|---|
| Fiber | +0.063 | <0.001 | 1.13 (1.04–1.23) |
| Magnesium | +0.058 | <0.001 | 1.13 (1.04–1.23) |
| Saturated fat | −0.043 | <0.001 | 1.18 (1.07–1.29) |
| Vitamin E | +0.042 | <0.001 | 1.15 (1.05–1.25) |
| Polyunsaturated fat | +0.039 | <0.001 | 1.14 (1.05–1.23) |
| Vitamin B6 | +0.037 | <0.001 | 1.14 (1.05–1.24) |
| Total fat | −0.037 | <0.001 | 1.16 (1.06–1.27) |
| Energy | −0.033 | <0.001 | 1.16 (1.06–1.26) |
| Zinc | +0.032 | <0.001 | 1.15 (1.06–1.25) |
| Niacin | +0.031 | <0.001 | 1.15 (1.06–1.24) |
| Alcohol | +0.031 | <0.001 | 1.14 (1.05–1.23) |
| Omega-3 fatty acids | +0.024 | <0.001 | 1.14 (1.05–1.24) |
| Selenium | +0.021 | <0.001 | 1.14 (1.05–1.24) |
| Carbohydrate | −0.015 | <0.001 | 1.15 (1.06–1.25) |
| Vitamin A | +0.013 | 0.005 | 1.14 (1.05–1.23) |
| Omega-6 fatty acids | +0.013 | <0.001 | 1.15 (1.06–1.24) |
| Beta-carotene | +0.013 | 0.15 | 1.15 (1.05–1.25) |
| Vitamin C | +0.012 | 0.048 | 1.16 (1.06–1.26) |
| Folic acid | +0.010 | <0.001 | 1.15 (1.06–1.25) |
| Thiamin | +0.007 | <0.001 | 1.15 (1.06–1.25) |
| Cholesterol | −0.006 | 0.004 | 1.15 (1.06–1.25) |
| Vitamin B12 | −0.005 | <0.001 | 1.15 (1.06–1.25) |
| Riboflavin | +0.004 | <0.001 | 1.15 (1.05–1.24) |
| Protein | −0.004 | <0.001 | 1.15 (1.06–1.25) |
| Iron | −0.002 | <0.001 | 1.15 (1.06–1.25) |
| Monounsaturated fat | +0.001 | <0.001 | 1.15 (1.06–1.25) |
| Caffeine | 0.000 | 0.013 | 1.15 (1.06–1.25) |
Difference is the survey-weighted mean component score among participants with CVD minus that among participants without CVD (two-day means of each parameter’s contribution to the DII); positive values indicate a more pro-inflammatory contribution among participants with CVD. The differences sum to 0.31. Leave-one-out models recompute DII without the component, scale it by its own weighted SD, and use the core covariates. Components are ordered by the absolute difference.
Table A11.
Association of the two-day DII with serum C-reactive protein in cycles with measurements.
Table A11.
Association of the two-day DII with serum C-reactive protein in cycles with measurements.
| Analysis | n | Difference in CRP per DII unit, % (95% CI) | P |
|---|---|---|---|
| All five cycles with CRP | |||
| Per unit | 20,825 | 13.1 (10.4–15.9) | <0.001 |
| Per SD (1.62) | 20,825 | 22.0 (17.3–26.9) | <0.001 |
| Per unit, CRP ≤ 10 mg/L | 18,690 | 11.2 (8.9–13.6) | <0.001 |
| OR for CRP > 3 mg/L per unit | 20,825 | 1.18 (1.14–1.23) | <0.001 |
| 2005–2010 (CRP, nephelometry) | |||
| Per unit | 13,015 | 11.9 (8.8–15.2) | <0.001 |
| Per unit, CRP ≤ 10 mg/L | 11,607 | 11.2 (8.5–14.0) | <0.001 |
| 2015–2018 (hs-CRP) | |||
| Per unit | 7,810 | 15.2 (10.4–20.2) | <0.001 |
| Per unit, CRP ≤ 10 mg/L | 7,083 | 11.5 (7.4–15.7) | <0.001 |
Post hoc construct check. Survey-weighted linear regression of the natural logarithm of CRP on two-day DII with the core covariates; estimates are back-transformed to percentage differences. CRP was measured in 2005–2010 (latex-enhanced nephelometry, mg/dL converted to mg/L) and 2015–2018 (high-sensitivity assays) and not in 2011–2014; the two-day weight was divided by 5, 3, or 2 according to the cycles analyzed. The OR row is from survey-weighted logistic regression. The weighted median CRP was 1.80 mg/L. CRP, C-reactive protein; hs-CRP, high-sensitivity CRP.
Figure A1.
Survey-weighted dose-response association between two-day DII and prevalent CVD.
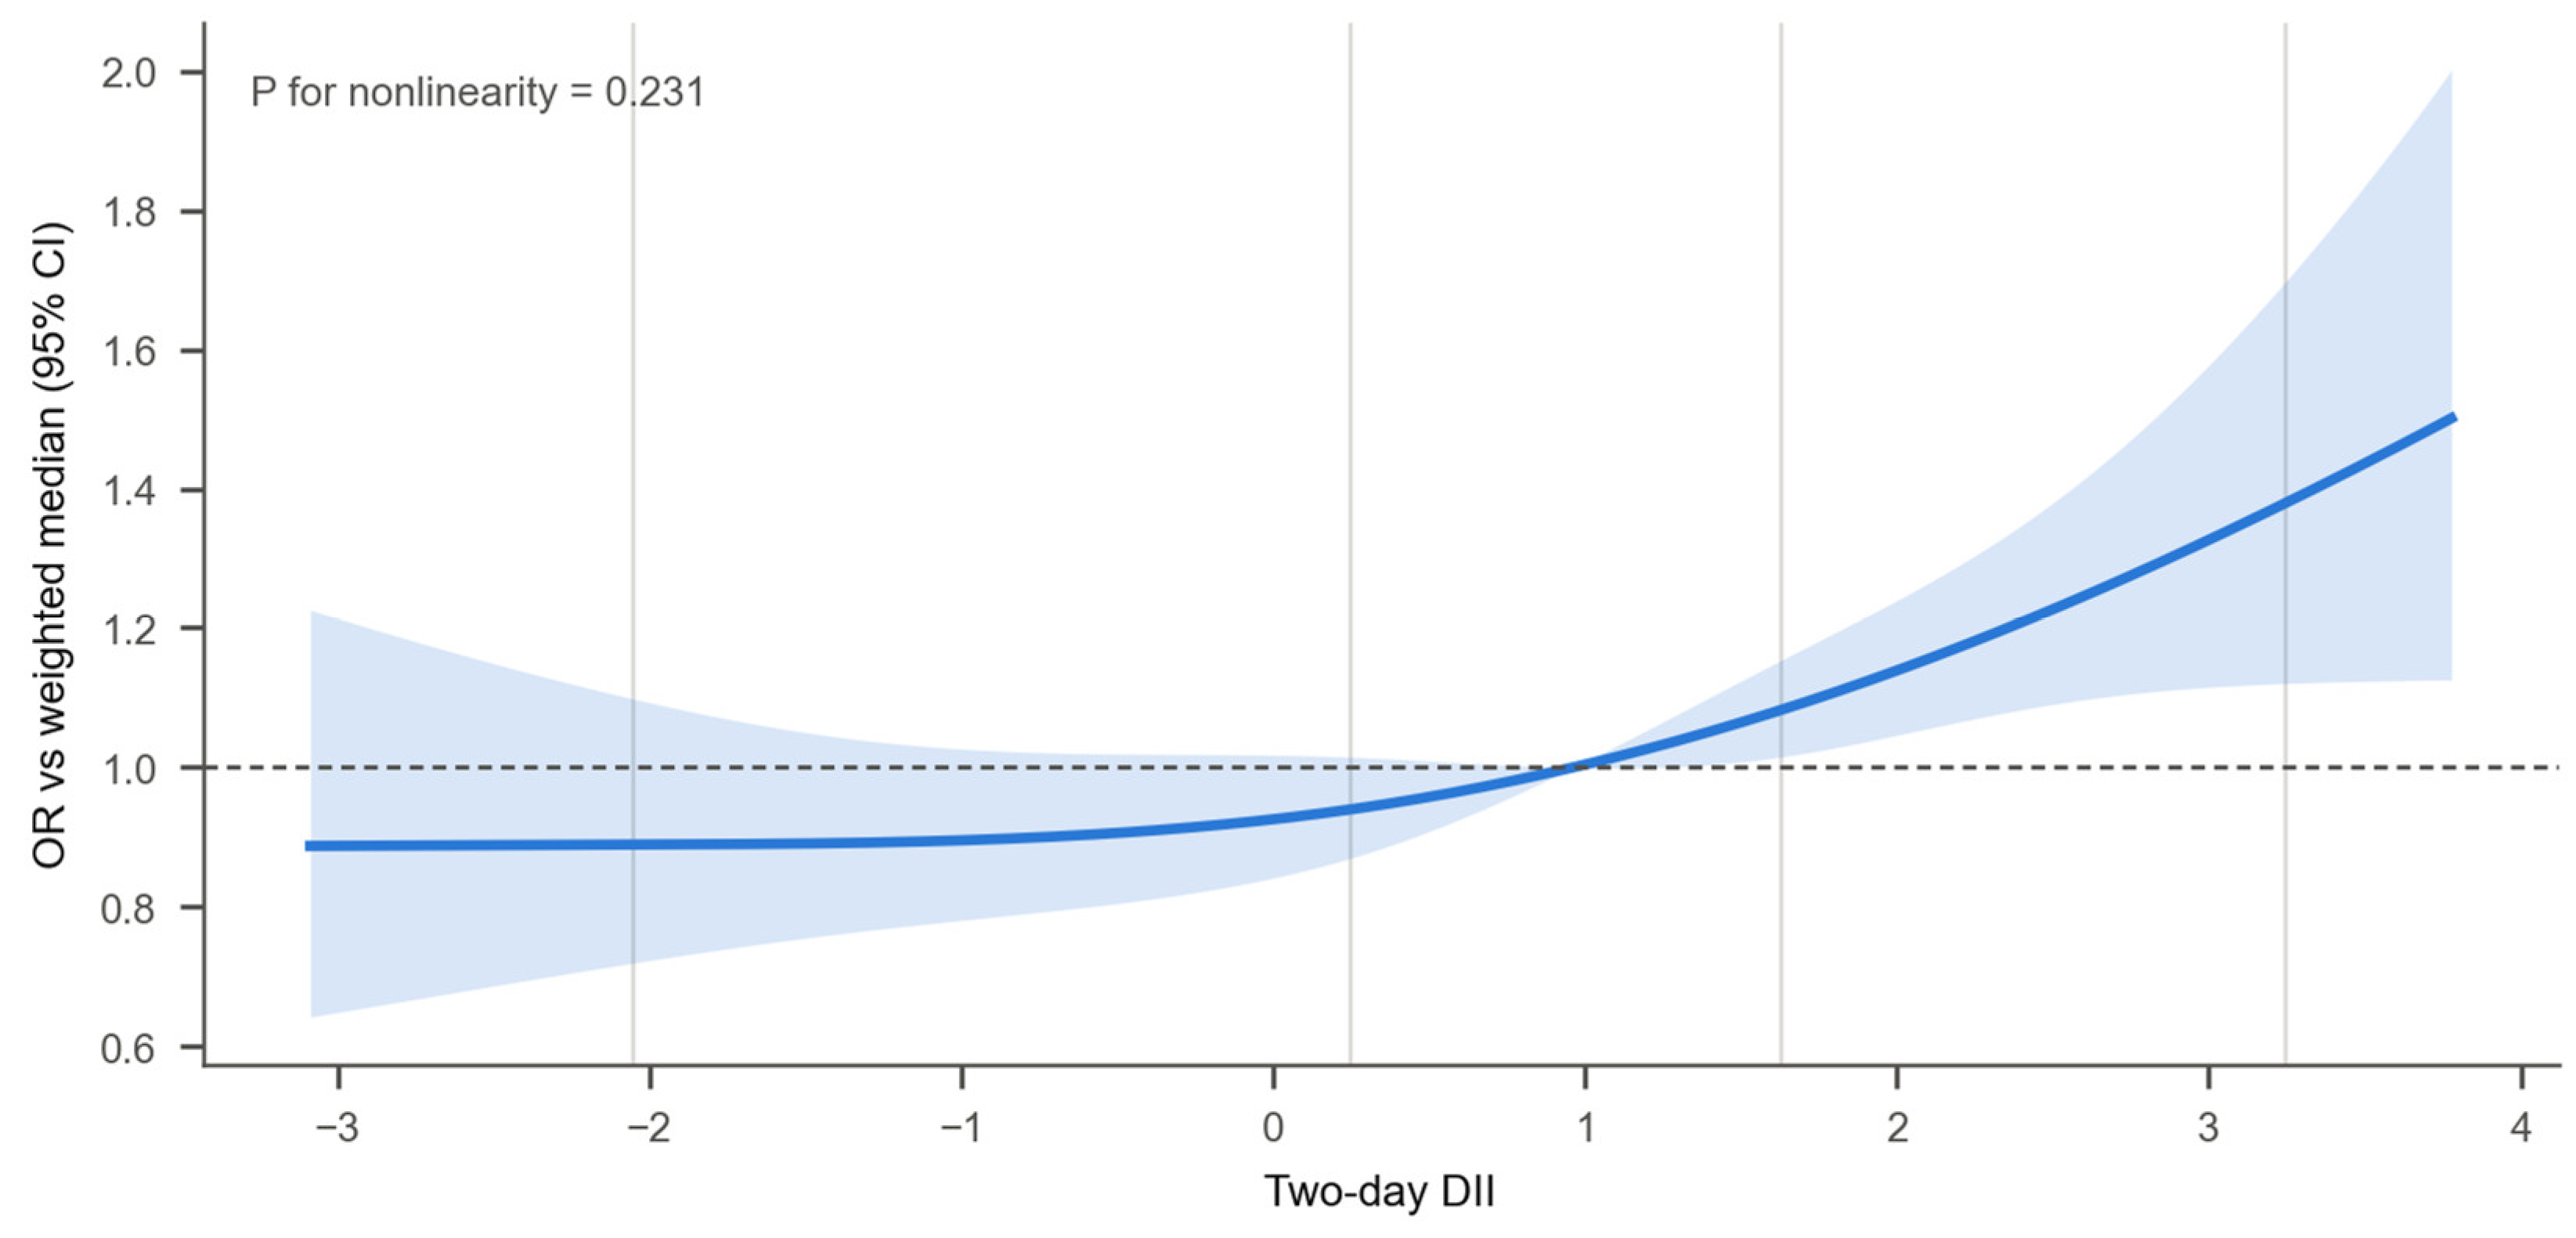
Figure A2.
Associations of two-day DII with prevalent CVD by sex and with individual CVD components.
Figure A2.
Associations of two-day DII with prevalent CVD by sex and with individual CVD components.
References
- World Health Organization. Cardiovascular Diseases (CVDs). Fact Sheet, updated 31 July 2025. Available online: https://www.who.int/news-room/fact-sheets/detail/cardiovascular-diseases-(cvds) (accessed on 10 October 2026).
- Mensah, G.A.; Fuster, V.; Murray, C.J.L.; Roth, G.A. Global Burden of Cardiovascular Diseases and Risks Collaborators. Global Burden of Cardiovascular Diseases and Risks, 1990–2022. J. Am. Coll. Cardiol. 2023, 82, 2350–2473. [Google Scholar] [CrossRef] [PubMed]
- Libby, P. The changing landscape of atherosclerosis. Nature 2021, 592, 524–533. [Google Scholar] [CrossRef] [PubMed]
- Soehnlein, O.; Libby, P. Targeting inflammation in atherosclerosis — from experimental insights to the clinic. Nat. Rev. Drug Discov. 2021, 20, 589–610. [Google Scholar] [CrossRef] [PubMed]
- Ridker, P.M.; Everett, B.M.; Thuren, T.; MacFadyen, J.G.; Chang, W.H.; Ballantyne, C.; Fonseca, F.; Nicolau, J.; Koenig, W.; Anker, S.D.; et al. Antiinflammatory Therapy with Canakinumab for Atherosclerotic Disease. N. Engl. J. Med. 2017, 377, 1119–1131. [Google Scholar] [CrossRef] [PubMed]
- Shivappa, N.; Steck, S.E.; Hurley, T.G.; Hussey, J.R.; Hébert, J.R. Designing and developing a literature-derived, population-based dietary inflammatory index. Public Health Nutr. 2014, 17, 1689–1696. [Google Scholar] [CrossRef] [PubMed]
- Shivappa, N.; Steck, S.E.; Hurley, T.G.; Hussey, J.R.; Ma, Y.; Ockene, I.S.; Tabung, F.; Hébert, J.R. A population-based dietary inflammatory index predicts levels of C-reactive protein in the Seasonal Variation of Blood Cholesterol Study (SEASONS). Public Health Nutr. 2014, 17, 1825–1833. [Google Scholar] [CrossRef] [PubMed]
- Hébert, J.R.; Shivappa, N.; Wirth, M.D.; Hussey, J.R.; Hurley, T.G. Perspective: The Dietary Inflammatory Index (DII)—Lessons Learned, Improvements Made, and Future Directions. Adv. Nutr. 2019, 10, 185–195. [Google Scholar] [CrossRef] [PubMed]
- Shivappa, N.; Godos, J.; Hébert, J.R.; Wirth, M.D.; Piuri, G.; Speciani, A.F.; Grosso, G. Dietary Inflammatory Index and Cardiovascular Risk and Mortality—A Meta-Analysis. Nutrients 2018, 10, 200. [Google Scholar] [CrossRef] [PubMed]
- Namazi, N.; Larijani, B.; Azadbakht, L. Dietary Inflammatory Index and its Association with the Risk of Cardiovascular Diseases, Metabolic Syndrome, and Mortality: A Systematic Review and Meta-Analysis. Horm. Metab. Res. 2018, 50, 345–358. [Google Scholar] [CrossRef] [PubMed]
- Marx, W.; Veronese, N.; Kelly, J.T.; Smith, L.; Hockey, M.; Collins, S.; Trakman, G.L.; Hoare, E.; Teasdale, S.B.; Wade, A.; et al. The Dietary Inflammatory Index and Human Health: An Umbrella Review of Meta-Analyses of Observational Studies. Adv. Nutr. 2021, 12, 1681–1690. [Google Scholar] [CrossRef] [PubMed]
- Ni, Y.; Yao, Q.; Xu, T.; Li, X. Dietary inflammatory index and cardiovascular risk and mortality: an updated systematic review and meta-analysis. Front. Cardiovasc. Med. 2025, 12, 1626523. [Google Scholar] [CrossRef] [PubMed]
- Garcia-Arellano, A.; Ramallal, R.; Ruiz-Canela, M.; Salas-Salvadó, J.; Corella, D.; Shivappa, N.; Schröder, H.; Hébert, J.R.; Ros, E.; Gómez-Garcia, E.; et al. Dietary Inflammatory Index and Incidence of Cardiovascular Disease in the PREDIMED Study. Nutrients 2015, 7, 4124–4138. [Google Scholar] [CrossRef] [PubMed]
- Ramallal, R.; Toledo, E.; Martínez-González, M.A.; Hernández-Hernández, A.; García-Arellano, A.; Shivappa, N.; Hébert, J.R.; Ruiz-Canela, M. Dietary Inflammatory Index and Incidence of Cardiovascular Disease in the SUN Cohort. PLoS ONE 2015, 10, e0135221. [Google Scholar] [CrossRef] [PubMed]
- Neufcourt, L.; Assmann, K.E.; Fezeu, L.K.; Touvier, M.; Graffouillère, L.; Shivappa, N.; Hébert, J.R.; Wirth, M.D.; Hercberg, S.; Galan, P.; et al. Prospective Association Between the Dietary Inflammatory Index and Cardiovascular Diseases in the SUpplémentation en VItamines et Minéraux AntioXydants (SU.VI.MAX) Cohort. J. Am. Heart Assoc. 2016, 5, e002735. [Google Scholar] [CrossRef] [PubMed]
- Wirth, M.D.; Shivappa, N.; Hurley, T.G.; Hébert, J.R. Association between previously diagnosed circulatory conditions and a dietary inflammatory index. Nutr. Res. 2016, 36, 227–233. [Google Scholar] [CrossRef] [PubMed]
- Wu, L.; Shi, Y.; Kong, C.; Zhang, J.; Chen, S. Dietary Inflammatory Index and Its Association with the Prevalence of Coronary Heart Disease among 45,306 US Adults. Nutrients 2022, 14, 4553. [Google Scholar] [CrossRef] [PubMed]
- Zhang, J.; Jia, J.; Lai, R.; Wang, X.; Chen, X.; Tian, W.; Liu, Q.; Li, J.; Ju, J.; Xu, H. Association between dietary inflammatory index and atherosclerosis cardiovascular disease in U.S. adults. Front. Nutr. 2023, 9, 1044329. [Google Scholar] [CrossRef] [PubMed]
- Liu, Z.; Wang, X.; Liu, H.; Zhang, Z.; Poh, W.C.; Luo, F.; Sun, C.; Tang, R.; Xie, Q.; Zheng, W. Dietary inflammation influences the prevalence of cardiovascular diseases in prediabetes and diabetes patients: findings from the National Health and Nutrition Examination Survey (NHANES 2001–2018). J. Health Popul. Nutr. 2024, 43, 114. [Google Scholar] [CrossRef] [PubMed]
- Shi, Y.; Zhou, W. Interactive Effects of Dietary Inflammatory Index with BMI for the Risk of Stroke among Adults in the United States: Insight from NHANES 2011–2018. J. Nutr. Health Aging 2023, 27, 277–284. [Google Scholar] [CrossRef] [PubMed]
- Huang, R.; Lai, F.; Zhao, L.; Zhang, J.; Chen, H.; Wang, S.; Chen, C.; Wang, W.; Mai, Z.; Ding, Y.; et al. Associations between dietary inflammatory index and stroke risk: based on NHANES 2005–2018. Sci. Rep. 2024, 14, 6704. [Google Scholar] [CrossRef] [PubMed]
- Yuan, S.; Song, C.; Zhang, R.; He, J.; Dou, K. Dietary Inflammation Index and Its Association with Long-Term All-Cause and Cardiovascular Mortality in the General US Population by Baseline Glycemic Status. Nutrients 2022, 14, 2556. [Google Scholar] [CrossRef] [PubMed]
- Gao, Y.; Wang, Y.; Zhang, D.; Wu, T.; Li, Q. The Relationship Between Dietary Inflammatory Index and All-Cause, Cardiovascular Disease-Related, and Cancer-Related Mortality. J. Multidiscip. Healthc. 2023, 16, 2543–2556. [Google Scholar] [CrossRef] [PubMed]
- Sun, S.N.; Ni, S.H.; Li, Y.; Liu, X.; Deng, J.P.; Ouyang, X.L.; Li, J.; Wang, L.J.; Xian, S.X.; Lu, L.; et al. Association between dietary inflammatory index with all-cause and cardiovascular disease mortality among older US adults: A longitudinal cohort study among a nationally representative sample. Arch. Gerontol. Geriatr. 2024, 118, 105279. [Google Scholar] [CrossRef] [PubMed]
- Lin, S.; Pan, J.; Zhu, X.; Lan, R.; Sun, X.; Shen, R.; Wu, C. Associations of metabolic indicators and inflammation-related indices with adverse cardiovascular events in US adults: NHANES 1999–2018. Lipids Health Dis. 2026, 25, 57. [Google Scholar] [CrossRef] [PubMed]
- Deng, F.E.; Shivappa, N.; Tang, Y.; Mann, J.R.; Hebert, J.R. Association between diet-related inflammation, all-cause, all-cancer, and cardiovascular disease mortality, with special focus on prediabetics: findings from NHANES III. Eur. J. Nutr. 2017, 56, 1085–1093. [Google Scholar] [CrossRef] [PubMed]
- Suchak, T.; Aliu, A.E.; Harrison, C.; Zwiggelaar, R.; Geifman, N.; Spick, M. Explosion of formulaic research articles, including inappropriate study designs and false discoveries, based on the NHANES US national health database. PLoS Biol. 2025, 23, e3003152. [Google Scholar] [CrossRef] [PubMed]
- Shan, Z.; Rehm, C.D.; Rogers, G.; Ruan, M.; Wang, D.D.; Hu, F.B.; Mozaffarian, D.; Zhang, F.F.; Bhupathiraju, S.N. Trends in Dietary Carbohydrate, Protein, and Fat Intake and Diet Quality Among US Adults, 1999–2016. JAMA 2019, 322, 1178–1187. [Google Scholar] [CrossRef] [PubMed]
- Ahluwalia, N.; Dwyer, J.; Terry, A.; Moshfegh, A.; Johnson, C. Update on NHANES Dietary Data: Focus on Collection, Release, Analytical Considerations, and Uses to Inform Public Policy. Adv. Nutr. 2016, 7, 121–134. [Google Scholar] [CrossRef] [PubMed]
- Altman, D.G.; Bland, J.M. Statistics notes: Absence of evidence is not evidence of absence. BMJ 1995, 311, 485. [Google Scholar] [CrossRef] [PubMed]
- Lakens, D. Equivalence Tests: A Practical Primer for t Tests, Correlations, and Meta-Analyses. Soc. Psychol. Personal. Sci. 2017, 8, 355–362. [Google Scholar] [CrossRef] [PubMed]
- Dodd, K.W.; Guenther, P.M.; Freedman, L.S.; Subar, A.F.; Kipnis, V.; Midthune, D.; Tooze, J.A.; Krebs-Smith, S.M. Statistical Methods for Estimating Usual Intake of Nutrients and Foods: A Review of the Theory. J. Am. Diet. Assoc. 2006, 106, 1640–1650. [Google Scholar] [CrossRef] [PubMed]
- Kirkpatrick, S.I.; Guenther, P.M.; Subar, A.F.; Krebs-Smith, S.M.; Herrick, K.A.; Freedman, L.S.; Dodd, K.W. Using Short-Term Dietary Intake Data to Address Research Questions Related to Usual Dietary Intake among Populations and Subpopulations: Assumptions, Statistical Techniques, and Considerations. J. Acad. Nutr. Diet. 2022, 122, 1246–1262. [Google Scholar] [CrossRef] [PubMed]
- Gibson, R.S.; Charrondiere, U.R.; Bell, W. Measurement Errors in Dietary Assessment Using Self-Reported 24-Hour Recalls in Low-Income Countries and Strategies for Their Prevention. Adv. Nutr. 2017, 8, 980–991. [Google Scholar] [CrossRef] [PubMed]
- Freedman, L.S.; Schatzkin, A.; Midthune, D.; Kipnis, V. Dealing With Dietary Measurement Error in Nutritional Cohort Studies. J. Natl. Cancer Inst. 2011, 103, 1086–1092. [Google Scholar] [CrossRef] [PubMed]
- National Center for Health Statistics. About the National Health and Nutrition Examination Survey. Available online: https://www.cdc.gov/nchs/nhanes/about/ (accessed on 10 October 2026).
- National Center for Health Statistics. NHANES Research Ethics Review Board Approval. Available online: https://www.cdc.gov/nchs/nhanes/about/erb.html (accessed on 10 October 2026).
- von Elm, E.; Altman, D.G.; Egger, M.; Pocock, S.J.; Gøtzsche, P.C.; Vandenbroucke, J.P.; STROBE Initiative. The Strengthening the Reporting of Observational Studies in Epidemiology (STROBE) statement: guidelines for reporting observational studies. J. Clin. Epidemiol. 2008, 61, 344–349. [Google Scholar] [CrossRef] [PubMed]
- National Center for Health Statistics. NHANES Tutorials: Dietary Analyses Module. Available online: https://wwwn.cdc.gov/nchs/nhanes/tutorials/dietaryanalyses.aspx (accessed on 10 October 2026).
- Zhan, J.J.; Hodge, R.A.; Dunlop, A.L.; Lee, M.M.; Bui, L.; Liang, D.; Ferranti, E.P. Dietaryindex: a user-friendly and versatile R package for standardizing dietary pattern analysis in epidemiological and clinical studies. Am. J. Clin. Nutr. 2024, 120, 1165–1174. [Google Scholar] [CrossRef] [PubMed]
- Willett, W.C.; Howe, G.R.; Kushi, L.H. Adjustment for total energy intake in epidemiologic studies. Am. J. Clin. Nutr. 1997, 65, 1220S–1228S. [Google Scholar] [CrossRef] [PubMed]
- National Center for Health Statistics Division of Analysis and Epidemiology. Continuous NHANES Public-Use Linked Mortality Files, 2019; Hyattsville, MD, USA. Available online: https://www.cdc.gov/nchs/data-linkage/mortality-public.htm (accessed on 10 October 2026).
- National Center for Health Statistics. Public-Use Linked Mortality Files. Updated May 2022. Available online: https://www.cdc.gov/nchs/data/datalinkage/public-use-linked-mortality-file-description.pdf (accessed on 10 October 2026).
- National Center for Health Statistics. NHANES 2017–2018 Dietary Interview—Total Nutrient Intakes, First Day (DR1TOT_J): Data Documentation, Codebook, and Frequencies. Available online: https://wwwn.cdc.gov/Nchs/Data/Nhanes/Public/2017/DataFiles/DR1TOT_J.htm (accessed on 10 October 2026).
- National Center for Health Statistics. NHANES Tutorials: Weighting Module. Available online: https://wwwn.cdc.gov/nchs/nhanes/tutorials/weighting.aspx (accessed on 10 October 2026).
- National Center for Health Statistics. Guidelines for Ensuring the Quality of Analyses of Public-Use NHANES Data. Available online: https://wwwn.cdc.gov/Nchs/Nhanes/QualityAnalysesGuidelines.aspx (accessed on 10 October 2026).
- Lumley, T. Analysis of Complex Survey Samples. J. Stat. Softw. 2004, 9, 1–19. [Google Scholar] [CrossRef]
- Lumley, T. Complex Surveys: A Guide to Analysis Using R; Wiley: Hoboken, NJ, USA, 2010. [Google Scholar] [CrossRef]
- Zou, G. A Modified Poisson Regression Approach to Prospective Studies with Binary Data. Am. J. Epidemiol. 2004, 159, 702–706. [Google Scholar] [CrossRef] [PubMed]
- Rosner, B.; Spiegelman, D.; Willett, W.C. Correction of logistic regression relative risk estimates and confidence intervals for measurement error: the case of multiple covariates measured with error. Am. J. Epidemiol. 1990, 132, 734–745. [Google Scholar] [CrossRef] [PubMed]
- Carroll, R.J.; Ruppert, D.; Stefanski, L.A.; Crainiceanu, C.M. Measurement Error in Nonlinear Models: A Modern Perspective, 2nd ed.; Chapman & Hall/CRC: Boca Raton, FL, USA, 2006. [Google Scholar] [CrossRef]
- Keogh, R.H.; Shaw, P.A.; Gustafson, P.; Carroll, R.J.; Deffner, V.; Dodd, K.W.; Küchenhoff, H.; Tooze, J.A.; Wallace, M.P.; Kipnis, V.; et al. STRATOS guidance document on measurement error and misclassification of variables in observational epidemiology: Part 1—Basic theory and simple methods of adjustment. Stat. Med. 2020, 39, 2197–2231. [Google Scholar] [CrossRef] [PubMed]
- Rao, J.N.K.; Wu, C.F.J. Resampling Inference with Complex Survey Data. J. Am. Stat. Assoc. 1988, 83, 231–241. [Google Scholar] [CrossRef]
- Binder, D.A. Fitting Cox’s proportional hazards models from survey data. Biometrika 1992, 79, 139–147. [Google Scholar] [CrossRef]
- Lau, B.; Cole, S.R.; Gange, S.J. Competing Risk Regression Models for Epidemiologic Data. Am. J. Epidemiol. 2009, 170, 244–256. [Google Scholar] [CrossRef] [PubMed]
- Schoenfeld, D. Partial residuals for the proportional hazards regression model. Biometrika 1982, 69, 239–241. [Google Scholar] [CrossRef]
- Benjamini, Y.; Hochberg, Y. Controlling the False Discovery Rate: A Practical and Powerful Approach to Multiple Testing. J. R. Stat. Soc. Ser. B Methodol. 1995, 57, 289–300. [Google Scholar] [CrossRef]
- R Core Team. R: A Language and Environment for Statistical Computing; R Foundation for Statistical Computing: Vienna, Austria, 2026; Available online: https://www.R-project.org/ (accessed on 10 October 2026).
- VanderWeele, T.J.; Ding, P. Sensitivity Analysis in Observational Research: Introducing the E-Value. Ann. Intern. Med. 2017, 167, 268–274. [Google Scholar] [CrossRef] [PubMed]
- Kipnis, V.; Subar, A.F.; Midthune, D.; Freedman, L.S.; Ballard-Barbash, R.; Troiano, R.P.; Bingham, S.; Schoeller, D.A.; Schatzkin, A.; Carroll, R.J. Structure of Dietary Measurement Error: Results of the OPEN Biomarker Study. Am. J. Epidemiol. 2003, 158, 14–21. [Google Scholar] [CrossRef] [PubMed]
- Freedman, L.S.; Commins, J.M.; Moler, J.E.; Arab, L.; Baer, D.J.; Kipnis, V.; Midthune, D.; Moshfegh, A.J.; Neuhouser, M.L.; Prentice, R.L.; et al. Pooled Results From 5 Validation Studies of Dietary Self-Report Instruments Using Recovery Biomarkers for Energy and Protein Intake. Am. J. Epidemiol. 2014, 180, 172–188. [Google Scholar] [CrossRef] [PubMed]
Figure 1.
Selection of participants for the day-one, primary two-day, clinical-extension, and mortality analyses.
Figure 1.
Selection of participants for the day-one, primary two-day, clinical-extension, and mortality analyses.
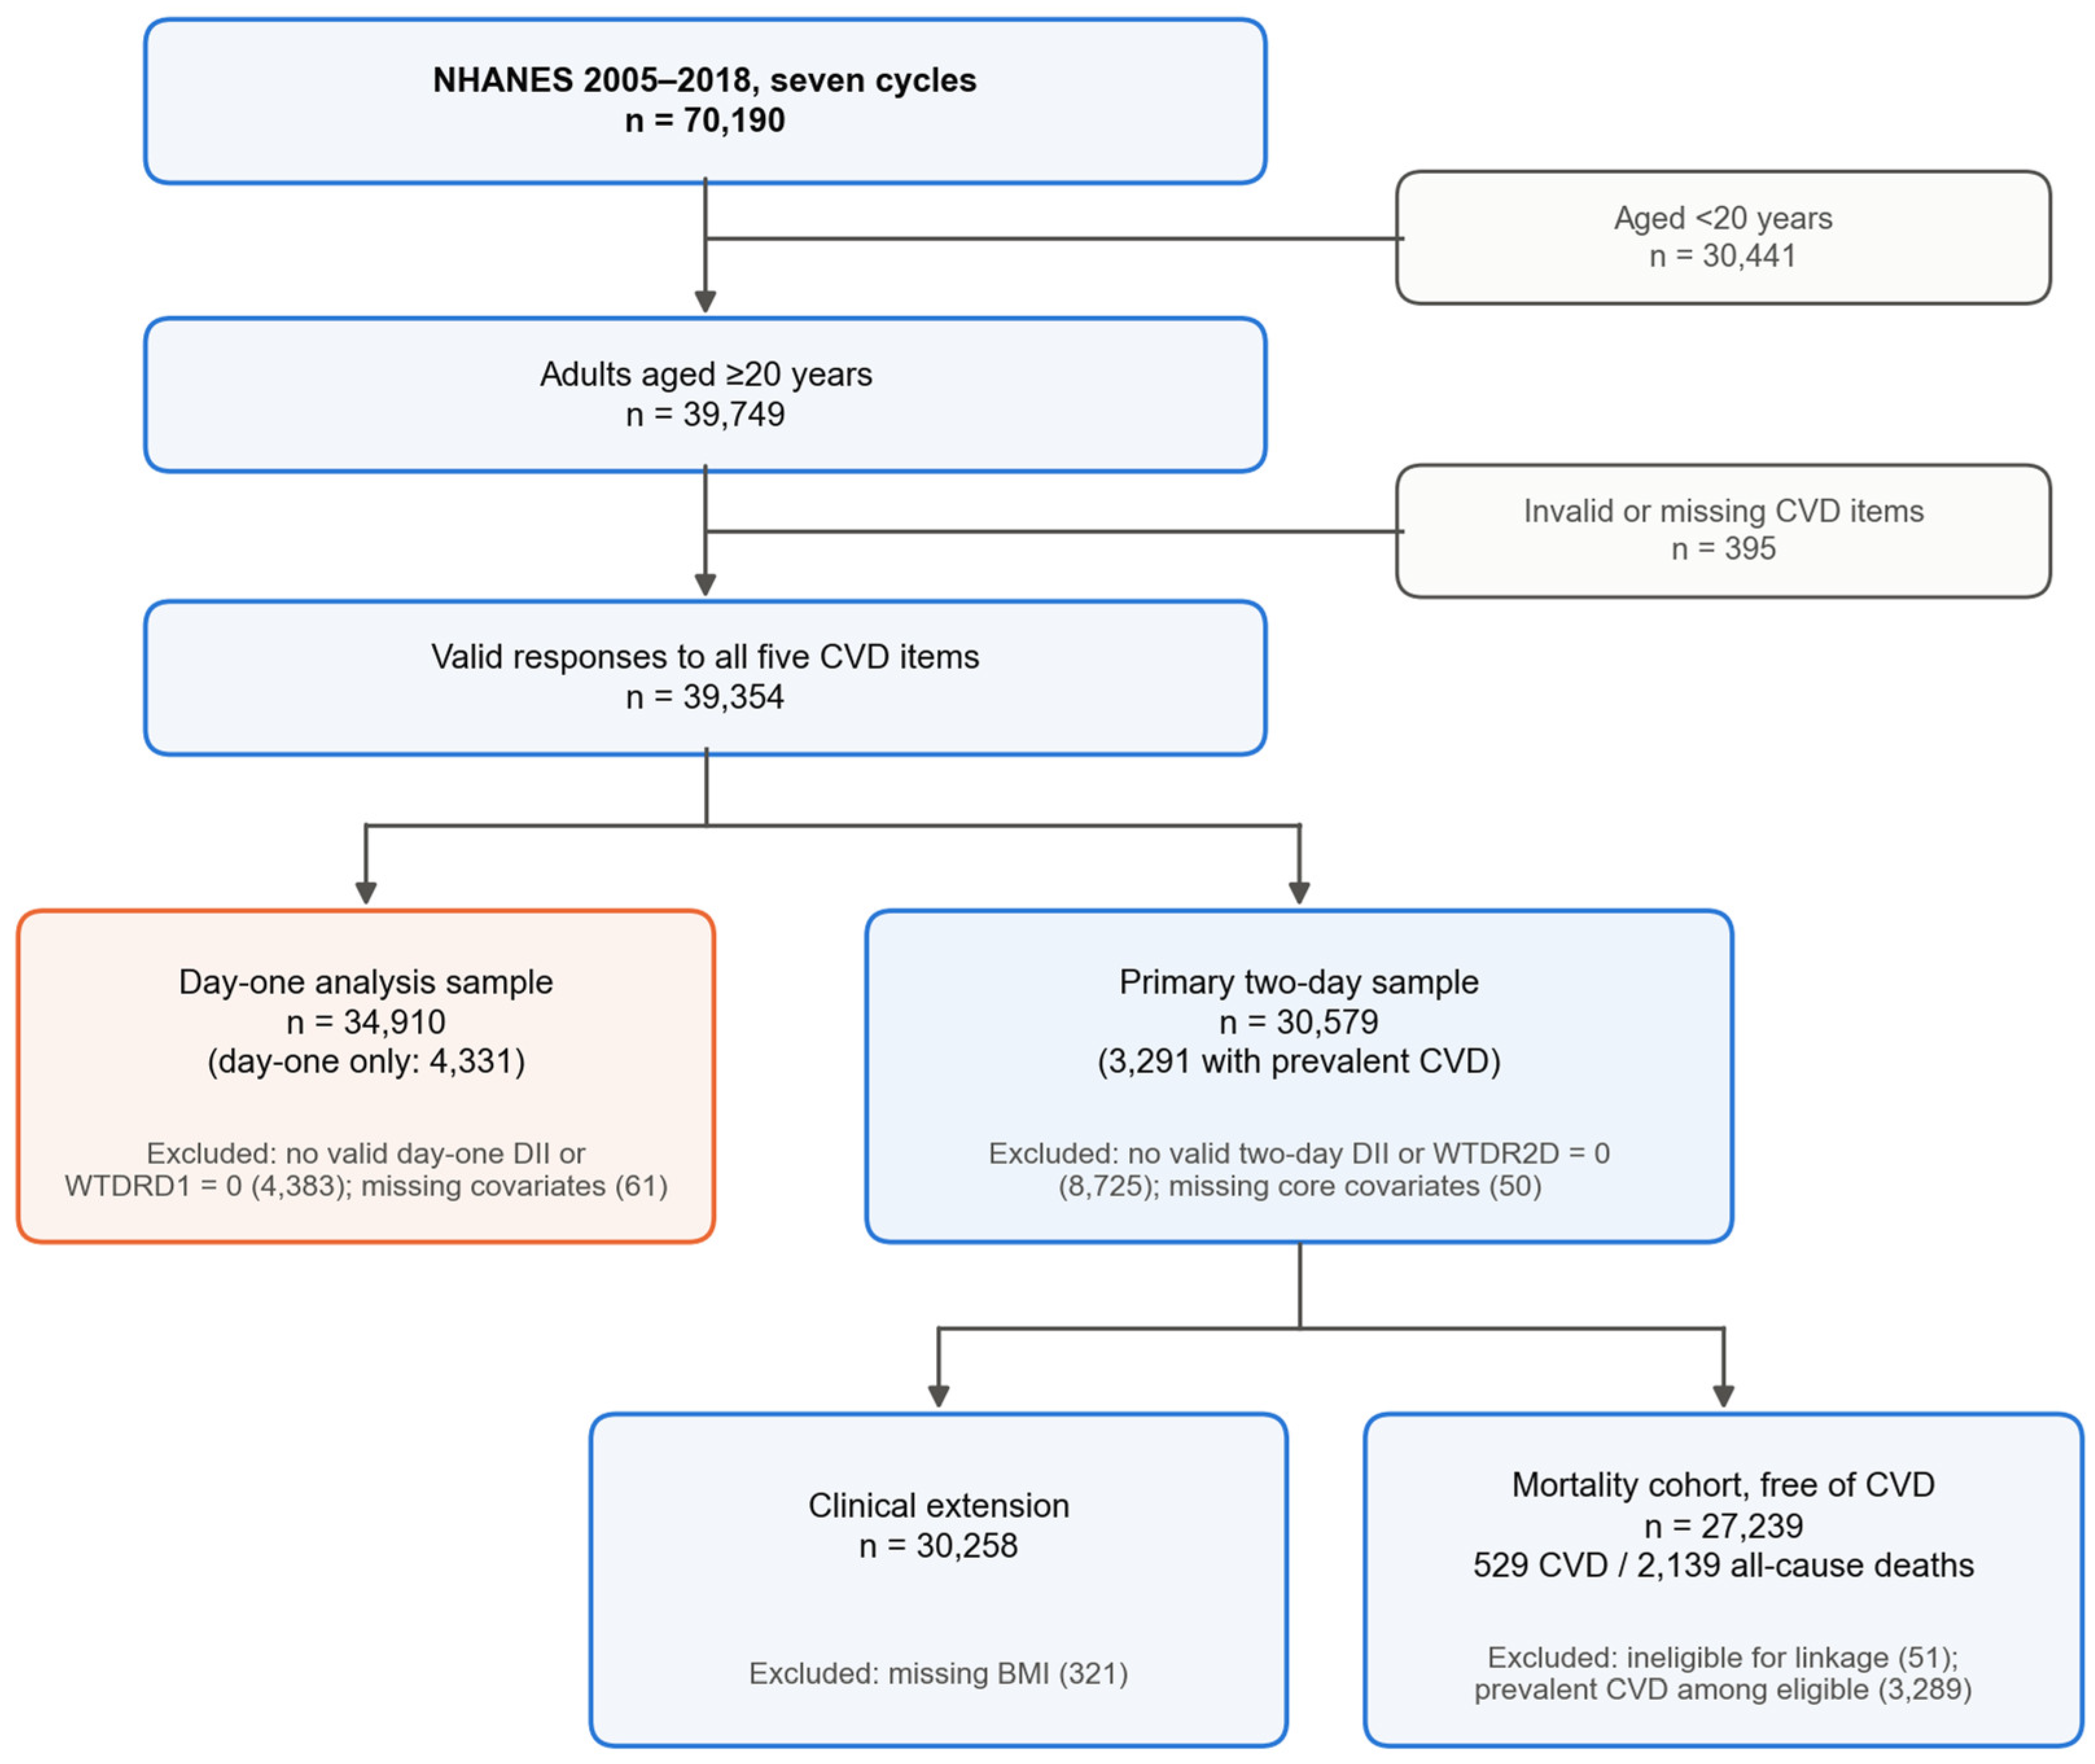
Figure 2.
Period-specific associations of DII with prevalent CVD and equivalence test of the period difference.
Figure 2.
Period-specific associations of DII with prevalent CVD and equivalence test of the period difference.
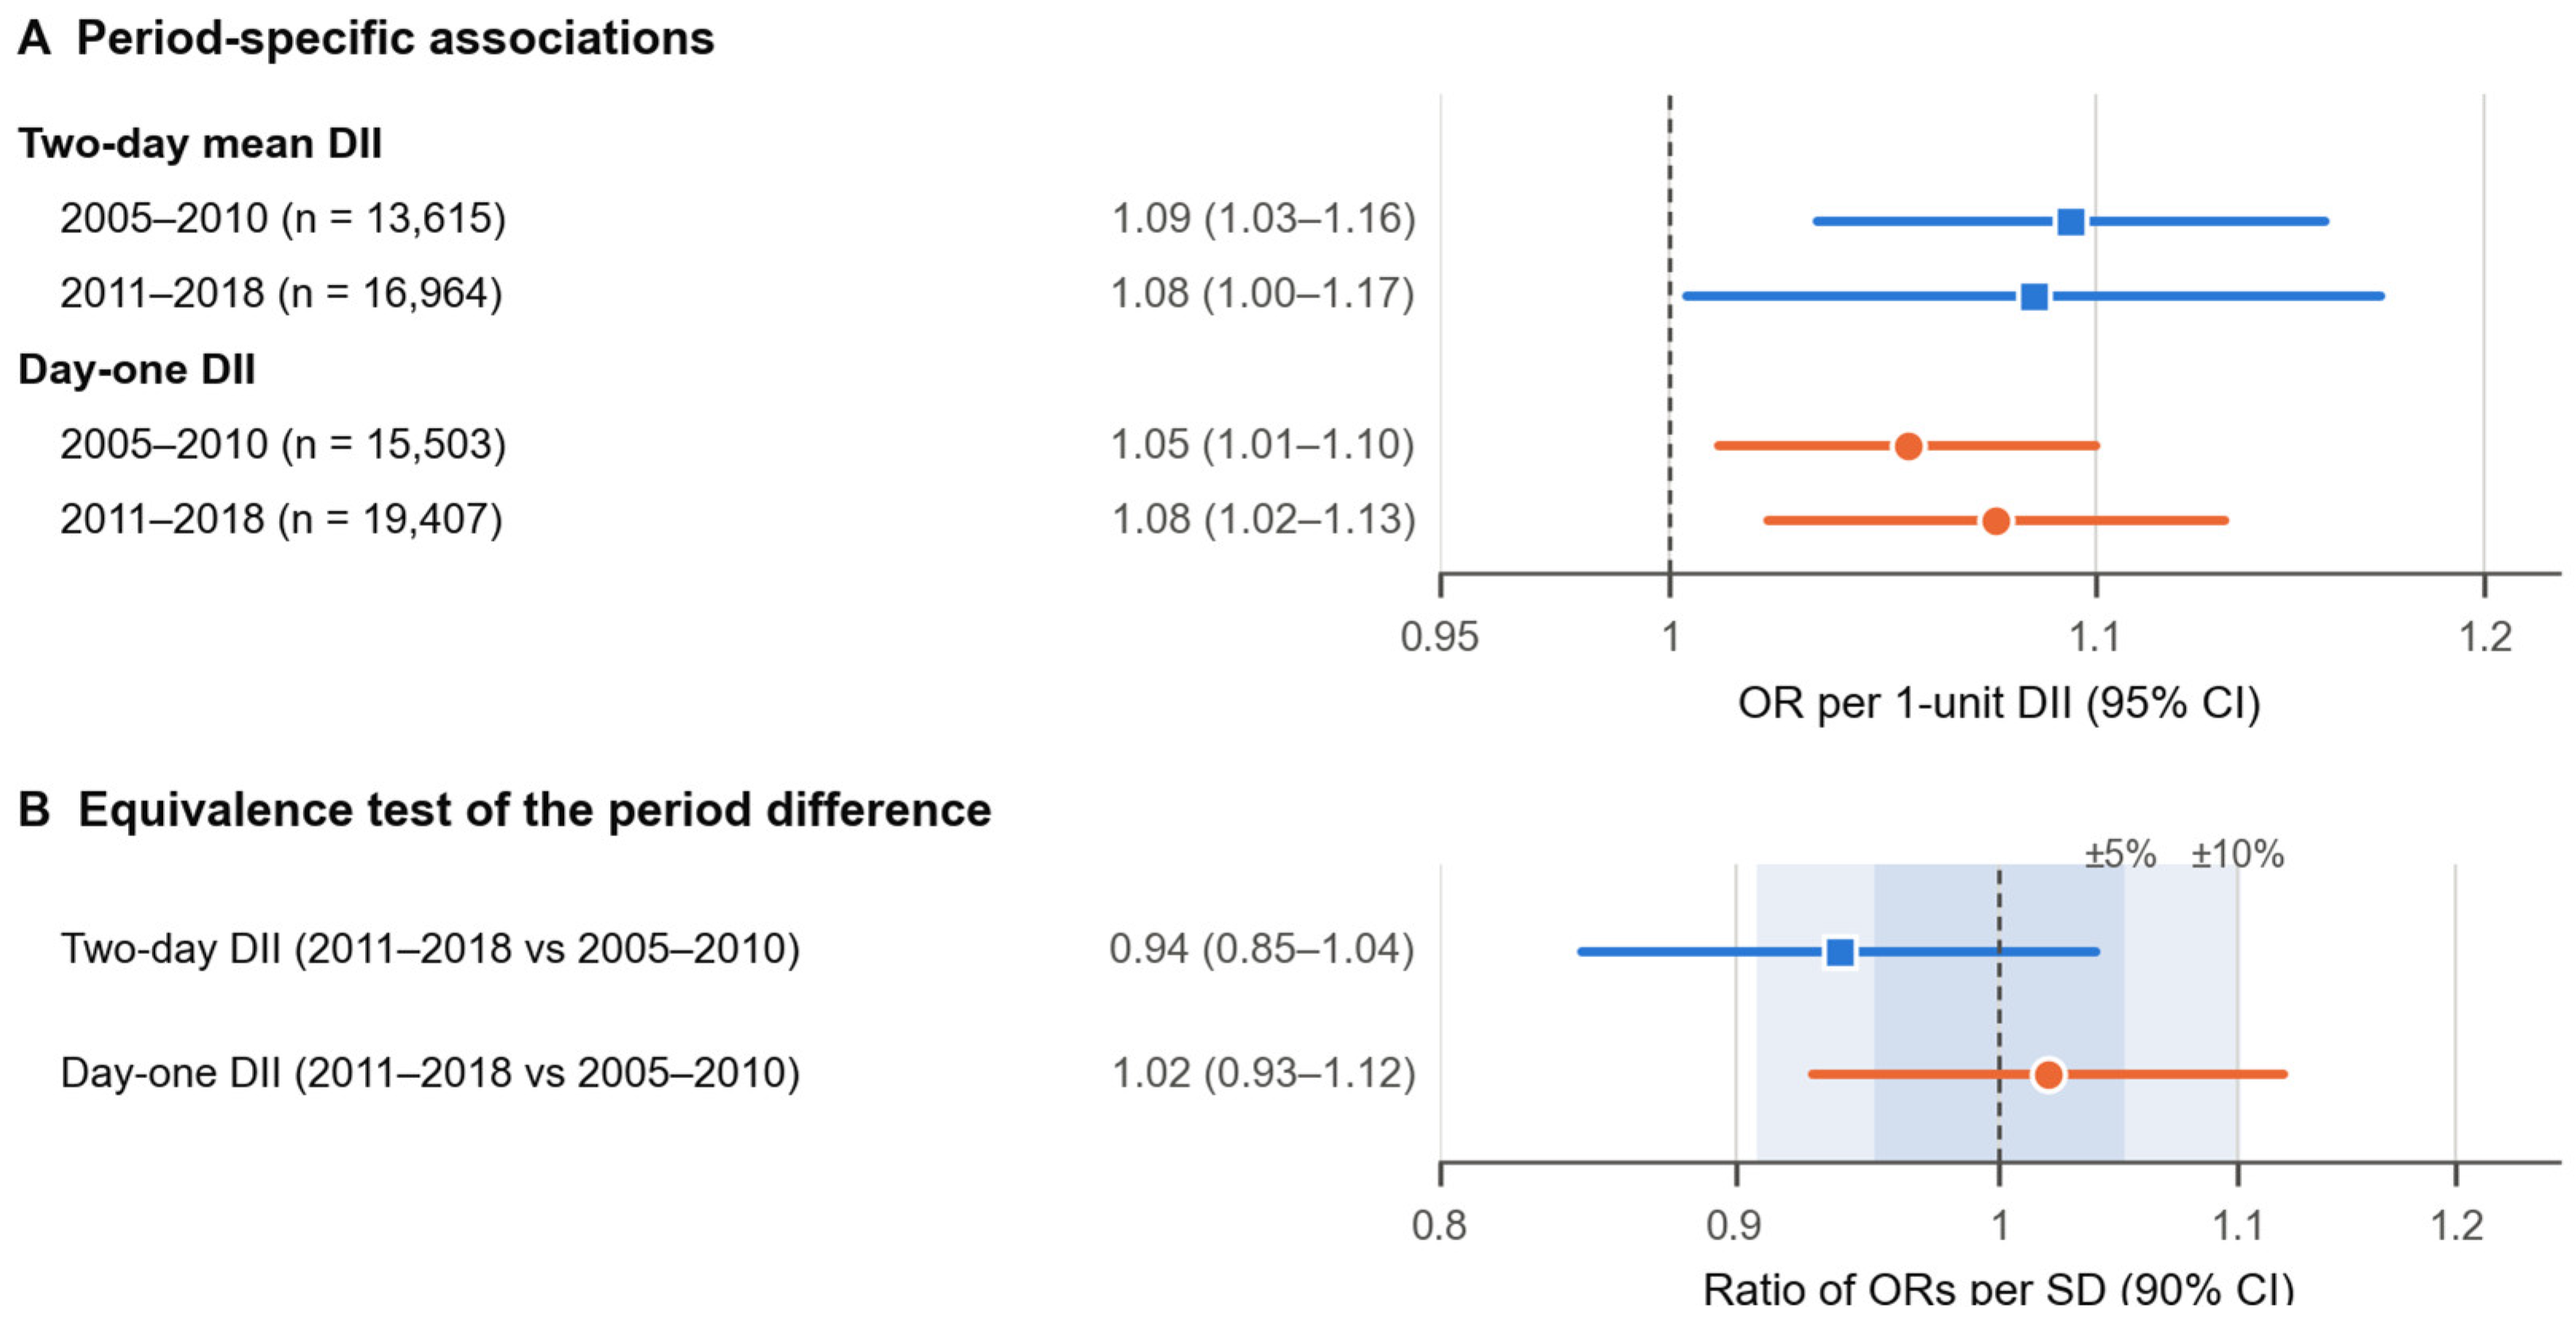
Figure 3.
Day-to-day agreement of DII quartiles and observed versus regression-calibrated associations.
Figure 3.
Day-to-day agreement of DII quartiles and observed versus regression-calibrated associations.
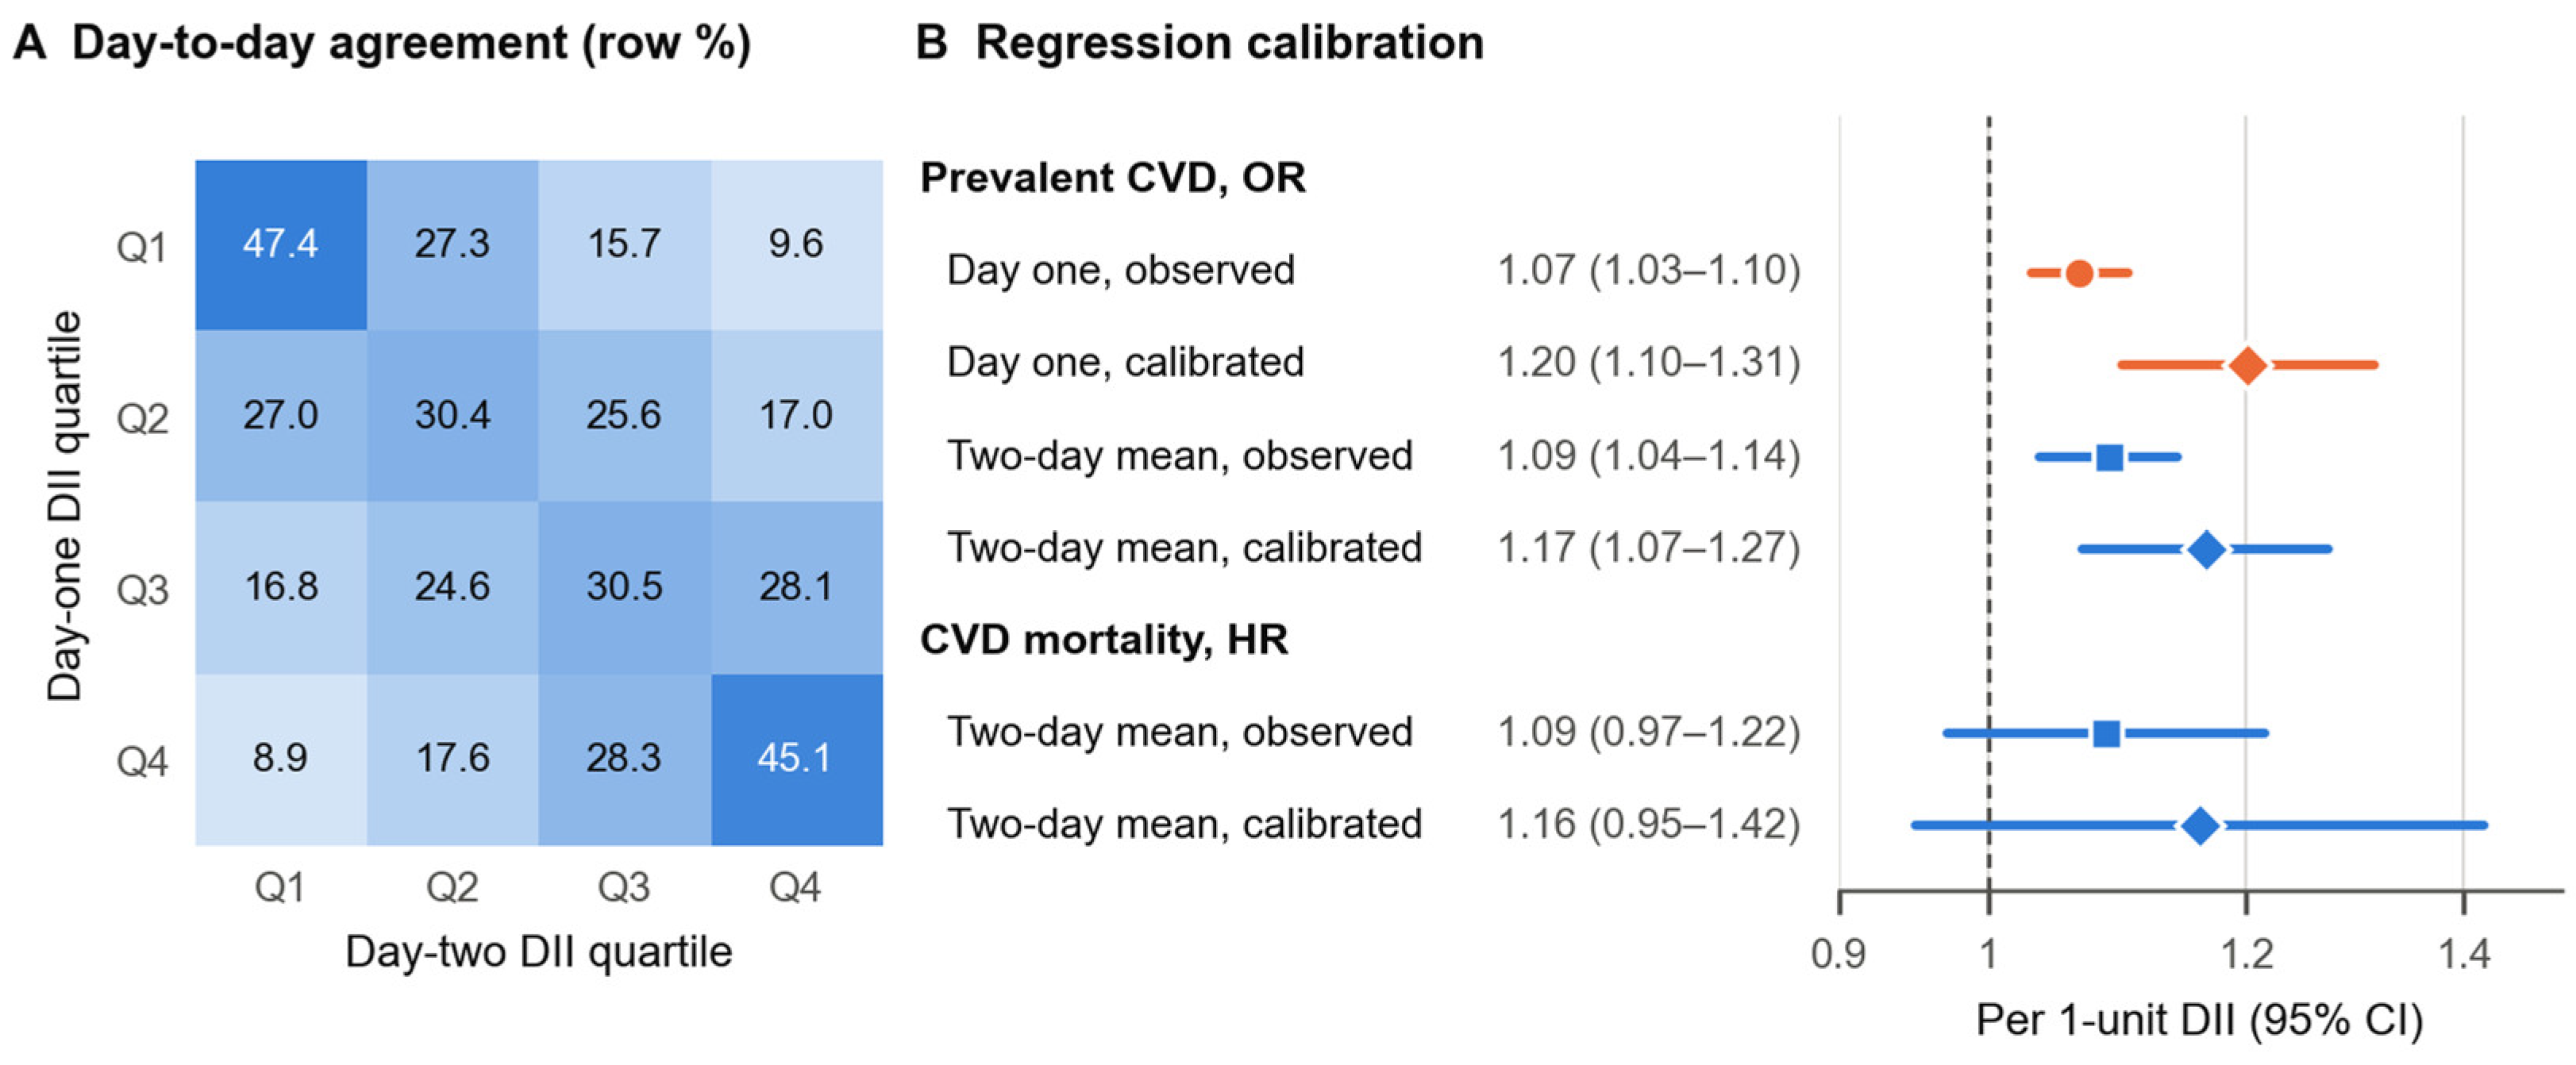
Figure 4.
Reverse-causation restriction analyses for prevalent CVD and mortality associations among adults free of CVD.
Figure 4.
Reverse-causation restriction analyses for prevalent CVD and mortality associations among adults free of CVD.
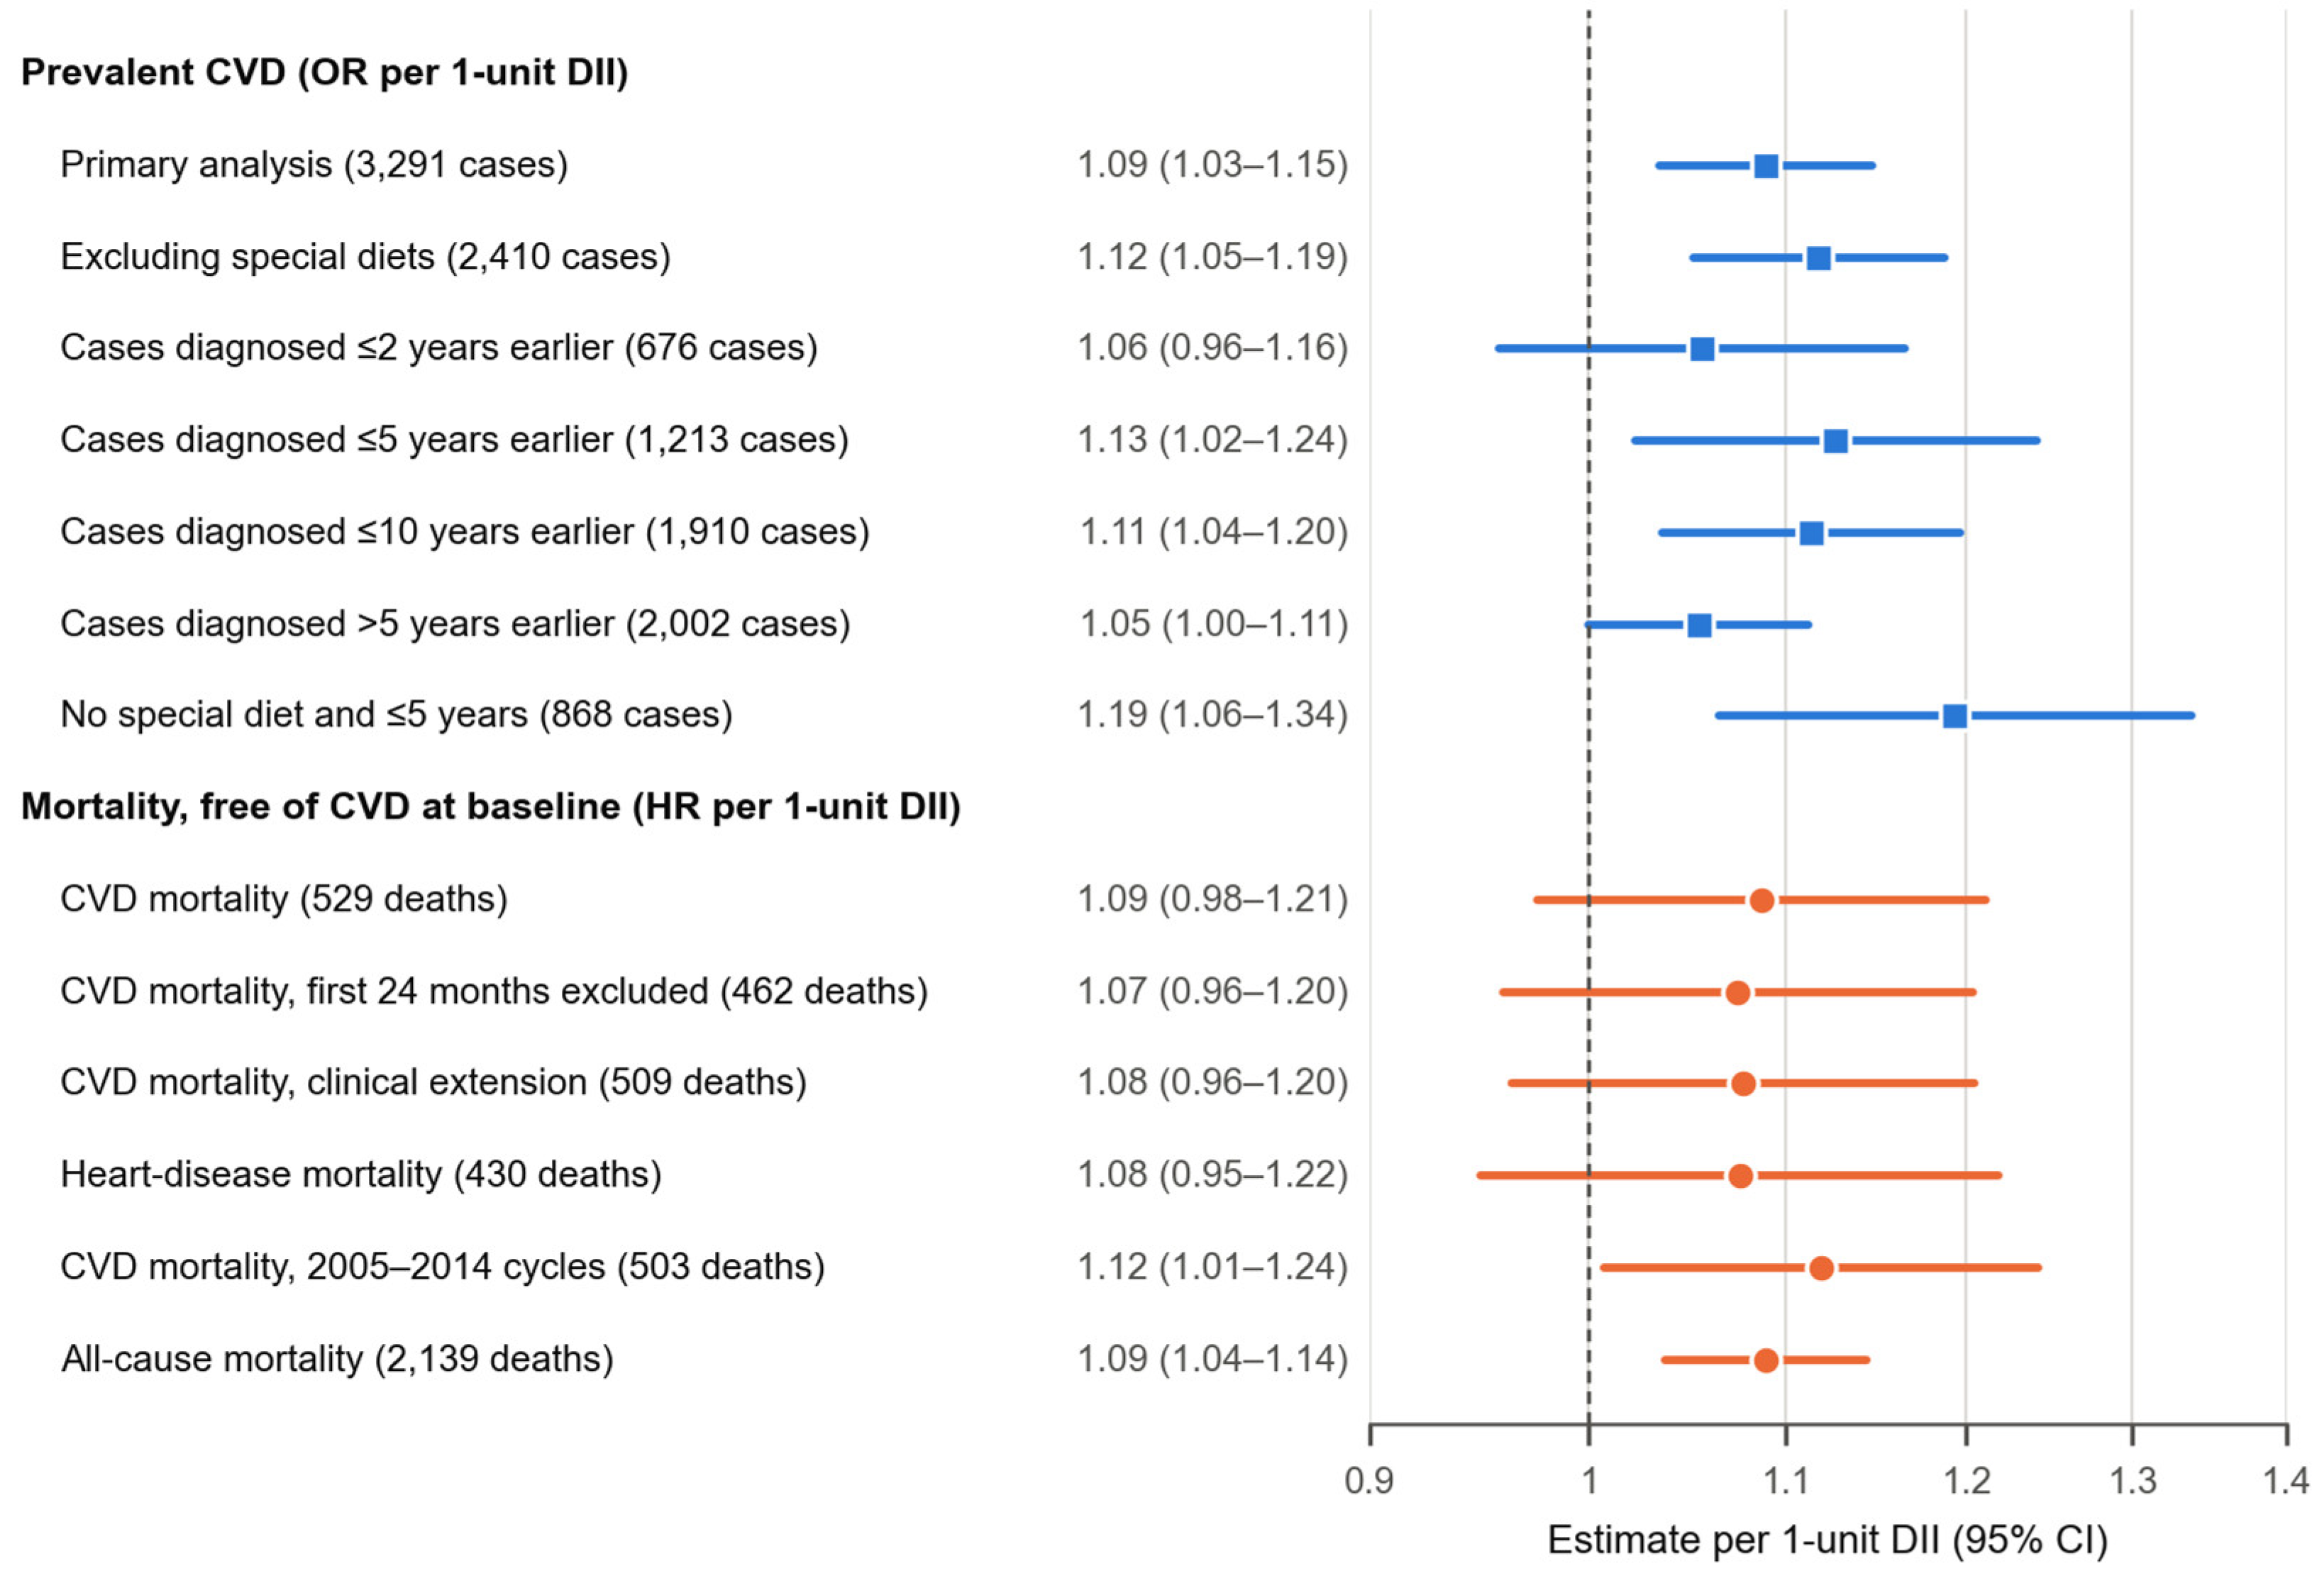
Table 1.
Characteristics of the primary two-day analytic sample by prevalent CVD status.
| Characteristic | Overall | No CVD | CVD |
|---|---|---|---|
| Unweighted sample, n | 30,579 | 27,288 | 3,291 |
| Age, years | 47.4 (16.9) | 45.8 (16.3) | 65.0 (13.2) |
| Sex | |||
| Male | 14,513 (47.6%) | 12,650 (47.1%) | 1,863 (53.6%) |
| Female | 16,066 (52.4%) | 14,638 (52.9%) | 1,428 (46.4%) |
| Race and ethnicity | |||
| Non-Hispanic White | 13,441 (67.4%) | 11,602 (66.8%) | 1,839 (74.1%) |
| Mexican American | 4,602 (8.5%) | 4,324 (8.9%) | 278 (4.6%) |
| Non-Hispanic Black | 6,659 (11.4%) | 5,900 (11.3%) | 759 (12.5%) |
| Other Hispanic | 2,831 (5.3%) | 2,603 (5.5%) | 228 (3.3%) |
| Other race | 3,046 (7.5%) | 2,859 (7.6%) | 187 (5.6%) |
| Education | |||
| More than high school | 16,478 (61.9%) | 15,056 (63.0%) | 1,422 (49.4%) |
| Less than high school | 7,070 (15.0%) | 6,066 (14.2%) | 1,004 (22.8%) |
| High school or equivalent | 7,031 (23.2%) | 6,166 (22.8%) | 865 (27.8%) |
| Marital status | |||
| Married or partnered | 18,524 (63.4%) | 16,701 (63.8%) | 1,823 (59.3%) |
| Not married or partnered | 12,055 (36.6%) | 10,587 (36.2%) | 1,468 (40.7%) |
| Smoking | |||
| Never | 16,991 (55.9%) | 15,712 (57.4%) | 1,279 (39.3%) |
| Current | 6,006 (19.5%) | 5,326 (19.3%) | 680 (21.9%) |
| Former | 7,582 (24.7%) | 6,250 (23.4%) | 1,332 (38.8%) |
| Alcohol on either recall day | |||
| No | 21,725 (67.0%) | 19,125 (66.1%) | 2,600 (76.0%) |
| Yes | 8,854 (33.0%) | 8,163 (33.9%) | 691 (24.0%) |
| Two-day energy intake, kcal | 2088 (818) | 2105 (820) | 1898 (766) |
| Two-day 27-parameter DII | 0.83 (1.62) | 0.80 (1.62) | 1.11 (1.61) |
| BMI, kg/m² | 29.1 (6.9) | 28.9 (6.8) | 30.8 (7.2) |
| Diabetes | |||
| No | 25,274 (87.4%) | 23,321 (89.7%) | 1,953 (62.8%) |
| Yes | 5,305 (12.6%) | 3,967 (10.3%) | 1,338 (37.2%) |
| Hypertension | |||
| No | 17,493 (62.6%) | 16,823 (66.2%) | 670 (23.8%) |
| Yes | 13,086 (37.4%) | 10,465 (33.8%) | 2,621 (76.2%) |
Values are survey-weighted mean (SD) for continuous variables and unweighted n (survey-weighted %) for categorical variables. The denominator was 30,579 except for BMI (n = 30,258). BMI, body mass index; CVD, cardiovascular disease; DII, Dietary Inflammatory Index.
Table 2.
Survey-weighted association between the two-day 27-parameter DII and prevalent CVD.
| Model | Contrast | Estimate (95% CI) | P | n |
|---|---|---|---|---|
| Unadjusted | Per unit | 1.13 (1.09–1.17) | <0.001 | 30,579 |
| Demographic | Per unit | 1.17 (1.12–1.22) | <0.001 | 30,579 |
| Core | Per unit | 1.09 (1.03–1.15) | 0.001 | 30,579 |
| Clinical | Per unit | 1.07 (1.02–1.13) | 0.013 | 30,258 |
| Core | Q1 (reference) | 1.00 | 30,579 | |
| Core | Q2 vs Q1 | 1.13 (0.93–1.38) | 0.21 | 30,579 |
| Core | Q3 vs Q1 | 1.22 (1.00–1.48) | 0.048 | 30,579 |
| Core | Q4 vs Q1 | 1.37 (1.10–1.69) | 0.005 | 30,579 |
| Core | Prevalence ratio per unit | 1.07 (1.03–1.12) | 0.001 | 30,579 |
| Core | Prevalence difference per unit | 0.57 (0.22–0.92) | 0.002 | 30,579 |
Demographic, adjusted for flexible age, sex, race and ethnicity, and survey cycle; core, additionally adjusted for education, marital status, smoking, alcohol on either recall day, and energy intake; clinical, additionally adjusted for BMI, diabetes, and hypertension. Estimates are odds ratios unless stated otherwise; the prevalence difference is the average marginal difference in percentage points. Quartile P for trend = 0.003.
Table 3.
Temporal-consistency, equivalence, and dietary-recall-sensitivity analyses.
| Analysis | Effect scale | Estimate (CI) | P | n |
|---|---|---|---|---|
| Temporal consistency, two-day DII | ||||
| 2005–2010 | Per unit | 1.09 (1.03–1.16) | 0.003 | 13,615 |
| 2011–2018 | Per unit | 1.08 (1.00–1.17) | 0.040 | 16,964 |
| Temporal consistency, day-one DII | ||||
| 2005–2010 | Per unit | 1.05 (1.01–1.10) | 0.014 | 15,503 |
| 2011–2018 | Per unit | 1.08 (1.02–1.13) | 0.006 | 19,407 |
| Equivalence, 2011–2018 vs 2005–2010 | ||||
| Two-day DII | Ratio per SD, 90% CI | 0.94 (0.85–1.04) | 0.31 | 30,579 |
| Day-one DII | Ratio per SD, 90% CI | 1.02 (0.93–1.12) | 0.092 | 34,910 |
| Recall strategy | ||||
| Day one, full sample | Per unit | 1.07 (1.03–1.10) | <0.001 | 34,910 |
| Day one, full sample | Per SD (1.89) | 1.13 (1.06–1.21) | <0.001 | 34,910 |
| Day one, full sample | Per IQR (2.84) | 1.20 (1.09–1.33) | <0.001 | 34,910 |
| Two-day mean | Per unit | 1.09 (1.03–1.15) | 0.001 | 30,579 |
| Two-day mean | Per SD (1.62) | 1.15 (1.06–1.25) | 0.001 | 30,579 |
| Two-day mean | Per IQR (2.38) | 1.22 (1.08–1.38) | 0.001 | 30,579 |
| Day one, common sample | Per unit | 1.07 (1.03–1.11) | 0.001 | 30,579 |
| Day one, common sample | Per SD (1.89) | 1.13 (1.05–1.21) | 0.001 | 30,579 |
| Day two, common sample | Per unit | 1.04 (1.00–1.08) | 0.039 | 30,579 |
| Day two, common sample | Per SD (1.92) | 1.08 (1.00–1.17) | 0.039 | 30,579 |
| 27 or 28 parameters | Per SD (1.71) | 1.15 (1.05–1.25) | 0.002 | 30,579 |
All rows use the core covariate specification; SD and IQR values are weighted, and the day-one common-sample row is scaled by the day-one full-sample SD. Temporal and recall-strategy estimates are odds ratios with 95% CIs. Equivalence rows give the ratio of the 2011–2018 to the 2005–2010 OR per pooled weighted SD with a 90% CI and the two one-sided test P value for the pre-specified margin of 0.91 to 1.10; the corresponding interaction P values were 0.30 and 0.73. The cycle-specific score includes vitamin D where available. The day-two rows (post hoc) use the day-two DII in the same sample, weights, and covariates; its per-SD row uses its own weighted SD.
Table 4.
Observed and regression-calibrated associations of DII with prevalent CVD and CVD mortality.
Table 4.
Observed and regression-calibrated associations of DII with prevalent CVD and CVD mortality.
| Outcome | Observed | Calibrated | Calibrated per SD | Attenuation |
|---|---|---|---|---|
| Prevalent CVD, day one (OR) | 1.07 (1.03–1.10) | 1.20 (1.10–1.31) | 1.26 (1.13–1.42) | 0.36 (0.34–0.38) |
| Prevalent CVD, two-day mean (OR) | 1.09 (1.04–1.14) | 1.17 (1.07–1.27) | 1.22 (1.09–1.36) | 0.55 (0.54–0.57) |
| CVD mortality, two-day mean (HR) | 1.09 (0.97–1.22) | 1.16 (0.95–1.42) | 1.21 (0.94–1.56) | 0.55 (0.53–0.57) |
Observed and calibrated values are estimates per unit of DII with 95% CIs from 500 survey bootstrap replicates, which differ slightly from the design-based CIs in Table 2 and Table 3, and 5; the attenuation factor is shown with its 2.5th and 97.5th bootstrap percentiles. Calibrated per SD refers to the SD of usual DII (1.28). DII and energy were calibrated jointly. The ratio of the day-one to the two-day OR per unit was 0.98 (0.95–1.01) before and 1.03 (0.96–1.10) after calibration. Mortality analyses were restricted to adults free of CVD at baseline.
Table 5.
Associations of two-day DII with CVD and all-cause mortality.
| Outcome and model | Deaths | HR per unit (95% CI) | Q4 vs Q1 | P for trend |
|---|---|---|---|---|
| CVD mortality | ||||
| Core | 529 | 1.09 (0.98–1.21) | 1.48 (0.93–2.36) | 0.14 |
| First 24 months excluded | 462 | 1.07 (0.96–1.20) | 1.30 (0.80–2.12) | 0.30 |
| Clinical extension | 509 | 1.08 (0.96–1.20) | 1.42 (0.89–2.26) | 0.19 |
| 2005–2014 cycles | 503 | 1.12 (1.01–1.24) | Not estimated | |
| Heart-disease mortality | ||||
| Core, all cycles | 430 | 1.08 (0.95–1.22) | Not estimated | |
| All-cause mortality | ||||
| Core | 2,139 | 1.09 (1.04–1.14) | 1.44 (1.15–1.79) | 0.005 |
| Whole sample, adjusted for baseline CVD | ||||
| CVD mortality | 954 | 1.10 (1.02–1.18) | 1.55 (1.10–2.18) | 0.027 |
| All-cause mortality | 3,255 | 1.11 (1.06–1.16) | 1.53 (1.27–1.85) | <0.001 |
Unless stated otherwise, analyses include the 27,239 adults free of CVD at baseline; whole-sample rows include all linkage-eligible adults in the primary sample. Follow-up extended to 31 December 2019. Heart-disease mortality and the 2005–2014 restriction use uniformly coded causes of death; quartile estimates were not computed for them. Q4 vs Q1 values are HRs with 95% CIs.
Disclaimer/Publisher’s Note: The statements, opinions and data contained in all publications are solely those of the individual author(s) and contributor(s) and not of MDPI and/or the editor(s). MDPI and/or the editor(s) disclaim responsibility for any injury to people or property resulting from any ideas, methods, instructions or products referred to in the content. |
© 2026 by the authors. Licensee MDPI, Basel, Switzerland. This article is an open access article distributed under the terms and conditions of the Creative Commons Attribution (CC BY) license (http://creativecommons.org/licenses/by/4.0/).
Copyright: This open access article is published under a Creative Commons CC BY 4.0 license, which permit the free download, distribution, and reuse, provided that the author and preprint are cited in any reuse.