

Submitted:
14 October 2026
Posted:
15 October 2026
You are already at the latest version
Abstract
CD5 and CD6 are signal transducing type I transmembrane scavenger receptors mediating recogni-tion of host and microbial ligands. They are mainly expressed by all T cells, but also a small subset of B cells for which limited information is still available. Here we evaluated the impact of CD5 and CD6 deficiency on B1 and innate-like B cell populations in spleen and peritoneum compared to wild-type BL6 mice and Btk-deficient CBA/N mice. Both CD5- (Cd5-/-) and CD6 (Cd6-/-)-deficient mice showed decreased B1 cells (B220loCD11b+) in the spleen, as well as in peritoneal exudate. By contrast, B220loCD11b- (B220lo) cells were reduced in Cd5-/- mice from the neonatal stage, while remaining similar to BL6 levels in Cd6-/- mice. Transcriptomic analysis of purified B220lo cells revealed a con-served core program across wild-type, Cd5-/- and Cd6-/- strains, with reduced BCR co-receptor and Ras signalling, alongside increased pathways related to activation, transcriptional regulation, and im-mune modulation. Genotype-specific divergences were found, consisting of CD5 deficiency pro-moting a more structured and regulated signalling state, while CD6 deficiency induced a highly activated and metabolically reprogrammed phenotype, with increased mitochondrial activity, redox balance, biosynthetic capacity and reduced dependence on interferon-mediated signalling. Collec-tively, these findings identify B220lo B cells as a flexible population whose functional polarization is differentially controlled by CD5- and CD6-dependent regulatory axes governing signalling organi-zation and metabolic activation.
Keywords:
B lymphocyte
; B1 cells
; B1a
; B1b
; CD19+ B220locells
; CD5
; CD6
1. Introduction
B lymphocytes contribute to immune defence through the production of antibodies, secretion of immunomodulatory cytokines and antigen presentation [1]. Beyond these classical effector functions, B cells can also exert regulatory roles by modulating immune responses and contributing to the maintenance of immune homeostasis [2,3]. Two major B-cell lineages, B1 and B2, have been defined in the mouse. B1 cells arise predominantly during embryonic development in the para-aortic splanchnopleure [4], then in the foetal liver, and continue to be generated during early neonatal life, although with limited contribution from the adult bone marrow (BM) [5,6]. Mouse B1 cells have been extensively studied by using the CBA/N strain, that bears a btk gene mutation driving to complete absence of B1 cells with lack of response to TI-2 (Ficoll) and pneumococcal polysaccharide [7]. B1 cells exhibit innate-like properties, they have a distinctive phenotype (CD5+CD19+B220loIgM+IgDloCD43+CD23-CD11b+), are maintained largely through self-renewal, and display constitutively activated features. They are preferentially localized in coelomic cavities, where they rapidly produce polyreactive natural antibodies (NAbs), primarily IgM, and secrete regulatory cytokines such as IL-10, supporting early immune protection and immune homeostasis [7].
By contrast, B2 cells continuously arise from BM progenitors throughout life as transitional lymphocytes that subsequently migrate to secondary lymphoid organs, where they complete maturation [8]. In the spleen, transitional B cells develop into different subsets that form the germinal centre structure, namely marginal zone B cells (MZB) and follicular B cells (FoB) [9]. MZB cells display a CD5-CD19+B220+IgM+IgDloCD23-CD21++CD43-CD27+CD1c+ phenotype with a preactivated status, they bear polyreactive B cell receptors (BCRs) and are responsible for early IgM secretion upon T-independent antigen exposure [10]. FoB cells are CD5-CD19+B220+IgM+IgD+CD23++CD21+CD43-, undergo clonal expansion and class switch recombination to IgG and IgA, and differentiate to long-lived antibody-secreting plasma cells and memory B cells, which together constitute the canonical adaptive humoral immune response [11,12]
The functional and developmental dichotomy between B1 and B2 cells underscores the importance of understanding lineage-specific markers such as CD5 (and its less explored paralogue CD6), which are characteristically expressed on T cells and also on B1 cells, and have been implicated in the regulation of their activation state, signalling thresholds, and cytokine production [13,14]. B1 cells have been extensively studied in the peritoneal cavity, where they are subdivided as CD5+ (B1a) and CD5- (B1b) subpopulations, both of which are CD11b+. Peritoneal B1a cells are CD43+, whereas only a fraction of B1b cells expresses CD43. B1a cells spontaneously secrete NAbs of IgM class, using preserved germline BCRs that display very low mutations, while B1b cells secrete also IgG upon stimulation. B1a cells can be mobilized to the spleen, where they lose CD11b, acquire CD6 expression and represent a very low cell fraction [15]. Thus, the mouse B1 cell compartment is heterogeneous and includes tissue-specific subpopulations that diverge phenotypically from peritoneal B1 cells while retaining their key functional and developmental features.
While mouse B1 cells are well defined in terms of origin, phenotype, and function, the identification and characterization of their human counterparts remain a matter of ongoing debate. Human B1-like cells have been described in umbilical cord blood and, at much lower frequencies, in adult peripheral blood. However, their phenotypic definition, developmental origin, and functional equivalence to mouse B1 cells are still under active investigation. Despite their scarcity, human B1-like cells have been proposed to contribute to early immune defence through the production of NAbs and to share innate-like features with mouse B1 cells, suggesting a conserved, albeit less prominent, role in human immunity [16,17].
Previous work from our group identified a mouse CD19+B220lo B cell population (from now on B220lo), displaying characteristics of innate-like cells [18]. They were found in spleen, lung and peripheral blood from neonatal life. B220lo cells release IgM, IgG1, IgA and IL-10, the later conferring them immunoregulatory properties. Thus, B220lo cells are closely related to B1 cells in aspects such as phenotype, independence of BM progenitors and TLR-dependent activation [19]. We have recently demonstrated that lung and spleen B220lo cells from day 7 neonatal mice respond in vitro and in vivo to TLR2 and TLR4 agonists [20].
CD5 and CD6 are lymphoid-specific signal transducing cell surface receptors exhibiting high structural and functional homology, implying a potential coordinated function [21]. CD5 and CD6 expression was first described in T lymphocytes, and later reported to be expressed in the normal B1 cell subset and some lymphoproliferative B cell disorders (e.g., Chronic Lymphocytic Leukaemia, CLL) [22,23]. In T cells, CD5 and CD6 are physically associated with each other as well as with the TCR [21]. In B1 cells, CD5 associates with the BCR [24] and acts as an inhibitory co-receptor by limiting BCR signalling through its cytoplasmic pseudo-ITAM motif and associated phosphatase-dependent pathways [25]. Beyond BCR regulation, CD5 also modulates IL-10 production, cell survival and metabolic activity [26,27]. First evidence on the negative regulatory role of CD5 came from the study of CD5-deficient (Cd5-/-) mice [28]. Subsequent work showed that CD5 deficiency specifically in B1 cells reduces their activation threshold [29]. Then B1a cells, which are inherently prone to autoreactivity, lose their homeostatic control mechanism and consequently, CD5-deficient mice exhibit increased levels of autoantibodies [9]. Recent studies also suggest that CD5 promotes B1 cell survival through autocrine IL-10 production [30].
The nature of the endogenous CD5 ligand/s is yet an unresolved question since any of the reported ones (CD72, IgVH framework, mouse gp40-80, human gp150, bovine gp200, CD5 itself, IL-6) have not been unequivocally confirmed by independent groups [31]. This situation does not apply to CD6 for which a well characterised ligand is CD166/ALCAM (for Activated Leukocyte Cell adhesion Molecule), a broadly tissue distributed adhesion molecule of the immunoglobulin superfamily. Alternative later-reported CD6 ligands also include CD318/CDCP-1 (for CUB-domain containing protein 1), Galectins 1 and 3, and CD44 [32]. Importantly, the CD6-CD166/ALCAM interaction plays a relevant role in the establishment and functionality of the immunological synapse between antigen-presenting cells and T cells [33,34,35] as well as in T cell transmigration to inflamed tissues. Under homeostatic conditions, CD6-deficient (Cd6-/-) mice show reduced splenic B1a and marginal zone B-cell compartments together with decreased NAb levels, without enhanced autoantibody production, partially resembling the phenotype reported in Cd5-/- models [36,37]. Functionally, CD6 in B1a cells contributes to bacterial-associated molecular pattern recognition, and its absence impairs the response to bacterial sepsis, leading to reduced survival and increased pro-inflammatory cytokine production [38]. In humans, CD6 is expressed by T cells, NK cells and B-cell subsets, and reduced CD6 expression on circulating B cells from SLE patients has been linked to liver/kidney involvement and ANA/anti-SSA antibody production, supporting a potential role for altered CD6 expression in B-cell-associated autoimmunity [39].
Interestingly, despite their structural and tissue distribution homologies, mouse and human evidence supports that CD5 and CD6 function as non-redundant regulators of the immune system, meaning one molecule cannot fully compensate for the absence of the other [40,41]. Although CD5 and CD6 have been mainly studied as modulators of lymphocyte activation, their contribution to B-cell development and innate-like B-cell homeostasis remains incompletely understood. We hypothesized that CD5 and CD6 may participate in the fine-tuning of B-cell maturation. Accordingly, the lack of either receptor could disturb B-cell developmental transitions and modify the composition of peritoneum and spleen B1-like populations. Because CD5 is closely linked to the regulation of BCR signalling, whereas CD6 may additionally influence ligand-dependent cell–cell interactions and tissue-niche communication, we further proposed that CD5 and CD6 deficiencies would not necessarily produce identical phenotypes but rather reveal distinct and complementary roles in shaping B-cell homeostasis. In the present work, by using Cd5-/- and Cd6-/- mice, we have analysed how these molecules differentially affect the phenotypic traits of the innate-like B cell cellular stages in the spleen and the conventional peritoneal B1a and B1b cells, together with the RNA transcription profile differences of adult splenic innate-like B220lo cell populations.
2. Materials and Methods
2.1. Mouse Strains
Wild type C57BL/6J mice (BL6) were from Charles River Laboratories, France. Cd5-/- [28] and Cd6-/- [42] mice in C57BL/6J background were provided by Dr. F. Lozano (Universitat de Barcelona) and CBA/N (CBA/CaHN-Btkxid/J) bred under a specific pathogen-free condition in Carlos III Health Institute (Madrid) animal facility (Nb ES280800000015). Information of total numbers of animals used in this study according to ARRIVE guidelines in the Supplemental Data file. The study has been performed with adult mouse samples (3-4 months old), unless otherwise indicated. Adult animals were sacrificed with carbon dioxide, and D7 pups by decapitation. All procedures were performed in agreement with approved protocols and guidelines established by the Ethics and Animal Welfare Committee of the Carlos III Health Institute, and with authorization of the Community of Madrid (PROEX numbers 110/15, 021/18, 282.4/20).
2.2. Sample Preparations for Flow Cytometry and Cell Sorting
A brief graphical presentation of study design is included in Figure S1A. Spleens were removed, homogenized and filtered through a 70 µm cell strainer (Corning). Red blood cells were lysed using ACK (Ammonium-Chloride Potassium) lysing buffer (Gibco, Life Technologies) and washed twice in staining buffer. The resulting cell pellets were suspended in staining buffer for downstream applications.
After counting using trypan blue exclusion on Neubauer chambers, cells were adjusted at of 2 x 10⁶ /mL. For flow cytometry studies, dead cells were discarded with the LIVE/DEAD Fixable Aqua Dead Cell Stain Kit (Invitrogen, ThermoFisher Scientific), incubating the cells at room temperature for 20 min. Fc receptors were blocked using mouse Fc block reagent (BD Biosciences) for 20 min at 4 °C. After washing, the cells were stained with the fluorescent-conjugated antibodies listed in Supplementary Table S1. After staining, samples were analysed on a Fortessa BD 5-laser cytometry (Becton Dickinson). Sorting experiments were performed using FACSAria II and FACSAria Fussion sorter engines (Becton Dickinson). Purity of sorted cells was over 95 %. Data analysis and flow plots were generated using FlowJov10. Gating strategy to discard debris and doublet discrimination was performed in all the samples. Positive and negative controls and fluorescence minus one (FMO) control were set in all the experiments. Statistical testing of compiled flow cytometry was performed using GraphPad Prism software. One-way ANOVA with post-hoc Tukey and parametric unpaired or paired Student's t test were applied. Statistical details for ANOVA analyses are shown in Table S2. For comparisons of data in Figure 3, contingency tables were performed and analyses with Chi-square with Fisher exact test were used. Statistical significance is considered when p < 0.05 (*), p < 0.01 (**), p < 0.001 (***) or p < 0.0001 (****).
2.3. RNA Isolation and Short Read, Low-Input RNA Sequencing.
Sorted B220lo and B220hi (2 x10⁵ cells) corresponding to Cd5-/-, Cd6-/- and wild-type BL6 mice were centrifuged and total RNA from pellets was isolated using Rneasy Mini Kit (Qiagen, Hilden, Germany) according to the manufacturer’s instructions. RNA sequencing libraries were prepared following the SMART-seq2 protocol [44] with some modifications. Briefly, total RNA samples were quantified using the Qubit® RNA BR Assay Kit (Thermo Fisher Scientific), and RNA integrity was assessed with the Agilent DNF-471 RNA (15 nt) Kit on the Fragment Analyzer 5200 system (Agilent). Reverse transcription was performed on 1.8 µl of total RNA input (6–11 ng, depending on sample availability) using SuperScript II (Invitrogen) in the presence of oligo-dT30VN primers (1 µM; 5′-AAGCAGTGGTATCAACGCAGAGTACT30VN-3′), template-switching oligonucleotides (1 µM), and betaine (1 M). The resulting cDNA was amplified using KAPA HiFi HotStart ReadyMix (2×) (Roche) and 100 nM IS PCR primer (5′-AAGCAGTGGTATCAACGCAGAGT-3′), with 8 cycles of PCR. After purification with Agencourt AMPure XP beads (1:1 ratio; Beckman Coulter), product size distribution and concentration were evaluated using the Bioanalyzer High Sensitivity DNA Kit (Agilent). A total of 200 ng of amplified cDNA was fragmented for 10 min at 55 °C using the Nextera XT Kit (Illumina), followed by 12 cycles of amplification with indexed Nextera PCR primers. The resulting libraries were purified twice using Agencourt AMPure XP beads (0.8:1 ratio) and quantified again using the Bioanalyzer High Sensitivity DNA Kit.
Sequencing was performed on an Illumina NovaSeq X Plus system in paired-end mode with a read length of 2 × 151 bp, according to the manufacturer’s protocol for dual indexing. Image analysis, base calling, and quality scoring were carried out using Real Time Analysis (RTA) software version 4.29.3, followed by the generation of FASTQ files.
2.4. Quality Control, Sequence Reads Alignment, and Analysis of Differentially Expressed Genes
RNA-seq reads were mapped against the Mus musculus genome (GRCm39) using STAR 2.7.10a with ENCODE parameters [45]. Transcript quantification was performed with RSEM 1.3.1 [46] using the gencode.vM38 annotation. Genes with at least 1 count-per-million reads (cpm) in at least 2 samples were retained. Counts were normalized using the trimmed mean of M-values (TMM) method and transformed into log2-counts per million (logCPM). Differential gene expression analysis was performed using the limma R package v3.54.2 [47]. The voom function was used to estimate the mean-variance relationship and compute observation-level weights [48]. These voom-transformed counts were used to fit linear models. Functional enrichment analysis was conducted using g:Profiler via the gprofiler2 R package v0.2.3 [49]. Multidimensional scaling plots were generated with the limma function plotMDS using the top 500 most variable genes. Transcriptomic data were deposited in NCBI Gene Expression Omnibus (GEO) and can be retrieved using the GEO series accession number GSE333916.
2.5. Heatmap Analysis
Heatmaps were generated to visualize global patterns and relationships among the analysed samples. Data were arranged into a matrix in which rows represent differentially expressed genes and columns correspond to different experimental conditions (sample groups). The matrix was constructed using voom-transformed counts. Prior to visualization, data were standardized using row-wise z-score scaling to enable direct comparison of expression profiles across samples. Distance matrices for rows and columns were computed using the default Euclidean distance metric, and hierarchical clustering was performed using the default complete linkage algorithm. The resulting dendrograms were used to identify clusters of samples and genes with similar expression profiles. Heatmaps were generated using the R package pheatmap (v1.0.12). A colour scale was applied to represent the z-scores, with blue indicating negative values (lower expression), white and light-yellow indicating values around zero, and red indicating positive values (higher expression).
2.6. Statistical Thresholds, Gene Selection and Volcano Plot Generation
For each comparison, differential expression statistics including log2 fold change (logFC), raw P values, and adjusted P values were obtained. Multiple testing corrections were performed using the Benjamini-Hochberg method to control the false discovery rate (FDR). Genes were considered differentially expressed if they met the following criteria: absolute log2 fold change 1 and adjusted P value (FDR) < 0.05. Only genes annotated as protein-coding were retained for downstream visualization and interpretation. Volcano plots were generated to visualize differential gene expression patterns for each comparison. For each gene, the log2 fold change was plotted on the x-axis, and the negative log10-transformed adjusted P value was plotted on the y-axis. Genes not meeting the thresholds were displayed as non-significant, while significantly up-regulated and down-regulated genes were highlighted in distinct colors (green up-regulated genes and red down-regulated genes). Vertical dashed lines corresponding to log2 fold-change thresholds and a horizontal dashed line corresponding to the adjusted P-value threshold were included to facilitate visual interpretation of statistical significance.
2.7. Identification of Top Regulated Genes
For each comparison, the top 5 up-regulated and top 5 down-regulated protein-coding genes were identified based on adjusted P value ranking within each direction of regulation. These genes were used for subsequent functional interpretation. Data handing and volcano plot visualization were performed using Python-based analysis workflows, including pandas, numpy and matplotlib libraries. Plot aesthetics (colours scheme, axis limits, significance thresholds, and gene annotations) were standardized across all comparisons to ensure consistency and reproducibility.
2.8. qPCR Validation of RNAseq Data
Total RNA was extracted as described above (see section 2.3) from sorted purified splenic B220lo and B220hi cells from adult BL6 mice. Oligo (dT)-primed cDNA samples were prepared in 25 μl with avian myeloblastosis virus reverse transcriptase and 1 μl of each cDNA was used for further PCR amplifications. RT-qPCR was performed on a CFX96 Real-Time System using the SsoFastSupermixEvaGreen (Bio-Rad, Hercules, CA, USA). Bio-Rad CFX Manager software was used to calculate the CT of each reaction and the relative amount of specific cDNA in each sample relative to the expression of the hypoxanthine phosphoribosyl transferase-1 gene (HPRT) [19] was determined by the 2−ΔCT method. The primers and templates for mouse CD300lf, Csf2rb and Pim1 were obtained from Bio-Rad (Unique Assay IDs qMmuCID0025336, qMmuCID0027182 and qMmuCID0005530, respectively) following the manufacturer instructions. The results are expressed as the 2−ΔΔCT.
3. Results
3.1. Differential Effect of Btk-, CD5- and CD6-Deficiency on Spleen B220lo B Cells
Spleen B1 cells (CD19+CD11b+) were analysed in CBA/N, Cd5-/- and Cd6-/- mice showing a significant reduction in all of them compared with BL6 (Figure 1A,B). When analysed B220lo cells from Cd5-/- and CBA/N mice, they were found to be diminished, whereas Cd6-/- mice exhibit values comparable to those observed in BL6 (Figure 1C,D). Since B220lo cells are established early after birth in the spleen, we verified whether they were also reduced at day 7 in Cd5-/-mice, obtaining a highly similar result than in the adults (Figure 1D). These B220lo cells were DN (CD21-CD23-) [20], reinforcing our previous results that the B220lo subset does not correspond to conventional spleen B2 cells, but rather localizes within the heterogeneous B cell compartment of CD21-CD23- DN cells that have been implicated in ageing (named ABCs) and in autoimmune pathologies [50]. The analysis of peritoneal B1 cells, defined as CD19+CD23-CD5+/-, confirmed previous data showing strong reduction of CD5+ B1a cells accompanied with an increase of B1b cells (CD5-), therefore producing an imbalance between the two B1 cell subsets in the mouse lines (Figure S1B-S1E). Also, the results found in adult spleen B2 populations (MZB, FoB and DN CD21-CD23- B cells were as previously described [29,36,51].
The B220lo cells from BL6 mice displayed significant amounts of CD5+CD43+ cells while those from Cd5-/- mice were obviously CD5- although maintaining normal CD43 expression levels (Figure 1E). Also, a reduction of CD5 expression was found on Cd6-/- mice, since only around 30 % of B220lo cells were CD5+, nevertheless maintaining their CD43 expression. Therefore, whereas conventional spleen B1 cells were highly diminished in the deficient strains, spleen B220lo cell numbers were maintained in Cd6-/- and highly diminished in Cd5-/- and CBA/N mice, prompting us to analyse possible differences displayed by B220lo cells among B6, Cd5-/- and Cd6-/- mice.
3.2. Genetic Differences between Cells B220lo Versus B220hi in CD5- and CD6-Deficient Mice
To characterize B220lo cells and determine their relationship to conventional B220hi B-cell populations, we purified CD19⁺ cells on the basis of B220 expression and performed post-sorting analyses to assess the purity and quality of the isolated populations (Figure 2A). The diagram summarizes the comparative analysis of protein-coding RNA-seq data (Figure 2B). The analysis of the data for biopic “protein coding” from the RNA-sequencing fold change showed significant differences between B220lo and B220hi subpopulations across the deficient strains and the BL6 sequences (Figure 2C, left and middle), as well as the comparison of B220lo and B220hi cells in each of the three strains (Figure 2C, right). Differential gene expression analyses of B220lo vs. B220hi cells revealed a clearly distinct transcriptional profile among BL6 and the Cd5-/- and Cd6-/- mouse strains (Figure 3A). Substantial transcriptional divergences were observed regarding B220lo cells when comparing Cd5-/- and Cd6-/- vs. BL6 mice, and between Cd5-/- and Cd6-/- among them (Figure 3B). By contrast, the B220hi populations displayed only minimal changes in both upregulated and downregulated genes across all comparisons (Figure 3C). Heatmap analysis further highlighted distinct gene expression patterns between B220lo and B220hi subsets across the three mouse strains (Figure 3D,E,F).
3.5. Transcriptomic Signatures of B220lo Versus B220hi B Cells Reveal Shared and Genotype-Specific Programs Across BL6, Cd5-/- and Cd6-/- Mice
To further investigate the transcriptional differences between B220lo and B220hi cells, volcano plots were generated (Figure 4A–4C), and the top ten upregulated and downregulated protein-coding genes in each comparison were analysed (Figure 4D–4F), with corresponding logF and adjusted P values provided for each gene displayed as bubble plot graphs (Figure 5A-5C and Figure S3-S5, displaying the top 50 modified genes). To validate a subset of the RNA-seq results, Cd300lf, Csf2rb and Pim1 were selected for qPCR analysis in sorted B220lo and B220hi cell populations (Figure 4G-H). Consistent with the transcriptomic data, Cd300lf and Csf2rb genes showed preferential expression in B220lo cells, whereas Pim1 gene did not.
Figure 5.
Bubble plots displaying the top 10 most significantly enriched Gene Ontology Biological Process [GO:BP] terms, ranked by enrichment significance as −log10 (p-value), prioritizing from data displayed in Figure 5 and Figure 6. Grey and light-green bubble sizes correspond to term size (number of genes annotated to the term) and intersection size (number of differentially expressed genes overlapping with the term). (A-C) B220lo vs. B220hi in Cd5-/- mice (A), Cd6-/- mice (B) and BL6 mice (C). (D-E) Comparisons of B220lo across the strains analyzed. Cd6-/- vs. BL6 (D). Cd5-/- vs. Cd6-/- (E). No significant [GO:BP] term were found for the Cd5-/- versus the BL6 wild type mice.
Figure 5.
Bubble plots displaying the top 10 most significantly enriched Gene Ontology Biological Process [GO:BP] terms, ranked by enrichment significance as −log10 (p-value), prioritizing from data displayed in Figure 5 and Figure 6. Grey and light-green bubble sizes correspond to term size (number of genes annotated to the term) and intersection size (number of differentially expressed genes overlapping with the term). (A-C) B220lo vs. B220hi in Cd5-/- mice (A), Cd6-/- mice (B) and BL6 mice (C). (D-E) Comparisons of B220lo across the strains analyzed. Cd6-/- vs. BL6 (D). Cd5-/- vs. Cd6-/- (E). No significant [GO:BP] term were found for the Cd5-/- versus the BL6 wild type mice.
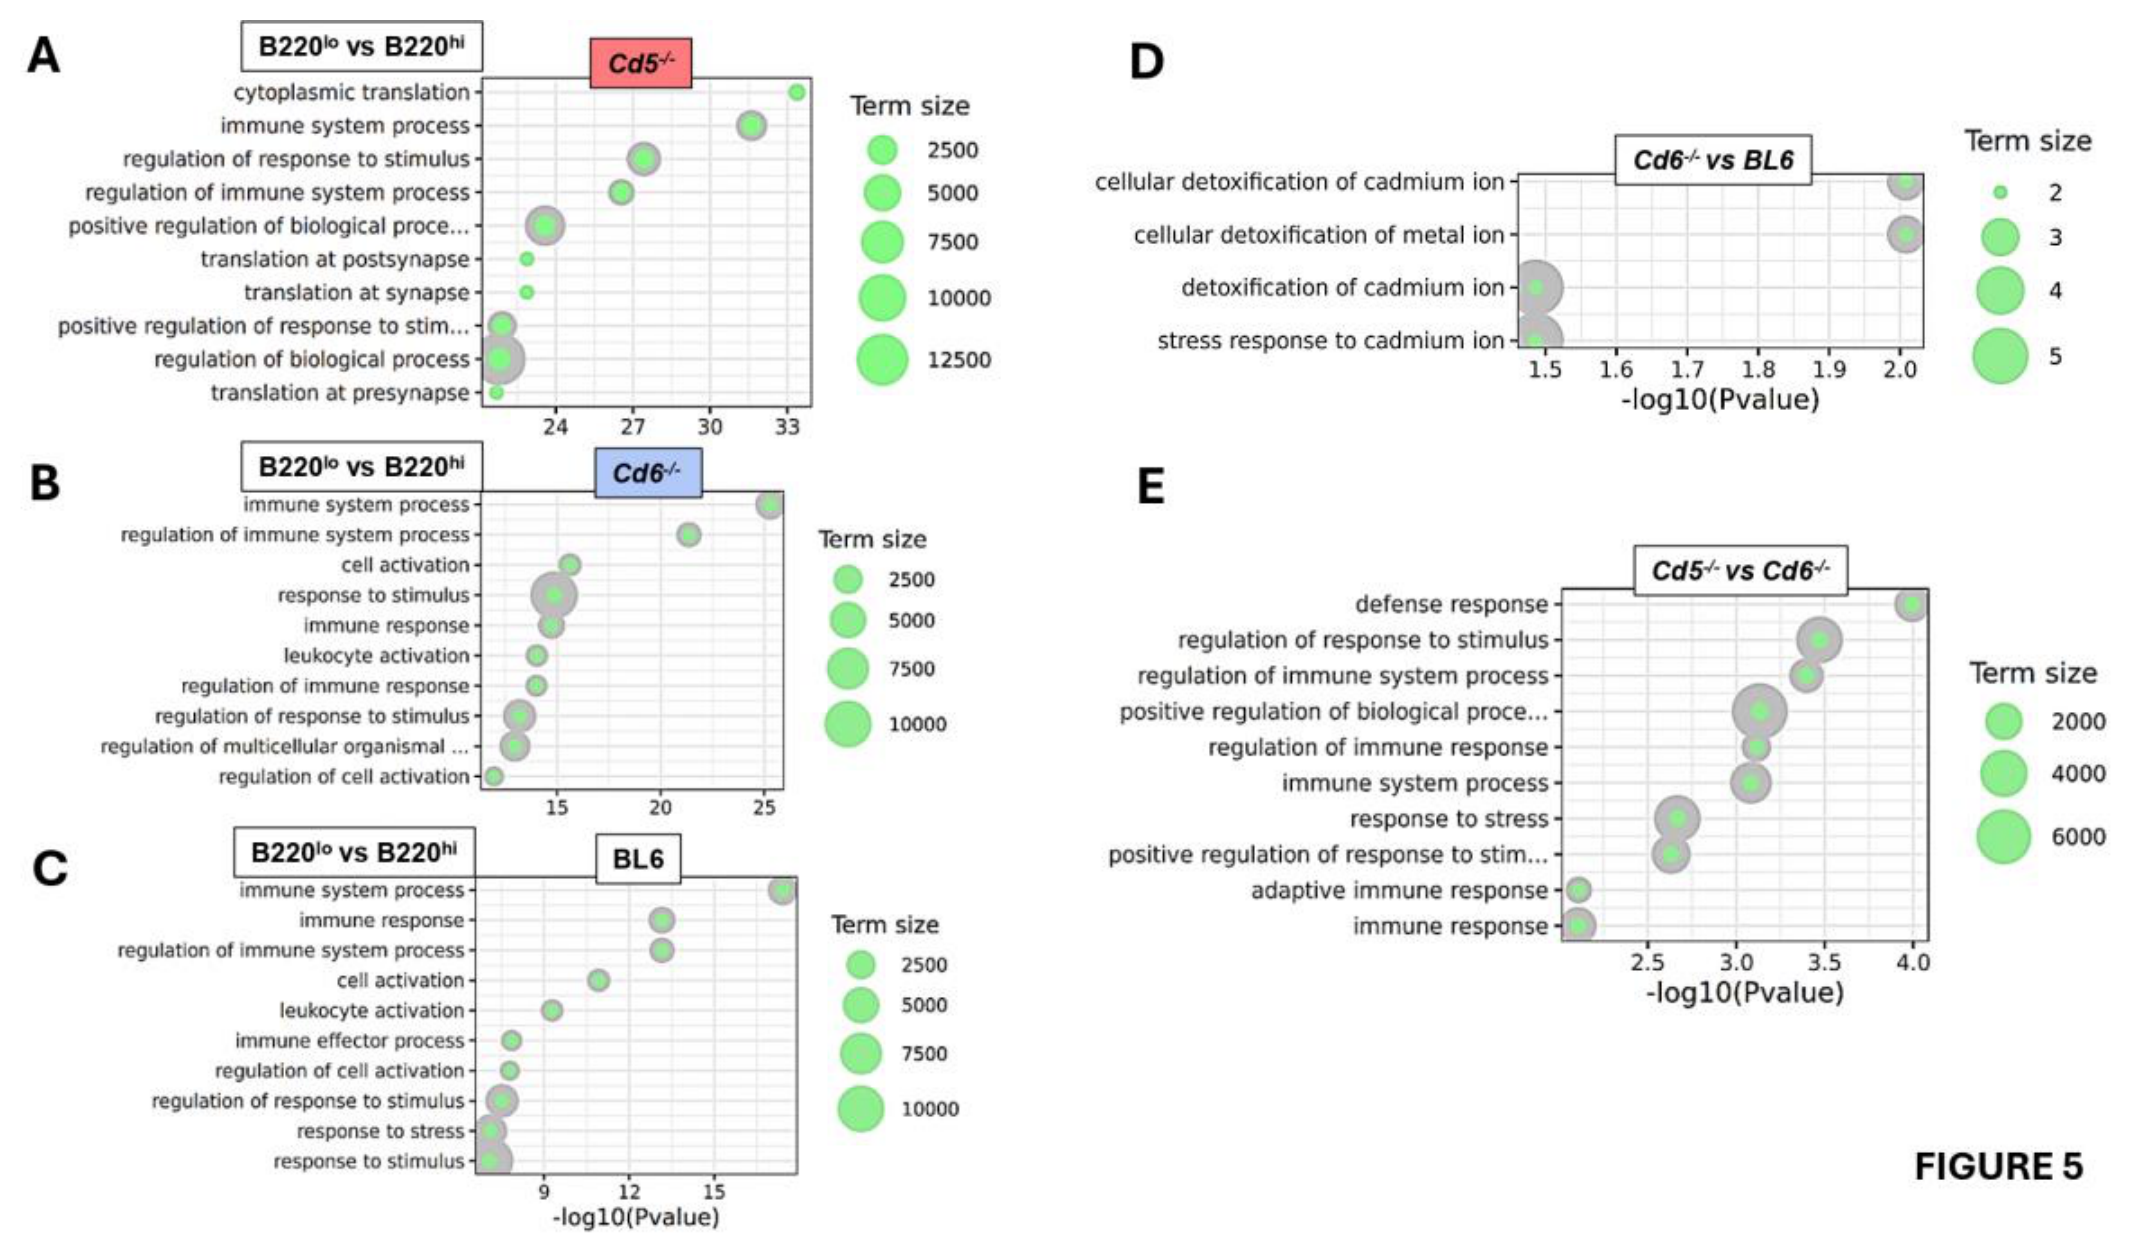
Additionally, to further define the transcriptional identity of B220lo cells, we compared their transcriptomic profiles across BL6, and Cd5-/- and Cd6-/- backgrounds. Differential expression analysis confirmed the existence of a conserved core program in B220lo cells, which was further explored by volcano plot analysis and the top 10 upregulated and downregulated protein-coding genes in each comparison are shown (Figures 6A-6F). The corresponding logFC and adjusted P values are provided for each gene displayed as bubble plot graphs (Figures 5D-5E and Figure S6-S7, displaying the top 50 modified genes). To validate the transcriptomic analyses that showed preferential CD9 expression in B220lo cells, we performed flow cytometry analyses of CD9 expression on spleen B220lo, B220hi and conventional B1 cells across BL6, Cd5-/- and Cd6-/- mice, revealing CD9 expression selectively on B220lo cells, with the highest levels observed in Cd5-/- mice (Figure 6G-H).
3.6. CD5 and CD6 Shape Distinct Signalling Metabolic Axes in B220lo B Cells
Further comparison of top twenty upregulated and downregulated protein-coding genes on B220lo and B220hi B cells across BL6, Cd5-/- and Cd6-/- mice revealed a shared transcriptional program (Figure 7A), characterized by downregulation of pathways linked to canonical B cell identity, including BCR co-receptor signalling and Ras-related signalling, together with genes involved in metabolic circuits. In parallel, all three genotypes showed upregulation of pathways associated with B cell activation, transcriptional regulation, NFAT activation and cellular structure. Overall, these conserved changes indicate that B220lo B cells adopt a common functional state marked by reduced classical B cell signalling and increased features of activation and plasticity. Despite this shared transcriptional core, each genotype displayed a distinct pathway bias, supporting non-redundant roles for CD5 and CD6 in regulating B220lo cell function (Figure 7B). BL6 B220lo cells showed a relatively balanced activation profile, consistent with a physiological transitional state. In contrast, CD5-deficient B220lo cells were skewed toward immune regulatory and signalling pathways, together with stronger suppression of metabolic and co-stimulatory programs, suggesting a more regulatory or innate-like phenotype. By comparison, CD6-deficient B220lo cells exhibited a transcriptional program enriched in differentiation-associated factors and activation markers, consistent with a more strongly activated and transcriptionally reprogrammed state. Together, these findings suggest that although the B220lo state is conserved across genotypes, CD5 mainly restrains immunoregulatory activation, whereas CD6 limits transcriptional reprogramming and differentiation.
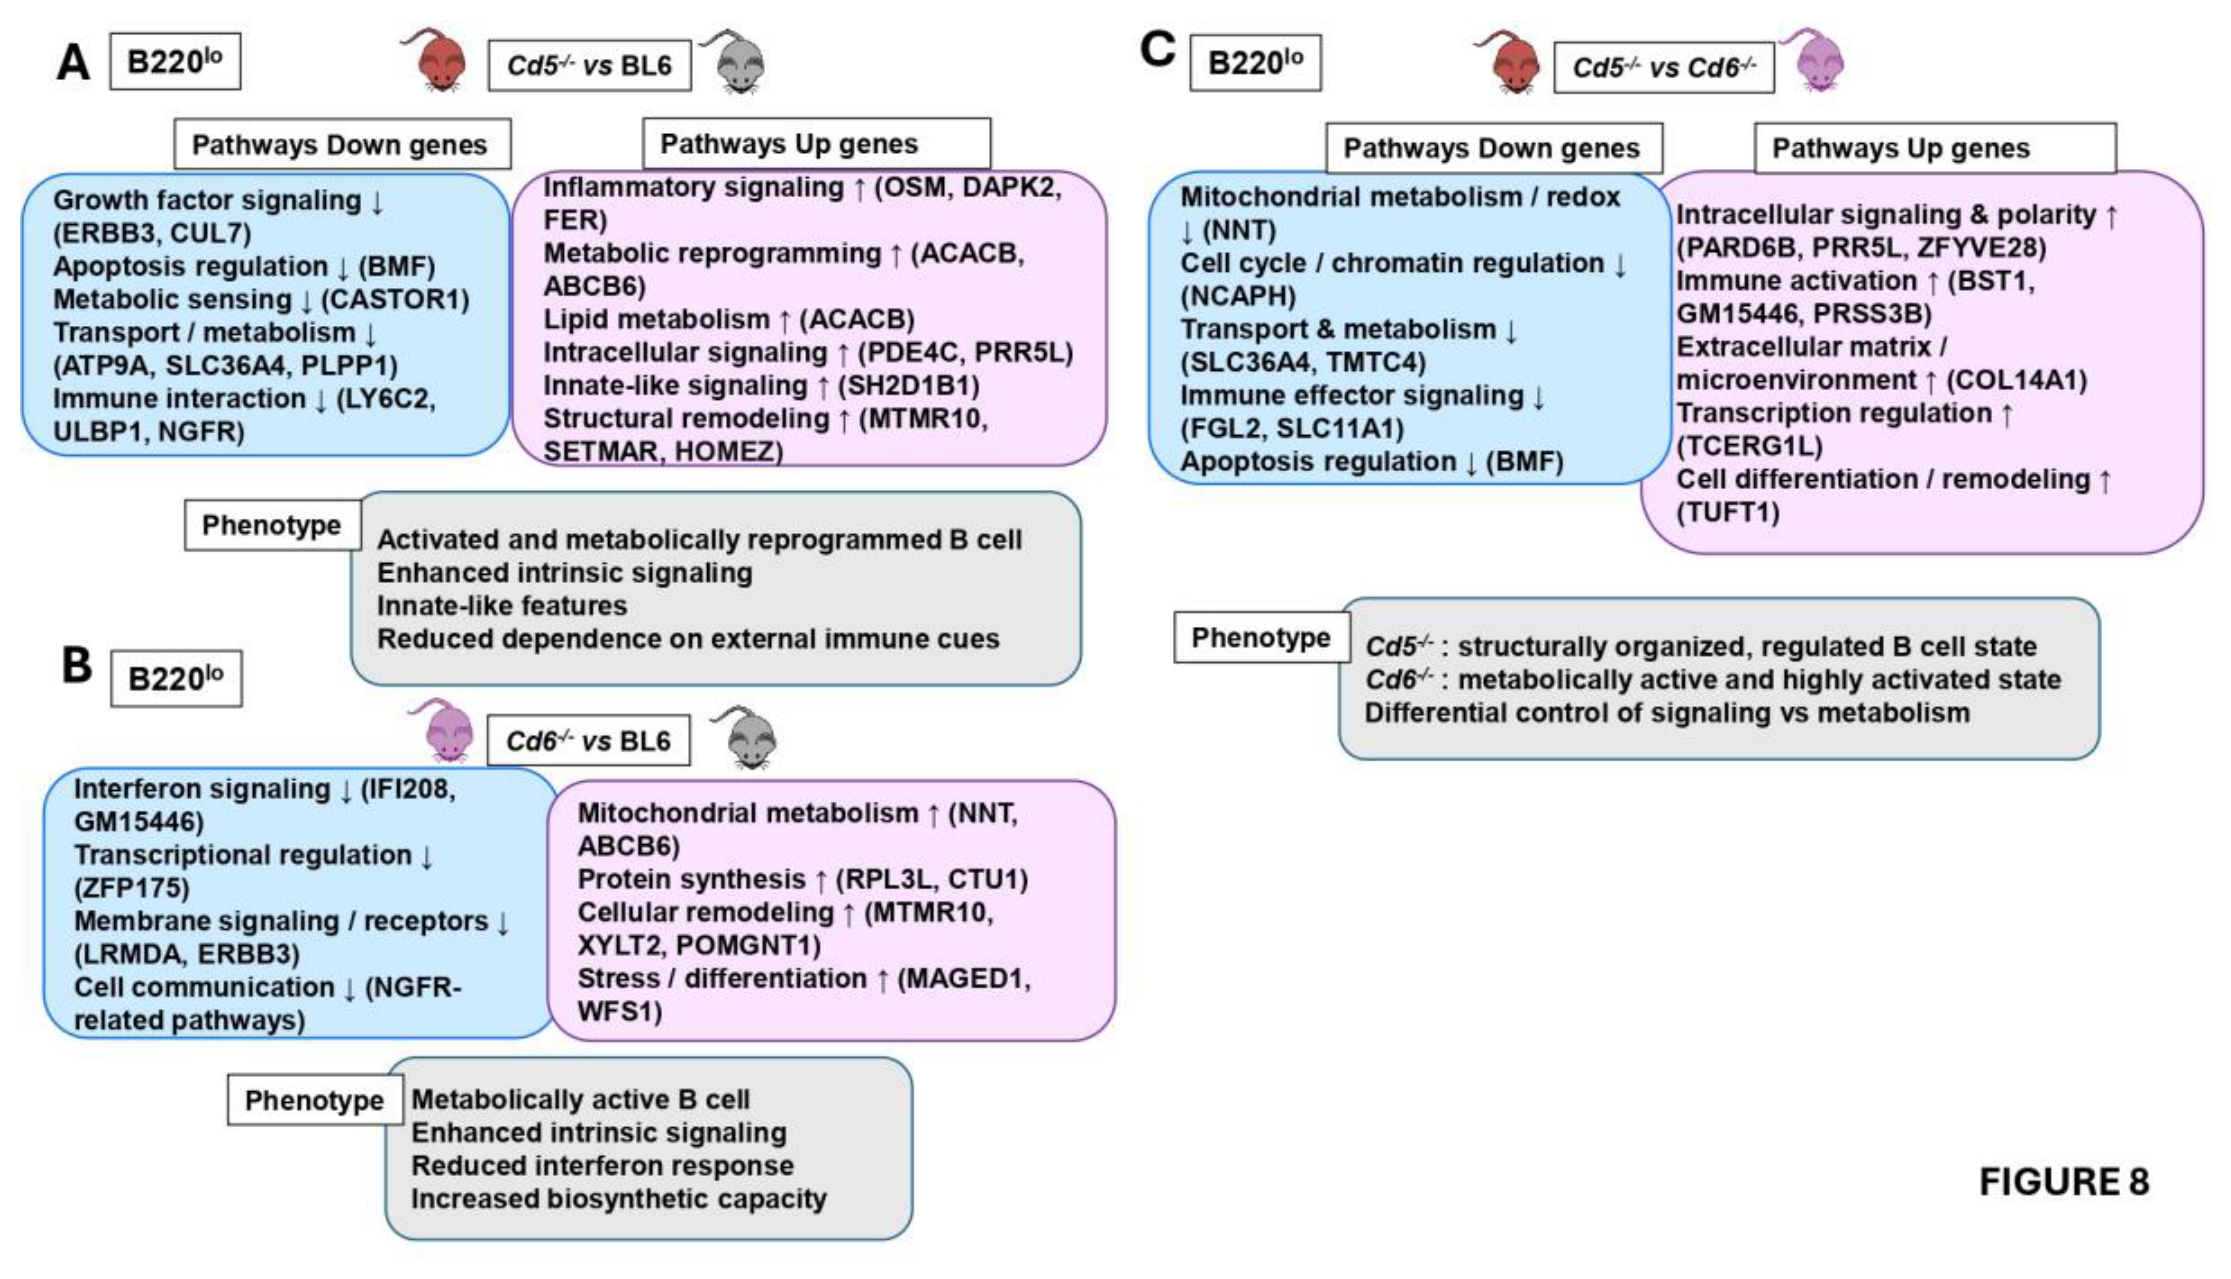
Comparison of top thirty upregulated and downregulated protein-coding genes on Cd5-/- vs. BL6 B220lo cells revealed a shift toward enhanced intrinsic activation and functional remodelling. This state was associated with reduced dependence on extracellular growth and homeostatic cues, together with increased inflammatory signalling, intracellular signal transduction, lipid metabolism, and structural reorganization. Altogether, these changes support the emergence of a more autonomous and functionally adaptable B cell state (Figure 8A). In contrast, Cd6-/- vs. BL6 comparison of top thirty upregulated and downregulated protein- coding genes on B220lo cells showed reduced pathways related to interferon responsiveness, transcriptional control, antigen presentation, and receptor-mediated communication, while pathways linked to mitochondrial metabolism, biosynthetic activity, and cellular remodelling were increased. These findings indicate the development of a metabolically active and highly adaptive B cell state with enhanced intrinsic signalling and diminished reliance on external immune regulation (Figure 8B). Direct comparison of top thirty upregulated and downregulated protein-coding genes between CD5- and CD6-deficient B220lo cells further highlighted their functional divergence (Figure 8C). CD5-deficiency was associated with a more organized and regulated signalling state, whereas CD6-deficiency favoured a highly activated, metabolically reprogrammed, and functionally autonomous phenotype. Together, these results indicate that CD5 and CD6 control distinct but complementary aspects of B220lo B cell biology, with CD5 mainly constraining signalling organization and CD6 limiting metabolic activation and transcriptional reprogramming.
4. Discussion
B lymphocytes are the major cell type involved in the innate and adaptive humoral immune responses. Conventionally, B cells include two main subsets: i) B2 cells, which constituted most B lymphocytes and originate in the adult BM, and ii) B1 cells, which have an embryonic origin and display differential expression of specific surface markers. Among the markers that define the B1 cell population are CD5 and its paralogue CD6, which were originally described in T lymphocytes. CD5 and CD6 are lymphoid specific members of the class I scavenger receptors [52] that bind to both microbial-associated molecular patterns and host counter-receptors (still ill-defined for CD5 and mainly involving CD166/ALCAM for CD6). Upon ligand binding they transduce intracellular signals through phosphorylation-dependent mechanisms that contribute to the fine-tuning of the antigen-specific clonotypic receptor signalling [53,54]. In the context of B1 cells, CD5 functions as a negative regulator of BCR signalling [27,55], and CD5-deficiency impairs the generation of peritoneal B1 cells. The limited available information regarding the role of CD6 signalling in B1 cell physiology shows that confers protection from IgM-induced apoptosis by increasing the bcl-2/bax ratio [56]. Similarly to Cd5-/-, Cd6-/- mice exhibits a partial reduction in total B1 cells accompanied by an increase in the B1b population. Overall, both Cd5-/- and Cd6-/- mice display significant alterations in the distribution of peritoneal B1 cell subpopulations.
In the study by Hardy and Hayakawa [57], it was demonstrated that progenitors derived from foetal liver and adult BM, although phenotypically similar at the pro-B stage, are intrinsically programmed to generate distinct CD5+ (B1) and CD5- (B2) B cell lineages, respectively. Preliminary results (Figure S8) demonstrate that, although no differences were observed in the total number of B cells in BM from Cd5-/- and Cd6-/- mice, a significant increase in frequency of preB and immature B cells was found in Cd5-/- and in Cd6-/- mice that may reflect altered BCR-signalling thresholds during immature B-cell selection or microenvironment-dependent mechanisms linked to CD6-mediated cell-cell interactions. These interesting results require further studies to draw definitive conclusions on this matter.
The role of CD5 and, specially, CD6 in B cell physiology is still ill-well defined [15,58]. The generation of mice deficient in these molecules has opened new fields of research, enabling the analysis of the main functions of these proteins in different cell types. Consistent with our findings, previous studies have shown that under homeostatic conditions, adult Cd5-/- and Cd6-/- mice do not exhibit substantial changes in the percentages or absolute numbers of spleen T- and B-cell compartments [41]. However, within the spleen B-cell compartment, the B1 cell population (CD19+CD11b+) is reduced in both Cd5-/- and Cd6-/- mouse models. In wild-type mice, this population represents approximately 0.5 % of total spleen cells, and about 20 % of CD19+CD11b+ cells express CD5 on their surface, as shown by our results. In Cd5-/- mice, the CD19+CD11b+ population is strongly reduced and obviously all cells are CD5-. In Cd6-/- mice, the CD19+CD11b+ population is also reduced, and only approximately 3-5 % of these cells are CD5+. Therefore, the absence of CD5 or CD6 at the cell membrane alters the spleen B1 cell compartment. Although CD5 expression was used to distinguish between B1a and B1b populations, we acknowledge that this marker alone does not allow their unequivocal identification. Therefore, the assignment of these populations should be interpreted with caution, and additional markers or complementary approaches will be required to confirm their identity in future studies.
Peritoneal B1 cells, which are classically CD11b⁺, represent the most thoroughly characterized subset of B1 cells. However, several studies demonstrated that B1 cells comprise phenotypically and functionally distinct subpopulations that differ according to tissue localization and developmental context. In line with this, we and others previously identified in spleen CD19⁺B220loCD11b⁻ cells that exhibit key features of B1 biology. These cells display spontaneous IgM, IgG and IgA secretion, an intrinsic activated/proliferative state and a predominant early life origin [18,19]. These characteristics distinguish them from conventional B2 cells and align them with an innate-like B-cell program. They diverge from peritoneal B1 cells, not only on by phenotype but also by their cell cycle cascade, ability to secrete IL-10 upon in vitro activation and secretion of IgG and IgA spontaneously and after activation [18]. The present work revealed that CD5-deficiency but not CD6-deciency leads to a marked reduction of the spleen B220lo cell population. CD5+ cells within this compartment being those specifically altered in the deficient models. All these results illustrating the intrinsic complexity and the difficulty of classifying B1 cell types into strictly defined compartments.
Further characterization of the B220lo and B220hi population using CD21 and CD23 markers showed that B220lo cells are mostly CD21-CD23-, and since the samples analysed were in all cases from young adult mice (2-4 month-old) they did not fit as aging cells. By contrast, B220hi cells are predominantly FoB or MZB cells, these cells showing significant differences among the deficient mice (Figure S2E), which may explain why these animals respond differently under pathological conditions [26,36].
The transcriptomic differences observed in B220lo cells should be interpreted primarily as hypothesis-generating, since RNA-seq alone cannot establish functional, metabolic, or signaling states without direct experimental validation. We performed qPCR analyses on selected genes (upregulated Cd300lf and Csf2rf genes and unchanged Pim1 gene) to validate the transcriptomic results. The qPCR validation confirmed the enhanced expression of Cd300lf and Csf2rb in B220lo cells (Figure 4G-4H). As CD300lf regulates lipid sensing and immune-cell activation, whereas CSF2RB mediates signalling through the GM-CSF, IL-3 and IL-5 receptor complexes, their increased expression may indicate a greater ability of B220lo cells to respond to innate and cytokine-mediated signals. In addition, RNA-seq comparisons of B220lo versus B220hi cells from BL6, CD5-deficient, and CD6-deficient mice consistently showed increased CD9 expression in the B220lo subset (and more in CD5- and CD6-deficient mice) (Figure 6G-6H). To validate these findings at the protein level, we performed flow cytometry analyses, which demonstrate that CD9 is highly and selectively expressed in B220lo cells and that its expression is further increased in CD5- and CD6-deficient mice compared with BL6 controls, suggesting that CD9 may help refine the characterization of B220lo population. The fact that genes such as Xylt2, Mtmr10, Homez, and Abcb6 are upregulated in both Cd5-/- and Cd6-/- mice relative to wild-type controls and the reduced expression of Tap1 gene in deficient B220lo may suggest impaired MHC-class I antigen presentation and attenuation of IFN-driven activation. Previous studies demonstrated that CD5 and CD6 deficiency alters IFN-dependent immune responses, particularly those mediated by IFN-γ, mainly through effects on T-cell activation and inflammatory circuits [54,59]. Although CD5 and CD6 are not direct regulators of IFN signalling, their absence may impact IFN-responsive programs in B cells [50,60]. The observed upregulation of Fcrl5 gene in B220lo cells from Cd5-/- and Cd6-/- mice may reflect a compensatory mechanism aimed at preserving regulatory control over BCR signalling in the absence of CD5 or CD6. Fc-receptor like molecules, including FcRL5, represent strong candidates for such compensatory roles [58,61,62,63].
Members of the FCRL family are immunoglobulin superfamily receptors with dual ITIM- or ITAM-like motifs capable of both activating and inhibiting signalling. They are also known to modulate BCR-dependent responses via recruitment of signalling intermediates such as SHP-1 and Src-family kinases [61,62]. FcRL5 is highly expressed in innate-like and MZB cell subsets, which overlap functionally and phenotypically with CD5+ B1 cells, suggesting that these regulatory systems may converge within similar cellular compartments [63]. Additionally, CD6-deficient B220lo cells are characterized by higher expression of pathways associated with mitochondrial metabolism, redox balance, and biosynthetic activity (Nnt, Ncaph, and Slc36A4), along with enhanced immune effector functions (Fgl2, Slc11A1) and reduced apoptotic regulation (Bmf), which may reflect a highly activates metabolic stage, although these interpretations will require dedicated functional assays to determine their biological significance.
In summary, a better understanding of the functional role of CD5 and CD6 in B1-type lymphocytes could be of considerable importance given their potential implications in human disease. Dysregulation of these cells has been strongly linked to pathological conditions, including autoimmune diseases and B cell malignancies such CLL, a CD5+ B cell disorder in which CD6 expression has also been detected and associated with clinical outcomes [64]. Overall, advancing our knowledge in this area may describe new therapeutic strategies in disease driven by B cell dysfunction.
Many questions remain to be clarified regarding the role and biological significance of CD5 and CD6 receptors in B cells. This is a particularly challenging area of study, as B1-type B cell population appear to share certain markers while differing in others depending on their anatomical location or activation state. This study was performed under homeostatic conditions in young adult mice with constitutive CD5, CD6 and CBA/N deficiency, which limits our ability to distinguish B-cell-intrinsic effects from indirect consequences of systemic receptor loss. Future studies using B-cell-specific conditional knockout models will be necessary to define the intrinsic role of CD5 and CD6 in B-cell development and B1-like/B220lo cell function. Moreover, analysing these populations during pneumococcal or viral infection, as well as during aging, will be important to establish their functional relevance in immune protection and long-term B-cell compartment remodelling.
5. Conclusions
The present findings validate our working hypothesis regarding that CD5 and CD6 may differentially regulate tissue-specific B1-related populations and support the notion that CD5 and CD6 are critical regulators of B development and function, showing distinct but complementary effects on innate-like B cell populations. Their absence produces differentiated functional programs of B220lo cells, with CD5 promoting controlled signalling and CD6 limiting excessive activation and metabolic reprogramming. This highlights their essential role in fine-tuning immune response and maintaining immune homeostasis.
Supplementary Materials
The following supporting information can be downloaded at the website of
this paper posted on Preprints.org.
Funding
This study was supported by research funds PID2022-141754OB-100 and PID2022-140932OB-100 from Ministerio de Ciencia e Innovación (MCI), Agencia Estatal de Investigación and Fondo Europeo de Desarrollo Regional Unión Europea (FEDER-UE), 2022 call «Proyectos de Generación de Conocimiento», RTI2018-099114-B-100 from Ministerio de Ciencia, Innovación y Universidades (MCIU, and FEDER-UE) and 2021-SGR-0113 from Agència de Gestió d’Ajuts Universitaris i de Recerca (AGAUR). Institutional support to CNAG was provided by the Spanish Ministry of Science and Innovation through the Instituto de Salud Carlos III, and by the Generalitat de Catalunya through the Department de Salut and the Departament de Recerca i Universitats.
Acknowledgments
J. Pardos and S. González for expert assistance with handling and manipulation of neonatal and adult mice. During the preparation of this manuscript IC and BdA used Microsoft 365 Copilot for the purpose of analysis of RNA sequence obtained, interpretation of data and performed graphics. The authors have reviewed and edited the output and take full responsibility for the content of this publication.
Author Contributions
IC: acquisition, analysis, and interpretation of data and writing original draft; MR and AA: samples acquisition and interpretation of data for phenotype experiments; MA: obtaining and analysing cytometry data and cell sorting; MG: obtained sequences, EC and AE: performed bioinformatics analyses; MV-dA: conceptualization, reviewing and editing; FL: conceptualization, reviewing and editing; BDA and MLG: writing, reviewing and editing, conceptualization, project administration and acquired funding.
Institutional Review Board Statement
The animal study protocol was approved by the Institutional Review Board (or Ethics Committee) of INSTITUTO DE SALUD CARLOS III (PROEX numbers 110/15, 021/18, 282.4/20, 07/24/24).
Informed Consent Statement
Not applicable.
Data Availability Statement
The data presented in this study are openly available in [NCBI Gene Expression Omnibus] at [https://doi.org/10.1007/978-1-4939-3578-9_5], reference number [GSE333916].
Conflicts of Interest
FL is founder and ad honoren scientific advisor of Sepsia Therapeutics SL. The rest of authors declare no conflicts of interest.:
Abbreviations
The following abbreviations are used in this manuscript:
B220lo, CD19+B220loCD11b- splenic B cells; BCR, B cell receptor; BL6, C57BL/6J mice; BM, bone marrow; DN, double negative; FoB, follicular B cells; IFN-γ, interferon gamma; IL10; Interleukin 10; logFC, log2 fold change; MZB, marginal zone B cells; PWC, Peritoneal washed cells; TCR, T cell receptor.
References
- Gómez-Manríquez, J.; Hernández-Bello, J.; Muñoz-Valle, J.F.; Sifuentes-Franco, S.; Graciano-Machuca, O.; Morales-Núñez, J.J. B Cell Development: Transcriptional Regulation and Immunological Mechanisms in Homeostasis. Front. Immunol. 2025, 16. [Google Scholar] [CrossRef]
- Liu, Y.; Zhang, X.; Ji, Q.; Zhang, Y.; Wei, W.; Mo, Z.; Chen, T. Regulatory B Cells: Heterogeneity, Immunosuppressive Networks, and Contributions to Autoimmune Pathogenesis. Front. Immunol. 2026, 17. [Google Scholar] [CrossRef]
- Angappulige, D.H.; Ballard, D.J.; Thomas, C.J.; Xu, S.; Guo, X.; Gandhi, Y.B.; Mishra, S.; de Figueiredo, P.; Song, J. Regulatory B Cells at the Crossroads of Epigenetic Control and Immune Homeostasis. Clin. Rev. Allergy Immunol. 2026, 69, 30. [Google Scholar] [CrossRef]
- Godin, I.E.; Garcia-Porrero, J.A.; Coutinho, A.; Dieterlen-Lièvre, F.; Marcos, M.A.R. Para-Aortic Splanchnopleura from Early Mouse Embryos Contains B1a Cell Progenitors. Nature 1993, 364, 67–70. [Google Scholar] [CrossRef]
- Marcos, M.A.R.; Gaspar, M.L.; Malenchere, E.; Coutinho, A. Isolation of Peritoneal Precursors of B-1 Cells in the Adult Mouse. Eur. J. Immunol. 1994, 24, 1033–1040. [Google Scholar] [CrossRef]
- Montecino-Rodriguez, E.; Dorshkind, K. B-1 B Cell Development in the Fetus and Adult. Immunity 2012, 36, 13–21. [Google Scholar] [CrossRef]
- Baumgarth, N. The Double Life of a B-1 Cell: Self-Reactivity Selects for Protective Effector Functions. Nat. Rev. Immunol. 2011, 11, 34–46. [Google Scholar] [CrossRef]
- Spencer, J.; Dionisi, C. Immature B Cell Homing Shapes Human Lymphoid Tissue Structure and Function. J. Exp. Med. 2024, 221, e20240085. [Google Scholar] [CrossRef]
- Allman, D.; Pillai, S. Peripheral B Cell Subsets. Curr. Opin. Immunol. 2008, 20, 149–157. [Google Scholar] [CrossRef]
- Martin, F.; Kearney, J.F. Marginal-Zone B Cells. Nat. Rev. Immunol. 2002, 2, 323–335. [Google Scholar] [CrossRef]
- Elsner, R.A.; Shlomchik, M.J. Germinal Center and Extrafollicular B Cell Responses in Vaccination, Immunity and Autoimmunity. Immunity 2020, 53, 1136–1150. [Google Scholar] [CrossRef]
- Fooksman, D.R.; Jing, Z.; Park, R. New Insights into the Ontogeny, Diversity, Maturation and Survival of Long-Lived Plasma Cells. Nat. Rev. Immunol. 2024, 24, 461–470. [Google Scholar] [CrossRef]
- Vanhee, S.; Åkerstrand, H.; Kristiansen, T.A.; Datta, S.; Montano, G.; Vergani, S.; Lang, S.; Ungerbäck, J.; Doyle, A.; Olsson, K.; et al. Lin28b Controls a Neonatal to Adult Switch in B Cell Positive Selection. Sci. Immunol. 2019, 4, eaax4453. [Google Scholar] [CrossRef]
- Sindhava, V.; Bondada, S. Multiple Regulatory Mechanisms Control B-1 B Cell Activation. Front. Immunol. 2012, 3. [Google Scholar] [CrossRef]
- Enyindah-Asonye, G.; Li, Y.; Xin, W.; Singer, N.G.; Gupta, N.; Fung, J.; Lin, F. CD6 Receptor Regulates Intestinal Ischemia/Reperfusion-Induced Injury by Modulating Natural IgM-Producing B1a Cell Self-Renewal. J. Biol. Chem. 2017, 292, 661–671. [Google Scholar] [CrossRef]
- Martínez-Gutiérrez, M.I.; Cañedo-Solares, I.; Gómez-Chávez, F.; Molina-López, L.M.; Flores-Rabasa, R.; Magdaleno-Villanueva, J.A.; León-Pedroza, J.I.; Correa, D. Do Human B-1 Lymphocytes Truly Exist? Front. Immunol. 2026, 17. [Google Scholar] [CrossRef]
- Rodriguez-Zhurbenko, N.; Quach, T.D.; Rothstein, T.L.; Hernandez, A.M. Human B-1 Cells Are Important Contributors to the Naturally-Occurring IgM Pool against the Tumor-Associated Ganglioside Neu5GcGM3. Front. Immunol. 2022, 13, 1061651. [Google Scholar] [CrossRef]
- de Andrés, B.; Prado, C.; Palacios, B.; Alía, M.; Jagtap, S.; Serrano, N.; Cortegano, I.; Marcos, M.A.R.; Gaspar, M.L. Dynamics of the Splenic Innate-like CD19+CD45Rlo Cell Population from Adult Mice in Homeostatic and Activated Conditions. J. Immunol. 2012, 189, 2300–2308. [Google Scholar] [CrossRef]
- de Andrés, B.; Cortegano, I.; Serrano, N.; del Rio, B.; Martín, P.; Gonzalo, P.; Marcos, M.A.R.; Gaspar, M.L. A Population of CD19highCD45R−/lowCD21low B Lymphocytes Poised for Spontaneous Secretion of IgG and IgA Antibodies. J. Immunol. 2007, 179, 5326–5334. [Google Scholar] [CrossRef]
- Ruiz-Sánchez, C.; Cortegano, I.; Rodríguez, M.; Sanchez-Tarjuelo, R.; Arrabal, A.; Prado, M.C.; Alia, M.; Jiménez, M.P.; Lopez Molina, V.M.; Monzón, S.; et al. Neonatal CD19+B220lo Cells Sense Microbiota via TLR2/4 Activation Driving Proliferation and Differentiation. Front. Immunol. 2026, 17, 1838044. [Google Scholar] [CrossRef]
- Gimferrer, I.; Farnós, M.; Calvo, M.; Mittelbrunn, M.; Enrich, C.; Sánchez-Madrid, F.; Vives, J.; Lozano, F. The Accessory Molecules CD5 and CD6 Associate on the Membrane of Lymphoid T Cells. J. Biol. Chem. 2003, 278, 8564–8571. [Google Scholar] [CrossRef]
- Hayakawa, K.; Hardy, R.R.; Herzenberg, L.A.; Herzenberg, L.A. Progenitors for Ly-1 B Cells Are Distinct from Progenitors for Other B Cells. J. Exp. Med. 1985, 161, 1554–1568. [Google Scholar] [CrossRef]
- Kamoun, M.; Kadin, M.E.; Martin, P.J.; Nettleton, J.; Hansen, J.A. A Novel Human T Cell Antigen Preferentially Expressed on Mature T Cells and Shared by Both Well and Poorly Differentiated B Cell Leukemias and Lymphomas. J. Immunol. 1981, 127, 987–991. [Google Scholar] [CrossRef]
- Lankester, A.C.; van Schijndel, G.M.W.; Cordell, J.L.; van Noesel, C.J.M.; van Lier, R.A.W. CD5 Is Associated with the Human B Cell Antigen Receptor Complex. Eur. J. Immunol. 1994, 24, 812–816. [Google Scholar] [CrossRef]
- Gary-Gouy, H.; Bruhns, P.; Schmitt, C.; Dalloul, A.; Daëron, M.; Bismuth, G. The Pseudo-Immunoreceptor Tyrosine-Based Activation Motif of CD5 Mediates Its Inhibitory Action on B-Cell Receptor Signaling. J. Biol. Chem. 2000, 275, 548–556. [Google Scholar] [CrossRef]
- Taher, T.E.; Bystrom, J.; Mignen, O.; Pers, J.-O.; Renaudineau, Y.; Mageed, R.A. CD5 and B Lymphocyte Responses: Multifaceted Effects through Multitudes of Pathways and Channels. Cell. Mol. Immunol. 2020, 17, 1201–1203. [Google Scholar] [CrossRef]
- Garaud, S.; Taher, T.E.; Debant, M.; Burgos, M.; Melayah, S.; Berthou, C.; Parikh, K.; Pers, J.-O.; Luque-Paz, D.; Chiocchia, G.; et al. CD5 Expression Promotes IL-10 Production through Activation of the MAPK/Erk Pathway and Upregulation of TRPC1 Channels in B Lymphocytes. Cell. Mol. Immunol. 2018, 15, 158–170. [Google Scholar] [CrossRef]
- Tarakhovsky, A.; Kanner, S.B.; Hombach, J.; Ledbetter, J.A.; Müller, W.; Killeen, N.; Rajewsky, K. A Role for CD5 in TCR-Mediated Signal Transduction and Thymocyte Selection. Science 1995, 269, 535–537. [Google Scholar] [CrossRef]
- Bikah, G.; Carey, J.; Ciallella, J.R.; Tarakhovsky, A.; Bondada, S. CD5-Mediated Negative Regulation of Antigen Receptor-Induced Growth Signals in B-1 B Cells. Science 1996, 274, 1906–1909. [Google Scholar] [CrossRef]
- Gary-Gouy, H.; Harriague, J.; Bismuth, G.; Platzer, C.; Schmitt, C.; Dalloul, A.H. Human CD5 Promotes B-Cell Survival through Stimulation of Autocrine IL-10 Production. Blood 2002, 100, 4537–4543. [Google Scholar] [CrossRef]
- Velasco-de Andrés, M.; Casadó-Llombart, S.; Català, C.; Leyton-Pereira, A.; Lozano, F.; Aranda, F. Soluble CD5 and CD6: Lymphocytic Class I Scavenger Receptors as Immunotherapeutic Agents. Cells 2020, 9, 2589. [Google Scholar] [CrossRef]
- Aragón-Serrano, L.; Carrillo-Serradell, L.; Planells-Romeo, V.; Isamat, M.; Velasco-de Andrés, M.; Lozano, F. CD6 and Its Interacting Partners: Newcomers to the Block of Cancer Immunotherapies. Int. J. Mol. Sci. 2023, 24, 17510. [Google Scholar] [CrossRef]
- Gimferrer, I.; Calvo, M.; Mittelbrunn, M.; Farnós, M.; Sarrias, M.R.; Enrich, C.; Vives, J.; Sánchez-Madrid, F.; Lozano, F. Relevance of CD6-Mediated Interactions in T Cell Activation and Proliferation. J. Immunol. 2004, 173, 2262–2270. [Google Scholar] [CrossRef]
- Hassan, N.J.; Barclay, A.N.; Brown, M.H. Frontline: Optimal T Cell Activation Requires the Engagement of CD6 and CD166. Eur. J. Immunol. 2004, 34, 930–940. [Google Scholar] [CrossRef]
- Zimmerman, A.W.; Joosten, B.; Torensma, R.; Parnes, J.R.; van Leeuwen, F.N.; Figdor, C.G. Long-Term Engagement of CD6 and ALCAM Is Essential for T-Cell Proliferation Induced by Dendritic Cells. Blood 2006, 107, 3212–3220. [Google Scholar] [CrossRef]
- Català, C.; Velasco-de Andrés, M.; Leyton-Pereira, A.; Casadó-Llombart, S.; Sáez Moya, M.; Gutiérrez-Cózar, R.; García-Luna, J.; Consuegra-Fernández, M.; Isamat, M.; Aranda, F.; et al. CD6 Deficiency Impairs Early Immune Response to Bacterial Sepsis. iScience 2022, 25, 105078. [Google Scholar] [CrossRef]
- Enyindah-Asonye, G.M.; Li, Y.; Singer, N.; Gupta, N.; Fung, J.; Lin, F. Distribution of CD6 on B Cells and Its Role in Regulating B1a Cell Self-Renewal. J. Immunol. 2016, 196, 60.15. [Google Scholar] [CrossRef]
- Bowen, M.A.; Patel, D.D.; Li, X.; Modrell, B.; Malacko, A.R.; Wang, W.C.; Marquardt, H.; Neubauer, M.; Pesando, J.M.; Francke, U. Cloning, Mapping, and Characterization of Activated Leukocyte-Cell Adhesion Molecule (ALCAM), a CD6 Ligand. J. Exp. Med. 1995, 181, 2213–2220. [Google Scholar] [CrossRef]
- Chen, Y.; Mei, Y.; Zou, C.; Tan, F.; Hu, H.; Yang, M.; Deng, Y.; Li, Q.; Zhu, G.; Yi, P.; et al. Aberrant Lower CD6 Expression on Peripheral B Cells Associated With Liver/Kidney Injury and Autoantibody Production of Systemic Lupus Erythematosus Patients. Scand. J. Immunol. 2025, 101, e70018. [Google Scholar] [CrossRef]
- Casadó-Llombart, S.; Velasco-de Andrés, M.; Català, C.; Leyton-Pereira, A.; Lozano, F.; Bosch, E. Contribution of Evolutionary Selected Immune Gene Polymorphism to Immune-Related Disorders: The Case of Lymphocyte Scavenger Receptors CD5 and CD6. Int. J. Mol. Sci. 2021, 22, 5315. [Google Scholar] [CrossRef]
- Mori, D.; Grégoire, C.; Voisinne, G.; Celis-Gutierrez, J.; Aussel, R.; Girard, L.; Camus, M.; Marcellin, M.; Argenty, J.; Burlet-Schiltz, O.; et al. The T Cell CD6 Receptor Operates a Multitask Signalosome with Opposite Functions in T Cell Activation. J. Exp. Med. 2020, 218, e20201011. [Google Scholar] [CrossRef]
- Perez-Villar, J.J.; Whitney, G.S.; Bowen, M.A.; Hewgill, D.H.; Aruffo, A.A.; Kanner, S.B. CD5 Negatively Regulates the T-Cell Antigen Receptor Signal Transduction Pathway: Involvement of SH2-Containing Phosphotyrosine Phosphatase SHP-1. Mol. Cell. Biol. 1999, 19, 2903–2912. [Google Scholar] [CrossRef]
- Orta-Mascaró, M.; Consuegra-Fernández, M.; Carreras, E.; Roncagalli, R.; Carreras-Sureda, A.; Alvarez, P.; Girard, L.; Simões, I.; Martínez-Florensa, M.; Aranda, F.; et al. CD6 Modulates Thymocyte Selection and Peripheral T Cell Homeostasis. J. Exp. Med. 2016, 213, 1387–1397. [Google Scholar] [CrossRef]
- Picelli, S.; Faridani, O.R.; Björklund, A.K.; Winberg, G.; Sagasser, S.; Sandberg, R. Full-Length RNA-Seq from Single Cells Using Smart-Seq2. Nat. Protoc. 2014, 9, 171–181. [Google Scholar] [CrossRef]
- Dobin, A.; Davis, C.A.; Schlesinger, F.; Drenkow, J.; Zaleski, C.; Jha, S.; Batut, P.; Chaisson, M.; Gingeras, T.R. STAR: Ultrafast Universal RNA-Seq Aligner. Bioinformatics 2013, 29, 15–21. [Google Scholar] [CrossRef]
- Li, B.; Dewey, C.N. RSEM: Accurate Transcript Quantification from RNA-Seq Data with or without a Reference Genome. BMC Bioinform. 2011, 12, 323. [Google Scholar] [CrossRef]
- Ritchie, M.E.; Phipson, B.; Wu, D.; Hu, Y.; Law, C.W.; Shi, W.; Smyth, G.K. Limma Powers Differential Expression Analyses for RNA-Sequencing and Microarray Studies. Nucleic Acids Res. 2015, 43, e47. [Google Scholar] [CrossRef]
- Law, C.W.; Chen, Y.; Shi, W.; Smyth, G.K. Voom: Precision Weights Unlock Linear Model Analysis Tools for RNA-Seq Read Counts. Genome Biol. 2014, 15, R29. [Google Scholar] [CrossRef]
- Kolberg, L.; Raudvere, U.; Kuzmin, I.; Adler, P.; Vilo, J.; Peterson, H. G:Profiler-Interoperable Web Service for Functional Enrichment Analysis and Gene Identifier Mapping (2023 Update). Nucleic Acids Res. 2023, 51, W207–W212. [Google Scholar] [CrossRef]
- Nishida, M.; Otsuka, K.; Nagao, R.; Matsuzawa, S.; Ushio, A.; Tsunematsu, T.; Aota, K.; Ishimaru, N. Tissue-Specific Expansion of Age-Associated B Cells via IFN-γ and IL-21 Within Salivary Glands in Sjögren Disease. J. Immunol. Res. 2026, 2026, 4221251. [Google Scholar] [CrossRef]
- Scher, I.; Ahmed, A.; Strong, D.M.; Steinberg, A.D.; Paul, W.E. X-Linked B-Lymphocyte Immune Defect in CBA/HN Mice. I. Studies of the Function and Composition of Spleen Cells. J. Exp. Med. 1975, 141, 788–803. [Google Scholar] [CrossRef]
- PrabhuDas, M.R.; Baldwin, C.L.; Bollyky, P.L.; Bowdish, D.M.E.; Drickamer, K.; Febbraio, M.; Herz, J.; Kobzik, L.; Krieger, M.; Loike, J.; et al. A Consensus Definitive Classification of Scavenger Receptors and Their Roles in Health and Disease. J. Immunol. 2017, 198, 3775–3789. [Google Scholar] [CrossRef]
- Gonçalves, C.M.; Henriques, S.N.; Santos, R.F.; Carmo, A.M. CD6, a Rheostat-Type Signalosome That Tunes T Cell Activation. Front. Immunol. 2018, 9. [Google Scholar] [CrossRef]
- Voisinne, G.; Gonzalez de Peredo, A.; Roncagalli, R. CD5, an Undercover Regulator of TCR Signaling. Front. Immunol. 2018, 9. [Google Scholar] [CrossRef]
- Ochi, H.; Watanabe, T. Negative Regulation of B Cell Receptor-Mediated Signaling in B-1 Cells through CD5 and Ly49 Co-Receptors via Lyn Kinase Activity. Int. Immunol. 2000, 12, 1417–1423. [Google Scholar] [CrossRef]
- Osorio, L.M.; De Santiago, A.; Aguilar-Santelises, M.; Mellstedt, H.; Jondal, M. CD6 Ligation Modulates the Bcl-2/Bax Ratio and Protects Chronic Lymphocytic Leukemia B Cells From Apoptosis Induced by Anti-IgM. Blood 1997, 89, 2833–2841. [Google Scholar] [CrossRef]
- Hardy, R.R.; Li, Y.-S.; Hayakawa, K. Distinctive Developmental Origins and Specificities of the CD5+B-Cell Subset. Semin. Immunol. 1996, 8, 37–44. [Google Scholar] [CrossRef]
- Tsubata, T. Inhibitory B Cell Co-Receptors and Autoimmune Diseases. Immunol. Med. 2019, 42, 108–116. [Google Scholar] [CrossRef]
- Carrasco, E.; Escoda-Ferran, C.; Climent, N.; Miró-Julià, C.; Simões, I.T.; Martínez-Florensa, M.; Sarukhan, A.; Carreras, E.; Lozano, F. Human CD6 Down-Modulation Following T-Cell Activation Compromises Lymphocyte Survival and Proliferative Responses. Front. Immunol. 2017, 8. [Google Scholar] [CrossRef]
- Hardy, R.R.; Carmack, C.E.; Shinton, S.A.; Kemp, J.D.; Hayakawa, K. Resolution and Characterization of Pro-B and Pre-pro-B Cell Stages in Normal Mouse Bone Marrow. J. Exp. Med. 1991, 173, 1213–1225. [Google Scholar] [CrossRef]
- Dement-Brown, J.; Newton, C.S.; Ise, T.; Damdinsuren, B.; Nagata, S.; Tolnay, M. Fc Receptor-like 5 Promotes B Cell Proliferation and Drives the Development of Cells Displaying Switched Isotypes. J. Leukoc. Biol. 2012, 91, 59–67. [Google Scholar] [CrossRef]
- Zhu, Z.; Li, R.; Li, H.; Zhou, T.; Davis, R.S. FCRL5 Exerts Binary and Compartment-Specific Influence on Innate-like B-Cell Receptor Signaling. Proc. Natl. Acad. Sci. 2013, 110, E1282–E1290. [Google Scholar] [CrossRef]
- Campbell, J.A.; Davis, R.S.; Lilly, L.M.; Fremont, D.H.; French, A.R.; Carayannopoulos, L.N. Cutting Edge: FcR-Like 5 on Innate B Cells Is Targeted by a Poxvirus MHC Class I-Like Immunoevasin. J. Immunol. 2010, 185, 28–32. [Google Scholar] [CrossRef]
- Carrillo-Serradell, L.; Piñeyroa, J.A.; Bousquets-Muñoz, P.; Planells-Romeo, V.; Aragón-Serrano, L.; Casadó-Llombart, S.; Colomer, D.; Andrés, M.V.; Puente, X.S.; Delgado, J.; et al. CD6 Expression Is an Independent Predictor of Time to First Treatment in Chronic Lymphocytic Leukemia. Haematologica 2026, 111, 196–205. [Google Scholar] [CrossRef]
Figure 1.
Spleen B220lo cells are reduced in CBA/N and Cd5-/- mice. Spleen samples from BL6, CBA/N, Cd5-/- and Cd6-/- mice were stained for CD19, B220, CD11b, CD5, and CD43 and analyzed by flow cytometry. (A) Representative contour plots (upper panel) of CD19 and CD11b stainings of spleens from BL6, CBA/N, Cd5-/- and Cd6-/- mice. The box delimits the CD19+CD11b+ B1 population. The histograms in the lower panel display the signal for CD5 in CD19+CD11b+ cells in the strains analyzed. Isotype control (FMO) signal is displayed by a vertical line. (B) Bar graphs representing the frequency of CD19+CD11b+ cells (left) and of CD19+CD11b+CD5+ cells (right), as the mean ± SEM (n = 3-6). The data were compared with One-way ANOVA with post-hoc Tukey correction: * p < 0.05, ** p < 0.01. (C) Representative contour plots of CD19 vs B220 on gated adult spleen CD19+CD11b- cells. The circles delimit the B220lo and B220hi populations. (D) Bar graphs showing the B220lo population frequency (left) and absolute numbers (middle) in adult spleen, as well as the frequency of spleen CD19+B220lo cells from day 7 neonates (right). Data are the mean ± SEM, n = 6-7 from adult BL6, Cd5-/-, CBA/N and Cd6-/- mice and n = 4-8 from D7 samples. (E) Histograms representative of CD5 (upper) and of CD43 (bottom) expression from B220lo cells (grey filled) and B220hi cells (empty) from BL6, CBA/N, Cd5-/- and Cd6-/- mice. Isotype control (FMO) signal is displayed by a vertical line. The bar graphs show the frequency of B220lo CD5+ cells (top) and of B220loCD43+ (bottom) in adult spleens. Data are the mean ± SEM (n = 4-7). The data were compared with One-way ANOVA with post-hoc Tukey correction: *p < 0.05; ** p < 0.01; *** p < 0.001 **** p < 0.0001. Statistical details are shown in Table S2.
Figure 1.
Spleen B220lo cells are reduced in CBA/N and Cd5-/- mice. Spleen samples from BL6, CBA/N, Cd5-/- and Cd6-/- mice were stained for CD19, B220, CD11b, CD5, and CD43 and analyzed by flow cytometry. (A) Representative contour plots (upper panel) of CD19 and CD11b stainings of spleens from BL6, CBA/N, Cd5-/- and Cd6-/- mice. The box delimits the CD19+CD11b+ B1 population. The histograms in the lower panel display the signal for CD5 in CD19+CD11b+ cells in the strains analyzed. Isotype control (FMO) signal is displayed by a vertical line. (B) Bar graphs representing the frequency of CD19+CD11b+ cells (left) and of CD19+CD11b+CD5+ cells (right), as the mean ± SEM (n = 3-6). The data were compared with One-way ANOVA with post-hoc Tukey correction: * p < 0.05, ** p < 0.01. (C) Representative contour plots of CD19 vs B220 on gated adult spleen CD19+CD11b- cells. The circles delimit the B220lo and B220hi populations. (D) Bar graphs showing the B220lo population frequency (left) and absolute numbers (middle) in adult spleen, as well as the frequency of spleen CD19+B220lo cells from day 7 neonates (right). Data are the mean ± SEM, n = 6-7 from adult BL6, Cd5-/-, CBA/N and Cd6-/- mice and n = 4-8 from D7 samples. (E) Histograms representative of CD5 (upper) and of CD43 (bottom) expression from B220lo cells (grey filled) and B220hi cells (empty) from BL6, CBA/N, Cd5-/- and Cd6-/- mice. Isotype control (FMO) signal is displayed by a vertical line. The bar graphs show the frequency of B220lo CD5+ cells (top) and of B220loCD43+ (bottom) in adult spleens. Data are the mean ± SEM (n = 4-7). The data were compared with One-way ANOVA with post-hoc Tukey correction: *p < 0.05; ** p < 0.01; *** p < 0.001 **** p < 0.0001. Statistical details are shown in Table S2.
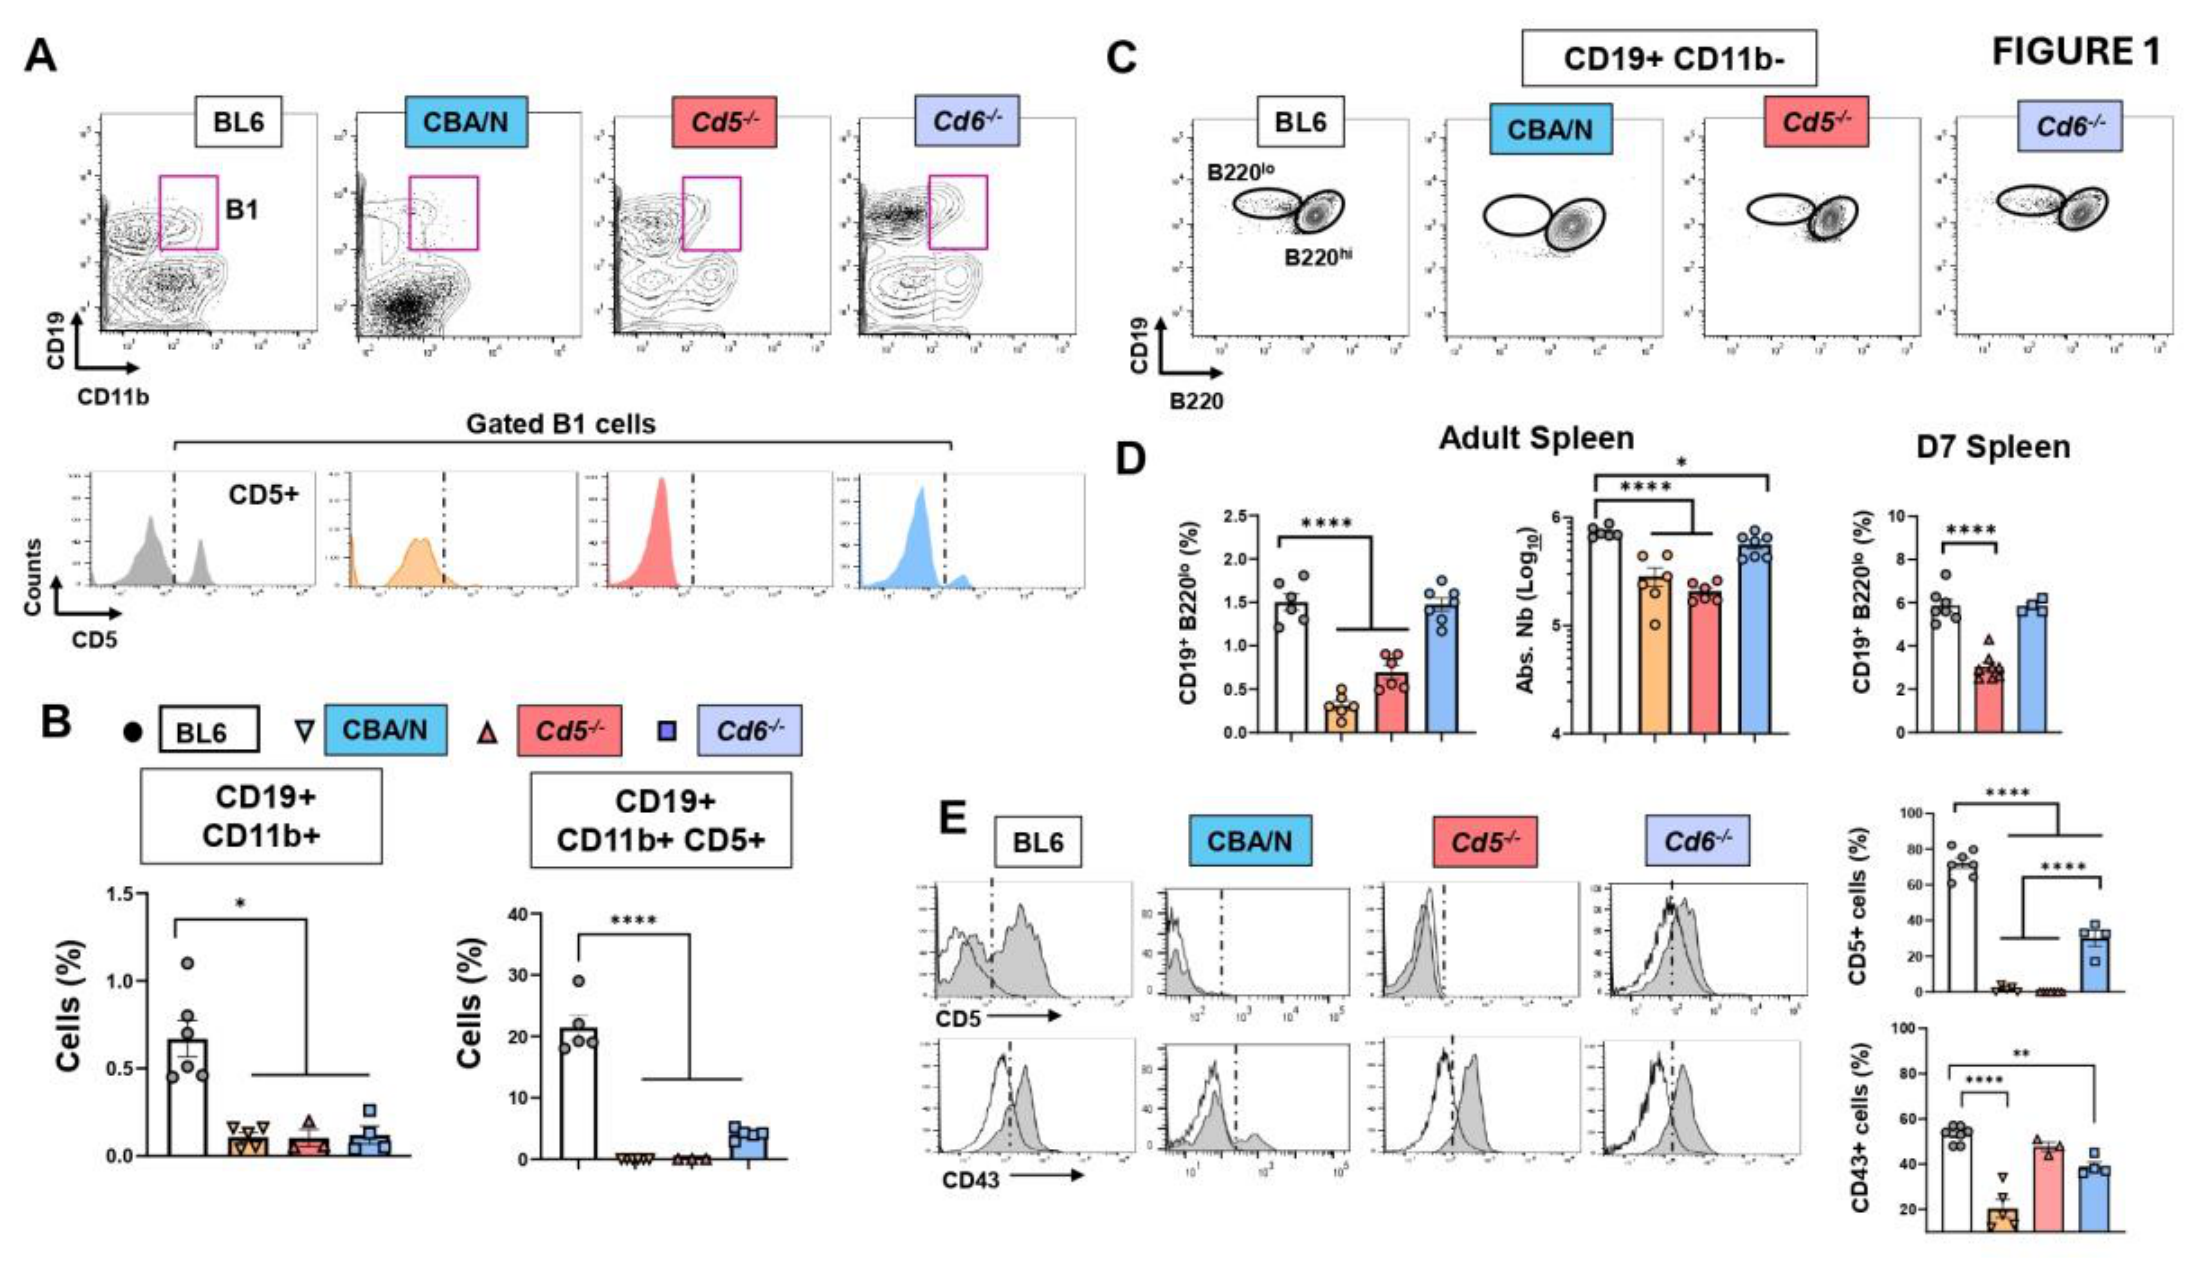
Figure 2.
(A) Representative pre-sort and post-sort flow cytometry dot plots obtained for sample sorting and identification of cell splenic population of interest using CD19 vs B220. (B) Schematic diagram illustrating the comparisons performed using RNA-seq data from different samples. Comparisons of the same population across strains (solid lines); comparisons between different populations within a given strain (dashed line). (C) Violin plots showing the distribution of RNA-sequencing fold change data for biopic “protein coding” across the different comparisons performed. Comparisons are performed with the One-way ANOVA with post-hoc Tukey correction. Significance is * p < 0.05; ** p < 0.01.
Figure 2.
(A) Representative pre-sort and post-sort flow cytometry dot plots obtained for sample sorting and identification of cell splenic population of interest using CD19 vs B220. (B) Schematic diagram illustrating the comparisons performed using RNA-seq data from different samples. Comparisons of the same population across strains (solid lines); comparisons between different populations within a given strain (dashed line). (C) Violin plots showing the distribution of RNA-sequencing fold change data for biopic “protein coding” across the different comparisons performed. Comparisons are performed with the One-way ANOVA with post-hoc Tukey correction. Significance is * p < 0.05; ** p < 0.01.
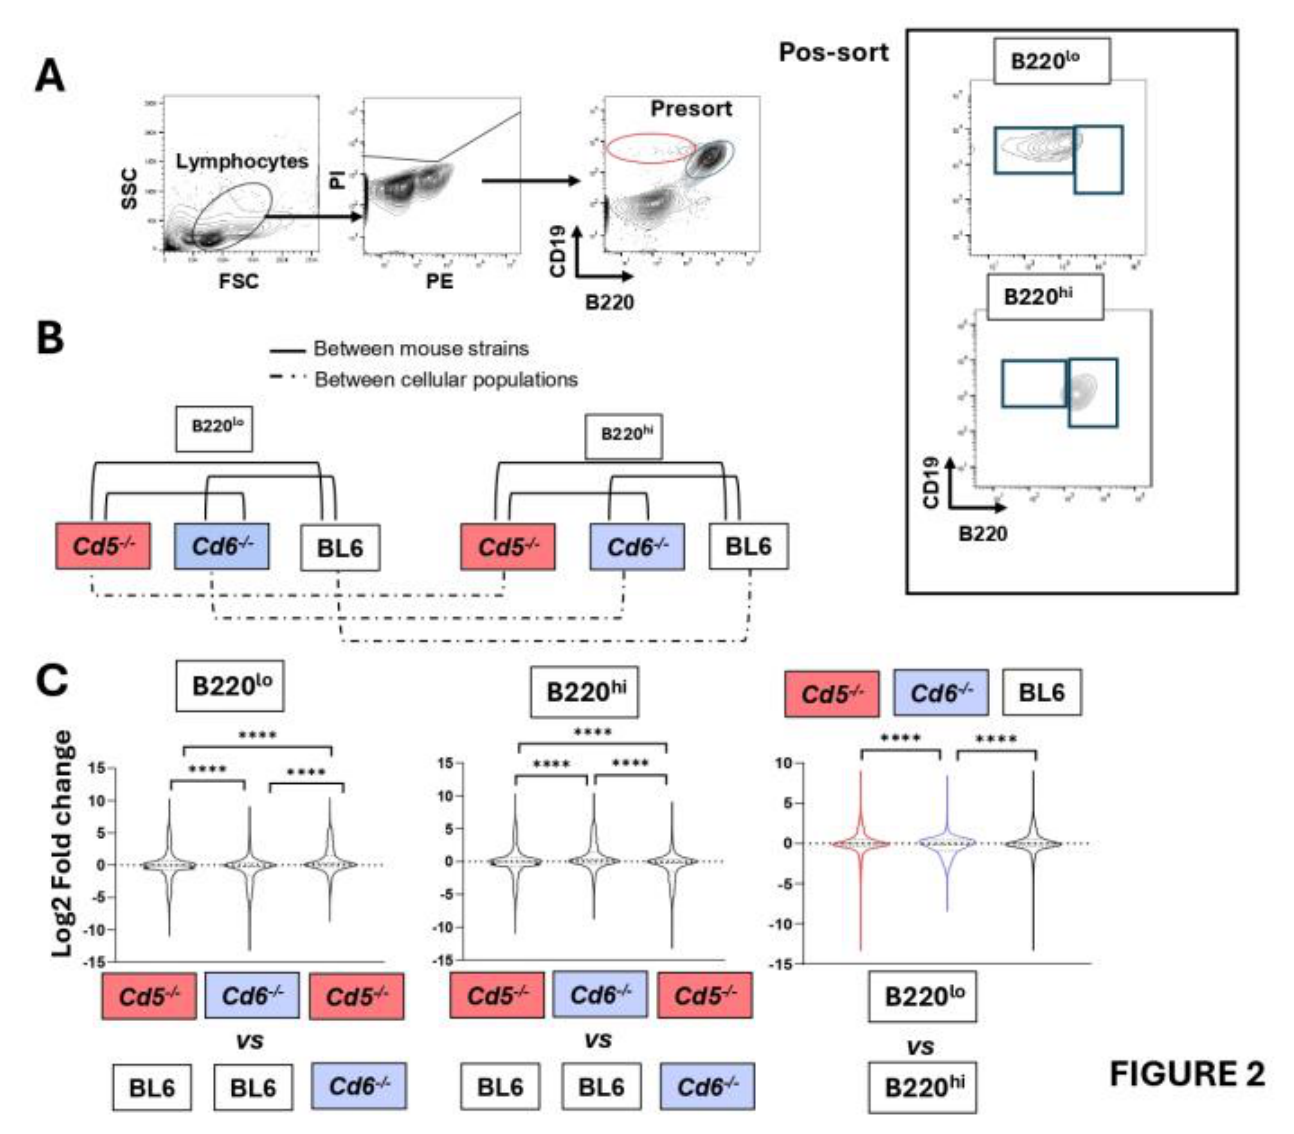
Figure 3.
Transcriptomic characterization of spleen B220lo and B220hi cells in BL6, Cd5-/- and Cd6-/- mice. (A-C) Number of differentially expressed genes identified by RNA-seq analysis. (A) Differences between B220lo and B220hi populations in each strain. (B) Differences of B220lo across the mouse strains. (C) Differences of B220hi populations across strains. The plots in A-C represent the number of genes upregulated (red) or downregulated (blue). Comparisons were performed with the Chi-square test with Fisher exact test. *p < 0.05, **p < 0.01 and ****p < 0.0001. (D) Heatmaps comparing gene expression profiles between B220lo and B220hi populations across BL6, Cd5-/- and Cd6-/- mice. (E) Heatmaps comparing gene expression profiles of B220lo among BL6, Cd5-/- and Cd6-/- mice. (F) Heatmaps comparing gene expression profiles of B220hi among BL6, Cd5-/- and Cd6-/- mice. n=2-3 per group.
Figure 3.
Transcriptomic characterization of spleen B220lo and B220hi cells in BL6, Cd5-/- and Cd6-/- mice. (A-C) Number of differentially expressed genes identified by RNA-seq analysis. (A) Differences between B220lo and B220hi populations in each strain. (B) Differences of B220lo across the mouse strains. (C) Differences of B220hi populations across strains. The plots in A-C represent the number of genes upregulated (red) or downregulated (blue). Comparisons were performed with the Chi-square test with Fisher exact test. *p < 0.05, **p < 0.01 and ****p < 0.0001. (D) Heatmaps comparing gene expression profiles between B220lo and B220hi populations across BL6, Cd5-/- and Cd6-/- mice. (E) Heatmaps comparing gene expression profiles of B220lo among BL6, Cd5-/- and Cd6-/- mice. (F) Heatmaps comparing gene expression profiles of B220hi among BL6, Cd5-/- and Cd6-/- mice. n=2-3 per group.
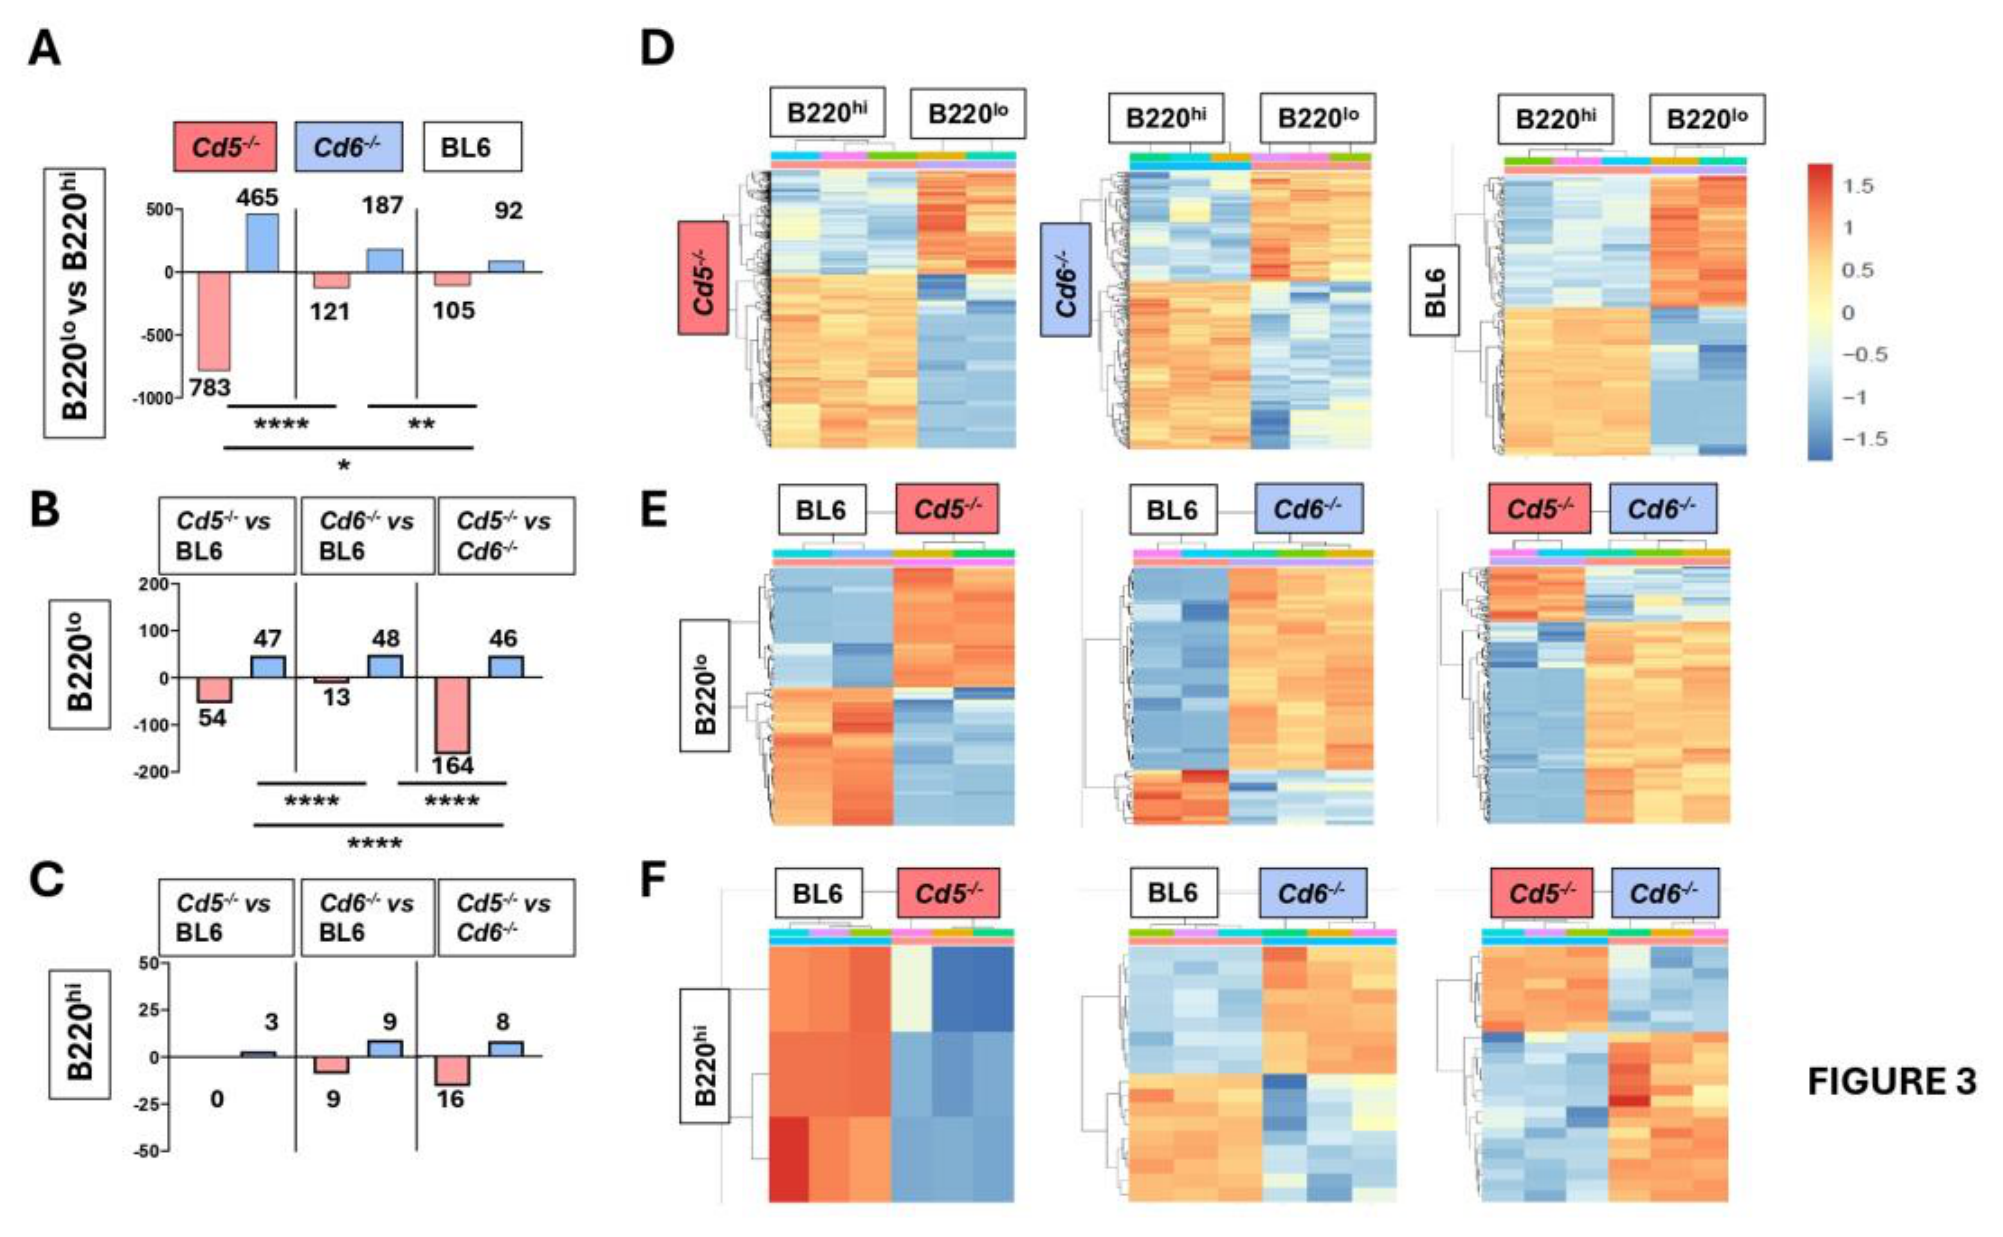
Figure 4.
Differential gene expression in B220lo and B220hi cells. Genes were considered differentially expressed when they showed an absolute log2 fold change ≥ 1 and an adjusted P value (FDR) < 0.05 (A-C) Volcano plots showing differentially expressed genes with biopic “protein-coding” in spleen B220lo vs. B220hi cells on BL6, Cd5-/- and Cd6-/- strains. (D-F) Log fold change histograms showing the top 5 genes up- (red) and down- (blue) regulated genes. (G-H) Validation of CD300lf, Csf2rb and Pim1 transcripts on B220lo and B220hi cells from BL6 mice. (G) RNA seq analysis expressed as log2 fold change; asterisks show the adjusted P value (FDR). (H) qPCR detection on sorted on B220lo and B220hi cells, (n = 5-9). Data were compared by unpaired Student's t test. * p < 0.05, ** p < 0.01.
Figure 4.
Differential gene expression in B220lo and B220hi cells. Genes were considered differentially expressed when they showed an absolute log2 fold change ≥ 1 and an adjusted P value (FDR) < 0.05 (A-C) Volcano plots showing differentially expressed genes with biopic “protein-coding” in spleen B220lo vs. B220hi cells on BL6, Cd5-/- and Cd6-/- strains. (D-F) Log fold change histograms showing the top 5 genes up- (red) and down- (blue) regulated genes. (G-H) Validation of CD300lf, Csf2rb and Pim1 transcripts on B220lo and B220hi cells from BL6 mice. (G) RNA seq analysis expressed as log2 fold change; asterisks show the adjusted P value (FDR). (H) qPCR detection on sorted on B220lo and B220hi cells, (n = 5-9). Data were compared by unpaired Student's t test. * p < 0.05, ** p < 0.01.
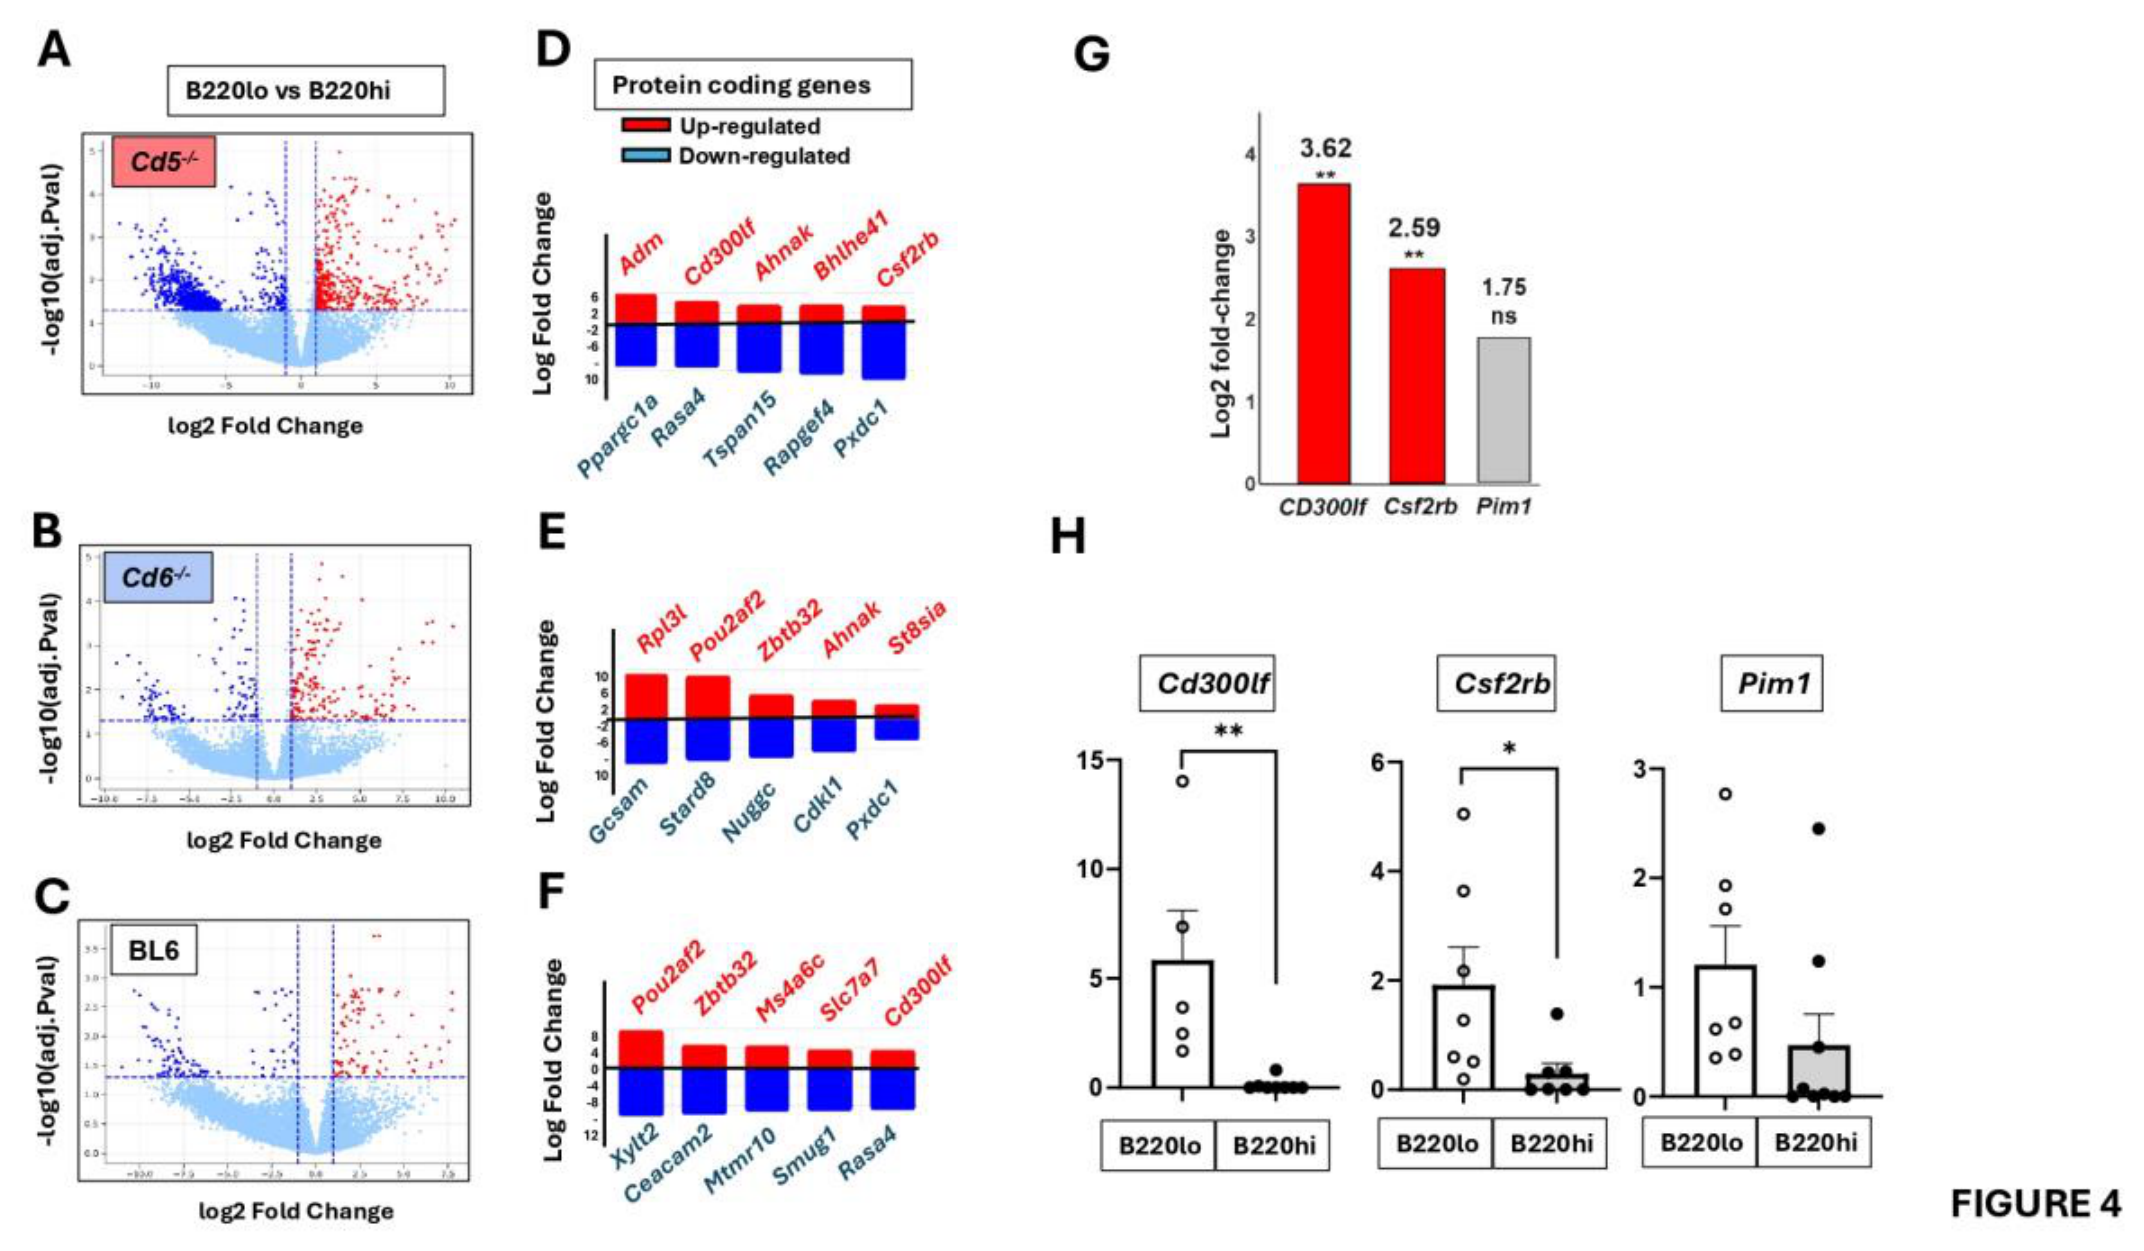
Figure 6.
Differential gene expression and pathway enrichment analysis on B220lo cells in BL6, Cd5-/- and Cd6-/- mice. (A-C) Volcano plots of B220lo cells from Cd5-/- vs BL6 mice (A), B220lo cells from Cd6-/- vs. BL6 mice (B), and Cd5-/- vs. Cd6-/- mice. (D-F) Log fold change histograms showed top 5 genes up- (red) and down- (blue) regulated genes. (G-H) Validation of CD9 expression. (G) RNA seq analysis expressed as log2 fold change; asterisks show the adjusted P value (FDR). (H) Top, representative flow cytometry histograms of CD9 on spleen B220lo, B220hi and B1 cell populations from BL6, Cd5-/- and Cd6-/- mice. Isotype control (FMO) signal is displayed by a vertical line. Bottom, quantification of the frequency of each population (left bar graph). MFI ratio of CD9 expression on B220lo vs. B220hi cells (right bar graph). Data are the mean ± SEM (n = 6) from BL6, Cd5-/- and Cd6-/- mice. Statistical comparisons were made by One-way ANOVA with post-hoc Tukey correction: *p < 0.05; ** p < 0.01; *** p < 0.001 **** p < 0.0001. Statistical details are shown in Table S2.
Figure 6.
Differential gene expression and pathway enrichment analysis on B220lo cells in BL6, Cd5-/- and Cd6-/- mice. (A-C) Volcano plots of B220lo cells from Cd5-/- vs BL6 mice (A), B220lo cells from Cd6-/- vs. BL6 mice (B), and Cd5-/- vs. Cd6-/- mice. (D-F) Log fold change histograms showed top 5 genes up- (red) and down- (blue) regulated genes. (G-H) Validation of CD9 expression. (G) RNA seq analysis expressed as log2 fold change; asterisks show the adjusted P value (FDR). (H) Top, representative flow cytometry histograms of CD9 on spleen B220lo, B220hi and B1 cell populations from BL6, Cd5-/- and Cd6-/- mice. Isotype control (FMO) signal is displayed by a vertical line. Bottom, quantification of the frequency of each population (left bar graph). MFI ratio of CD9 expression on B220lo vs. B220hi cells (right bar graph). Data are the mean ± SEM (n = 6) from BL6, Cd5-/- and Cd6-/- mice. Statistical comparisons were made by One-way ANOVA with post-hoc Tukey correction: *p < 0.05; ** p < 0.01; *** p < 0.001 **** p < 0.0001. Statistical details are shown in Table S2.
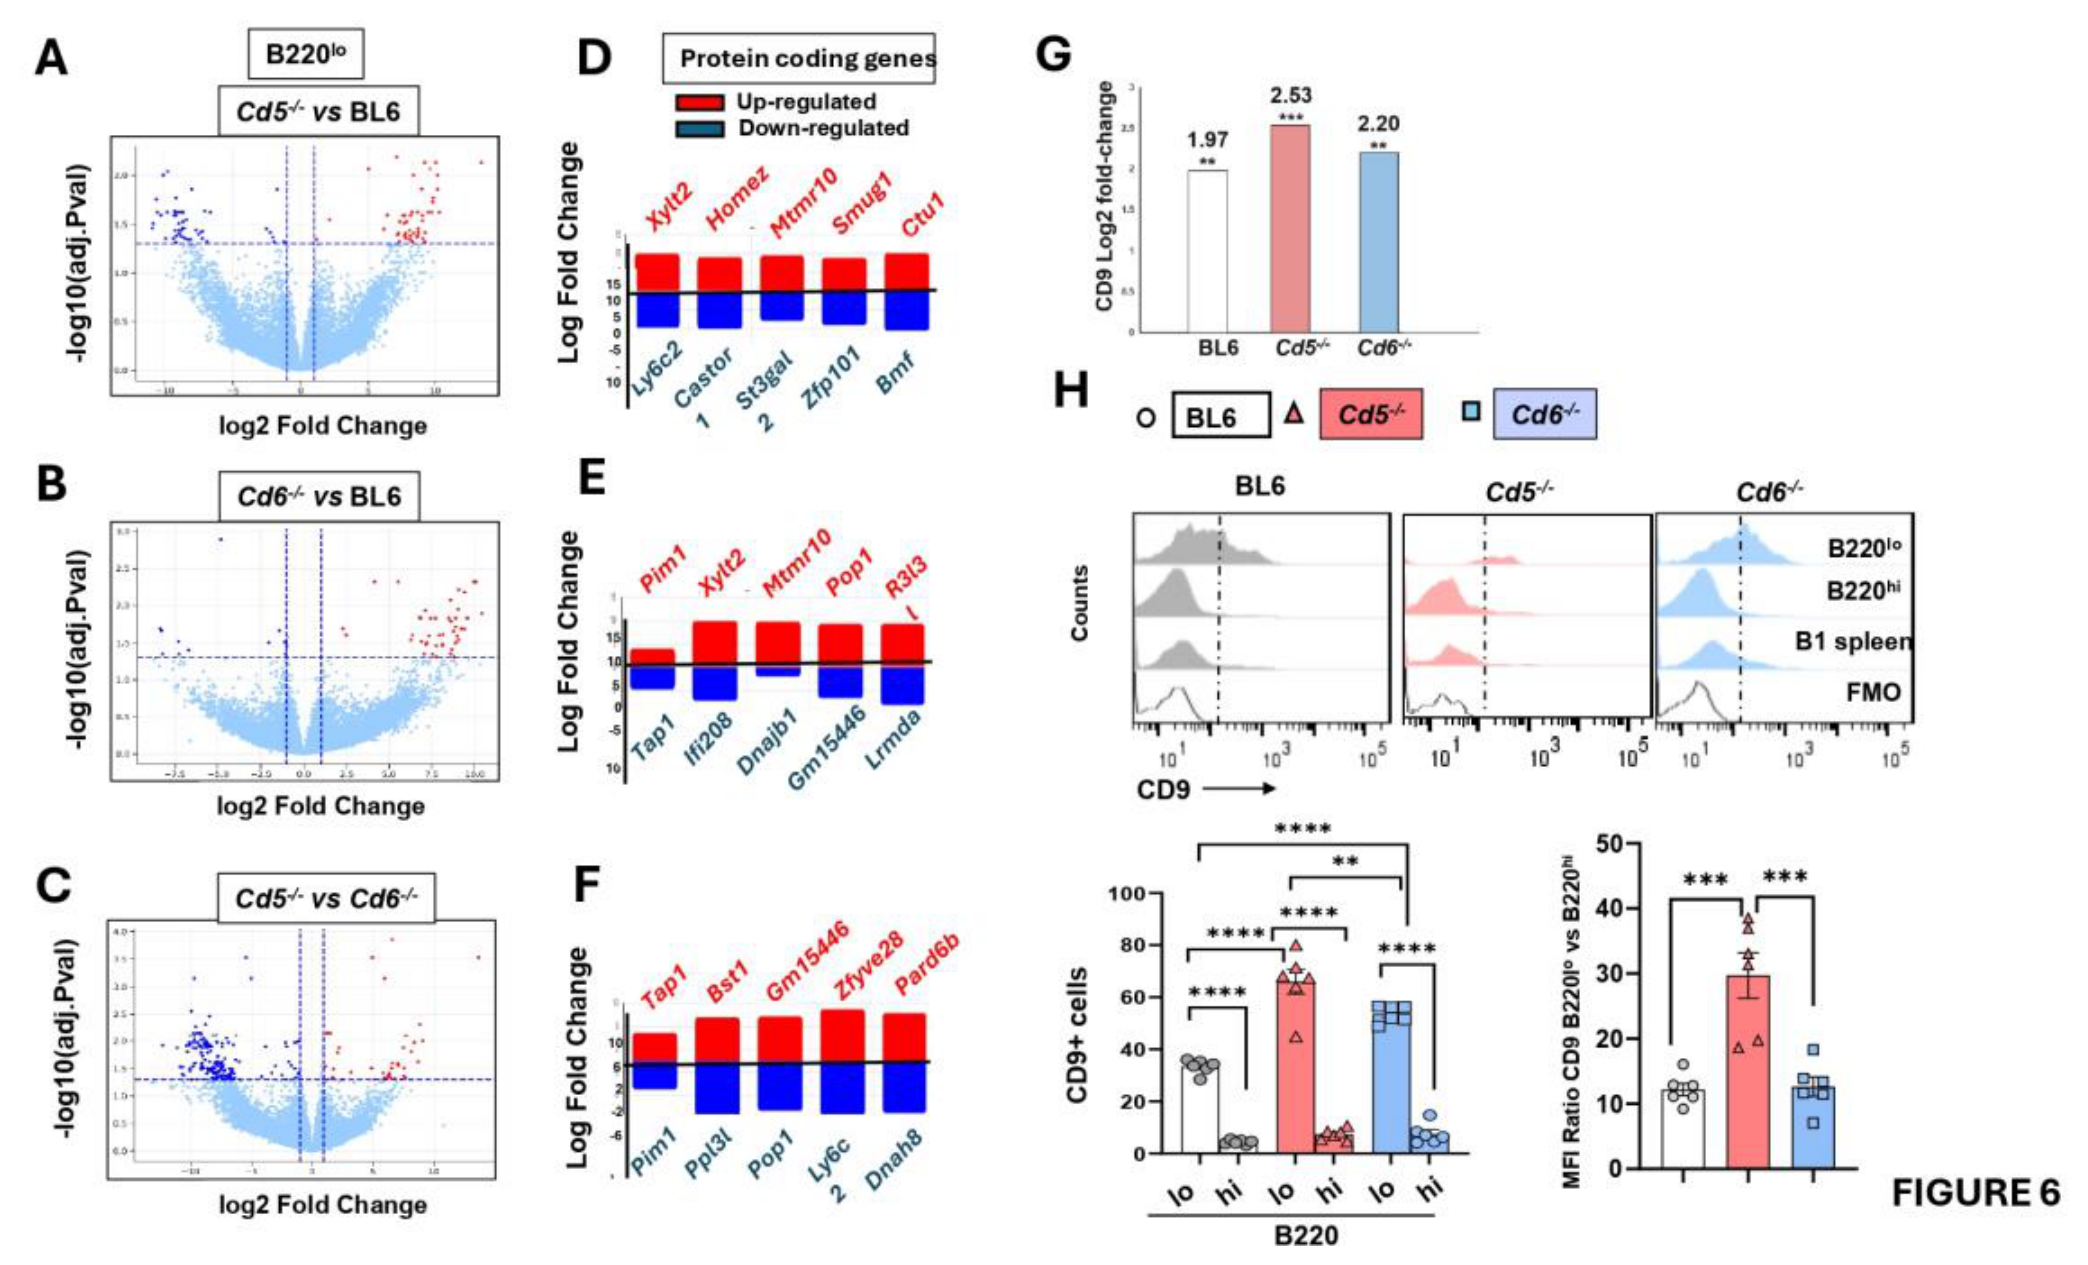
Figure 7.
Integrated scheme of the main differences between B220lo and B220hi transcriptional signatures. RNAseq data of B cells were filtered for protein-coding, using differential expression analysis. To obtain a formal pathway-level interpretation, genes were separated by logFC direction and subjected to an over-representation analysis based on a hypergeometric test with Benjamini-Hochberg correction, using curated pathway families aligned to Reactome-, GO-, and KEGG-like functional categories. Scheme shown in the figure revealed top 20 genes significantly upregulated in B220lo cells (pink) and down-regulated (blue) across BL6, Cd5-/- and Cd6-/- strains. (A) Principal core pathways shared by B220lo cells on the strains analyzed. (B) Divergent pathways found on the comparative between B220lo and B220hi B on each strain.
Figure 7.
Integrated scheme of the main differences between B220lo and B220hi transcriptional signatures. RNAseq data of B cells were filtered for protein-coding, using differential expression analysis. To obtain a formal pathway-level interpretation, genes were separated by logFC direction and subjected to an over-representation analysis based on a hypergeometric test with Benjamini-Hochberg correction, using curated pathway families aligned to Reactome-, GO-, and KEGG-like functional categories. Scheme shown in the figure revealed top 20 genes significantly upregulated in B220lo cells (pink) and down-regulated (blue) across BL6, Cd5-/- and Cd6-/- strains. (A) Principal core pathways shared by B220lo cells on the strains analyzed. (B) Divergent pathways found on the comparative between B220lo and B220hi B on each strain.
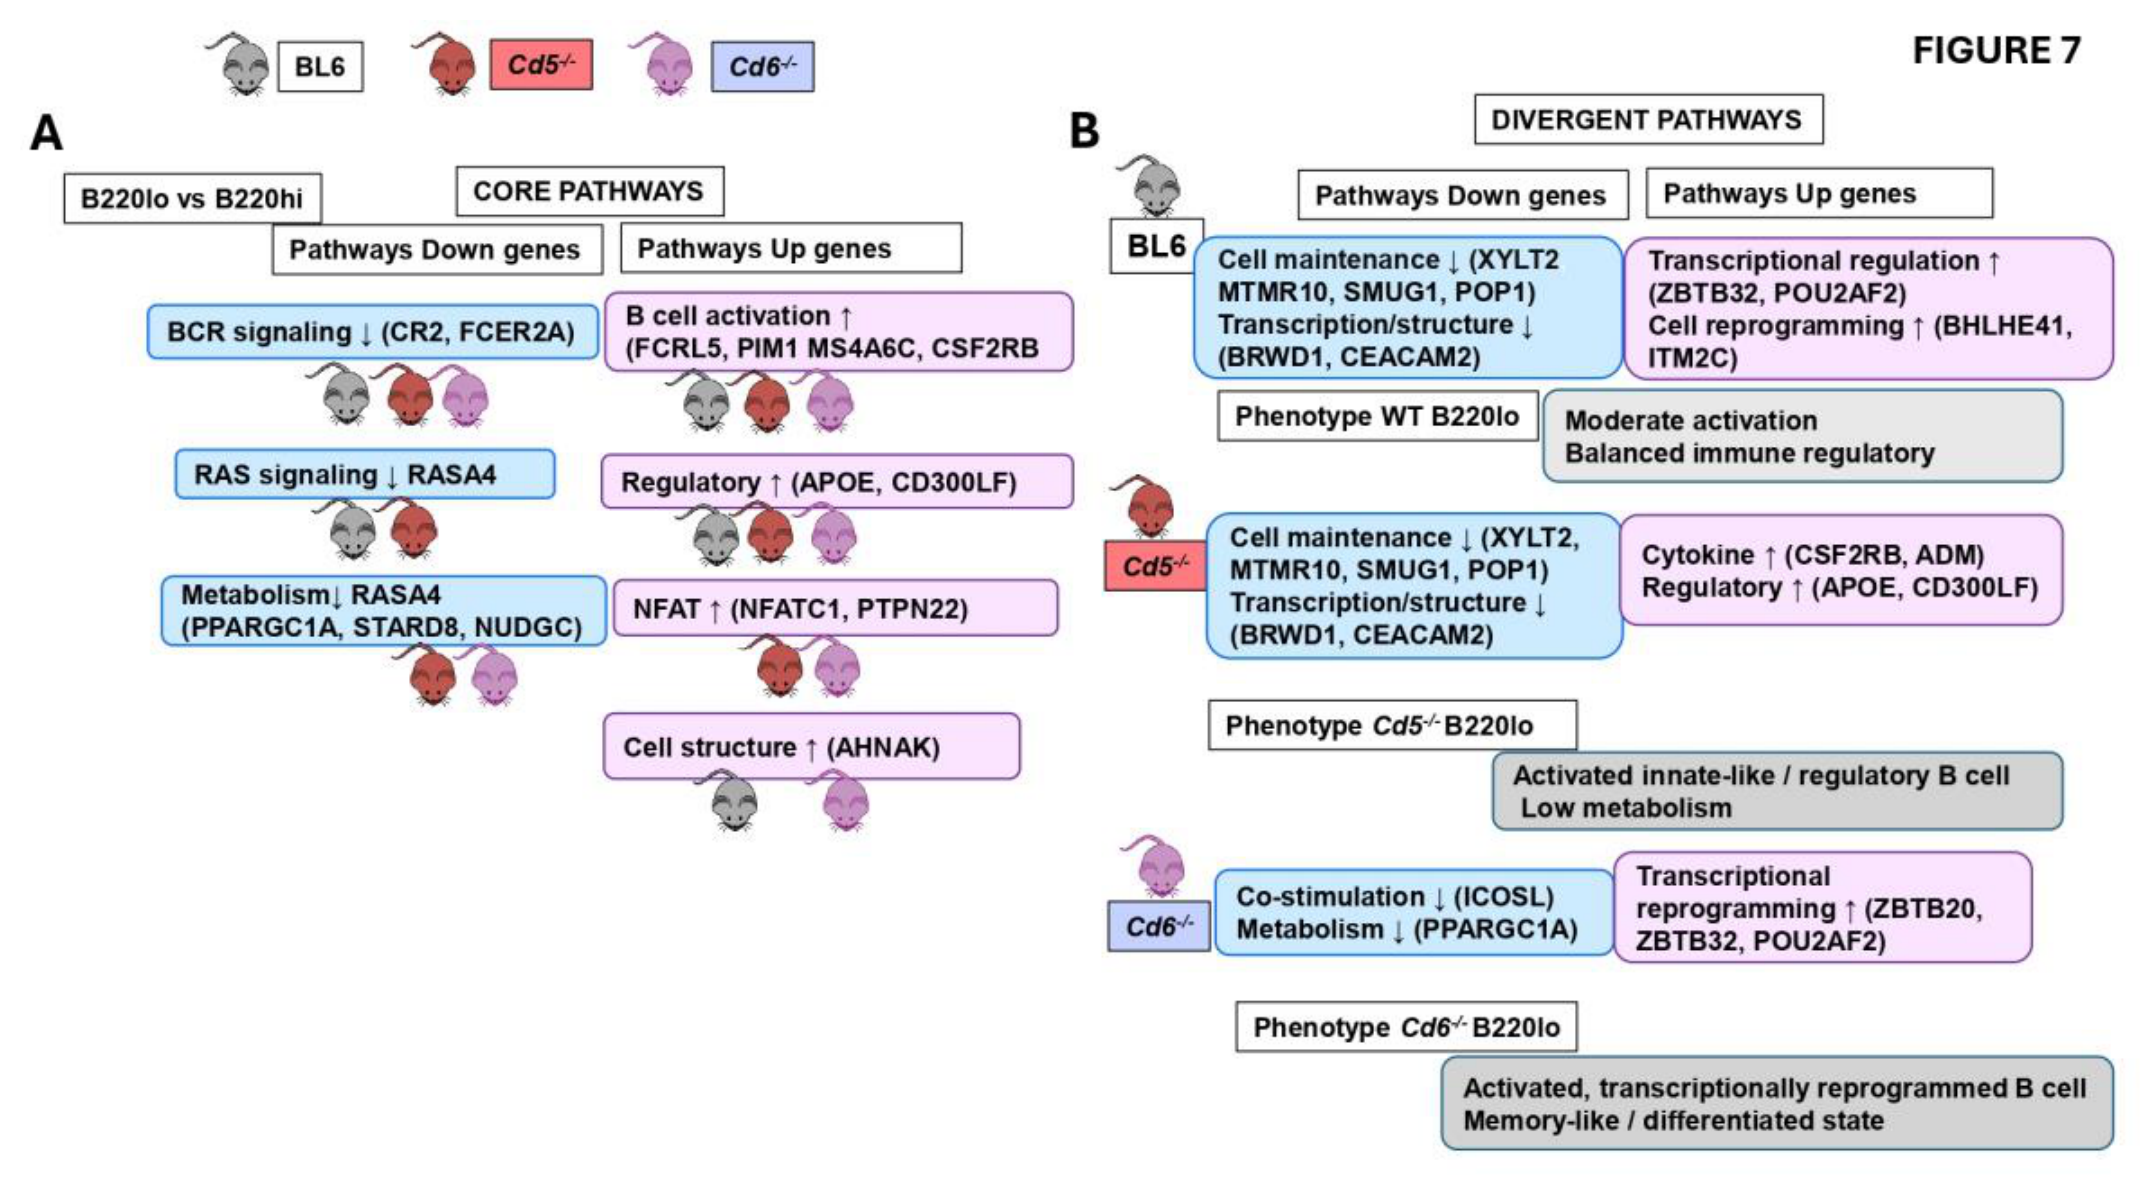
Figure 8.
Integrated scheme of the main differences found between B220lo in BL6, Cd5-/- and Cd6-/- mice. RNAseq data were processed and analyzed as described in Figure 6 using top 30 genes significantly upregulated in B220lo cells (pink) and down-regulated (blue) across BL6, Cd5-/- and CD6-/- strains. (A-C) Principal down-regulated and up-regulated pathways when compared B220lo cells from Cd5-/- vs. BL6 mice (A), Cd6-/- vs. BL6 mice (B) and Cd5-/- vs. Cd6-/- (C) mice.
Figure 8.
Integrated scheme of the main differences found between B220lo in BL6, Cd5-/- and Cd6-/- mice. RNAseq data were processed and analyzed as described in Figure 6 using top 30 genes significantly upregulated in B220lo cells (pink) and down-regulated (blue) across BL6, Cd5-/- and CD6-/- strains. (A-C) Principal down-regulated and up-regulated pathways when compared B220lo cells from Cd5-/- vs. BL6 mice (A), Cd6-/- vs. BL6 mice (B) and Cd5-/- vs. Cd6-/- (C) mice.
Disclaimer/Publisher’s Note: The statements, opinions and data contained in all publications are solely those of the individual author(s) and contributor(s) and not of MDPI and/or the editor(s). MDPI and/or the editor(s) disclaim responsibility for any injury to people or property resulting from any ideas, methods, instructions or products referred to in the content. |
© 2026 by the authors. Licensee MDPI, Basel, Switzerland. This article is an open access article distributed under the terms and conditions of the Creative Commons Attribution (CC BY) license.
Copyright: This open access article is published under a Creative Commons CC BY 4.0 license, which permit the free download, distribution, and reuse, provided that the author and preprint are cited in any reuse.