

Submitted:
13 October 2026
Posted:
15 October 2026
You are already at the latest version
Abstract
Soils in Mediterranean agroecosystems are highly vulnerable to degradation by erosion and increasing climatic variability. In this study, we characterised soil microbial structure and functioning in a long-term Mediterranean olive orchard in southern Spain, examining variation across management zones, seasons and slope positions. Soils from conventionally tilled (CT) and mixed natural cover (MC) interrows, and from herbicide-treated tree-lines (TL), were collected during seasonal sampling campaigns, with the upper and lower parts of each plot sampled separately. Soil physical and chemical properties were analysed together with microbial biomass, extracellular enzyme activities, and bacterial community composition determined by 16S rRNA gene sequencing. Microbial biomass and enzymatic activity varied across seasons and slope positions, with MC soils generally showing higher values than CT and TL, particularly in spring and autumn. Soil organic carbon and pH were important environmental gradients associated with bacterial community composition, although their influence was embedded within broader spatial and temporal variation. Notably, the greater microbial biomass in winter was not accompanied by similarly high potential enzymatic activity, suggesting that microbial community structure and functioning followed distinct seasonal trajectories. Overall, our findings demonstrate that soil microbial structure and functioning in Mediterranean olive orchards are jointly shaped by seasonal, topographic and edaphic gradients. They also highlight the potential of vegetation cover to promote microbial biomass and enzymatic activity when seasonal conditions are favourable.
Keywords:
soil microbiome
; soil drivers
; PLFA
; enzymatic activities
; 16S rRNA sequencing
1. Introduction
Approximately 36.9% of the Earth’s land surface is currently used for agriculture (FAO, 2022). At the same time, an estimated 75 billion tons of fertile soil are lost annually through erosion (UNDRR, 2025). Because soil is effectively a non-renewable resource on human timescales (Stockman et al., 2014), preserving agricultural soils is essential for sustaining crop productivity and food production. This challenge is particularly critical in Mediterranean agroecosystems, where soils are often shallow and poor in soil organic matter (SOM), and are exposed to erosion, salinisation and marked climatic variability. Prolonged droughts followed by intense rainfall events further increase the risk of soil degradation and loss (Merino et al., 2015; Lagacherie et al., 2018; Ferreira et al., 2022).
Soil health is increasingly assessed through microbiome-based indicators, including measures of microbial abundance, such as biomass and necromass; community diversity and composition; and microbial activity, such as respiration and extracellular enzyme activity (Hartman & Six, 2023; Semenov et al., 2025). Although general patterns in microbial community structure are difficult to define across contrasting soil types (Schloter et al., 2018), soil microbiomes are highly responsive to land-use change (Mishra et al., 2023; Zhang et al., 2024), seasonality (Naidoo et al., 2022; Joos et al., 2025), and site-specific edaphic conditions (Thomson et al., 2015; Ramírez et al., 2020; Guo et al., 2022). In turn, microbial communities regulate nutrient cycling and may also influence soil aggregation, erosion resistance and water availability (Leifheit et al., 2014; Sadeghi et al., 2020). However, the contribution of microbiome structure and activity to overall soil health remains insufficiently understood (Philippot et al., 2024).
In olive orchards, contrasting management zones can create distinct microbial habitats. For example, maintaining vegetation cover can improve soil structure, reduce erosion and modify physical, chemical and biological properties related to soil quality, with consequences for microbial biomass and functional activity (Arias-Giraldo et al., 2021; Morugán-Coronado et al., 2022). Similarly, organic amendments can enhance nutrient availability and increase microbial biomass and diversity in the olive rhizosphere (Wentzien et al., 2023).
These management effects, nonetheless, may be strongly modulated by seasonality and local topography. Microbial biomass, activity and diversity can vary substantially over time (Madegwa & Uchida, 2021; Guo et al., 2022), and some studies suggest that seasonal dynamics may outweigh management effects in shaping soil microbial communities (Naidoo et al., 2022; Joos et al., 2025). Seasonal changes in soil moisture and other abiotic factors can also alter nutrient availability and the relative influence of edaphic drivers such as pH (Thomson et al., 2015; Guo et al., 2022). Likewise, slope position can generate pronounced spatial heterogeneity in topsoil properties and microbial communities, even within the same soil type and under similar management (Liu et al., 2020; Lux et al., 2022; Castellano-Hinojosa et al., 2023).
With this in mind, the present study aimed to characterise how soil microbial community structure and functioning varied across management zones, slope positions and seasons within a long-term Mediterranean olive orchard. Specifically, we examined spatial and seasonal variation in microbial biomass, extracellular enzymatic activities and bacterial community composition across conventionally tilled interrows (CT), mixed natural cover interrows (MC) and herbicide-treated tree lines (TL). Microbial biomass and bacterial communities were assessed using phospholipid fatty acid (PLFA) analysis and 16S rRNA gene sequencing, respectively. We also assessed differences in soil physical and chemical properties and microbial indicators between upper and lower slope positions, and whether these topographic patterns varied among management zones. Finally, we evaluated how relationships among soil properties, microbial biomass, enzymatic activity, and bacterial community composition changed across seasons.
2. Material and Methods
2.1. Study Site, Management and Soil Sampling Design
Soil samples were collected from a long-term experimental olive orchard located at the Santa Marta site in Benacazón, Seville, Southwestern Spain (37˚ 20’ 33.6’’ N, 6˚ 13’ 44’’ W). The area has a typical Mediterranean climate, with mild winters and hot, dry summers, during which drought is common. The orchard has been managed as an experimental field since 2002 and is located on an 11% slope, with olive tree rows arranged parallel to the main downslope direction.
Three management zones were considered: conventionally tilled inter-rows (CT), mixed natural-cover inter-rows (MC), and herbicide-treated tree lines (TL). In CT inter-rows, tillage is performed applying a chain plough at variable depth, generally reaching approximately 20-30 cm, with slightly shallower tillage during summer. The timing of tillage depends on vegetation growth, although it is commonly carried out twice per year. In MC inter-rows, spontaneous vegetation cover is maintained, and pruning residues from olive trees are added during winter. In tree lines, vegetation is controlled by the application of a herbicide mixture including glyphosate, synthetic auxins and rapeseed oil twice per year, usually in mid-winter and after summer.
The soil is classified as a Petrocalcic Palexeralf (Soil Survey Staff, 1999) and is characterised by the presence of carbonates and a low SOM content (Gómez et al., 2018). Bulk density (BD) was determined using the core method with a volumetric cylinder and calculated from the dry mass of oven-dried soil. BD values were 1.24 ± 0.00 g cm⁻³ for CT plots, 1.10 ± 0.01 g cm⁻³ for MC plots, and 1.26 ± 0.04 g cm⁻³ for TL plots. Soil texture was determined by the analytical service of IRNAS-CSIC using the hydrometer method following particle-size dispersion with sodium hexametaphosphate. Air temperature and precipitation were recorded by a weather station located at the experimental site, while soil moisture was monitored using TEROS-10 sensors (Meter Group, Inc., USA) installed in each plot. The main environmental characteristics of the study site during the experimental period are summarised in Figure 1 and Table 1.
Four sampling campaigns were conducted between autumn 2022 and summer 2023. Before sampling, surface vegetation was removed and topsoil was collected from the first 20 cm. Sampling was stratified by slope position, with samples taken from both the upper and lower parts of each management zone. For the CT and MC treatments, two plots per treatment were sampled, with four replicates collected at each slope position within each plot during each campaign. This resulted in 16 samples per treatment and campaign (2 plots × 2 slope positions × 4 replicates). For the TL treatment, soils of four tree lines were taken, with two replicates collected at each slope position within each tree line during each campaign, also resulting in 16 samples per campaign (4 tree lines × 2 slope positions × 2 replicates). Thus, 48 samples were obtained during each campaign, equally distributed among the three management treatments and between the two slope positions. Across the four seasonal campaigns, a total of 192 soil samples were collected.
After sampling, the soils were placed in zip-lock bags, immediately stored in a cooled container, transported to the laboratory within the same day, stored at -20 °C, and subsequently freeze-dried prior to analysis.
2.2. Analysis of the Chemical Parameters
Soil pH was measured in a soil-water suspension prepared by mixing 2 g of dry soil with 10 mL of deionized water. After allowing the solid phase to settle for 30 min, the pH was determined using a Crison Basic 20 pH meter (Crison, Barcelone, Spain). Electrical conductivity (EC) was subsequently measured in the filtered supernatant using a Crison Basic 30+ conductivity meter (Crison, Barcelone, Spain).
Freeze-dried soil samples were milled, and total carbon (TC), total soil organic carbon (SOC) and total nitrogen (TN) were determined by dry combustion in pure oxygen at 1200 ˚C using a PrimacsSNC100 analyser (Dumas, 1831). SOM content was estimated from SOC using the Waksman’ coefficient.
Total macro- (P, K, S, Ca and Mg) and micro-nutrient (Fe, Cu, B, Mn, Zn, Ni) and additional elements and metals (Na, Al, Ba, Li, Sr, As, Cd, Co, Cr, Hg, Pb, and V), were determined after aqua regia digestion by inductively coupled plasma-optical emission spectroscopy (ICP-OES; Varian 720-ES; Varian Inc., Palo Alto, CA, USA).
2.3. Phospho-Lipid Fatty Acid Analysis (PLFA)
Soil lipids were extracted from lyophilized soil samples using a single-phase chloroform-methanol-phosphate buffer extraction system. Phospholipids were separated from neutral lipids and glycolipids by silicic acid column chromatography and subsequently converted to fatty acid methyl esters (FAMEs) following Buyer and Sasser (2012). The procedure included lipid extraction, lipid fractionation, alkaline methanolysis, and preparation of FAMEs for gas chromatographic analysis.
FAMEs were analysed by chromatography using an Agilent 7890A GC System (Agilent Technologies, Wilmington, DE, USA) equipped with a 25-m Ultra 2 (5%-phenyl)-methylpolysiloxane column (J&W Scientifc, Folsom, CA, USA) and a flame ionisation detector. FAMES were identified and quantified with the PLFAD1 method in Sherlock software version 6.3 from (MIDI, Inc., Newark, DE, USA). The internal standard 19:0 phosphatidylcholine (Avanti Polar Lipids, Alabaster, AL, USA) was used for FAME quantification.
Total microbial biomass was estimated from the sum of all individual PLFAs and are expressed as nanomol of PLFAs g-1 of dry soil. Specific PLFAs served as biomarkers for broad taxonomic microbial groups, including eukaryote, Gram-negative and Gram-positive bacteria (hereafter GN and GP, respectively), saprophytic fungi and arbuscular mycorrhizal fungi (AM Fungi) (Frostegård & Bååth, 1996).
2.4. Extracellular Enzyme Activity Assays
Seven extracellular enzyme activities involved in C, N and P cycling were measured following the fluorometric protocol described by Bell et al. (2013). Briefly, 2.5 g of freeze-dried soil was homogenized in TRIS buffer, adjusted to the pH of each soil sample, using a blender. After 1 min of mixing, 800 µL of the soil slurry were dispensed into 96-well deep-well plates containing 250 µL of the corresponding fluorogenic substrates or standard.
The assayed enzymes included those involved in C cycling: β-glucosidase (BG), cellobiohydrolase (CB), xylosidase (XYL), and α-glucosidase (AG); N cycling: N-acetylglucosaminidase (NAG) and leucine aminopeptidase (LAP); and P cycling: phosphatase (PHOS). The corresponding substrates were 4-methylumbelliferyl β-D-glucopyranoside, 4-methylumbelliferyl β-D-cellobioside, 4-methylumbelliferyl β-D-xylopyranoside, 4-methylumbelliferyl α-D-glucopyranoside, 4-methylumbelliferyl N-acetyl-β-D-glucosaminide, L-leucine-7-amido-4-methylcoumarin hydrochloride, and 4-methylumbelliferyl phosphate, respectively. All enzymatic substrates were added at a final concentration of 200 µM.
Standard curves were prepared with 4-methylumbelliferone (MUB) and 7-amino-4-methylcoumarin (MUC) at 1 mM. MUB served as the fluorophore standard for all enzymes except LAP, for which MUC was used.
After a 4 h incubation, plates were centrifuged, and supernatants were transferred to black microplates. Fluorescence was measured at 365 nm excitation and 450 nm emission using a Fluoroskan Ascent microplate fluorometer (Thermo Scientific, Waltham, MA, USA). Enzyme activities were expressed as nmol g⁻¹ dry soil h⁻¹.
2.5. 16S rRNA Gene Amplicon Sequencing
Metagenomic DNA was extracted from lyophilized samples using the DNeasy Power-soil Kit (Qiagen, Valencia, CA, USA) following the manufacturer’s instructions. DNA extracts were submitted to a commercial sequencing provider (IBiS, Seville, Spain) for paired-end Illumina sequencing of the bacterial 16S rRNA gene. The target region (V3-V4) was amplified using the forward primer 341F (5’-CCTACGGGNGGCWGCAG-3’) and the reverse primer 785R (5’-GACTACHVGGGTATCTAATCC-3’).
Raw sequence data were processed applying the nf-core/ampliseq pipeline version 2.13.0 (Straub et al., 2020), part of the nf-core collection of workflows (Ewels et al., 2020). Primer sequences were removed with Cutadapt, and reads lacking primer sequences were discarded. Quality-filtered reads were processed with DADA2 (Callahan et al., 2016) to remove PhiX contamination, trim and filter reads, correct sequencing errors, merge paired-end reads, and remove chimeric sequences, resulting in the inference of amplicon sequence variants (ASVs).
Taxonomic assignment was performed according to the SILVA 138.2 prokaryotic SSU reference database (Quast et al., 2013).
2.6. Data Analysis
To assess variation in the studied response variables, linear mixed-effects models (LMMs) or generalized linear mixed models (GLMMs) were fitted according to the distribution of each response variable. Management, sampling season, slope position, and all interactions among these factors were included as fixed effects. Because multiple soil samples were collected within the same field units, individual samples were treated as subsamples rather than independent management replicates. Therefore, the sampled plot or tree line was included as a random intercept to account for spatial clustering within the two CT plots, two MC plots and four TL lines. Given the limited number of independent management units, higher-order interactions were interpreted cautiously and retained only when supported by model diagnostics and clear ecological relevance. Model assumptions were evaluated using simulated residual distributions implemented in the DHARMa package (Hartig, 2026), including tests for residual uniformity, outliers, and over- or underdispersion. For Gaussian LMMs, these diagnostics were complemented by conventional residual plots using the performance package (Lüdecke et al., 2021) to asses residual normality and homogeneity of variance. Type III analyses of variance (ANOVA) were applied to the fitted models using the car package (Fox & Weisberg, 2019). When significant fixed effects or interactions were detected, estimated marginal means and post hoc contrasts were obtained using the emmeans package (Lenth, 2025).
Bacterial alpha diversity was quantified using the Shannon diversity index, whereas beta diversity was assessed using Bray-Curtis dissimilarities. Differences in bacterial community composition among management zones, seasons and slope positions were tested by permutational multivariate analysis of variance (PERMANOVA), implemented with the adonis2 function in the vegan package using 999 permutations (Oksanen et al., 2026). Homogeneity of multivariate dispersion was evaluated using betadisper followed by permutation tests, allowing differences in group centroids to be distinguished from differences in within-group variability. Community patterns were visualised using principal coordinates analysis (PCoA).
Relationships between bacterial community composition and soil environmental variables were further examined using redundancy analysis (RDA). Prior to model fitting, collinearity among predictors was assessed using variance inflation factors, and highly collinear variables were excluded. The significance of the overall RDA model, individual constrained axes and explanatory variables was evaluated using permutation-based ANOVA. The RDA was used to identify the main environmental gradients associated with bacterial community composition and to visualise sample distribution in relation to management zone, season and slope position.
Pairwise relationships between environmental variables and microbial biomass, taxonomic groups, and functional indicators were explored with Spearman rank correlations. Because these analyses were exploratory, the resulting associations were interpreted cautiously. To account for multiple comparisons, p-values were adjusted using the Benjamini-Hochberg false discovery rate procedure (Benjamini & Hochberg, 1995). Associations with adjusted p-values < 0.05 were considered statistically significant. For all other analyses, significance was assessed at p < 0.05.
3. Results
3.1. Soil Chemical Parameters
The main patterns observed in the soil properties were a general accumulation of inorganic components in the lower part of the slope, and season-dependent differences under mixed-cover management (MC), particularly higher total nitrogen (TN) and lower pH (Table 2 and Table 3).
Soil pH and electric conductivity (EC) varied only moderately across the studied conditions (Table 2). For pH, a significant Treatment × Season interaction was detected (ANOVA, p < 0.001). However, treatment differences were restricted to autumn, when pH was lower under MC than under CT and TL (emmeans: CT–MC, p < 0.05; MC–TL, p < 0.01). Soil EC differed significantly among treatments and seasons (ANOVA; Treatment: p < 0.05; Season: p < 0.01), whereas slope position and all interaction terms were not significant. EC was higher in spring and summer than in winter (emmeans: spring-winter, p < 0.05; summer-winter, p < 0.05).
Elemental composition revealed parameter-specific responses (Table 3). Total carbon (TC) was consistently higher in the lower part of the slope, and a significant Treatment × Slope position interaction was detected (ANOVA, p < 0.05). Nevertheless, upslope-downslope differences were significant within all treatments (emmeans, p < 0.001). In contrast, SOC varied little between slope positions. Although the global model detected significant effects, these were not supported by post-hoc comparisons, indicating no consistent positional differences. The higher TC values observed downslope therefore appear to reflect primarily the accumulation of inorganic C.
For TN, a significant Treatment × Season interaction was detected (ANOVA, p < 0.01). TN was higher under MC management in spring and autumn than under CT and TL (spring: CT-MC, p < 0.001; MC-TL, p < 0.005; autumn: CT-MC, MC-TL: p < 0.001).
Several macro- and micronutrients also varied with slope position. Ca and K concentrations were consistently higher downslope across treatments and seasons (ANOVA, p < 0.001, data not shown). Mn was also higher downslope (emmeans, p < 0.05), although the pattern was less consistent. Mg showed a significant Treatment × Slope position interaction (ANOVA, p < 0.01), with generally higher concentrations downslope, particularly under CT and MC management; however, no pairwise comparisons were significant. Slope position also had significant effects on B, Pb and S. Significant Treatment × Slope position interactions were detected for Sr and Na, while As showed a significant Treatment × Season × Slope position interaction. Treatment significantly affected S, and Treatment × Season interactions were detected for Na and B.
3.2. Microbial Biomass and Enzymatic Activity
ANOVA of the LMM revealed significant effects of slope position and the interaction between management treatment and season on total microbial biomass (Figure 2). Biomass was consistently higher downslope (emmeans: p < 0.05) and peaked under MC management in autumn (emmeans: CT-MC and MC-TL, p < 0.001; CT-TL, p < 0.05).
The fungal-to-bacterial ratio (F/B) had a significant Treatment × Season × Slope position interaction, indicating that seasonal changes in microbial community structure depended on both management and slope position. In general, F/B tended to increase during autumn and winter, although both the magnitude and direction of this response varied across conditions. The Gram-positive to Gram-negative ratio (GP/GN) showed significant effects of Season and Slope position, with higher values in summer and at the upslope position (emmeans, p < 0.0001).
Other PLFA-derived indicators also varied across treatments, seasons and slope positions (Figure S1). AMF biomass exhibited a significant effect of slope position (ANOVA, p < 0.01) and a significant Treatment × Season interaction (ANOVA, p < 0.001). Biomass was higher downslope (emmeans, p < 0.01) and generally greater under MC management, particularly in spring, autumn and winter (emmeans, p < 0.01). Actinomycete biomass appeared to have significant main effects of Treatment (ANOVA, p < 0.001) and Slope position (ANOVA, p < 0.05), with higher biomass under MC, especially relative to TL (emmeans, MC-TL, p < 0.001), and at downslope positions (emmeans, p < 0.05).
Stress-related PLFA ratios exhibited complex seasonal patterns. The saturated-to-unsaturated ratio (Sat/Unsat) was higher upslope (emmeans, p < 0.001) and showed a significant Treatment × Season interaction (ANOVA, p < 0.01). The monounsaturated-to-polyunsaturated ratio (Mono/Poly) exhibited significant Treatment × Season (ANOVA, p < 0.001) and Season × Slope position interactions (ANOVA, p < 0.01), with particularly high values under TL management in autumn (emmeans, p < 0.0001). The gram-negative stress indicator also varied with Treatment (ANOVA, p < 0.001) and Season (ANOVA, p < 0.001), reaching its highest values under CT management and its lowest in summer (emmeans, p < 0.01).
Soil enzymatic activities involved in C cycling (BG, CB, AG, XYL), N cycling (NAG, LAP) and P cycling (PHOS) showed strong seasonal and management-dependent responses (Figure 3). All activities had significant Treatment × Season interactions (p < 0.001), with generally higher values under MC management, particularly in spring and autumn.
For CB, AG, XYL and NAG, which were analysed using a two-part hurdle model, that separates the probability of detection from activity intensity, MC showed higher activity when the enzymes were detectable, especially in spring and autumn. These patterns were less pronounced for LAP, which also exhibited a significant Treatment × Slope zone interaction (ANOVA, p < 0.05), with slightly lower activity downslope, particularly under CT and MC. Phosphatase activity likewise showed a significant Treatment × Season interaction (ANOVA, p < 0.001) and a significant effect of slope position (p < 0.05), with higher activity under MC in spring and autumn but generally lower values downslope.
Total microbial biomass was generally higher under MC management (Figure 2), whereas enzymatic activity peaked mainly during spring and autumn (Figure 3). Interestingly, seasonal patterns in microbial biomass and enzymatic activity were not always coupled. In winter, microbial biomass under MC reached levels comparable to those observed in spring, but this increase was not accompanied by a corresponding rise in enzymatic activity. Consequently, higher microbial biomass under MC did not consistently translate into higher enzymatic activity across seasons.
3.3. Bacterial Community Composition and Diversity
At the phylum level, Actinomycetota was the most abundant group, typically accounting for approximately one third of the bacterial community, followed by Pseudomonadota and Chloroflexota (Figure 4). Despite this broadly conserved dominance pattern, the relative abundances of these and other major phyla varied among management treatments, seasons and slope positions (Figure 4a). A similar pattern was observed at the class level, where Actinobacteria, Alphaproteobacteria and Thermophilia were the most abundant taxa, but their relative contributions differed across the studied conditions (Figure 4b).
Alpha diversity, assessed using the Shannon index, was significantly influenced by the Treatment × Season interaction (ANOVA, p < 0.005; Figure 5a). Post hoc comparisons showed that Shannon diversity was lower in TL during autumn than in CT and MC (emmeans: CT-TL and MC-TL, p < 0.05), whereas no significant treatment differences were detected in the remaining seasons. Although alpha diversity tended to be lower at the downslope position, this effect was not statistically significant.
Beta diversity, assessed using Bray-Curtis dissimilarities, also varied among management zones, seasons and slope position (Figure 5b). PCoA showed a consistent separation of TL-associated bacterial communities from those of CT and MC across seasons. PERMANOVA confirmed significant effects of management treatment, season and slope position on bacterial community composition (p < 0.05). However, the management effects should be interpreted cautiously because multivariate dispersion differed among treatments. PERMDISP showed greater within-treatment variability in TL than in CT (Tukey HSD, p < 0.001) and MC (p < 0.005). Thus, bacterial community composition was structured by management, season, and topographic position, although differences in dispersion may have contributed to the detected management effect.
3.4. Soil Drivers Associated with Microbial Indicators and Bacterial Composition
Spearman correlations and RDA were used to explore associations between microbial variables and soil properties. Due to strong multicollinearity among environmental predictors, only pH and SOC were retained as explanatory variables for these analyses.
Most PLFA-derived indicators were negatively associated with soil pH, although these relationships were generally weak and statistically not significant (Figure 6a). Seasonal analyses revealed that these associations were strongest in autumn, when most PLFA variables were significantly negatively correlated with pH, whereas they weakened or disappeared in the remaining seasons (Figure S2a).
Enzymatic activities showed a similar pattern. Across the full dataset, most activities were negatively associated with pH, with significant correlations for all enzymes except NAG (Figure 6c). However, these relationships were strongly season-dependent, as all activities were significantly negatively associated with pH in autumn, whereas only NAG and BG revealed significant correlations in spring and no significant relationships were detected in summer or winter (Figure S2b).
SOC showed the opposite general pattern, being positively associated with most enzymatic activities and PLFA-derived indicators. As with pH, these relationships were strongest and most consistent in autumn and considerably weaker during the rest of the year (Figure S2b).
At the phylum level, soil pH was positively associated with Actinomycetota and Chloroflexota, and negatively correlated with Acidobacteriota, Pseudomonadota, Verrucomicrobiota and Bacteroidota (Figure 6b). SOC showed broadly opposite relationships. These associations were again strongly season-dependent, with most of the global patterns retained in autumn and, to a lesser extent, in spring, but were largely absent in summer and winter (Figure S2c).
The RDA model based on pH and SOC was significant (permutation ANOVA, p = 0.001). RDA1 was significant and explained 16.4% of the total variation in bacterial community composition, whereas RDA2 explained only 0.5% and was not significant (Figure 7).
Although the RDA did not reveal clear clustering among management zones, a topographic gradient was evident, particularly within CT and, to a lesser extent, MC. Taxa were mainly distributed along RDA1, with Pseudomonadota, Bacteroidota and Acidobacteriota more closely associated with SOC, whereas Actinomycetota, Chloroflexota and Gemmatimonadota were more strongly associated with pH.
These patterns should be interpreted cautiously, as associations with pH and SOC may partly reflect broader differences among management zones, slope positions and seasons.
4. Discussion
This study provides a site-specific assessment of how soil microbial structure and functioning vary across management zones, slope positions and seasons in a long-term Mediterranean olive orchard. Mixed-cover interrows (MC) were generally associated with higher microbial biomass and enzymatic activity than conventionally tilled interrows (CT) and tree-line soils (TL), particularly in spring and autumn. Differences between upper and lower slope positions were expressed mainly through changes in soil physical and chemical properties, especially mineral-associated variables, whereas relationships between soil properties and microbial indicators varied markedly across seasons.
4.1. Topographic Variation in Soil Physical and Chemical Properties
Several macro- and micronutrients (i.e., Ca, K, Mn, Mg, B, Pb, S, Na, Sr, and As) and TC varied with slope position and, in some cases, showed different topographic patterns among management zones. This pattern is consistent with the redistribution of soil particles and dissolved elements along the slope through runoff and erosion processes. Previous studies at the same experimental site reported lower runoff rates under MC than under CT interrows (Gómez et al., 2009), suggesting that the magnitude of topographic redistribution may differ among zones with contrasting soil management.
Lower slope positions generally accumulated TC and several mineral elements, whereas a less consistent response was observed for SOC. This suggests that topographic redistribution primarily affected inorganic C and mineral-associated components rather than organic C pools. The same downslope positions also tended to support higher microbial biomass, possibly as a consequence of greater nutrient availability and environmental heterogeneity (Liu et al., 2020), although this relationship was not consistent across seasons.
Although macro- and micronutrient availability is known to influence microbial community composition and functional balance (Jiao et al., 2021; Shepherd & Oliveiro, 2024), no consistent direct correlations with microbial abundance were detected. This suggests that the influence of individual nutrients was embedded within broader environmental gradients and modulated by factors such as pH, SOC, moisture and seasonality.
4.2. Environmental Gradients Associated with Bacterial Community Composition
Soil pH and SOC emerged as the main measured environmental gradients associated with bacterial community composition, consistent with their well-established importance in structuring soil microbiomes (Wang et al., 2019; Ramírez et al., 2020; Zou et al., 2023). However, because both variables also varied across management zones, seasons and slope positions, their effects should not be interpreted as fully independent drivers without accounting for this shared spatial and temporal structure.
As expected, soil pH varied only slightly across the study, although lower values and higher TN were observed in MC during some seasons. These conditions may have been introduced by the presence of a well-developed vegetation cover and associated rhizosphere in MC, which provides greater organic C inputs and continuous root exudation. The augmented substrate availability for microbial growth and activity can be associated with the higher microbial biomass and enzymatic activity of this zone if compared with the others (Lange et al., 2015; Chomel et al., 2016). Reduced soil disturbance and thus improved structural stability may further favour OM incorporation and reduce nutrient losses (Gómez et al., 2009; Panettieri et al., 2013; Plaza et al., 2013; Novara et al., 2021).
Nevertheless, here one has to bear in mind that the management of TL differs from MC and CT not only with respect to herbicide application but also in its position beneath the tree line. Here it is expected that root activity, canopy influence and local soil conditions contribute to OM input and microbial patterns which can dilute potential differences.
4.3. Spatial and Temporal Variation in Microbial Functioning
Microbial biomass and enzymatic activity varied strongly with season and slope position, and the magnitude of these responses differed among management zones. MC generally showed higher microbial biomass and enzyme activity, particularly in spring and autumn, indicating more favourable conditions for microbial functioning in this zone (Wentzien et al., 2023). These patterns can be associated with greater substrate availability if compared to CT and TL due to plant cover and improved microenvironmental conditions, with potential consequences for C turnover and stabilisation (Geisseler & Horwath, 2009; Zhang et al., 2026).
By contrast, TL often revealed lower microbial biomass than MC and responded more similar to CT. However, as mentioned above these differences may not be attributed exclusively to herbicide use but also to their tree-line position.
At the community level, lower Acidobacteria abundance in CT was consistent with their oligotrophic ecological strategy, whereas the absence of differences between MC and TL may reflect the influence of local environmental conditions associated with the tree line. Likewise, expected shifts in the GP/GN ratio associated with plant inputs (Fanin et al., 2019) were not detected, reinforcing the view that microbial responses were shaped not only by management but also by interacting spatial and temporal factors.
4.4. Seasonal Modulation of Microbial Structure and Activity
Seasonality was a major source of variation in microbial structure and functioning. Relationships observed across the full dataset often differed from those detected within individual seasons, showing that the strength of environmental associations was not constant over time.
For example, the relationship between pH and Gemmatimonadota was not significant overall but, when studied separately by season (Figure S2), it became significant for spring and autumn. Similarly, the positive relationship between pH and Actinomycetota was detected only in particular seasons. These results agree with previous studies showing that the importance of pH as a microbial driver can vary through time as environmental conditions change (Madegwa & Uchida, 2021; Guo et al., 2022).
Seasonality also affected microbial functioning. The highest microbial biomass and enzymatic activity occurred under MC in spring and autumn. Unexpectedly, microbial biomass under MC remained high during winter, reaching values similar to those observed in spring, but this increase was not accompanied by a corresponding rise in enzymatic activity. Similar decoupling between microbial biomass and microbial functioning has been reported previously (Schnecker et al., 2023; Wang et al., 2023). Several mechanisms may contribute to these patterns, including differences between microbial biomass and growth rates, the persistence of extracellular enzymes in soil or seasonal shifts in microbial metabolic activity. In our case, favourable moisture conditions may have supported microbial persistence during winter, whereas lower temperatures likely constrained metabolic activity. Consequently, microbial abundance and functional expression did not follow identical seasonal trajectories.
Seasonal effects were also evident in bacterial diversity. Shannon diversity was lower in TL during autumn, whereas community composition changed across seasons and slope positions. These shifts highlight that microbial responses cannot be interpreted independently of sampling time, particularly in Mediterranean systems characterised by strong seasonal fluctuations in temperature and moisture.
4.5. Study Implications and Limitations
The results show that soil microbial structure and functioning varied with season and slope position, while differences among treatments should be considered as site specific. The multi-season and topographic design allowed us to capture spatial and temporal variability that is often overlooked in soil microbiome studies.
However, the study was conducted in a single orchard with few independent management units, and the multiple soil samples collected within each unit represent spatial subsamples rather than true treatment replicates. In addition, management-zone effects cannot be fully separated from slope-related processes or, in the case of TL, from tree-line position and associated root and canopy influences.
Considering that the presented investigation was designed as a case, future works may expand to approaching multiple orchards and a larger number of independent management units, ideally with comparable management treatments replicated across contrasting slope positions.
5. Conclusion
In this case study, we characterised the soil microbiome of a Mediterranean olive orchard by analysing the combined effects of soil management, slope position, and seasonality on microbial community structure and function. Our results point to the conclusion that in systems comparable to our study site, microbial communities are shaped by interacting spatial and temporal gradients, with SOC content and soil pH as main drivers affecting bacterial community composition. Whereas SOC was closely related to shifts in microbial abundance and composition, the little variation of the pH remained equally associated with the microbial community structure.
Our study confirmed further that in olive plantations comparable to our study site, maintaining mixed natural vegetation covers in the interrow instead of applying conventional management with tillage and tree-line herbicide application can indeed enhance microbial biomass and enzymatic activity particularly during spring and autumn. These patterns are best explained with the increased inputs of plant residues and root exudates by this agroecological management form leading to promote microbial growth and activity. However, it is important to note that during winter this increase in microbial biomass was not accompanied by higher enzymatic activity. Accordingly, we suggest a seasonal decoupling between microbial abundance and functional expression, likely driven by lower temperatures that induce changes in microbial metabolic activity.
Topographic position influenced soil physical and chemical properties, particularly the element distribution and total carbon, and contributed to differences in microbial biomass across the slope. More importantly, relationships between soil properties and microbial communities varied substantially among seasons. Several associations that were weak or absent in the global analyses became significant when seasons were analysed separately, highlighting the context dependency of soil driver–microbiome relationships.
Overall, our findings demonstrate that soil microbial functioning cannot be interpreted from individual environmental drivers alone, but emerges from the interaction between soil properties, management practices, topographic variability, and seasonal dynamics. These results emphasise the importance of integrating spatial and temporal heterogeneity when assessing soil microbial functioning and support the use of context-aware approaches for the development and interpretation of soil microbiome-based indicators in Mediterranean agroecosystems.
Supplementary Materials
The following supporting information can be downloaded at the website of this paper posted on Preprints.org.
Author Contributions
Laura Gismero-Rodríguez: conceptualisation, investigation, data curation, formal analysis, writing – original draft, writing – review & editing; Heike Knicker: conceptualisation, resources, supervision, funding acquisition, writing – review & editing; José A. Gómez: resources, funding acquisition, writing – review & editing; Inés Aguilar-Romero: investigation, methodology, writing – review & editing; Rocío Reinoso-Limones: investigation, methodology, writing – review & editing; Francisco J. Moreno-Racero: investigation, methodology, writing – review & editing; Angel Valverde: conceptualisation, methodology, formal analysis, resources, supervision, funding acquisition, writing – review & editing.
Data Availability Statement
The data supporting the findings of this study are available from the authors upon reasonable request.
AI statement
Artificial intelligence tools were used for text improvement and for supporting R script development. All generated content was critically revised by the authors, who take full responsibility for the final manuscript.
Acknowledgments
This work was partially funded by the EJP SOIL project Energylink, which received funding from the European Union’s Horizon 2020 research and innovation programme under grant agreement N° 862695. The Spanish site from Benacazón is funded through grant agreement N° 862695, Tudi GA 101000224 from the H2020 program and PID2023-146177OB-C21 /C22 funded by MICIU/AEI/10.13039/501100011033 and “ERDF A way of making Europe”. We thank Manolo Redondo Rodríguez, Clemente Trujillo Toro, Marta Velasco Molina, Álvaro F. García Rodríguez and José María García de Castro Barragán for their help during the sampling campaigns. Special thanks to Mariano Igual Arroyo, Virginia Gascón Galán and Cristina Frade Lago (IRNASA-CSIC) for processing the PLFA extracts and for their assistance with the implementation of the PLFA and enzymatic activity analysis protocols.
Conflicts of Interest
The authors declare no conflict of interest.
References
- Arias-Giraldo, L. F.; Guzmán, G.; Montes-Borrego, M.; Gramaje, D.; Gómez, J. A.; Landa, B. B. Going beyond soil conservation with the use of cover crops in mediterranean sloping olive orchards. Agronomy 2021, 11(7). [Google Scholar] [CrossRef]
- Bell, C. W.; Fricks, B. E.; Rocca, J. D.; Steinweg, J. M.; McMahon, S. K.; Wallenstein, M. D. High-throughput fluorometric measurement of potential soil extracellular enzyme activities. Journal of Visualized Experiments: JoVE 2013, (81). [Google Scholar] [CrossRef] [PubMed]
- Benjamini, Y.; Hochberg, Y. Controlling the False Discovery Rate: A Practical and Powerful Approach to Multiple Testing. Journal of the Royal Statistical Society, Series B (Methodological) 1995, 57(1), 289–300. Available online: http://www.jstor.org/stable/2346101. [CrossRef]
- Buyer, J. S.; Sasser, M. High throughput phospholipid fatty acid analysis of soils. Applied Soil Ecology 2012, 61, 127–130. [Google Scholar] [CrossRef]
- Callahan, B. J.; McMurdie, P. J.; Rosen, M. J.; Han, A. W.; Johnson, A.J.; Holmes, S. P. DADA2: High-resolution sample inference from Illumina amplicon data. Nat Methods 2016, 13(7), 581–3. [Google Scholar] [CrossRef] [PubMed]
- Castellano-Hinojosa, A.; Kanissery, R.; Strauss, S. L. Cover crops in citrus orchards impact soil nutrient cycling and the soil microbiome after three years but effects are site-specific. Biology and Fertility of Soils 2023, 59(6), 659–678. [Google Scholar] [CrossRef]
- Chomel, M.; Guittonny-Larchevêque, M.; Fernandez, C.; Gallet, C.; DesRochers, A.; Paré, D.; Jackson, B.G.; Baldy, V. Plant secondary metabolites: a key driver of litter decomposition and soil nutrient cycling. Journal of Ecology 2016, 104, 1527–1541. [Google Scholar] [CrossRef]
- Dumas, J. B. A. Procédés de l’analyse organique. Annales de Chimie et de Physique 1831, 47, 198–205. [Google Scholar]
- Ewels, P.A.; Peltzer, A.; Fillinger, S.; Patel, H.; Alneberg, J.; Wilm, A.; Garcia, M. U.; Di Tommaso, P.; Nahnsen, S. The nf-core framework for community-curated bioinformatics pipelines. Nat Biotechnol 2020, 38, 276–278. [Google Scholar] [CrossRef] [PubMed]
- Fanin, N.; Kardol, P.; Farrell, M.; Nilsson, M. C.; Gundale, M. J.; Wardle, D. A. The ratio of Gram-positive to Gram-negative bacterial PLFA markers as an indicator of carbon availability in organic soils. Soil Biology and Biochemistry 2019, 128, 111–114. [Google Scholar] [CrossRef]
- FAO. 2022. Available online: https://data.worldbank.org/indicator/AG.LND.AGRI.ZS?end=2023&start=2013.
- Ferreira, C. S. S.; Seifollahi-Aghmiuni, S.; Destouni, G.; Ghajarnia, N.; Kalantari, Z. Soil degradation in the European Mediterranean region: Processes, status and consequences. In Science of the Total Environment; Elsevier B.V., 2022; Vol. 805. [Google Scholar] [CrossRef] [PubMed]
- Fox, J.; Weisberg, S. An R Companion to Applied Regression, Third edition; Sage, 2019; Available online: https://www.john-fox.ca/Companion/.
- Frostegard, A.; Bååth, E. The Use of Phospholipid Fatty Acid Analysis to Estimate Bacterial and Fungal Biomass in Soil. Biology and Fertility of Soils 1996, 22, 59–65. [Google Scholar] [CrossRef]
- Geisseler, D.; Horwath, W. R. Relationship between carbon and nitrogen availability and extracellular enzyme activities in soil. Pedobiologia 2009, 53(1), 87–98. [Google Scholar] [CrossRef]
- Gómez, J. A.; Guzmán, M. G.; Giráldez, J. V.; Fereres, E. The influence of cover crops and tillage on water and sediment yield, and on nutrient, and organic matter losses in an olive orchard on a sandy loam soil. Soil and Tillage Research 2009, 106(1), 137–144. [Google Scholar] [CrossRef]
- Gómez, J.A.; Campos, M.; Guzmán, G.; Castillo-Llanque, F.; Vanwalleghem, T.; Lora, A.; Giráldez, J. V. Soil erosion control, plant diversity, and arthropod communities under heterogeneous cover crops in an olive orchard. Environmental Science and Pollution Research 2018, 25, 977–989. [Google Scholar] [CrossRef] [PubMed]
- Guo, Z.; Liu, C. A.; Hua, K.; Wang, D.; Wan, S.; He, C.; Zhan, L. Temporal variation of management effects on soil microbial communities. Geoderma 2022, 418. [Google Scholar] [CrossRef]
- Hartig, F. DHARMa: Residual Diagnostics for Hierarchical (Multi-Level / Mixed) Regression Models. R package version 0.5.0. 2026. Available online: https://CRAN.R-project.org/package=DHARMa.
- Hartmann, M.; Six, J. Soil structure and microbiome functions in agroecosystems. Nat Rev Earth Environ 2023, 4, 4–18. [Google Scholar] [CrossRef]
- Jiao, S.; Peng, Z.; Qi, J.; Gao, J.; Wei, G. Linking Bacterial-Fungal Relationships to Microbial Diversity and Soil Nutrient Cycling. mSystems 2021, 6, e01052-20. Available online: https://journals.asm.org/journal/msystems. [CrossRef] [PubMed]
- Joos, L.; Ommeslag, S.; Baeyen, S.; Asselberg, W.; Van Loo, K.; Clement, L.; Debode, J.; Vandecasteele, B.; De Tender, C. Year-long, multiple-timepoint field studies show the importance of spatiotemporal dynamics and microbial functions in agricultural soil microbiomes. mSystems 2025, 10, e00112-25. [Google Scholar] [CrossRef] [PubMed]
- Lagacherie, P.; Álvaro-Fuentes, J.; Annabi, M.; Bernoux, M.; Bouarfa, S.; Douaoui, A.; Grünberger, O.; Hammani, A.; Montanarella, L.; Mrabet, R.; Sabir, M.; Raclot, D. Managing Mediterranean soil resources under global change: expected trends and mitigation strategies. Regional Environmental Change 2018, 18(3), 663–675. [Google Scholar] [CrossRef]
- Lange, M.; Eisenhauer, N.; Sierra, C. A.; Bessler, H.; Engels, C.; Griffiths, R. I.; Mellado-Vázquez, P. G.; Malik, A. A.; Roy, J.; Scheu, S.; Steinbeiss, S.; Thomson, B. C.; Trumbore, S. E.; Gleixner, G. Plant diversity increases soil microbial activity and soil carbon storage. Nature Communications 2015, 6. [Google Scholar] [CrossRef] [PubMed]
- Leifheit, E. F.; Veresoglou, S. D.; Lehmann, A.; Morris, E. K.; Rillig, M. C. Multiple factors influence the role of arbuscular mycorrhizal fungi in soil aggregation-a meta-analysis. Plant and Soil 2014, 374(1–2), 523–537. [Google Scholar] [CrossRef]
- Lenth, R. emmeans: Estimated Marginal Means, aka Least-Squares Means. R package version 1.11.1-00001. 2025. Available online: https://rvlenth.github.io/emmeans/.
- Liu, Y.; Zhang, L.; Lu, J.; Chen, W.; Wei, G.; Lin, Y. Topography affects the soil conditions and bacterial communities along a restoration gradient on Loess-Plateau. Applied Soil Ecology 2020, 150. [Google Scholar] [CrossRef]
- Lüdecke, D.; Ben-Shachar, M.; Patil, I.; Waggoner, P.; Makowski, D. performance: An R Package for Assessment, Comparison and Testing of Statistical Models. Journal of Open Source Software 2021, 6(60), 3139. [Google Scholar] [CrossRef]
- Lux, J.; Xie, Z.; Sun, X.; Wu, D.; Scheu, S. Changes in microbial community structure and functioning with elevation are linked to local soil characteristics as well as climatic variables. Ecology and Evolution 2022, 12(12). [Google Scholar] [CrossRef] [PubMed]
- Madegwa, Y. M.; Uchida, Y. Land use and season drive changes in soil microbial communities and related functions in agricultural soils. Environmental DNA 2021, 3(6), 1214–1228. [Google Scholar] [CrossRef]
- Merino, A.; López, L.; Hermida, L.; Sánchez, J. L.; García-Ortega, E.; Gascón, E.; Fernández-González, S. Identification of drought phases in a 110-year record from Western Mediterranean basin: Trends, anomalies and periodicity analysis for Iberian Peninsula. Global and Planetary Change 2015, 133, 96–108. [Google Scholar] [CrossRef]
- Mishra, A.; Singh, D.; Hathi, Z.; Purohit, H. J.; Jessy, M. D.; Philip, A.; Uthup, T. K.; Singh, L. Soil microbiome dynamics associated with conversion of tropical forests to different rubber based land use management systems. Applied Soil Ecology 2023, 188. [Google Scholar] [CrossRef]
- Morugán-Coronado, A.; Pérez-Rodríguez, P.; Insolia, E.; Soto-Gómez, D.; Fernández-Calviño, D.; Zornoza, R. The impact of crop diversification, tillage and fertilization type on soil total microbial, fungal and bacterial abundance: A worldwide meta-analysis of agricultural sites. Agriculture, Ecosystems and Environment 2022, 329. [Google Scholar] [CrossRef]
- Naidoo, Y.; Valverde, A.; Pierneef, R. E.; Cowan, D. A. Differences in Precipitation Regime Shape Microbial Community Composition and Functional Potential in Namib Desert Soils. Microb Ecol. 2022, 83(3), 689–701. [Google Scholar] [CrossRef] [PubMed]
- Novara, A.; Cerda, A.; Barone, E.; Gristina, L. Cover crop management and water conservation in vineyard and olive orchards. In Soil and Tillage Research; Elsevier B.V., 2021; Vol. 208. [Google Scholar] [CrossRef]
- Oksanen, J.; Simpson, G.; Blanchet, F.; Kindt, R.; Legendre, P.; Minchin, P.; O'Hara, R.; Solymos, P.; Stevens, M.; Szoecs, E.; Wagner, H.; Bedward, M.; Bolker, B.; Borcard, D.; Carvalho, G.; De Caceres, M.; Durand, S.; Evangelista, H.; Hannigan, G.; Hill, M.; Lahti, L.; Martino, C.; Ouellette, M.; Ribeiro Cunha, E.; Smith, T.; Stier, A.; Ter Braak, C.; Weedon, J. vegan: Community Ecology Package. R package version 2.8-0. 2026. Available online: https://vegandevs.github.io/vegan/.
- Panettieri, M.; Knicker, H.; Berns, A. E.; Murillo, J. M.; Madejón, E. Moldboard plowing effects on soil aggregation and soil organic matter quality assessed by 13C CPMAS NMR and biochemical analyses. Agriculture, Ecosystems and Environment 2013, 177, 48–57. [Google Scholar] [CrossRef]
- Philippot, L.; Chenu, C.; Kappler, A.; Rillig, M. C.; Fierer, N. The interplay between microbial communities and soil properties. In Nature Reviews Microbiology; Nature Research, 2024; Vol. 22, Issue 4, pp. 226–239. [Google Scholar] [CrossRef] [PubMed]
- Plaza, C.; Courtier-Murias, D.; Fernández, J. M.; Polo, A.; Simpson, A. J. Physical, chemical, and biochemical mechanisms of soil organic matter stabilization under conservation tillage systems: A central role for microbes and microbial by-products in C sequestration. Soil Biology & Biochemistry 2013, 57, 124–134. [Google Scholar] [CrossRef]
- Quast, C.; Pruesse, E.; Yilmaz, P.; Gerken, J.; Schweer, T.; Yarza, P.; Peplies, J.; Glöckner, F. O. The SILVA ribosomal RNA gene database project: improved data processing and web-based tools. Nucleic Acids Res. 2013, 41(Database issue), D590–6. [Google Scholar] [CrossRef] [PubMed]
- Ramírez, P. B.; Fuentes-Alburquenque, S.; Díez, B.; Vargas, I.; Bonilla, C. A. Soil microbial community responses to labile organic carbon fractions in relation to soil type and land use along a climate gradient. Soil Biology and Biochemistry 2020, 141. [Google Scholar] [CrossRef]
- Sadeghi, S. H.; Sadeghi Satri, M.; Kheirfam, H.; Zarei Darki, B. Runoff and soil loss from small plots of erosion-prone marl soil inoculated with bacteria and cyanobacteria under real conditions. European Journal of Soil Biology 2020, 101. [Google Scholar] [CrossRef]
- Schloter, M.; Nannipieri, P.; Sørensen, S. J.; van Elsas, J. D. Microbial indicators for soil quality. Biology and Fertility of Soils 2018, 54(1), 1–10. [Google Scholar] [CrossRef]
- Schnecker, J.; Baldaszti, L.; Gündler, P.; Pleitner, M.; Sandén, T.; Simon, E.; Spiegel, F.; Spiegel, H.; Urbina Malo, C.; Zechmeister-Boltenstern, S.; Richter, A. Seasonal dynamics of soil microbial growth, respiration, biomass, and carbon use efficiency in temperate soils. Geoderma 2023, 440. [Google Scholar] [CrossRef]
- Semenov, M. V.; Zhelezova, A. D.; Ksenofontova, N. A.; Ivanova, E. A.; Nikitin, D. A.; Semenov, V. M. Microbiological Indicators for Assessing the Effects of Agricultural Practices on Soil Health: A Review. Agronomy 2025, 15(2), 335. [Google Scholar] [CrossRef]
- Shepherd, R. M.; Oliverio, A. M. Micronutrients modulate the structure and function of soil bacterial communities. Soil Biology and Biochemistry 2024, 192. [Google Scholar] [CrossRef]
- Staff, Soil Survey. Soil Taxonomy, 2nd ed.; USDA. Agr.Hbk. 436, 1999. [Google Scholar]
- Stockmann, U.; Minasny, B.; McBratney, A. B. How fast does soil grow? Geoderma 2014, 216, 48–61. [Google Scholar] [CrossRef]
- Straub, D.; Blackwell, N.; Langarica-Fuentes, A.; Peltzer, A.; Nahnsen, S.; Kleindienst, S. Interpretations of Environmental Microbial Community Studies Are Biased by the Selected 16S rRNA (Gene) Amplicon Sequencing Pipeline. Front. Microbiol. 2020, 11, 550420. [Google Scholar] [CrossRef] [PubMed]
- Thomson, B. C.; Tisserant, E.; Plassart, P.; Uroz, S.; Griffiths, R. I.; Hannula, S. E.; Buée, M.; Mougel, C.; Ranjard, L.; van Veen, J. A.; Martin, F.; Bailey, M. J.; Lemanceau, P. Soil conditions and land use intensification effects on soil microbial communities across a range of European field sites. Soil Biology and Biochemistry 2015, 88, 403–413. [Google Scholar] [CrossRef]
- United Nations Office for Disaster Risk Reduction (UNDRR); International Science Council (ISC). UNDRR–ISC Hazard Information Profiles – 2025 Update: GH0403 Soil Erosion United Nations Office for Disaster Risk Reduction; International Science Council, 2025; Available online: https://www.undrr.org/terms/hips/GH0403.
- Wang, C. yu; Zhou, X.; Guo, D.; Zhao, J. hua; Yan, L.; Feng, G. zhong; Gao, Q.; Yu, H.; Zhao, L. po. Soil pH is the primary factor driving the distribution and function of microorganisms in farmland soils in northeastern China. Annals of Microbiology 2019, 69(13), 1461–1473. [Google Scholar] [CrossRef]
- Wang, C.; Henry, H. A. L.; Miao, X.; Shi, B.; Song, Y.; Liang, Q.; Sun, W. Seasonal variation modifies the spatial patterns of soil microbial community structure and enzyme activity in a meadow steppe. Applied Soil Ecology 2023, 182. [Google Scholar] [CrossRef]
- Wentzien, N. M.; Fernández-González, A. J.; Villadas, P. J.; Valverde-Corredor, A.; Mercado-Blanco, J.; Fernández-López, M. Thriving beneath olive trees: The influence of organic farming on microbial communities. Computational and Structural Biotechnology Journal 2023, 21, 3575–3589. [Google Scholar] [CrossRef] [PubMed]
- Zhang, Z.; Hu, L.; Liu, Y.; Guo, Y.; Tang, S.; Ren, J. Land use shapes the microbial community structure by altering soil aggregates and dissolved organic matter components. Journal of Integrative Agriculture 2024. [Google Scholar] [CrossRef]
- Zhang, Y.; Sun, S.; Zhou, J.; van Groenigen, K. J.; Delgado-Baquerizo, M.; Ma, Y.; Moorhead, D. L.; Hungate, B. A.; Smith, P.; Terrer, C.; Liu, J.; Sinsabaugh, R. L.; Guo, L.; Ochoa-Hueso, R.; Power, S. A.; Eivind Olesen, J.; Luo, Y.; Cao, J.; Jiang, M.; Feng, Z.; Luo, M.; Chen, J. Soil extracellular enzymes drive soil carbon accumulation under elevated CO2. Functional Ecology 2026. [Google Scholar] [CrossRef]
- Zou, L.; Bai, Y. ping; Huang, J.; Xiao, D. rong; Yang, G. Soil pH and dissolved organic carbon shape microbial communities in wetlands with two different vegetation types in Changdu area, Tibet. Journal of Mountain Science 2023, 20(3), 750–764. [Google Scholar] [CrossRef]
Figure 1.
Main characteristics of the studied olive orchard. (a) Sampling site (Santa Marta, Benacazón, Seville, Spain) and schematic representation of the management zones (conventional tillage - CT, mixed natural cover - MC, herbicide - TL). (b) USDA soil texture triangle, with plots presented by treatment. (c) Precipitation and temperature during the sampling period and adjacent dates. (d) Soil moisture by treatment.
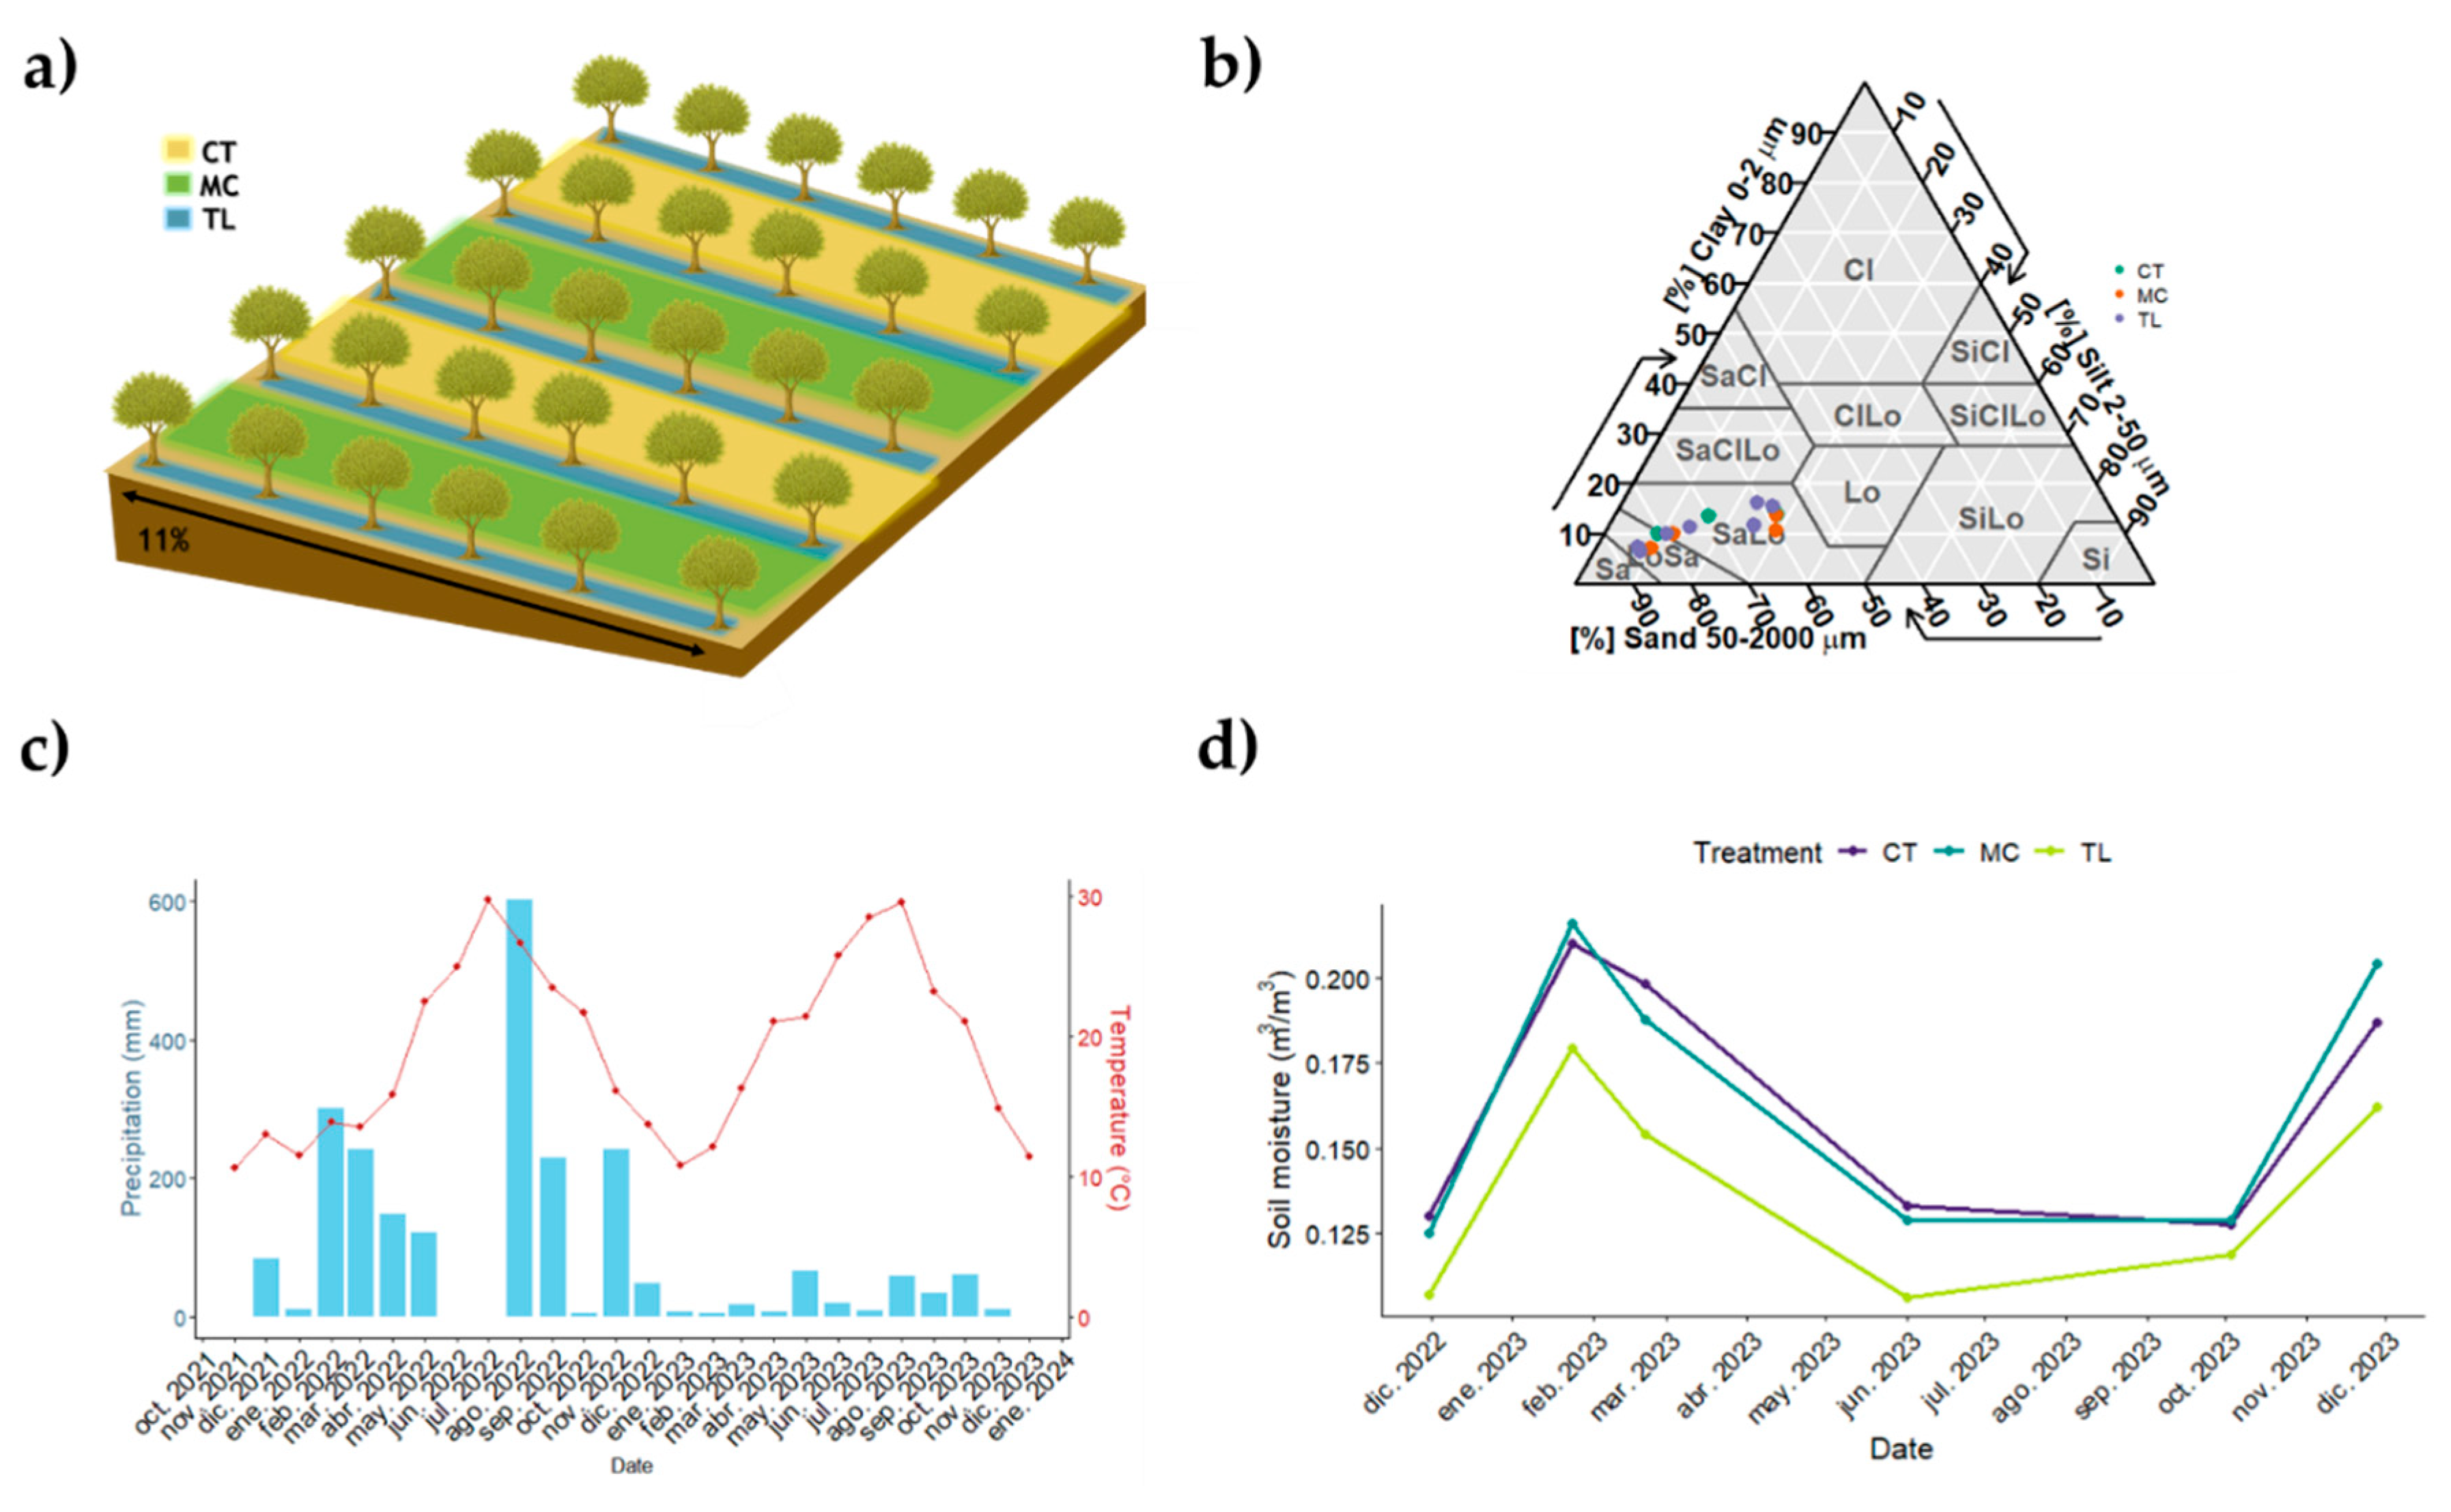
Figure 2.
Mean (± SE) soil PLFA-derived indicators of microbial community size and structure across the studied topsoils from Santa Marta olive orchard (Benacazón, Seville, Spain). Shown variables include total microbial biomass (Biomass, nmol g dry soil-1), fungal-to-bacterial ratio (F/B), and Gram-positive to Gram-negative ratio (GP/GN). Data are presented by treatment (conventional tillage - CT, mixed natural cover – MC, herbicide – TL) and slope position (high, low). Text on the right indicates significant global effects from generalized linear mixed-effects models (GLMM), where * p < 0.05, ** p < 0.01, and *** p < 0.001.
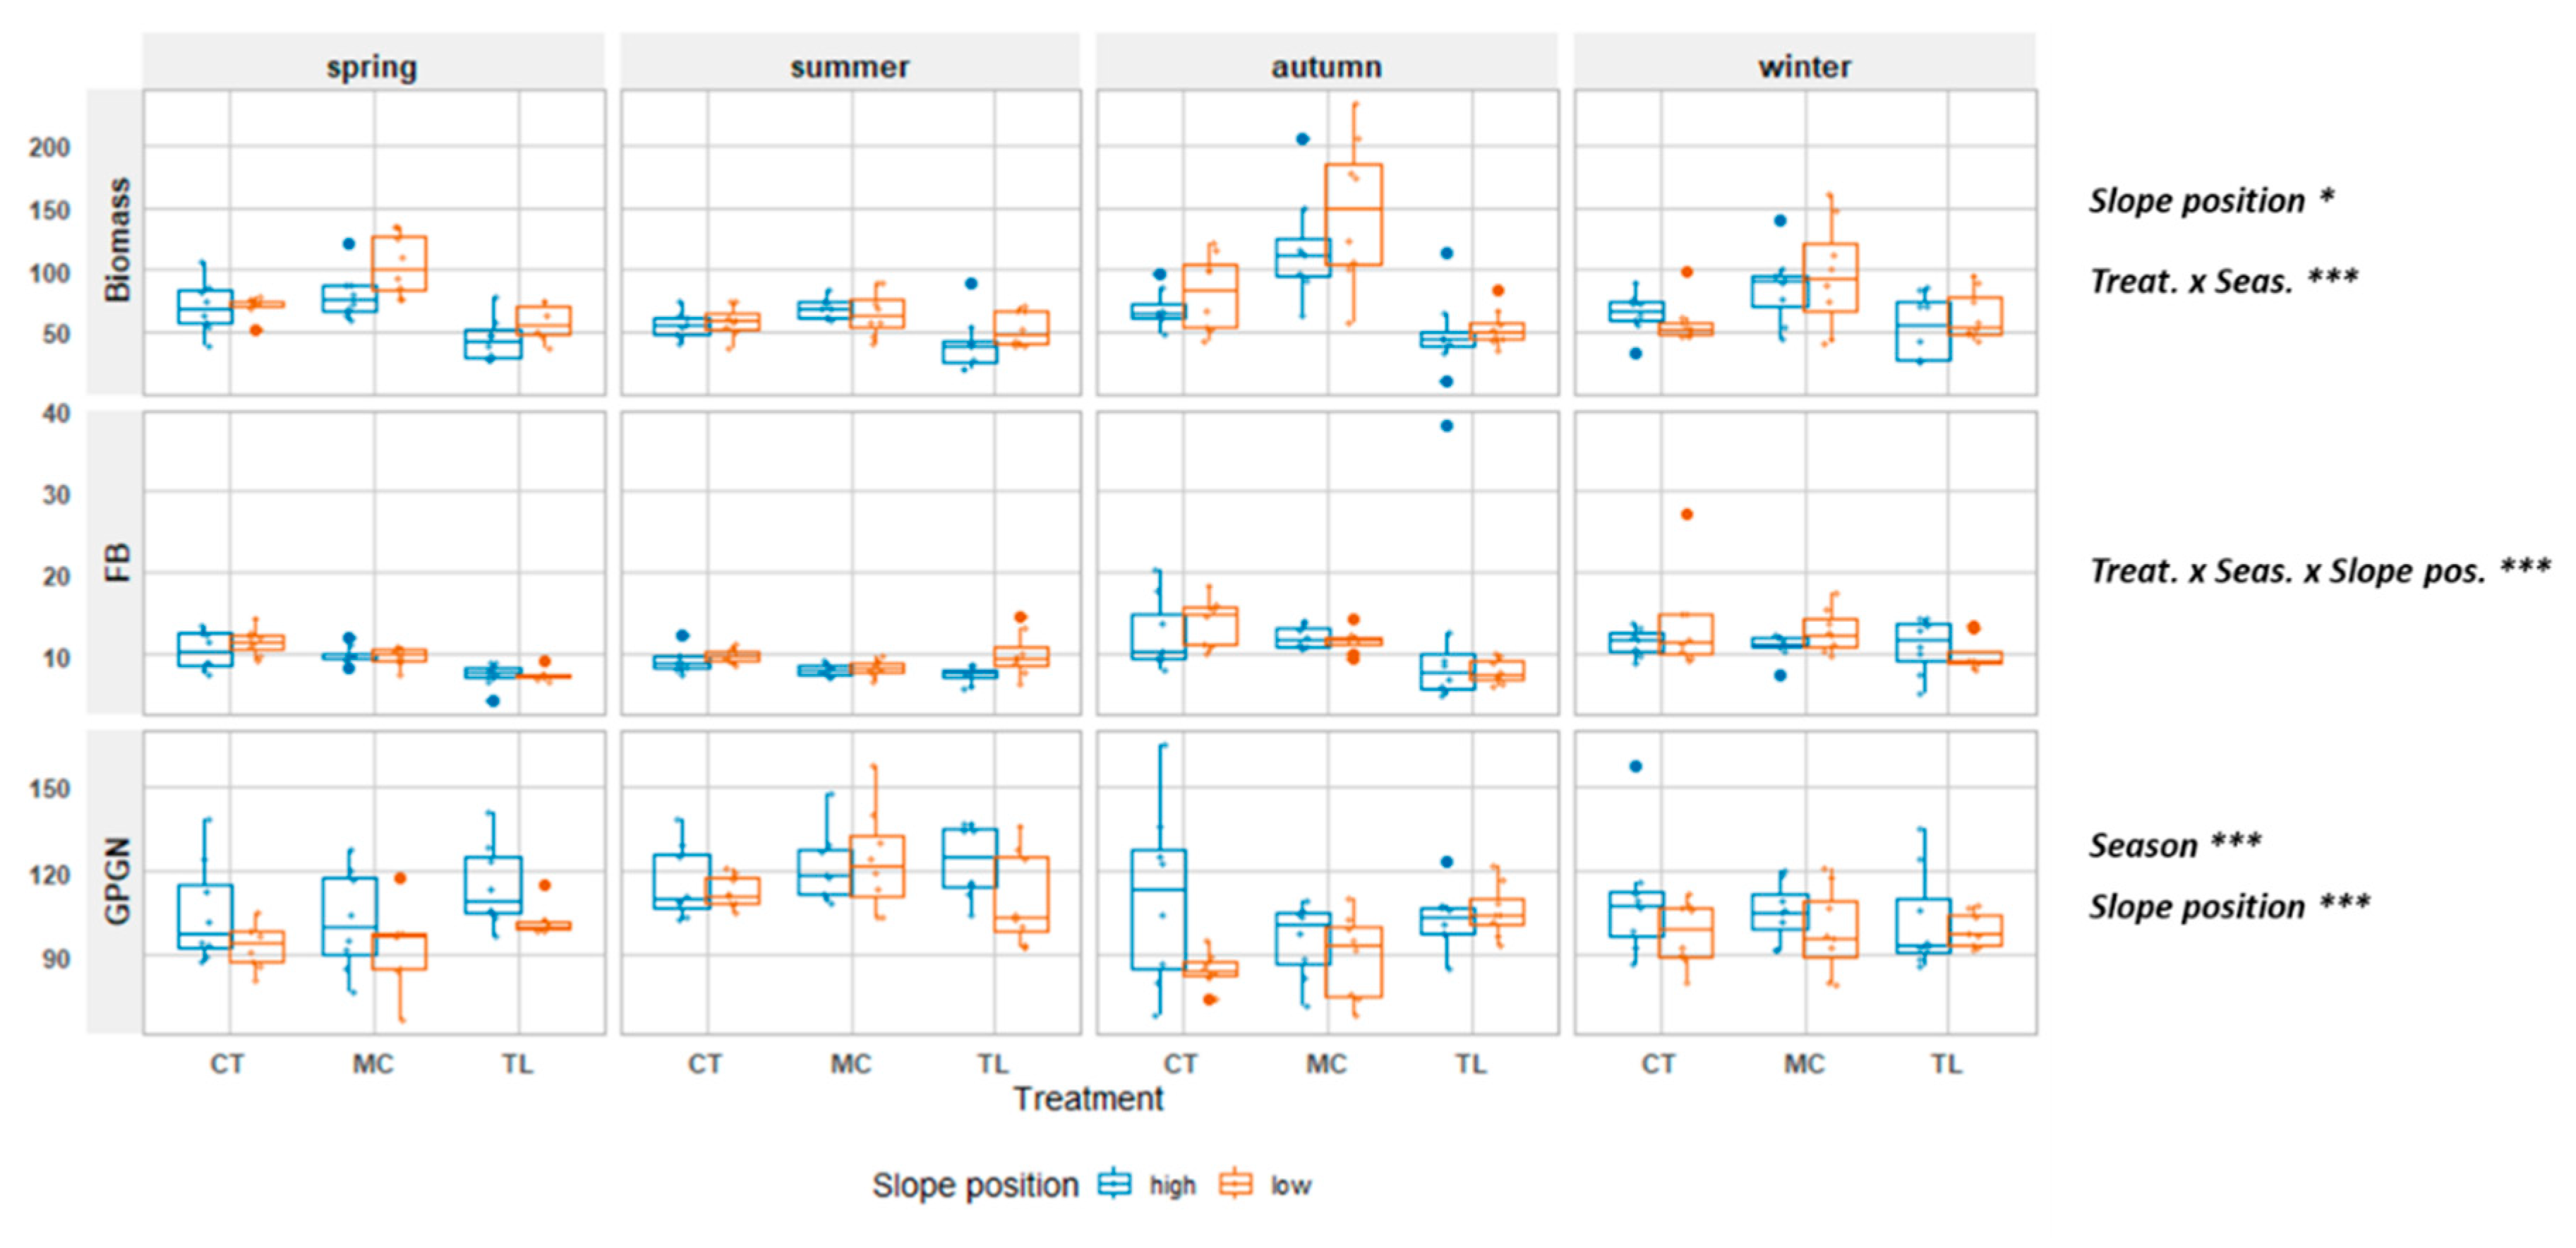
Figure 3.
Mean (± SE) soil enzymatic activities (nmol g dry soil-1 h-1) involved in the C cycle (BG, CB, AG, XYL), N cycle (NAG, LAP) and P cycle (PHOS) across the studied topsoils from Santa Marta olive orchard (Benacazón, Seville, Spain). Data are distingued by treatments (conventional tillage - CT, mixed natural cover - MC, herbicide - TL), seasons, and slope position (high, low). Text on the right indicates significant global effects from linear mixed-effects models (LMM), where * p < 0.05, ** p < 0.01, and *** p < 0.001.
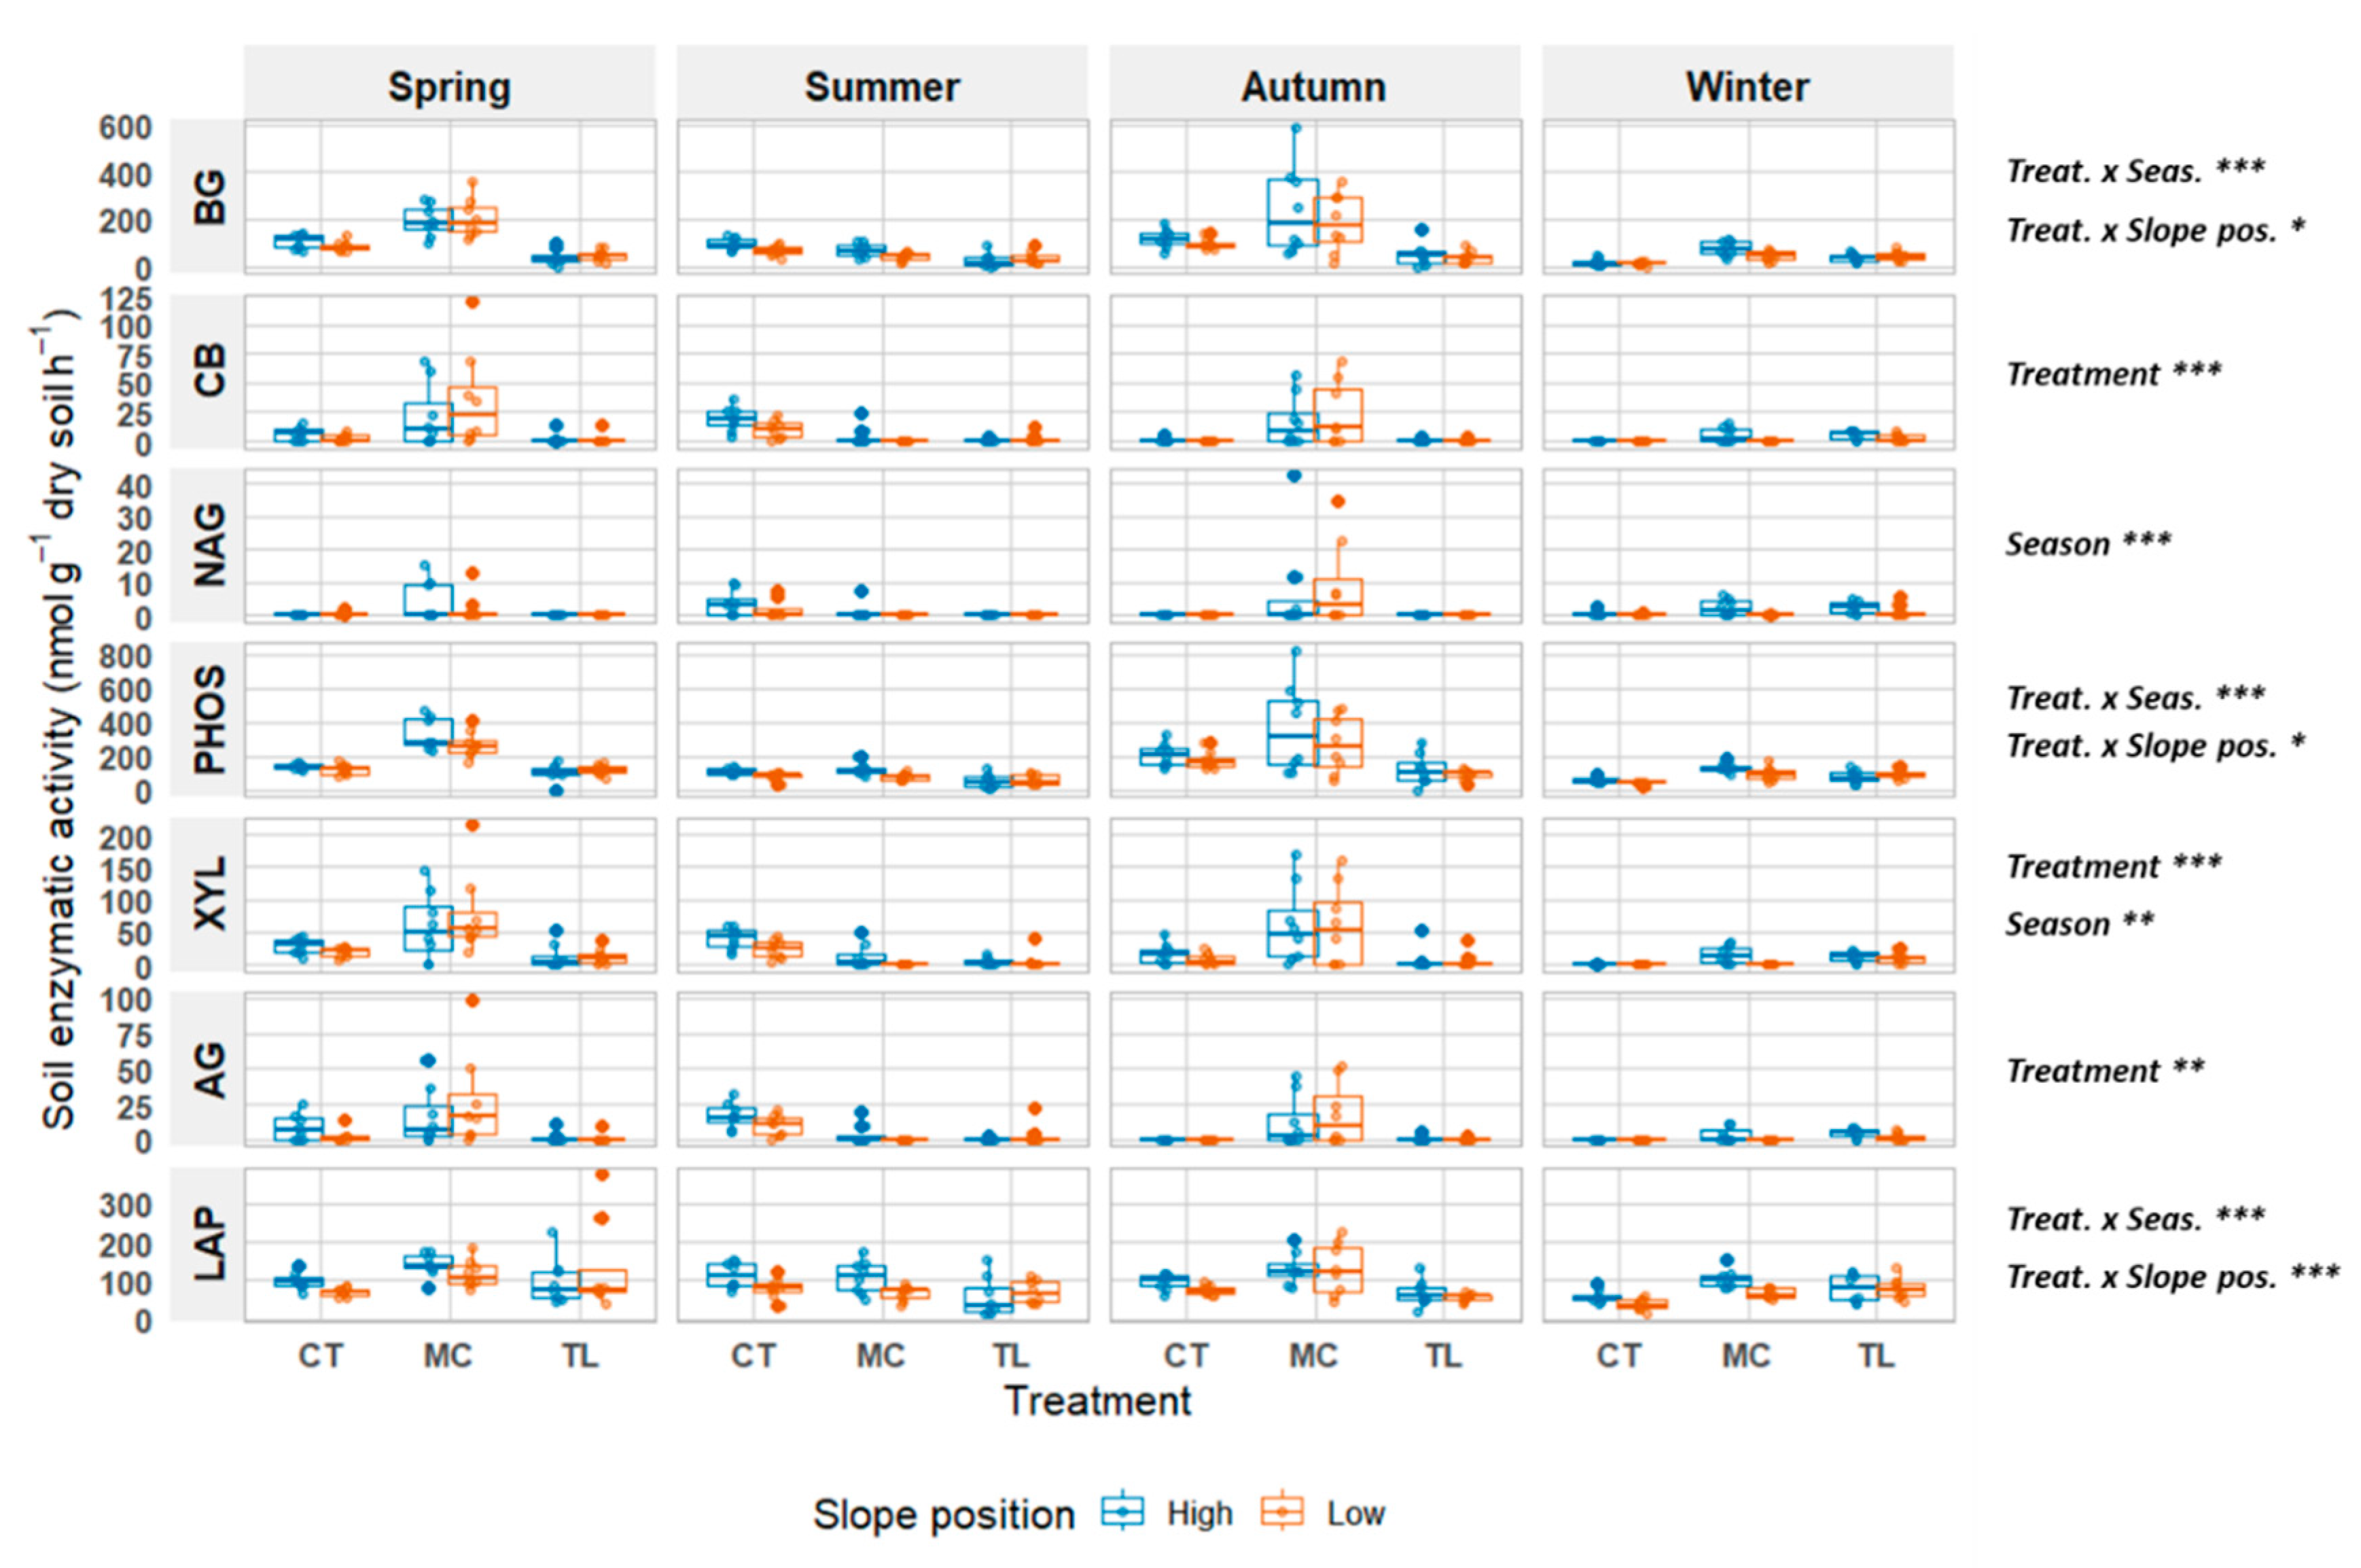
Figure 4.
Mean (± SE) relative abundance of the 10 most abundant bacterial phyla (a) and classes (b) across the studied topsoils from Santa Marta olive orchard (Benacazón, Seville, Spain). Data are presented by treatment (conventional tillage - CT, mixed natural cover - MC, herbicide - TL), seasons, and slope position (high and low). Text on the right indicates significant global effects from generalized linear mixed-effects models (GLMM), where * p < 0.05, ** p < 0.01, and *** p < 0.001.
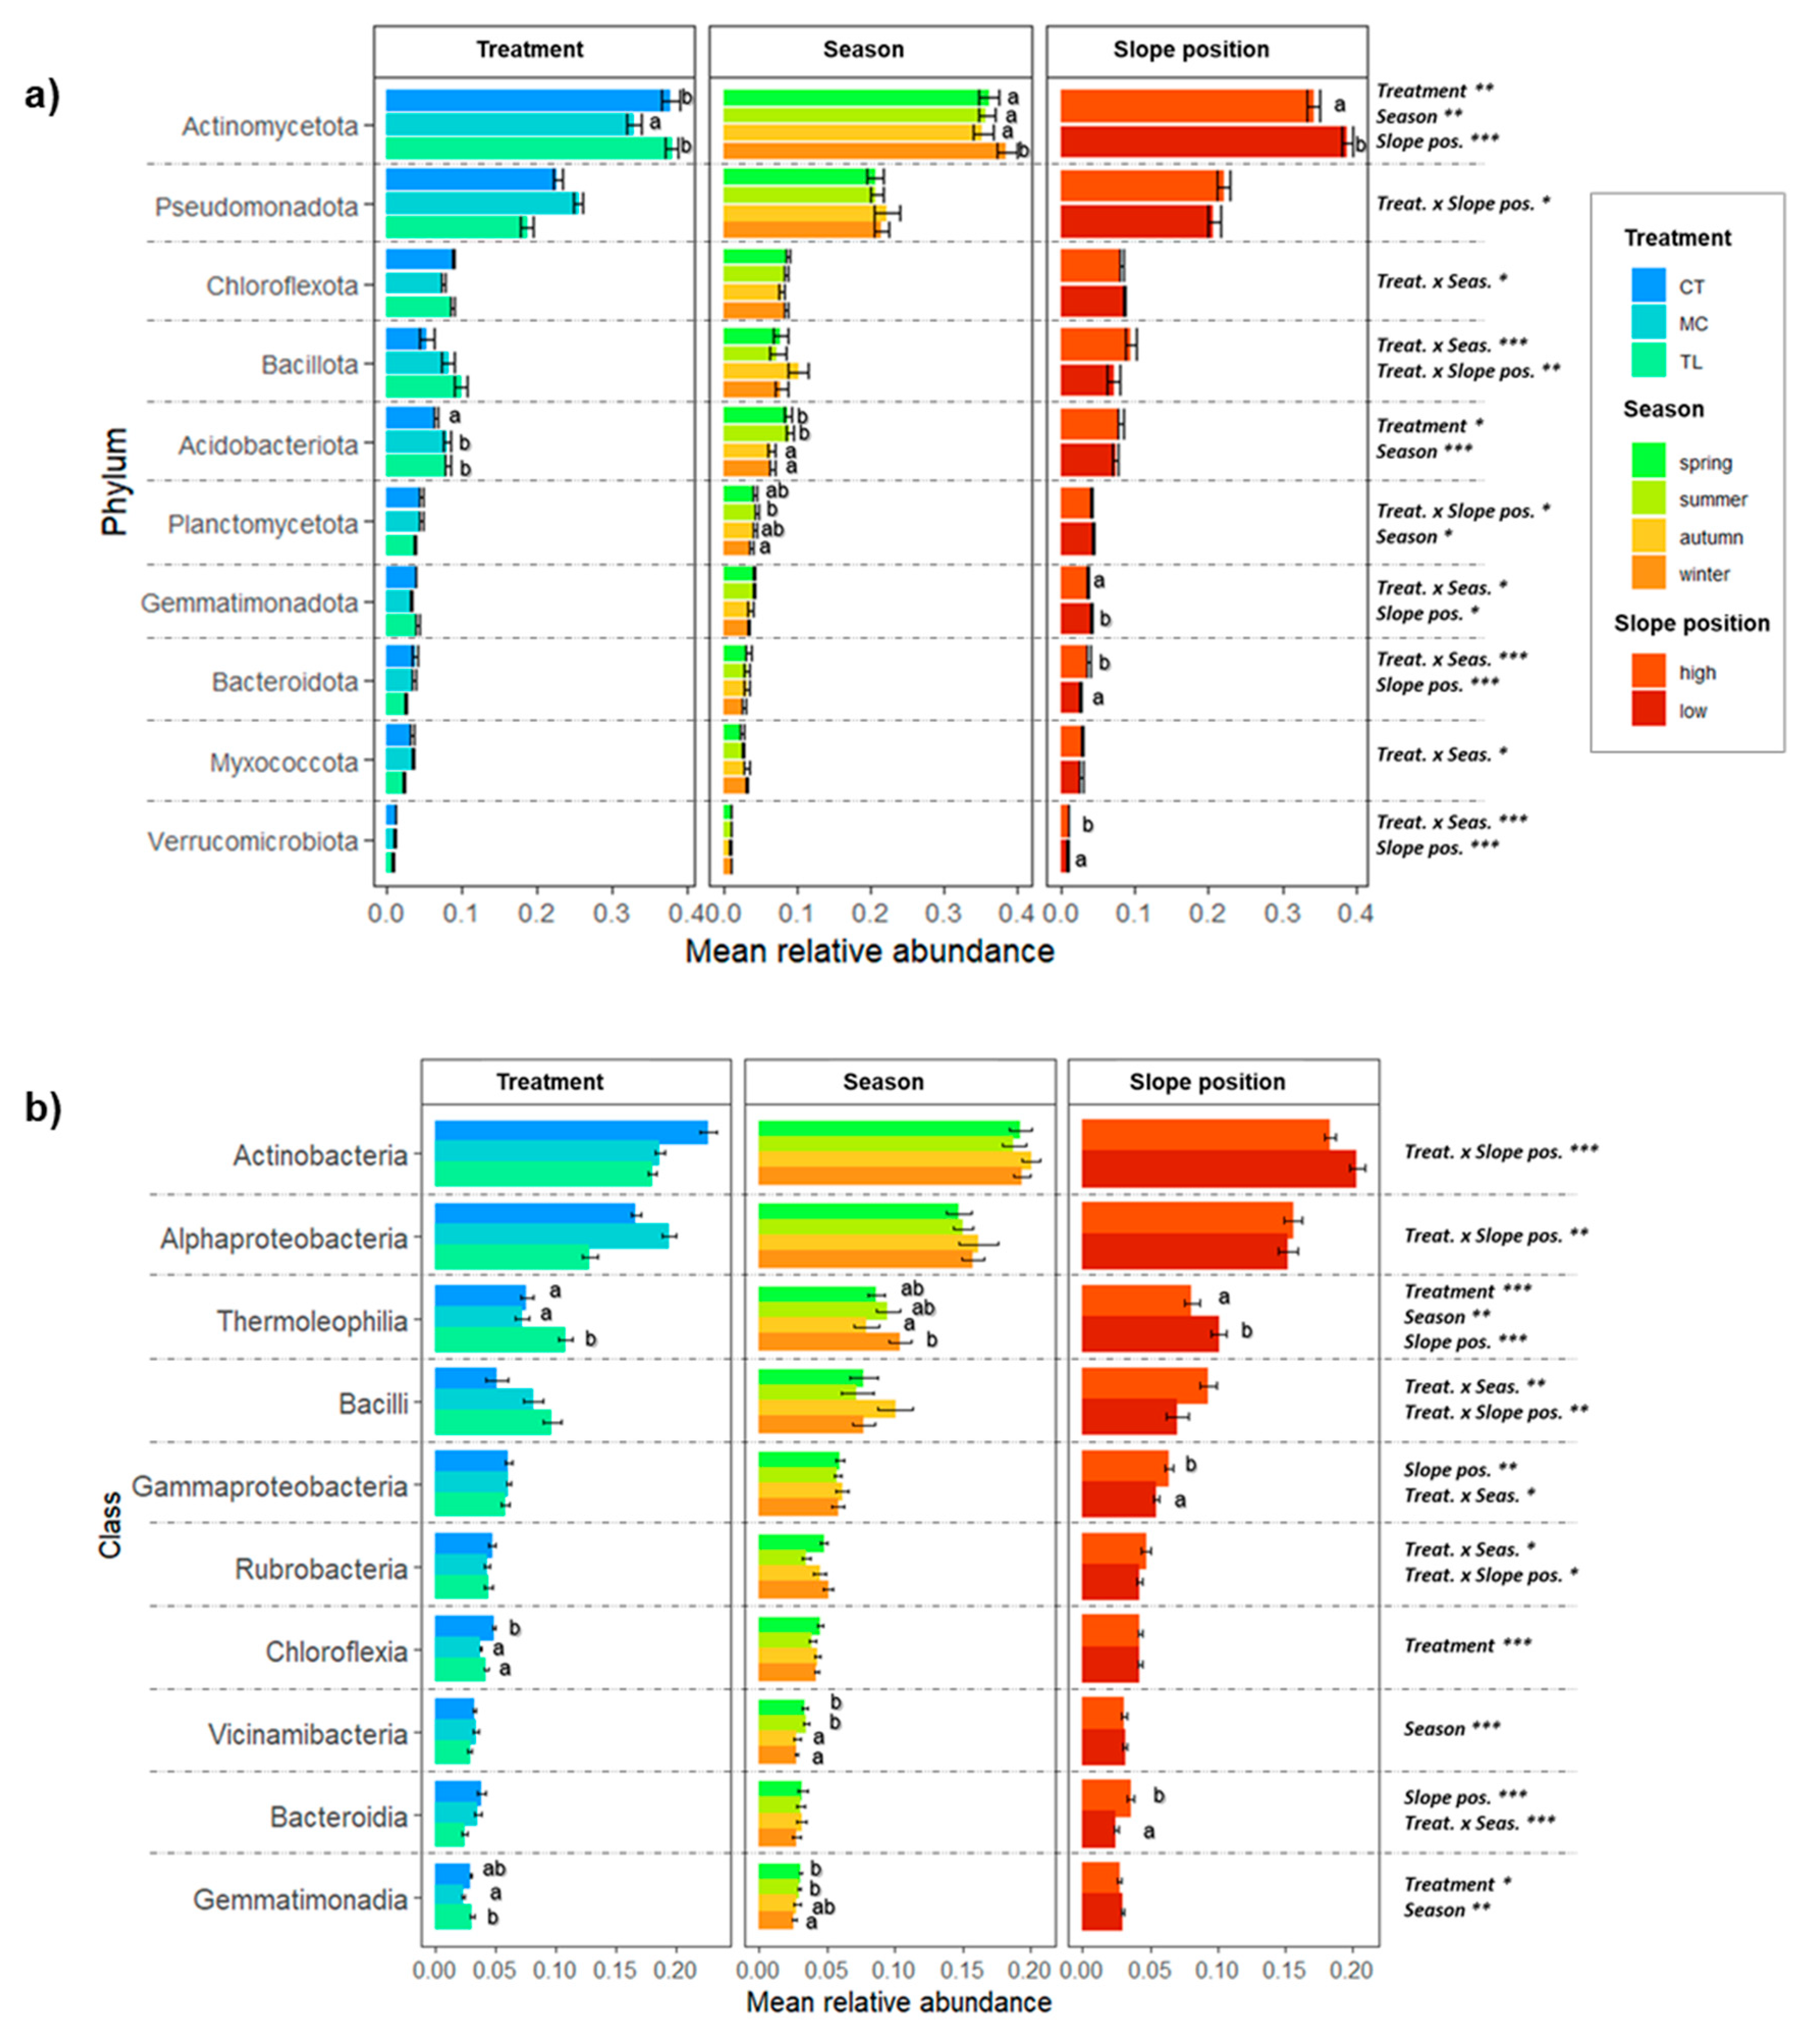
Figure 5.
Alpha and beta diversity of bacterial communities across the studied topsoils from Santa Marta olive orchard (Benacazón, Seville, Spain). Data are presented by treatment (conventional tillage - CT, mixed natural cover - MC, herbicide - TL), seasons, and slope positions (upper and lower slope). (a) Alpha diversity expressed as the Shannon index. (b) Principal Coordinates Analysis (PCoA) based on Bray-Curtis dissimilarities showing differences in bacterial community composition. Panels show seasonal subsets projected onto the same global ordination space; coordinates and axes correspond to a single PCoA performed using all samples. Percentages on axes indicate the proportion of variance explained by each axis.
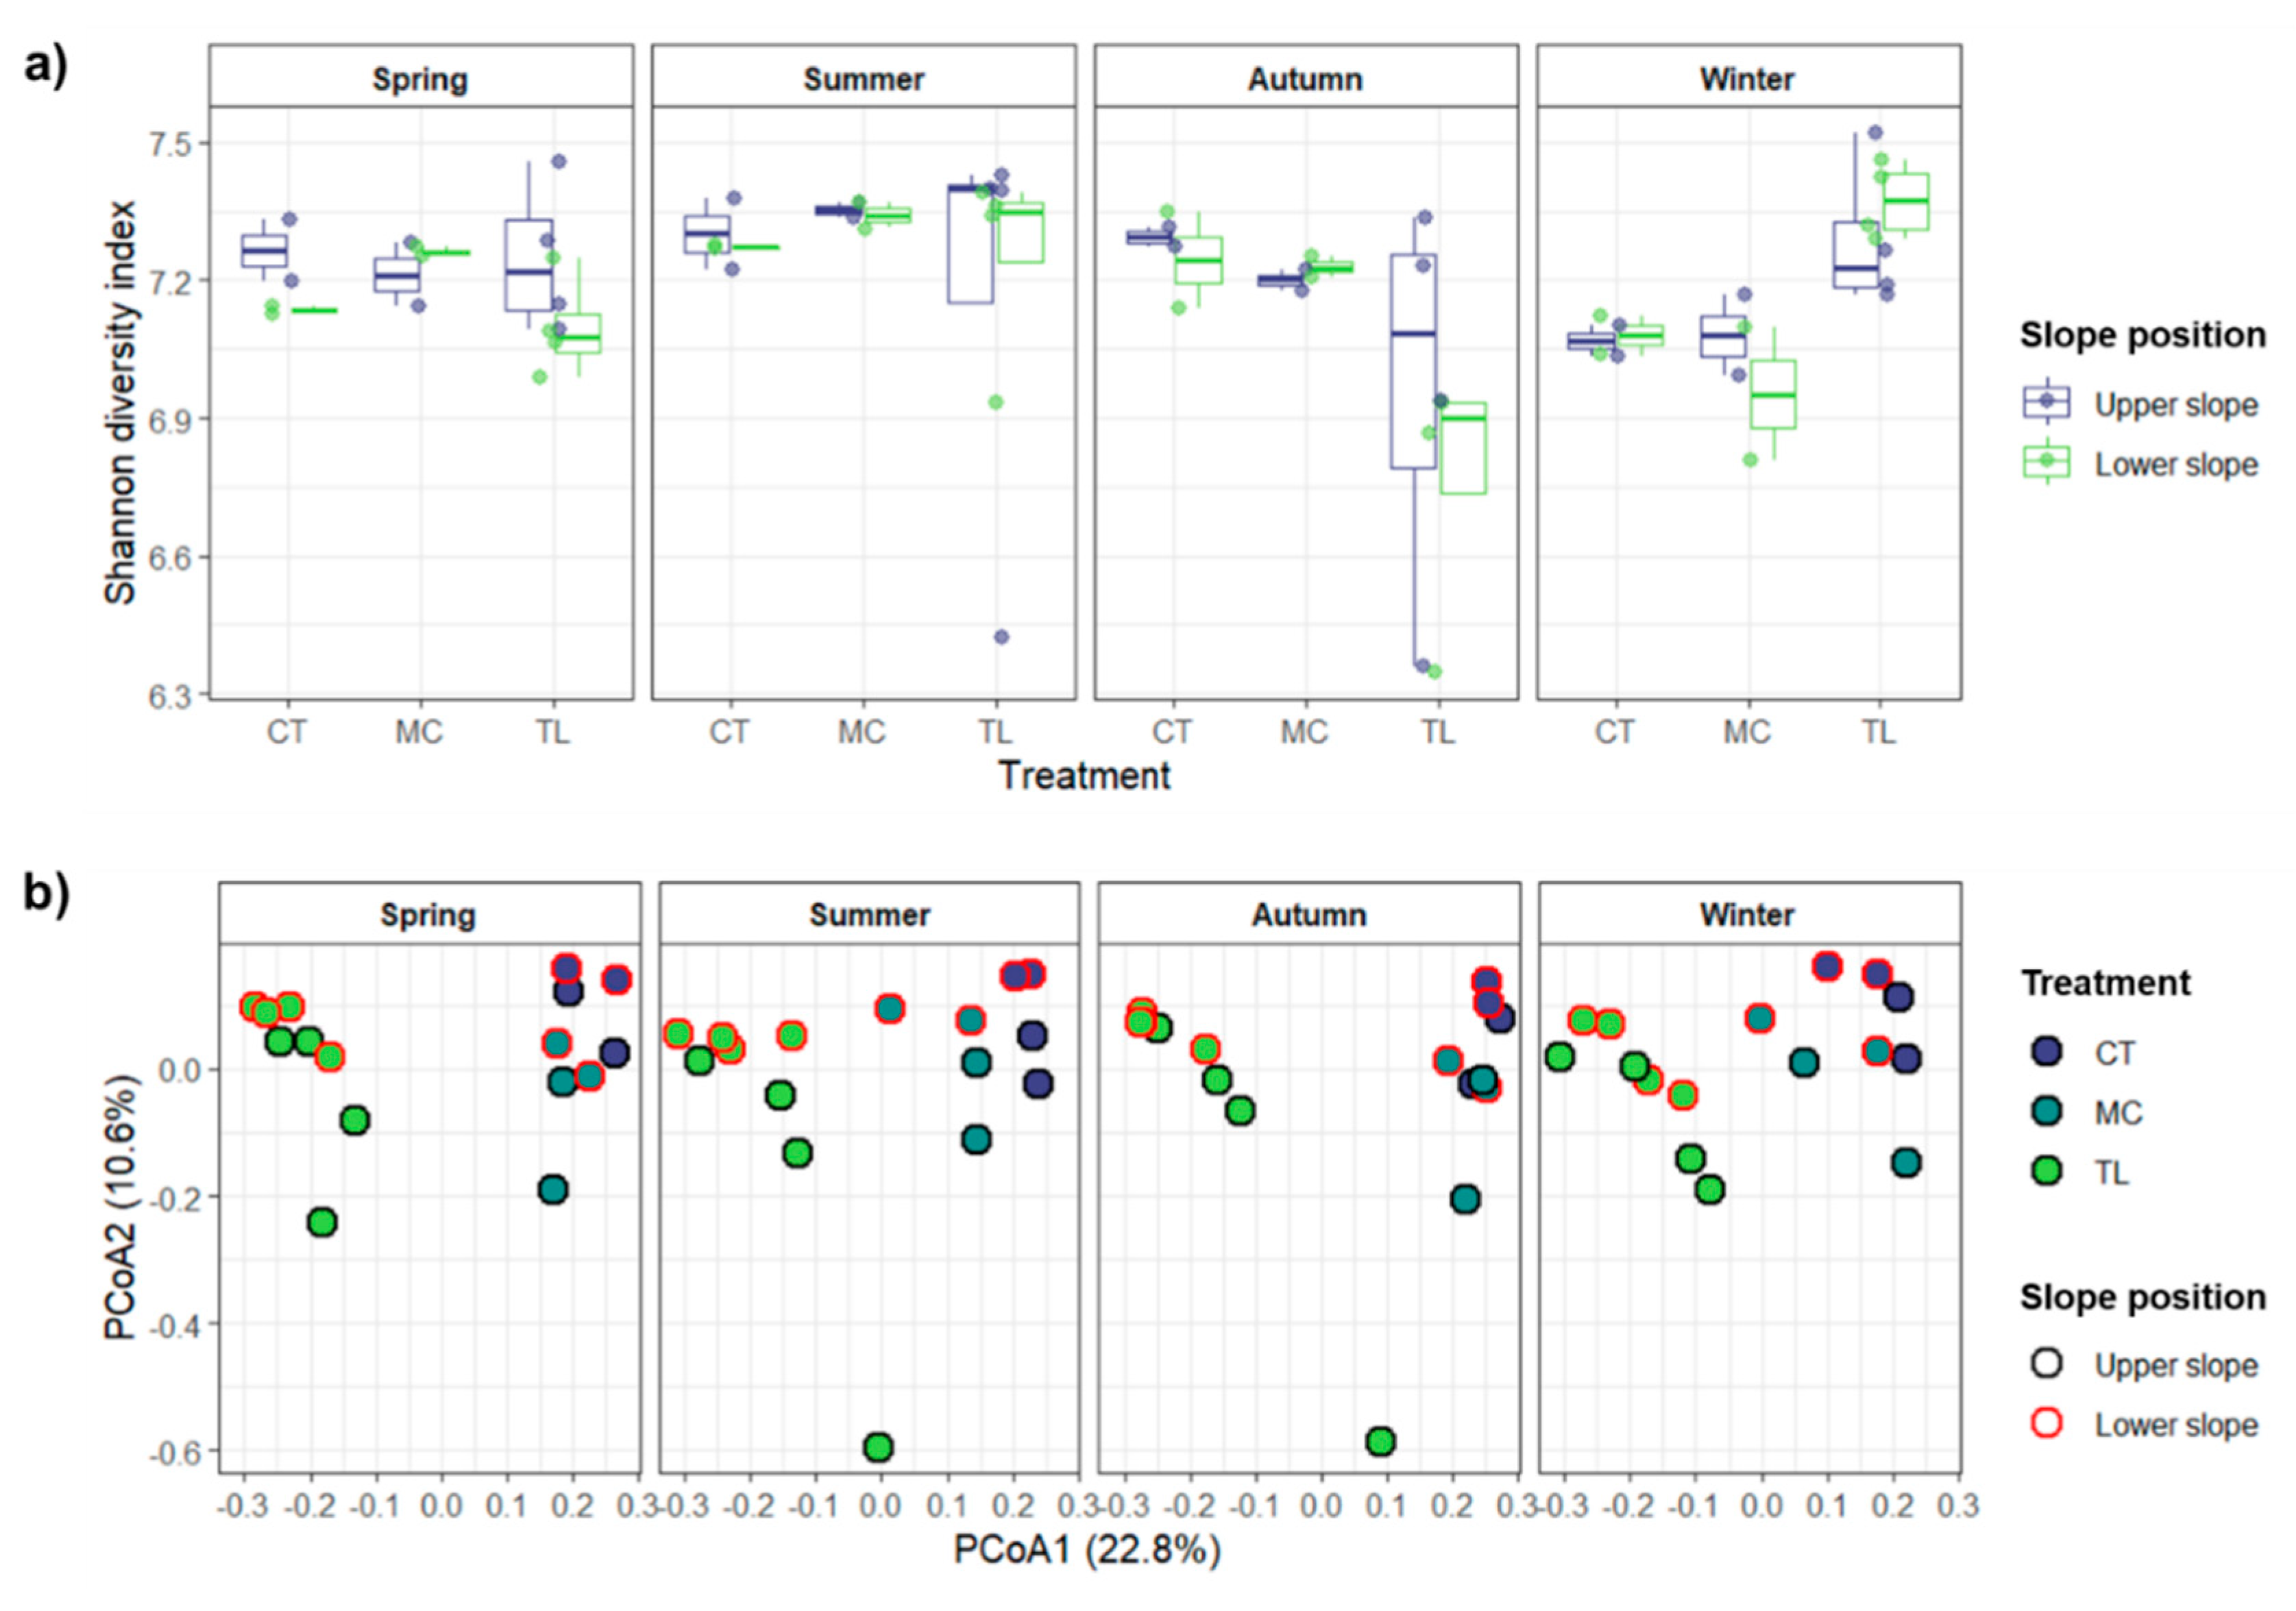
Figure 6.
Correlation analysis between selected soil environmental variables and (a) PLFA, (b) most abundant bacterial phyla and (c) enzymatic activities. Colours indicates the direction of the interaction. Significant interactions with (•) and without (o) FDR correction are indicated.
Figure 6.
Correlation analysis between selected soil environmental variables and (a) PLFA, (b) most abundant bacterial phyla and (c) enzymatic activities. Colours indicates the direction of the interaction. Significant interactions with (•) and without (o) FDR correction are indicated.
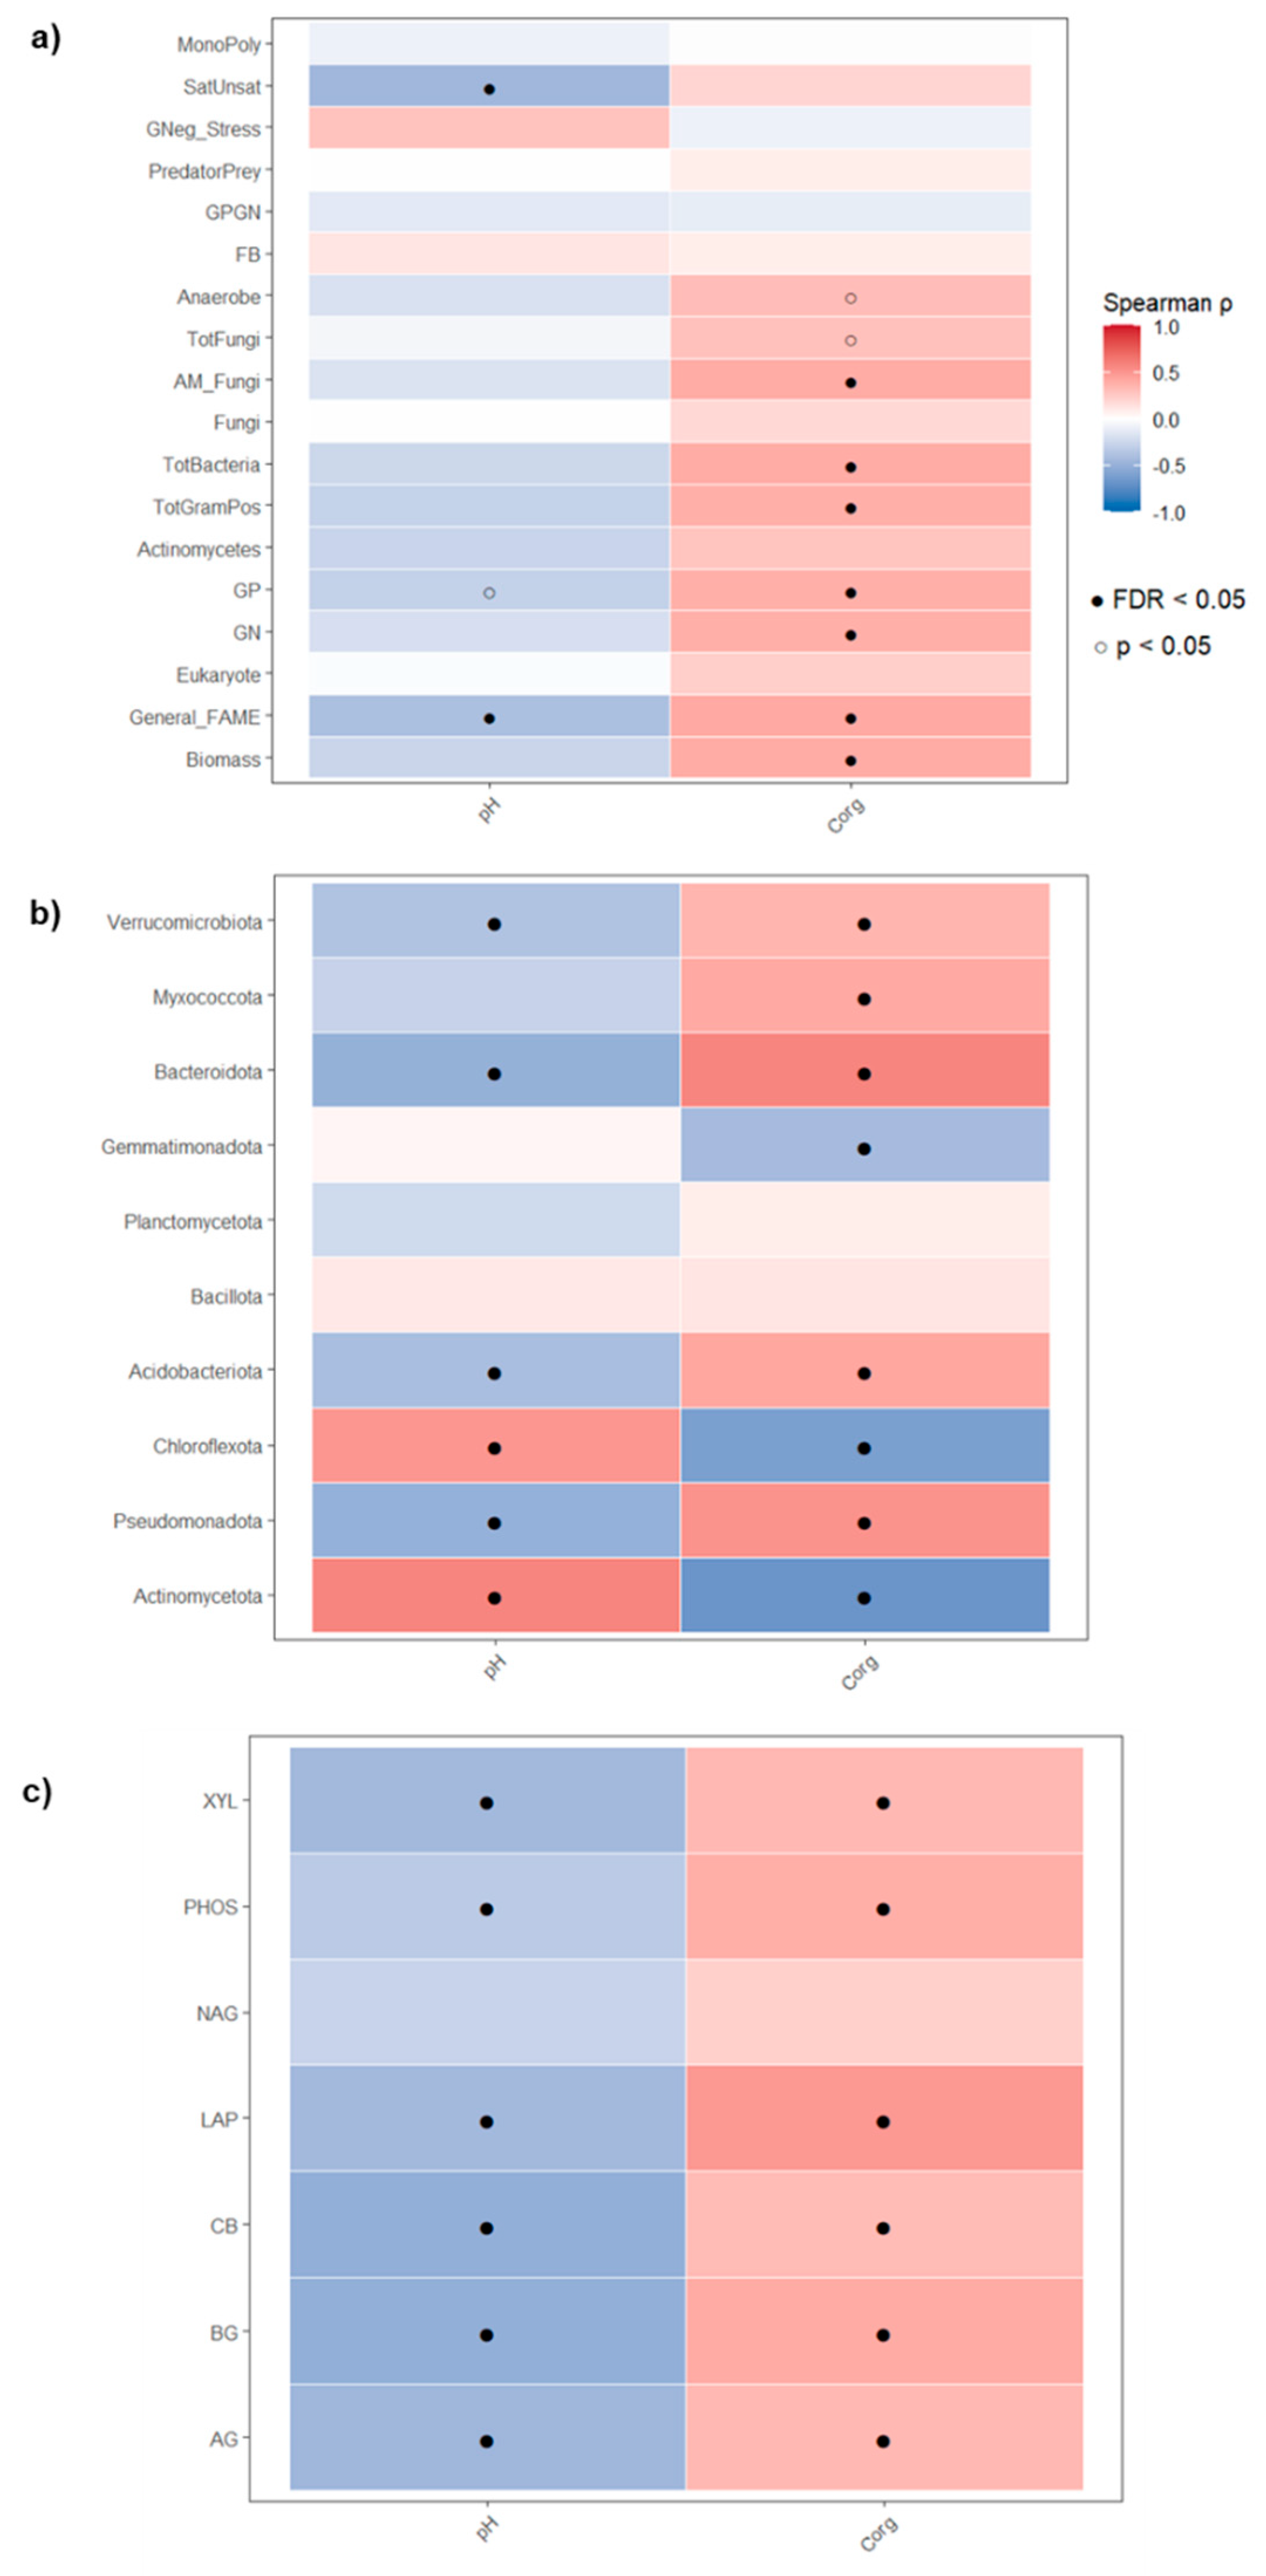
Figure 7.
Redundancy analysis (RDA) showing relationships between bacterial community composition at the phylum level and selected soil environmental variables (pH and SOC) from the Santa Marta olive orchard (Benacazón, Seville, Spain). Arrows represent environmental gradients, with their length indicating the strength of the correlation with the ordination axes. Points represent samples coloured according to treatment (conventional tillage – CT, mixed natural cover – MC, herbicide – TL), season and slope position (high, low). The most abundant bacterial phyla are shown along the ordination axes.
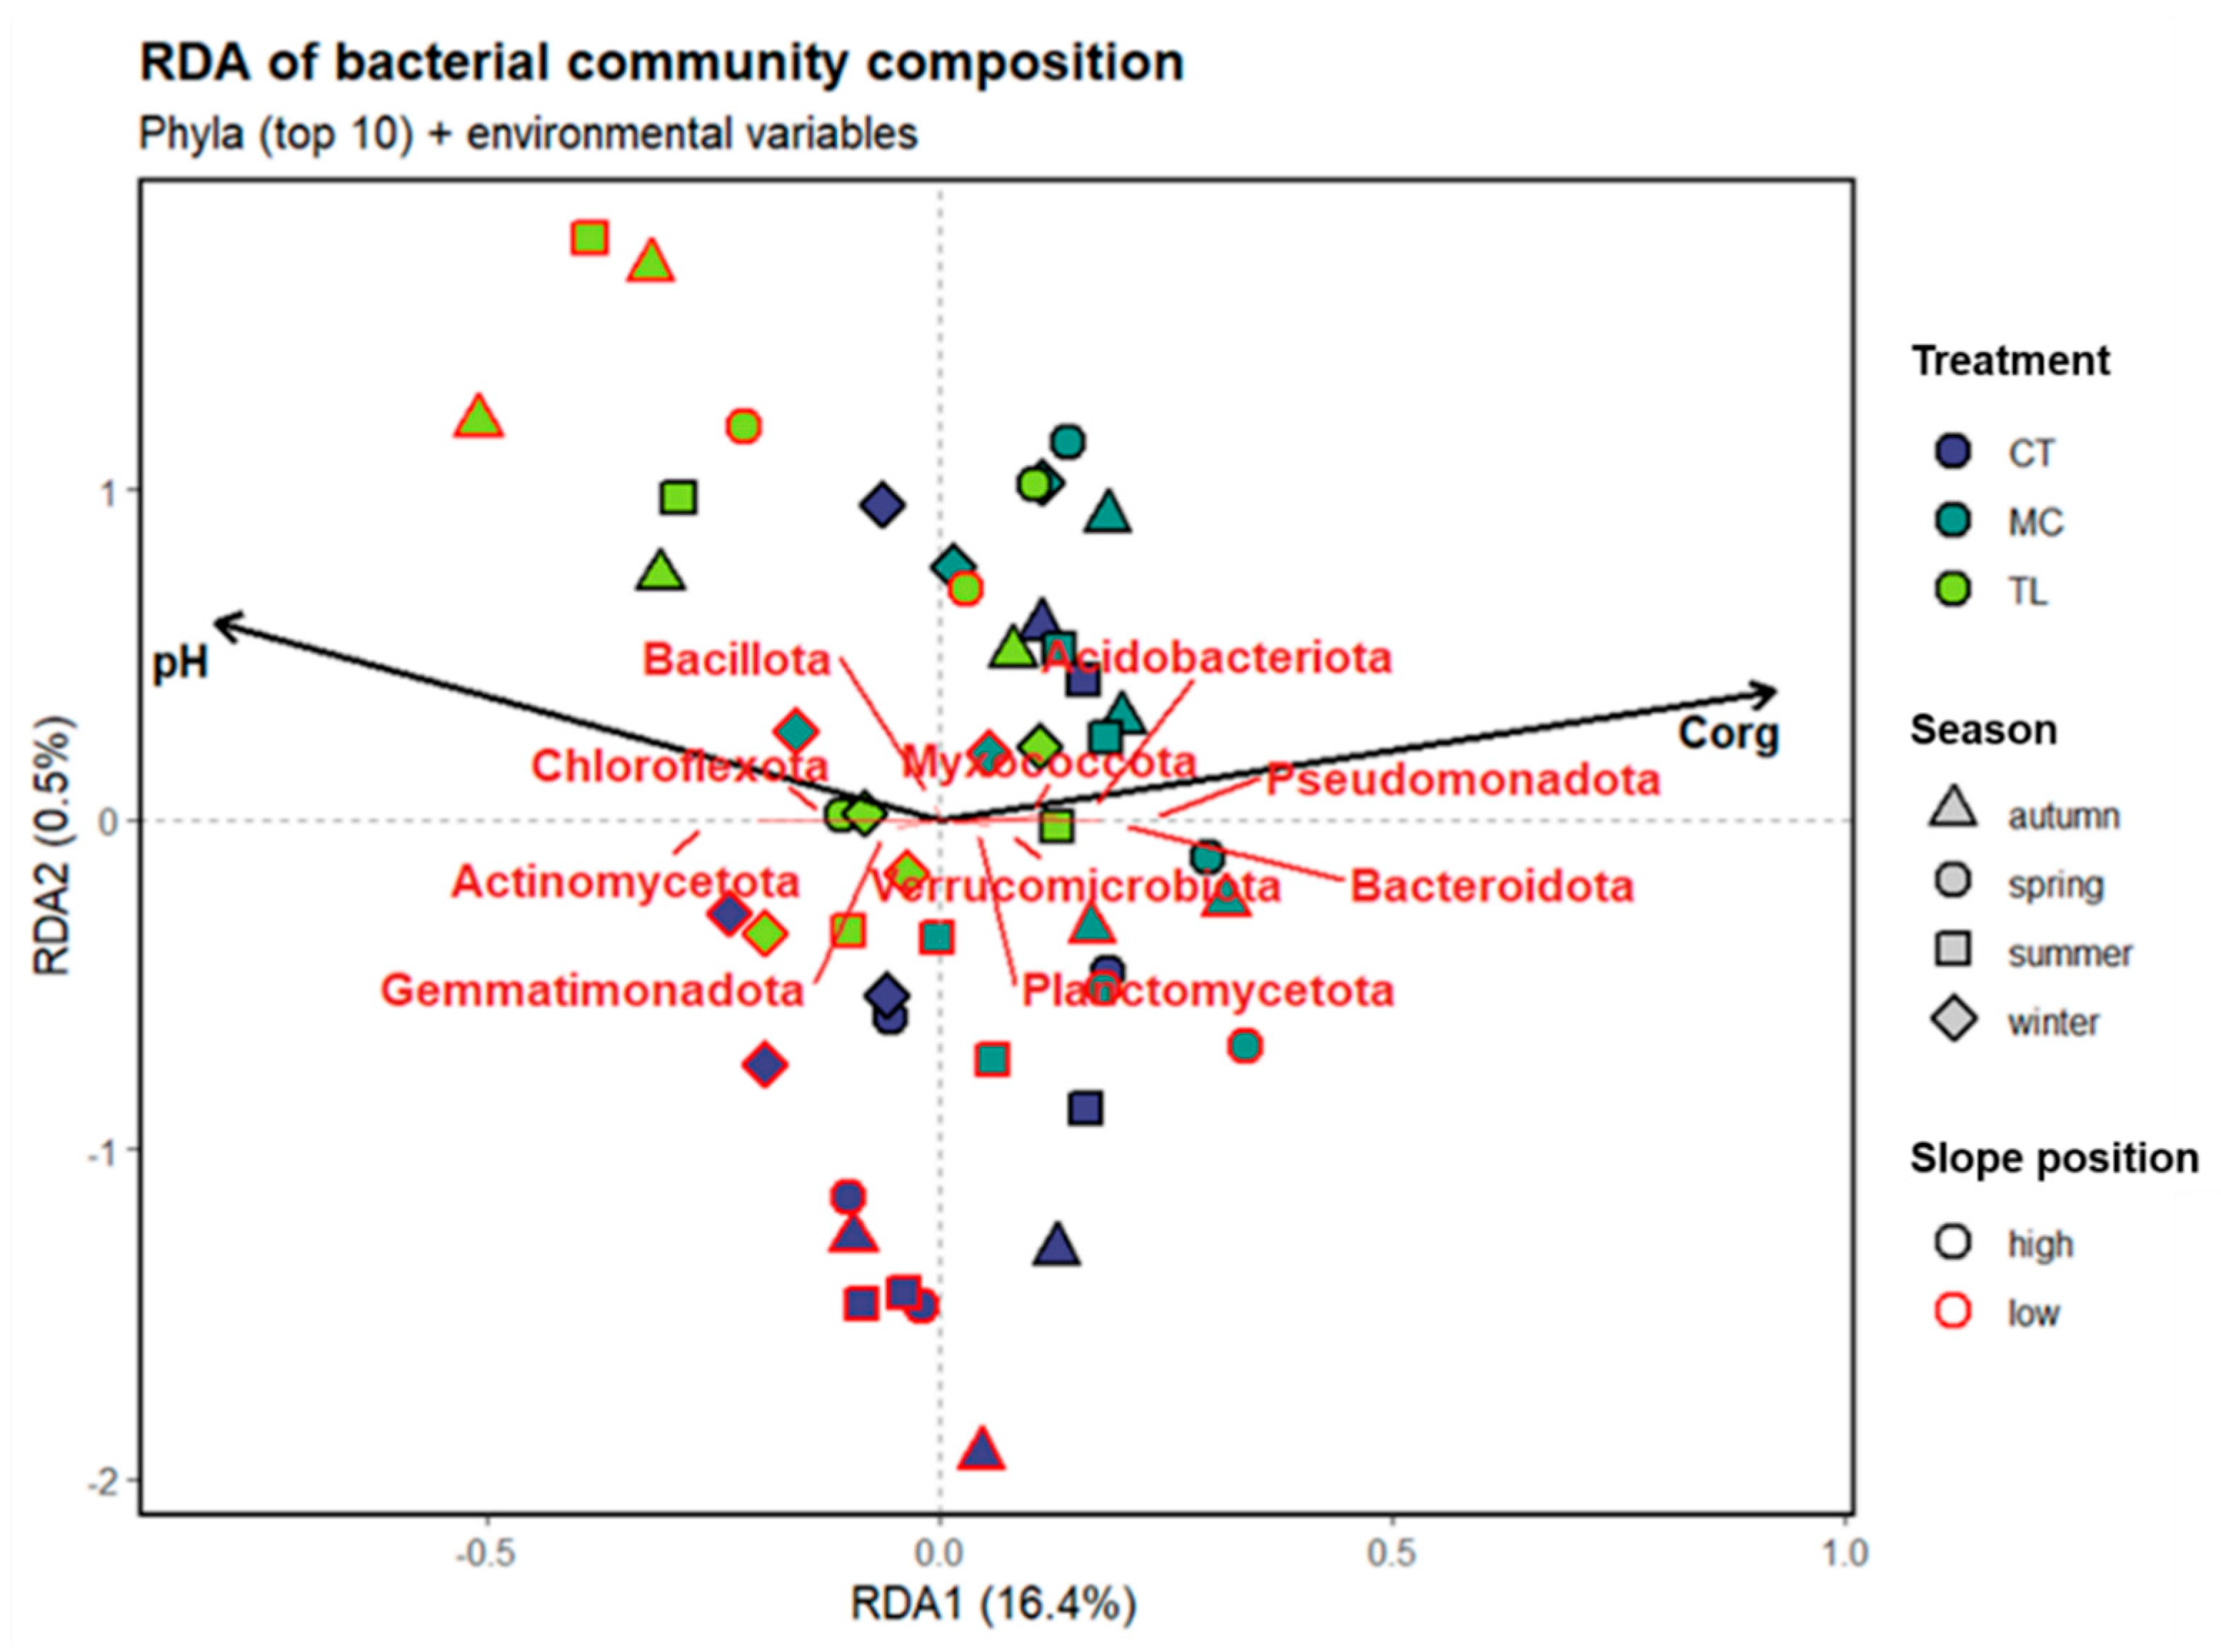

Table 1.
Mean (± SE) soil texture fractions (%) and SOC stock (Mg C ha-1) in the upper 20 cm values across the studied topsoils from Santa Marta olive orchard (Benacazón, Seville, Spain). Data are presented by season, treatment (conventional tillage - CT, mixed natural cover - MC, herbicide - TL), and slope position (upslope, downslope).
| CT | MC | TL | ||||
|---|---|---|---|---|---|---|
| Upslope | Downslope | Upslope | Downslope | Upslope | Downslope | |
| Coarse sand (%) | 26.20 ± 12.30 | 8.15 ± 0.86 | 25.55 ± 10.65 | 7.99 ± 1.23 | 13.20 ± 3.67 | 7.16 ± 1.98 |
| Fine sand (%) | 49.15 ± 6.95 | 50.00 ± 0.90 | 55.10 ± 8.10 | 51.20 ± 2.00 | 67.88 ± 5.70 | 54.08 ± 0.80 |
| Silt (%) | 12.87 ± 3.53 | 27.60 ± 0.60 | 10.83 ± 1.18 | 28.60 ± 0.70 | 10.13 ± 1.56 | 25.03 ± 0.63 |
| Clay (%) | 11.78 ± 1.82 | 14.30 ± 0.60 | 8.53 ± 1.37 | 12.25 ± 1.55 | 8.78 ± 1.16 | 13.75 ± 1.20 |
| SOC stock | 2.25 ± 0.10 | 1.74 ± 0.06 | 4.00 ± 1.81 | 3.61 ± 0.43 | 1.97 ± 0.22 | 1.98 ± 0.47 |
Table 2.
Mean (± SE) soil pH and EC (µS cm-1) values across the studied topsoils from Santa Marta olive orchard (Benacazón, Seville, Spain). Data are presented by season, treatment (conventional tillage - CT, mixed natural cover - MC, herbicide - TL) and by slope position (upslope, downslope).
Table 2.
Mean (± SE) soil pH and EC (µS cm-1) values across the studied topsoils from Santa Marta olive orchard (Benacazón, Seville, Spain). Data are presented by season, treatment (conventional tillage - CT, mixed natural cover - MC, herbicide - TL) and by slope position (upslope, downslope).
| Spring | Summer | Autumn | Winter | ||||||
|---|---|---|---|---|---|---|---|---|---|
| Upslope | Downslope | Upslope | Downslope | Upslope | Downslope | Upslope | Downslope | ||
| pH | CT | 8.11 ± 0.02 | 8.09 ± 0.03 | 7.95 ± 0.04 | 8.00 ± 0.03 | 8.14 ± 0.03 | 8.172 ± 0.05 | 8.22 ± 0.01 | 8.25 ± 0.01 |
| MC | 7.98 ± 0.04 | 7.99 ± 0.04 | 8.02 ± 0.05 | 7.98 ± 0.02 | 7.88 ± 0.14 | 7.84 ± 0.19 | 8.21 ± 0.06 | 8.19 ± 0.08 | |
| TL | 8.13 ± 0.08 | 8.16 ± 0.04 | 8.01 ± 0.18 | 8.05 ± 0.05 | 8.22 ± 0.08 | 8.23 ± 0.04 | 8.22 ± 0.01 | 8.22 ± 0.03 | |
| EC | CT | 132.33 ± 13.23 | 139.13 ± 10.38 | 139.05 ± 20.05 | 114.25 ± 2.40 | 121.95 ± 7.95 | 123.93 ± 2.18 | 119.58 ± 2.73 | 112.35 ± 4.95 |
| MC | 147.90 ± 8.10 | 155.48 ± 10.18 | 143.28 ± 9.28 | 154.95 ± 16.00 | 142.10 ± 1.95 | 156.95 ± 15.20 | 122.65 ± 8.25 | 131.40 ± 12.40 | |
| TL | 147.75 ± 13.20 | 139.95 ± 4.65 | 142.60 ± 25.70 | 177.78 ± 51.73 | 116.83 ± 5.48 | 105.50 ± 0.15 | 115.90 ± 2.75 | 113.53 ± 4.18 | |
Table 3.
Mean (± SE) total C content (TC, %), soil organic C (SOC, %), total nitrogen (TN, %), total phosphorus (TP, mg kg-1) and organic matter (OM, %) across the studied topsoils from Santa Marta olive orchard (Benacazón, Seville, Spain). Data are presented by season, treatment (conventional tillage - CT, mixed natural cover - MC, herbicide - TL) and by slope position (upslope, downslope).
| Spring | Summer | Autumn | Winter | ||||||
|---|---|---|---|---|---|---|---|---|---|
| Upslope | Downslope | Upslope | Downslope | Upslope | Downslope | Upslope | Downslope | ||
| TC | CT | 2.79 ± 0.56 | 5.08 ± 0.07 | 2.76 ± 0.71 | 5.11 ± 0.18 | 2.59 ± 1.40 | 5.21 ± 0.18 | 3.02 ± 0.62 | 5.10 ± 0.19 |
| MC | 3.11 ± 1.30 | 5.63 ± 0.15 | 2.19 ± 1.13 | 5.42 ± 0.29 | 2.78 ± 1.29 | 5.71 ± 0.21 | 2.12 ± 0.78 | 5.33 ± 0.17 | |
| TL | 3.26 ± 0.80 | 4.66 ± 0.49 | 2.91 ± 0.46 | 4.70 ± 0.51 | 2.84 ± 0.40 | 4.80 ± 0.50 | 2.77 ± 0.61 | 4.83 ± 0.24 | |
| SOC | CT | 0.91 ± 0.04 | 0.70 ± 0.02 | 1.08 ± 0.14 | 0.68 ± 0.03 | 0.75 ± 0.09 | 0.81 ± 0.04 | 0.97 ± 0.49 | 0.57± 0.06 |
| MC | 1.83 ± 0.84 | 1.64 ± 0.21 | 1.05 ± 0.30 | 0.92 ± 0.20 | 1.51 ± 0.16 | 1.55 ± 0.41 | 1.11 ± 0.00 | 0.95 ± 0.17 | |
| TL | 0.84 ± 0.13 | 0.84 ± 0.18 | 1.49 ± 0.31 | 0.67 ± 0.10 | 1.05 ± 0.41 | 0.47 ± 0.02 | 0.91 ± 0.18 | 0.91 ± 0.42 | |
| TN | CT | 0.07 ± 0.01 | 0.06 ± 0.00 | 0.10 ± 0.01 | 0.06 ± 0.00 | 0.07 ± 0.00 | 0.07 ± 0.00 | 0.09 ± 0.02 | 0.059 ± 0.01 |
| MC | 0.14 ± 0.04 | 0.14 ± 0.01 | 0.09 ± 0.03 | 0.09 ± 0.02 | 0.14 ± 0.00 | 0.16 ± 0.05 | 0.09 ± 0.00 | 0.10 ± 0.02 | |
| TL | 0.07 ± 0.00 | 0.08 ± 0.02 | 0.07 ± 0.02 | 0.07 ± 0.00 | 0.09 ± 0.02 | 0.06 ± 0.00 | 0.08 ± 0.00 | 0.10 ± 0.02 | |
| TP | CT | 246.81 ± 29.21 | 202.43 ± 9.23 | 280.95 ± 106.73 | 199.80 ± 1.52 | 251.30 ± 31.78 | 211.91 ± 10.80 | 258.22 ± 8.28 | 193.95 ± 7.71 |
| MC | 283.52 ± 95.62 | 307.36 ± 29.11 | 258.83 ± 73.99 | 226.60 ± 9.71 | 258.94 ± 6.05 | 277.97 ± 41.65 | 294.14 ± 38.29 | 200.48 ± 9.33 | |
| TL | 277.78 ± 0.27 | 307.11 ± 63.13 | 238.34 ± 40.38 | 246.50 ± 59.24 | 318.47 ± 44.79 | 206.70 ± 12.55 | 307.42 ± 7.16 | 299.57 ± 65.00 | |
| OM | CT | 1.56 ± 0.07 | 1.21 ± 0.04 | 1.87 ± 0.25 | 1.18 ± 0.05 | 1.29 ± 0.16 | 1.39 ± 0.07 | 1.67 ± 0.85 | 0.98 ± 0.11 |
| MC | 3.15 ± 1.45 | 2.83 ± 0.37 | 1.80 ± 0.52 | 1.58 ± 0.35 | 2.60 ± 0.27 | 2.68 ± 0.71 | 1.91 ± 0.00 | 1.65 ± 0.30 | |
| TL | 1.45 ± 0.25 | 1.45 ± 0.30 | 2.57 ± 0.53 | 1.15 ± 0.17 | 1.80 ± 0.71 | 0.81 ± 0.03 | 1.57 ± 0.31 | 1.57 ± 0.73 | |
Disclaimer/Publisher’s Note: The statements, opinions and data contained in all publications are solely those of the individual author(s) and contributor(s) and not of MDPI and/or the editor(s). MDPI and/or the editor(s) disclaim responsibility for any injury to people or property resulting from any ideas, methods, instructions or products referred to in the content. |
© 2026 by the authors. Licensee MDPI, Basel, Switzerland. This article is an open access article distributed under the terms and conditions of the Creative Commons Attribution (CC BY) license (http://creativecommons.org/licenses/by/4.0/).
Copyright: This open access article is published under a Creative Commons CC BY 4.0 license, which permit the free download, distribution, and reuse, provided that the author and preprint are cited in any reuse.