

Submitted:
13 October 2026
Posted:
14 October 2026
You are already at the latest version
Abstract
A common acoustic treatment for ordinary public spaces, such as schools, offices, and healthcare facilities, is a suspended absorbent ceiling. The non-uniform distribution of absorption and the effects of furniture and interior fittings in these rooms present challenges for calculation models and simulation software. Furthermore, the acoustic data provided by manufacturers is often limited to a practical absorption coefficient, which is insufficient for the accurate characterisation of acoustic conditions. This paper presents an energy model for calculating room acoustic parameters such as reverberation time, speech clarity, and sound strength. The energy decay calculation is based on subdividing the sound field into grazing and non-grazing parts. The grazing part refers to sound waves that propagate almost parallel to the ceiling. This approach accounts for the ceiling's angle-dependent absorption, as well as the scattering and absorption effects of furnishings. This model improves on and simplifies an earlier model. For practical use, tables are provided for grazing ceiling absorption and the absorbing and scattering effects of furnishings. The model has been validated by comparing it with measurements taken in 45 different room configurations. The new model produces results that are more in line with measurements than the classical Sabine model.
Keywords:
room acoustics
; reverberation time
; absorption
; scattering
; speech clarity
; sound strength
1. Introduction
A pleasant and well-functioning workplace depends on a good acoustic environment. Poor sound environments can cause stress and discomfort and have a negative effect on learning and concentration. Exposure to noise in general also harms our health [1,2]. National and international standards provide guidance and requirements on how to regulate the acoustics in our workplaces.
Room acoustic parameters are used to objectively characterise acoustic conditions and establish target values that meet desired acoustic qualities. The most common parameter in regulations and standards is reverberation time, though some standards [3] also include other parameters defined in [4,5,6]. The model presented in this paper calculates parameters related to reverberation time, speech clarity, and sound strength. However, since the model calculates energy decay, other related properties can also be estimated.
This paper will focus on ordinary public rooms, such as those found in educational, office, and healthcare premises. An absorbent ceiling is a common acoustic treatment in these types of rooms. Henceforth, these rooms will be referred to as 'ordinary rooms'. The non-uniform distribution of absorption in these rooms presents challenges for energy-based calculation models, such as the Sabine formula, as well as for simulation models that use geometrical methods, such as ray tracing or image source models. One reason for these difficulties is that sound absorption depends on the incidence angle. Consequently, it is not always accurately represented by the statistical or practical absorption coefficient provided by manufacturers. In rooms with ceiling treatment, dissipative losses from furniture and other interior fittings are also a factor, as is the directional scattering effect of the furnishings. The scattering effects are particularly pronounced if the ceiling is highly absorbent. This effect is not addressed in common engineering models used to calculate reverberation times. Consequently, there are significant discrepancies between measurements and estimations using Sabine's formula, particularly in sparsely furnished rooms with absorbent ceiling treatments. This can sometimes lead to misleading results regarding the effect of acoustic treatment, as will be demonstrated later in the Results section.
This article presents an energy model for calculating three room acoustic parameters: reverberation time T20, sound strength G, and speech clarity C50. These parameters are defined in ISO 3382–1/2 [4,5]. The model is based on subdividing the sound field into grazing and non-grazing parts. The grazing part comprises waves travelling almost parallel to the ceiling, and the non-grazing part comprises the remaining waves. The model presented here is a simplified version of a more thorough model presented in [7]. This subdivision enables the angle-dependent properties of the ceiling absorber, as well as the dissipative losses and scattering effects of furnishings, to be accounted for. The main purpose of the simplification is to create a more practical and useful model for which input data is readily available from manufacturers. The input data used in the model that is not commonly known is provided in tables. These include the grazing absorption coefficients of the ceiling absorber, as well as the scattering and absorption data for furnishings. The furnishing data is categorised as sparse, normal, or dense. Examples of these furnishing types will be discussed later. In general, they will cover most furnishing cases encountered in practice. The model has been specially adapted to manage ordinary rooms with absorbent ceilings, as well as the influence of interior design on these rooms.
Many measurements have been performed. Calculations using the model have been compared with the measurements, as well as with predictions using Sabine's formula.
2. Background
Over time, many energy formulas have been suggested for calculating reverberation times. Since Sabine's discovery [8], the extensive use of his formula has highlighted its limitations, mainly because it has been applied to cases that do not fulfil the basic requirements behind the formula. This is also recognised in textbooks [9,10], which discuss the lack of diffusion and non-uniform distribution of absorption as reasons for deviations. Fitzroy presents an empirically derived formula for the reverberation time in rooms with a non-uniform distribution of absorption [11]. Neubauer [12] presents a modified version of Fitzroy’s formula. The Arau-Puchades formula [13] also deals with the non-uniform distribution of absorption. Nilsson [14,15] presented a model developed for rooms with a suspended absorbent ceiling. Non-diffuse conditions were addressed by introducing two sound fields related to grazing and non-grazing sound waves. The concept of dividing the sound field into grazing and non-grazing components was also adopted in [16]. However, the way scattering is introduced in [16] makes these parameters difficult to estimate. The above formulas estimate the reverberation time from linear decay curves. Zhou et al. [17] estimated total decay based on three-dimensional energy decay in combination with a diffuse sound field. This accounts for the nonlinear decay often observed in rooms where most of the absorption is concentrated on the ceiling.
In [18], Sakuma uses the image source method to group the image sources as axial, tangential, and oblique, which correspond to the normal modes in wave acoustics. Scattering is considered by introducing the scattering coefficient. The results demonstrate the nonlinear decay in rooms with a non-uniform distribution of absorption, while highlighting the importance of scattering.
A general issue with the above energy models is how to evaluate the scattering and absorption effects of furniture. Scattering in simulation models is often based on experience and educated guesses, rather than measurements. The frequency dependence of scattering differs from dissipative losses. In the present model, the dissipative and scattering effects of furnishings are accounted for by introducing a parameter called the equivalent scattering absorption area Asc. Subdividing the sound field into grazing and non-grazing parts, in the sense of an SEA (Statistical Energy Analysis) approach, suggests how it can be estimated from measurements.
Many reverberation time formulas use statistical absorption coefficients as input data, thereby only accounting for dissipative losses. This is not surprising, given that most manufacturers of absorbent products provide data measured according to ISO 354 [19], which is often simplified into a practical absorption factor αp in ISO 11254 [20]. However, the non-isotropic properties of sound fields in rooms with ceiling treatment differ from the almost diffuse conditions in reverberation chambers. In accordance with this model, additional data incorporating angle-dependent absorption for the ceiling absorber is provided. This data is empirical and based on measurements taken in various practical settings involving different ceiling properties. The data is presented in Appendix A, Table A3. The theoretical basis was discussed in [7].
Another important consequence of spaces with non-uniform sound fields is the need to investigate several parameters that shed light on various aspects of the acoustic conditions. When evaluating reverberation times T20 and T30 according to ISO 3382-2 [5], dynamic ranges of −5 to −25 dB and −5 to −35 dB are used, respectively. This means that the early reflections of the impulse response are neglected. Consequently, T20 and T30 are often referred to as late reverberation times. In rooms with absorbent ceiling treatments, late reverberation times are often related to energy travelling in the horizontal plane in relation to the absorbent ceiling. Under these circumstances, the reverberation curve is often double-sloped, with a less steep inclination in the latter part. The late part is affected by the scattering effects of furniture to a higher degree than the early part. In fact, since T20 and T30 are related to late reverberation times and ignore the initial decay phase, two rooms with similar reverberation times may differ in terms of parameters such as speech clarity C50 and sound strength G, which consider the initial decay phase. Therefore, it is important to evaluate parameters other than reverberation time in ordinary rooms. This will be illustrated in the Results section.
This paper presents a simplified calculation model for rooms with ceiling treatments, providing estimates of a few room acoustic parameters that are important for subjective perception. The model is based on [7], but is simplified in that it uses simplified, readily available data. The additional data required by the model is provided in the tables, which cover cases of practical interest.
The former model presented in [7] is restricted in that ceiling absorption must exceed a minimum level. The present model does not have this restriction and can manage all types of ceilings. As ceiling absorption decreases, the sound field becomes more uniform and dissipative losses dominate, causing the model to approach the results of the Sabine formula. This will be demonstrated in the Results section.
The aim is to provide users with a model that estimates room acoustic parameters consistently with measurements in ordinary rooms with ceiling treatment, while emphasising phenomena that influence the subjective perception of acoustics.
The model and the parameters used are physically interpretable and can be estimated by measurements. Tables concerning the grazing absorption coefficients of ceiling absorbers and the equivalent scattering absorption area of furnishings, as well as the equivalent absorption area of furnishings, are presented in Appendix A.
3. Model
As previously mentioned, the model is based on dividing the sound field into horizontal (grazing) and non-horizontal (non-grazing) parts. ‘Grazing' refers to sound waves that travel almost parallel to the ceiling and floor surfaces. The remaining sound waves comprise the non-grazing part. The non-grazing part is considered a three-dimensional (3D) sound field, while the grazing part is considered a two-dimensional (2D) sound field. However, the effect of ceiling absorption on the 2D field is also considered. This is quantified by a grazing absorption coefficient, αg. The scattering effect of furnishings is treated as an energy transfer from the 2D field to the 3D field. This is quantified by an equivalent scattering absorption area Asc, which comprises both the scattering and dissipative effects of the furnishings. These parameters will be discussed further.
3.1. Grazing and Non-Grazing Sound Fields
Figure 1 illustrates the total sound decay as the sum of the grazing and non-grazing sound fields. In this case, the direct sound has been omitted. The total decay curve is the sum of the energies in the two sound fields. The late part of the decay curve is determined by the grazing field, and this part often defines the reverberation times in rooms with ceiling treatment. In the initial stages of the decay, both sound fields contribute. However, the non-grazing field often dominates this part. Thus, both sound fields affect parameters related to the early part of the decay, such as speech clarity C50 and sound strength G. Increasing diffusion in the room, e.g., through furnishings, will cause the grazing decay to approach the non-grazing part.
The total decay curve expressed as sound intensity at a position r is given by
The first term describes the direct sound, while the remaining terms describe the decay of the non-grazing and grazing sound fields. Tng and Tg are the reverberation times of the non-grazing and grazing sound fields, respectively. The factor C is related to the energy ratio between the grazing and non-grazing sound fields. W represents the power from the sound source. Equation 1 forms the basis of the model, and its inherent parameters will be discussed in more detail below.
Subdividing the sound field enables us to consider the sound-absorbing and sound-scattering effects of furniture and other interior fittings. In a room with an absorbent suspended ceiling, furnishings will have a significant impact on the reverberation time. Even if the furniture itself is not particularly sound absorbing, the reverberation time will differ significantly with and without it. This is due to the sound-dispersing effect of furniture. In the model, this is addressed by quantifying the transfer of sound energy from the grazing to the non-grazing sound field.
The non-grazing sound field can be described as a three-dimensional (3D) diffuse sound field. In this case, Sabine's formula works quite well in describing the reverberation time.
Tng is the reverberation time of the non-grazing sound field. V is the room volume. As is the total equivalent absorption area of the room surfaces, Afurn is the equivalent absorption area of furniture and other interior fittings, and Aair = 4mV is the air absorption, where m is the energy attenuation constant in air. Sabine's formula only considers absorption as an acoustic design parameter. The influence of sound dispersion from furniture is not included in Equation 2.
In the grazing sound field, however, diffusivity changes because the amount and type of furniture disperse sound energy into the non-grazing sound field. The amount of transmitted energy that is absorbed depends on the total absorption in the non-grazing sound field. If the absorption in the room is small, the effect of sound dispersion will also be small. Conversely, if the absorption in the 3D sound field is significantly greater than in the 2D grazing field, the effect of sound dispersion will be significant. In furnished rooms with absorbent suspended ceilings, energy loss due to sound dispersion often dominates the usual dissipative losses in the 2D field.
The reverberation time in the grazing sound field is given by
The factor of 0.127 arises from the assumption that the grazing sound field is 2D diffuse. The term Asc describes the sound dispersing and sound absorbing effects of furniture and other objects in the grazing sound field and is called the equivalent scattering absorption area. This can be estimated via measurement, which we will return to shortly. Ag describes the effect of the ceiling absorber on the grazing sound field. We will discuss this term later as well. As is the equivalent absorption area for walls and floors. Since this is often small, it works well to use the ordinary ‘Sabine’ equivalent absorption area instead of a two-dimensional equivalent. The air absorption in the 2D grazing sound field is Aair=πmV.
3.2. Grazing Sound Incidence
The term Ag in Equation 3 represents the equivalent absorption area for grazing incidence and provides an indication of the effect of the ceiling absorber on the grazing field. The absorption factor depends on the angle of incidence. At grazing incidence, it is usually significantly lower than the statistical absorption factor corresponding to ISO 354 measurements. Although this effect is small, it is not negligible because the ceiling area usually constitutes a considerable proportion of the total room area. Figure 2 shows a room with ceiling treatment but no furniture. In this room, the grazing sound field determines the reverberation time, and the grazing absorption of the ceiling is important. Figure 3a shows the practical absorption factor for three different suspended ceilings. The two upper curves represent, from top to bottom, the Saint-Gobain Ecophon Gedina™ A ceiling (αw = 0.90) and the Saint-Gobain Ecophon Gyptone® Quattro A ceiling (αw = 0.70). The lowest curve shows an experimental configuration consisting of cooling panels combined with porous absorber panels (αw = 0.40). The weighted absorption coefficient αw is defined in [20]. The reverberation times for these three suspended ceilings were measured in the unfurnished room shown in Figure 2. The reverberation times are shown in Figure 3b. The dashed curves in Figure 3b are calculations with Sabine’s formula using the practical absorption coefficients shown in Figure 3a as input data for the ceiling. The Sabine calculations and the measurements differ significantly due to the non-diffuse conditions in this room. It is worth noting that in the mid- and high-frequency ranges, the reverberation times are almost the same despite the significant difference in the corresponding practical absorption factors. The grazing sound field is affected by the grazing absorption of the ceiling. The grazing sound field also determines the late reverberation time, which is evaluated over the range of -5 to -25 dB. It is interesting to note that the order of the measured reverberation times does not correspond to the order of the practical absorption coefficients. For instance, the ceiling with the highest practical absorption coefficient does not correspond to the shortest reverberation time. Although the reverberation times are quite similar, this does not mean that the rooms are perceived as acoustically similar. Significant differences exist in other parameters, such as sound strength and speech clarity. This is shown in Figure 4. These parameters include early energy. Note that C50 and G do not follow what would be expected based on the measured reverberation times. This emphasises the importance of analysing several parameters when evaluating room acoustic conditions.
In Appendix A, Table A3 provides an estimation of the grazing absorption coefficient (αg) for use in Equation 2. The values of αg can be considered sufficiently accurate for practical purposes.
3.3. Quantification of the Sound-Scattering and Sound-Absorbing Effects of Furnishings
Quantification of the scattering and absorbing effects of furnishings is an essential part of the model. This section presents measurements of the equivalent scattering absorption area Asc furn of furnishings, as well as the corresponding ´Sabine´ equivalent absorption area Afurn. It should be noted that the frequency dependence of these parameters can differ significantly. Measurements were conducted for the two suspended ceiling treatments corresponding to low and high absorption shown in Figure 3a. For each ceiling treatment, two furnishing configurations, corresponding to sparse and dense furnishings, were examined.
The Afurn and Asc furn parameters are expected to be available for the model. This section provides a brief background on how these parameters are estimated.
To determine the absorption of furniture in a 3D field, a measurement can be taken in a reverberant room. The equivalent absorption areas of the furniture Afurn in Figures 5a and 5b were measured in an empty room. Figure 6a shows the empty room. This room has no absorbent ceiling; only the ceiling grid system is present. The room shown in Figure 5a is considered densely furnished. It contains wall panels, office screens, upholstered chairs, and tables with computer screens. Figure 5b shows the same furniture configuration as Figure 5a, but without the wall panels and absorbent office screens. This room can be considered sparsely furnished. The concepts of dense, normal, and sparse furnishings will be discussed further at the end of this section.
According to Sabine's formula, an estimate of Afurn is given by
where Twith and Twithout are the reverberation times with and without furniture, respectively. Afurn is used as input data in Equation 2 for calculating the non-grazing reverberation time Tng.
The equivalent scattering absorption area Asc can be estimated in a room with an absorbent suspended ceiling. The room in Figure 6b is similar to the one in Figure 6a, but in this case, the grid system is filled with an absorbent ceiling.
The 2D reverberation formula (Equation 3) is used to calculate Asc furn, yielding
Asc furn considers the sound absorbing and sound dispersing effects of furniture in the grazing sound field. Asc furn is used as input data in Equation 3 for calculating the grazing reverberation time Tg.
Both Afurn and Asc furn have been measured for the two cases shown in Figures 5a and 5b. These measurements were taken for two different ceilings, corresponding to the highest (blue) and lowest (magenta) practical absorption coefficients shown in Figure 3a.
Figure 7a shows the equivalent absorption areas, Asc,furn and Afurn, for the dense furnishings shown in Figure 5a. Afurn is measured in the reverberant space shown in Figure 6a and is calculated using Equation 4. Asc,furn is measured in the room with the ceiling treatment shown in Figure 6b and is calculated using Equation 5. A suspended ceiling with a high practical absorption coefficient, according to the blue curve in Figure 3a, was used for the Asc,furn measurements.
Figure 7b shows Asc,furn and Afurn for the same furnishing case as in Figure 5a i.e. dense furnishings, but with a suspended ceiling with a low practical absorption coefficient according to the magenta curve in Figure 3a.
Figures 7c and 7d show the results for the case with sparse furnishings, as shown in Figure 5b. The ceiling treatments are the same as in Figures 7a and 7b, i.e., high and low practical absorption coefficients, respectively.
As can be seen from Figures 7a and 7c, the frequency dependence of Asc,furn and Afurn differs significantly in cases involving high ceiling absorption and dense or sparse furnishings. 'Sabine' absorption encompasses dissipative losses, whereas Asc,furn describes sound dispersion and dissipative losses in the 2D field. For high ceiling absorption, the scattering effect dominates the 500 Hz to 2000 Hz frequency region for both dense and sparse furnishings.
For the same furnishing cases, but with a ceiling that has a low practical absorption coefficient, the scattering effect diminishes and Asc,furn approaches Afurn, as shown in Figures 7b and 7d. Therefore, for low ceiling absorption, dissipative losses will be more pronounced. In this case, the sound field is more isotropic, and the reverberation times approach the values predicted by Sabine’s formula.
The sound dispersing effect depends largely on the shape and size of the furniture in relation to the wavelength. By introducing Asc,furn, it becomes possible to quantify this effect and incorporate it into the acoustic design process [21]. A more detailed description of Asc,furn in the context of Statistical Energy Analysis (SEA) can be found in [7].
In Appendix A, tables are provided for Afurn and Asc,furn. These values are given as the equivalent absorption and scattering areas per square meter of floor area. Further, these values are given for three types of furniture configurations: sparse, normal, and dense furnishings. Currently, no exact definition of these classifications can be provided, but the following interpretation has been used as a guideline.
- Sparsely furnished: A room such as a classroom or office that contains only tables and lightly upholstered chairs is considered sparsely furnished.
- Normally furnished: A room such as a classroom or office with tables, upholstered chairs, bookshelves, and a small number of textiles is considered normally furnished.
- Densely furnished: A room such as an office or a nursing room that contains tables, upholstered furniture, bookshelves, sofas or beds, and screens or drapes is considered densely furnished.
The values for Afurn per square meter of floor area are given in Table A1. The values for Asc,furn are given in Table A2. Since Asc,furn is affected by ceiling absorption, it is given for three absorption ranges: high, medium, and low. High ceiling absorption comprises ceilings where the average practical absorption coefficient for the octave bands from 250 Hz to 2000 Hz is αm ≥ 0.75. For medium ceiling absorption, the range is 0.50 ≤ αm ≤0.74, and for low ceiling absorption, 0.25 ≤ αm ≤0.49. For ceilings with absorption αm ≤ 0.25, the Sabine formula is assumed to be applicable.
3.4. Calculation of the Reverberation Curve
As mentioned in paragraph 3.1, the decrease in sound energy in a room (the Schroeder curve) can be described by the following formula, which is expressed in terms of sound intensity. Reverberation decay starts at t = 0 from the 'steady-state'.
The sound power of an omnidirectional speaker is represented by W, the distance between the sound source and the measurement position by r, and the reverberation times of the non-grazing and grazing sound fields by Tng and Tg, respectively. The room volume is represented by V. The factor C is related to the energy ratio between the grazing and non-grazing sound fields. This ratio is approximately equal to C=cTg/(fHTng), where c is the speed of sound, f is the frequency of the octave band, and H is the distance from the floor to the ceiling. This factor approximates the expression presented in [7]. The frequency-dependent parameters in Equation 6 are assumed to be given in octave bands.
The reverberation process begins when the direct sound reaches the receiver's position. This process is affected by the distance between the sound source and the receiver. This creates a delay, meaning that at a greater distance from the sound source, the reverberation process will follow a later part of the reverberation curve than at a position closer to the sound source. Therefore, the room acoustic parameters calculated with Equation 6 depend on the distance between the sound source and the receiver.
A derivation of Equation 6 can be found in [7]. The approach adopted here is the same as that used by Barron and Lee [22] and Barron [23] to calculate loudness in concert halls under the assumption of linear reverberation decay. In this case, the reverberation processes of the grazing and non-grazing sound fields are assumed to determine the total reverberation curve. As the reverberation times for these fields differ, the curve will not be linear but will exhibit curvature where the early and late reverberation times diverge. The degree of curvature depends on Tng and Tg, as well as the energy ratio C.
The normalized reverberation curve expressed in dB is given by
where I(t) is given by Equation 6.
The reverberation time T20 is calculated from this curve by regression over the range of -5 dB to -25 dB, in accordance with ISO 3382-2.
As previously mentioned, the reverberation time T20 is not usually a useful parameter for distinguishing the acoustic properties of sparsely furnished rooms with sound-absorbing ceilings. It is therefore recommended that it be supplemented with other parameters related to speech clarity and sound level. Speech clarity C50 (dB) and sound strength G (dB) highlight properties of the sound field that are not always apparent from the reverberation time.
Speech clarity C50 is the ratio of early to late energy, where the time limit of 0.050 ms is used to define early energy. Early energy is calculated using Equation 6, where e₅₀ = I(0) - I(0.05), and late energy is given by l₅₀=I(0.05). According to the definition, speech clarity is calculated as
According to the definition in ISO 3382-1, the sound strength G shall be normalized to the sound intensity at 10 meters in a free field. Sound strength G is given by
4. Results
Measurements have been performed in the room types presented in Table 1. Various configurations of ceiling absorbers, wall panels, and furnishings were tested. A total of 48 scenarios are included in the statistical analysis in Section 4.3. Some important cases are discussed in more detail below. The values of Asc,furn, and Afurn were measured according to Section 3.3. For the non-diffuse calculations, Equations 6 to 9 were used. For the diffuse calculations, Sabine's formula was used together with the expressions for C₅₀ and G under diffuse sound field conditions (see Appendix B).
The room impulse responses were measured using the Dirac system (Dirac type 7841, v.6.0). An exponential sweep signal was fed to an omnidirectional loudspeaker and recorded by an omnidirectional microphone.
To assess the accuracy of the measurements, a repeatability test was conducted in [21]. This investigation was performed for the classroom configuration.
4.1. Small Open-Plan Office
Measurements were performed in a small office containing 12 workstations (see Figure 5b). The room's dimensions are given in Table 3. The room is furnished with upholstered chairs, tables, and computer screens. The room can be considered sparsely furnished. A suspended ceiling with a practical absorption coefficient according to the blue curve in Figure 3 was installed.
Three loudspeaker positions were used. Five receiver positions were used for each loudspeaker position. Measurements were taken at the workstations following the procedure in [24]. Impulse responses were measured for each loudspeaker-receiver pair. The reverberation time T20, speech clarity C50, and sound strength G were then calculated from these impulse responses and averaged over all loudspeaker–receiver pairs. For the distance r in Equation 6, the value was used as a representative value. Figure 8 compares calculations using the diffuse and non-diffuse models with measurements.
In general, the non-diffuse model tends to produce more accurate results. It also reproduces the frequency variation of the parameters. This is especially true for the reverberation time T20. The significant difference between the measurements and calculations using the diffuse model is due to the substantial impact of the grazing sound field in this room. The grazing absorption of the ceiling absorber and the scattering effect of the furniture significantly affect the grazing sound field. In the diffuse model, only dissipative losses are included, with the ceiling represented by the practical absorption coefficient. As the practical absorption coefficient is much greater than the grazing absorption, the diffuse model overestimates the damping. This effect is most clearly seen in the reverberation time. For sound strength, which relates to the initial part of the decay (steady state), there is better agreement with the diffuse model. This is because, at the beginning of the decay, the sound field is more diffuse and aligns more closely with the assumptions of the diffuse model. Increasing the scattering or creating a more uniform distribution of absorption generally improves agreement with the diffuse model.
4.2. Classroom
Another important example is the sparsely furnished classroom with a highly absorbent ceiling. The room contains tables, lightly upholstered chairs, and a few shelves (see Figure 9a). The ceiling absorber corresponds to the blue curve in Figure 3. A common method of improving speech intelligibility is to install wall panels. In this example, the effect of the wall panels was measured, and the results were compared with calculations based on diffuse and non-diffuse models. The equivalent absorption area of the wall panels was included in Equation 3 using the practical absorption coefficients of these products. The furnishings were defined as sparse. The calculated and measured reverberation times are shown in Figure 9b.
As expected, a significant difference between the diffuse and non-diffuse models is observed in the room, which has a highly absorbent ceiling (αw=0.90) and sparse furnishings. The non-diffuse calculations accurately reproduce the shape of the measured curves, as well as the effect of the wall panels on the reverberation times. The wall panels have a significant impact on the grazing sound field, but a smaller effect on the non-grazing sound field. Notably, the effect of the wall panels is very small in the diffuse-model calculations. In [7], a calculation using a more advanced model is presented. The results are similar.
4.3. The Effect of Furniture and Ceiling Absorption on the Acoustics of a Small Open-Plan Office.
In a small open-plan office, different furnishings in combination with suspended absorbent ceilings with different absorption efficiencies were tested. Figure 5a shows the room with dense furnishings. Figure 5b shows the room with sparse furnishings. The latter is similar to Figure 5a, but without wall panels and office screens. Two different ceiling treatments were tested for each furnishing scenario. The corresponding practical absorption coefficients for these ceilings are shown by the upper and lower curves in Figure 3a. The two ceilings represent high and low absorption efficiencies, respectively. The Afurn and Asc,furn values shown in Figure 7 were used in the calculations.
Four combinations were investigated, i.e.,
- Sparse furnishings and high ceiling absorption, Figure 10a.
- Dense furnishings and high ceiling absorption, Figure 10b.
- Sparse furnishings and low ceiling absorption, Figure 10c.
- Dense furnishings and low ceiling absorption, Figure 10d.
Figure 10a shows the calculated and measured reverberation times for Case 1. There is a significant discrepancy between the measurements and the calculations based on the diffuse model. The non-diffuse model provides a closer match to the measurements. In cases involving high ceiling absorption and sparse furnishings, the influence of the grazing sound field and the scattering effect of the furnishings are significant. In the middle frequency range, the scattering effect exceeds the dissipative losses of the furnishings (see Figure 7c in Section 3.3). For Case 2 (Figure 10b), i.e., dense furnishings and high ceiling absorption, dissipative losses increase significantly (see Figure 7a). However, scattering effects still dominate the middle frequency range. Once again, there is better agreement between the non-diffuse calculations and the measurements than there is with the diffuse model. Notably, the non-diffuse model more accurately reproduces the effect of increased furniture absorption. For Case 3 (Figure 10c), i.e., sparse furnishings and low ceiling absorption, the discrepancy between the diffuse and non-diffuse models is smaller than in the case with high ceiling absorption. Nevertheless, the non-diffuse model still agrees better with the measurements. For Case 4 (Figure 10d), i.e., dense furnishings and low ceiling absorption, both models correspond well with the measured curve. Dissipation is the dominant effect (see Figure 7b), and the sound field is likely more uniform in this case due to the lower ceiling absorption.
4.4. Statistical Analysis
Measurements were performed in three different room types. The dimensions and characteristics of each room are provided in Table 1. Several types of furniture configurations consisting of tables, chairs, and shelves were evaluated in each room. Examples are shown in Figure 5a, Figure 5b and Figure 9a. Some configurations included wall panels and office screens. Different types of ceiling treatments were used, corresponding to a weighted absorption coefficient αw in the range of 0.20 to 1.0 [20]. A total of 45 different configurations were included in the statistical analysis. The difference between the measured and calculated room acoustic parameters, i.e., dT20 = T20 measured – T20 calculated, and likewise for C50 and G was calculated, and the results are presented in Figure 11. Thus, values close to zero are preferable. For each octave-band frequency, two cases are presented: the first refers to the non-diffuse model presented in this paper (in blue), and the second to the diffuse calculation (in red). The tables in Appendix A were used for the non-diffuse calculations.
The results demonstrate a significant difference between the non-diffuse and diffuse models, with the former showing better agreement with the measurements. The non-diffuse model also exhibits a smaller scatter in the data.
All input data required for the calculations, along with all measurements and calculation results, can be provided upon request. Please refer to the data availability statement below.
5. Discussion and Conclusions
This article presents a model specifically designed to account for rooms with absorbent ceilings, as well as the sound dispersing and sound absorbing effects of furnishings in these rooms. Room acoustic parameters, such as reverberation time, speech clarity, and sound strength, can be calculated using basic input data. The impact of the interior design and the effect of the ceiling absorber on the grazing sound field have been estimated for cases common in practice. Values for the equivalent absorption area and the equivalent scattering absorption area of furnishings have been estimated for typical cases classified as sparse, normal, and dense furnishings. These values are given in Table A1 and Table A2 in Appendix A. An estimate of the grazing absorption is given in Table A3. All parameters included in the model are physically interpretable and measurable. The model provides suggestions on how they can be determined experimentally. For rooms with small and evenly dispersed sound absorption, the model produces results comparable to those of the diffuse-field model.
Quantifying the interior in terms of an equivalent scattering absorption area provides a straightforward way to make acoustic design more flexible by incorporating sound diffusion into the design process [21].
The introduction of grazing and non-grazing sound fields, the absorbing and scattering effects of furnishings, and the estimation of grazing absorption of ceiling absorbers are crucial to the model. It should also be noted that the statistical or practical absorption coefficients only affect the diffuse part of the model, thus contributing to the initial decay phase.
Future work will involve updating and adjusting the tables in Appendix A to improve their accuracy and coverage. Further investigation of grazing absorption, especially at low frequencies, is also required. Since it is possible to account for the sound propagation behavior of the parameters, it would be interesting to incorporate open-plan office parameters [24].
The analysis shows that the model provides a better fit to the measurements than diffuse-field theory does, particularly in rooms where most of the absorption is provided by the ceiling absorber. This applies to all room acoustic parameters studied.
Author Contributions
Writing—original draft preparation, E.N.; writing—review and editing, E.N.; experiments and investigations related to Sections 3.2.5 and 5.1, E.N., E.A., and H.N. All authors have read and agreed to the published version of the manuscript.
Funding
This research received no external funding.
Data Availability Statement
The data presented in this study are available upon request from the corresponding author.
Acknowledgments
The authors would like to thank the R&D and Innovation team at Ecophon for providing materials, assistance with measurements, and access to laboratory facilities and equipment.
Conflicts of Interest
The authors declare no conflicts of interest.
Appendix A

Table A1.
Equivalent absorption area per square meter of floor area, A’furn, for sparse, normal, and dense furnishings.
Table A1.
Equivalent absorption area per square meter of floor area, A’furn, for sparse, normal, and dense furnishings.
| Equivalent absorption area per m2 floor area, A’furn | ||||||
| 125 Hz | 250 Hz | 500 Hz | 1000 Hz | 2000 Hz | 4000 Hz | |
| Sparse | 0.06 | 0.06 | 0.09 | 0.11 | 0.13 | 0.13 |
| Normal | 0.08 | 0.12 | 0.18 | 0.23 | 0.25 | 0.25 |
| Dense | 0.09 | 0.17 | 0.26 | 0.33 | 0.36 | 0.35 |
Table A2.
Equivalent scattering absorption area per square meter of floor area, A’sc,furn, for sparse, normal, and dense furnishings. For each furniture configuration, A’sc, furn, is given for three ceiling absorption regions defined by αm and relating to high, medium, and low absorption. The absorption coefficient αm is the average of the practical absorption coefficients for the ceiling absorber at octave-band frequencies ranging from 250 Hz to 4000 Hz.
Table A2.
Equivalent scattering absorption area per square meter of floor area, A’sc,furn, for sparse, normal, and dense furnishings. For each furniture configuration, A’sc, furn, is given for three ceiling absorption regions defined by αm and relating to high, medium, and low absorption. The absorption coefficient αm is the average of the practical absorption coefficients for the ceiling absorber at octave-band frequencies ranging from 250 Hz to 4000 Hz.
| Furnishing | Ceiling absorption | 125 Hz | 250 Hz | 500 Hz | 1000 Hz | 2000 Hz | 4000 Hz |
| Sparse | High ceiling absorption αm ≥ 0.75 | 0.03 | 0.06 | 0.20 | 0.21 | 0.15 | 0.09 |
| Sparse | Medium ceiling absorption 0.50 ≤ αm ≤ 0.74 | 0.03 | 0.04 | 0.15 | 0.17 | 0.14 | 0.08 |
| Sparse | Low ceiling absorption 0.25 ≤ αm ≤ 0.49 |
0.02 | 0.02 | 0.10 | 0.13 | 0.12 | 0.07 |
| Normal | High ceiling absorption αm ≥ 0.75 | 0.08 | 0.14 | 0.36 | 0.40 | 0.32 | 0.25 |
| Normal | Medium ceiling absorption 0.50 ≤ αm ≤ 0.74 | 0.07 | 0.11 | 0.27 | 0.31 | 0.27 | 0.22 |
| Normal | Low ceiling absorption 0.25 ≤ αm ≤ 0.49 |
0.07 | 0.09 | 0.18 | 0.22 | 0.23 | 0.18 |
| Dense | High ceiling absorption αm ≥ 0.75 | 0.12 | 0.21 | 0.52 | 0.59 | 0.48 | 0.41 |
| Dense | Medium ceiling absorption 0.50 ≤ αm ≤ 0.74 | 0.12 | 0.18 | 0.39 | 0.45 | 0.41 | 0.35 |
| Dense | Low ceiling absorption 0.25 ≤ αm ≤ 0.49 |
0.12 | 0.15 | 0.25 | 0.31 | 0.33 | 0.29 |
Table A3.
Grazing absorption coefficient αg to be used in Equation 2. The equivalent absorption area Ag is given by Ag = αg ∙Sceiling where Sceiling is the ceiling area.
Table A3.
Grazing absorption coefficient αg to be used in Equation 2. The equivalent absorption area Ag is given by Ag = αg ∙Sceiling where Sceiling is the ceiling area.
| Grazing absorption coefficient (αg) for the ceiling, to be used in Equation 2. | |||||
| 125 Hz | 250 Hz | 500 Hz | 1000 Hz | 2000 Hz | 4000 Hz |
| 0.09 | 0.11 | 0.09 | 0.07 | 0.04 | 0.04 |
Appendix B
Under diffuse-field conditions, C50 and G are given by Equations B1 and B2, respectively.
where T20 is the reverberation time, and V is the room volume.
References
- Shield, B.M.; Dockrell, J. The effects of environmental and classroom noise on the academic attainments of primary school children. J. Acoust. Soc. Am. 2008, 123, 133–144. [Google Scholar] [CrossRef] [PubMed]
- Shield, B.M.; Dockrell, J. The effects of noise on children at school: A review. J. Build. Acoust. 2003, 10, 97–116. [Google Scholar] [CrossRef]
- Astolfi, A.; Parati, L.; D’Orazio, D.; Garai, M. The new Italian standard UNI 11532 on acoustics for schools. In Proceedings of the 23rd International Congress on Acoustics, Aachen, Germany, 9–13 September 2019. [Google Scholar]
- ISO. ISO 3382-1:2009; Acoustics—Measurement of Room Acoustic Parameters—Part 1: Performance Spaces. ISO: Geneva, Switzerland, 2009.
- ISO. ISO 3382-2:2008; Acoustics—Measurement of Room Acoustic Parameters—Part 2: Reverberation Time in Ordinary Rooms. ISO: Geneva, Switzerland, 2008.
- IEC. IEC 60268-16; Sound System Equipment—Part 16: Objective Rating of Speech Intelligibility by Speech Transmission Index. IEC: Geneva, Switzerland, 2011.
- Erling, N.; Emma, A. An energy model for the calculation of room acoustic parameters in rectangular rooms with absorbent ceilings. Appl. Sci. 2021, 11, 6607. [Google Scholar] [CrossRef]
- Sabine, W.C. Collected Papers on Acoustics; Dover Publications: New York, NY, USA, 1964. [Google Scholar]
- Cremer, L.; Muller, H.A.; Schultz, T.J. Principles and Applications of Room Acoustics; Applied Science Publishers: London, UK, 1982; Vol. 1. [Google Scholar]
- Kuttruff, H. Room Acoustics, 3rd ed.; Elsevier Science Publishers Ltd.: London, UK, 1991. [Google Scholar]
- Fitzroy, D. Reverberation formulae which seem to be more accurate with non-uniform distribution of absorption. J. Acoust. Soc. Am. 1959, 31, 893–897. [Google Scholar] [CrossRef]
- Neubauer, N.O. Estimation of reverberation time in rectangular rooms with non-uniformly distributed absorption using a modified Fitzroy equation. Build. Acoust. 2001, 8, 115–137. [Google Scholar] [CrossRef]
- Arau-Puchades, H. An improved reverberation formula. Acustica 1988, 65, 163–180. [Google Scholar]
- Nilsson, E. Decay Processes in Rooms with Non-Diffuse Sound Fields Part I: Ceiling Treatment with Absorbing Material. Build. Acoust. 2004, 11, 39–60. [Google Scholar] [CrossRef]
- Nilsson, E. Decay processes in rooms with non-diffuse sound fields—Part II: Effect of irregularities. Build. Acoust. 2004, 11, 133–143. [Google Scholar] [CrossRef]
- EN 12354-6:2004; Building Acoustics—Estimation of Acoustic Performance of Buildings from the Performance of Elements—Part 6: Sound Absorption in Enclosed Spaces. CEN: Brussels, Belgium, 2004.
- Zhou, X.; Späh, M.; Hengst, K.; Zhang, T. Predicting the reverberation time in rectangular rooms with non-uniform absorption distribution. Appl. Acoust. 2021, 171. [Google Scholar] [CrossRef]
- Sakuma, T. Approximate theory of reverberation in rectangular rooms with specular and diffuse reflections. J. Acoust. Soc. Am. 2012, 132, 2325–2336. [Google Scholar] [CrossRef] [PubMed]
- ISO. ISO 354:2003; Acoustics—Measurement of Sound Absorption in a Reverberation Room. ISO: Geneva, Switzerland, 2003.
- ISO. ISO 11654:1997; Acoustics—Sound Absorbers for Use in Buildings—Rating of Sound Absorption. ISO: Geneva, Switzerland, 1997.
- Arvidsson, E.; Nilsson, E.; Hagberg, D.B.; Karlsson, O.J.I. The effect on room acoustical parameters using a combination of absorbers and diffusors—An experimental study in a classroom. Acoustics 2020, 2, 505–523. [Google Scholar] [CrossRef]
- Barron, M.; Lee, L.J. Energy relations in concert auditoriums. I. J. Acoust. Soc. Am. 1988, 84, 618–628. [Google Scholar] [CrossRef]
- Barron, M. Theory and measurement of early, late, and total sound levels in rooms. J. Acoust. Soc. Am. 2015, 137, 3087–3098. [Google Scholar] [CrossRef] [PubMed]
- Nguyen, H. The effect of furniture on room acoustic parameters and its dependence on the sound-absorbing properties of the ceiling. Master's Thesis, Div. of Engineering Acoustics, LTH, Lund, 2023. [Google Scholar]
- ISO. ISO 3382-3:2012; Acoustics—Measurement of Room Acoustic Parameters—Part 3: Open Plan Offices. ISO: Geneva, Switzerland, 2012.
Figure 1.
Blue: total energy decay. Yellow: energy decay corresponding to the non-grazing sound field. Red: energy decay corresponding to the grazing sound field.
Figure 1.
Blue: total energy decay. Yellow: energy decay corresponding to the non-grazing sound field. Red: energy decay corresponding to the grazing sound field.
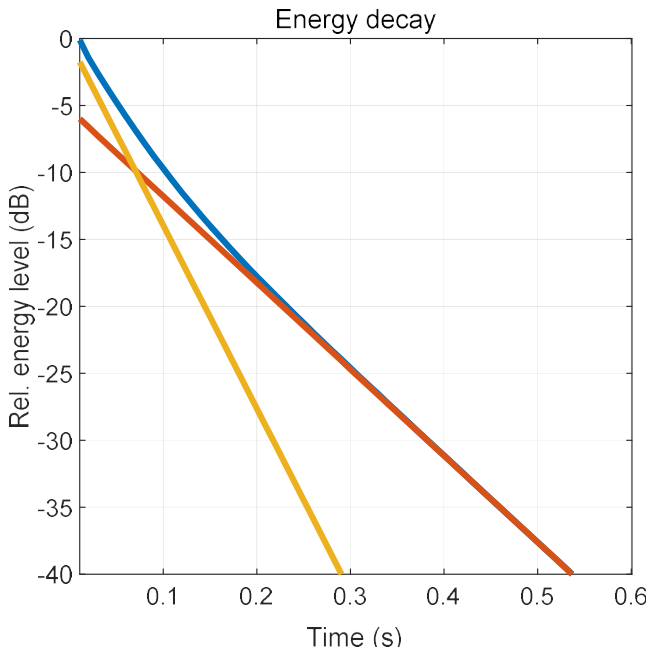
Figure 2.
Room with a suspended absorbent ceiling and no furniture. Reverberation time measurements taken in this room demonstrate the impact of the grazing sound field.
Figure 2.
Room with a suspended absorbent ceiling and no furniture. Reverberation time measurements taken in this room demonstrate the impact of the grazing sound field.
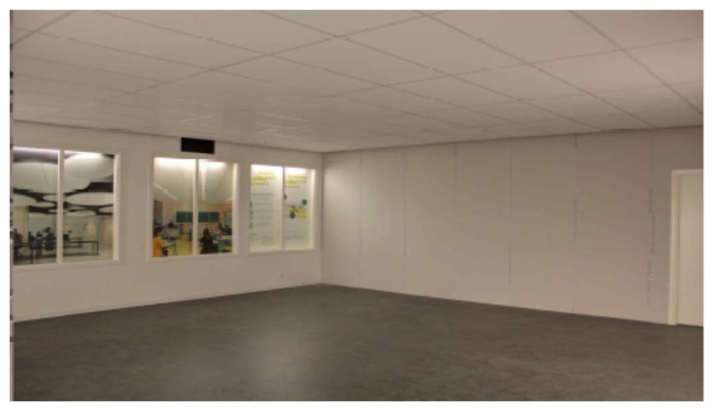
Figure 3.
(a) Practical absorption coefficients for three types of suspended ceilings. The blue curve shows the absorption coefficient for the Saint-Gobain Ecophon Gedina™ A ceiling (αw = 0.90), and the red curve shows the absorption coefficient for the Saint-Gobain Ecophon Gyptone® Quattro A ceiling (αw = 0.70). The lowest curve (magenta) is an experimental configuration consisting of cooling panels in combination with porous absorber panels (αw = 0.40). (b) Corresponding measured reverberation times (solid curves). The dashed curves show the estimated reverberation times based on the Sabine formula using the practical absorption coefficients shown in (a).
Figure 3.
(a) Practical absorption coefficients for three types of suspended ceilings. The blue curve shows the absorption coefficient for the Saint-Gobain Ecophon Gedina™ A ceiling (αw = 0.90), and the red curve shows the absorption coefficient for the Saint-Gobain Ecophon Gyptone® Quattro A ceiling (αw = 0.70). The lowest curve (magenta) is an experimental configuration consisting of cooling panels in combination with porous absorber panels (αw = 0.40). (b) Corresponding measured reverberation times (solid curves). The dashed curves show the estimated reverberation times based on the Sabine formula using the practical absorption coefficients shown in (a).
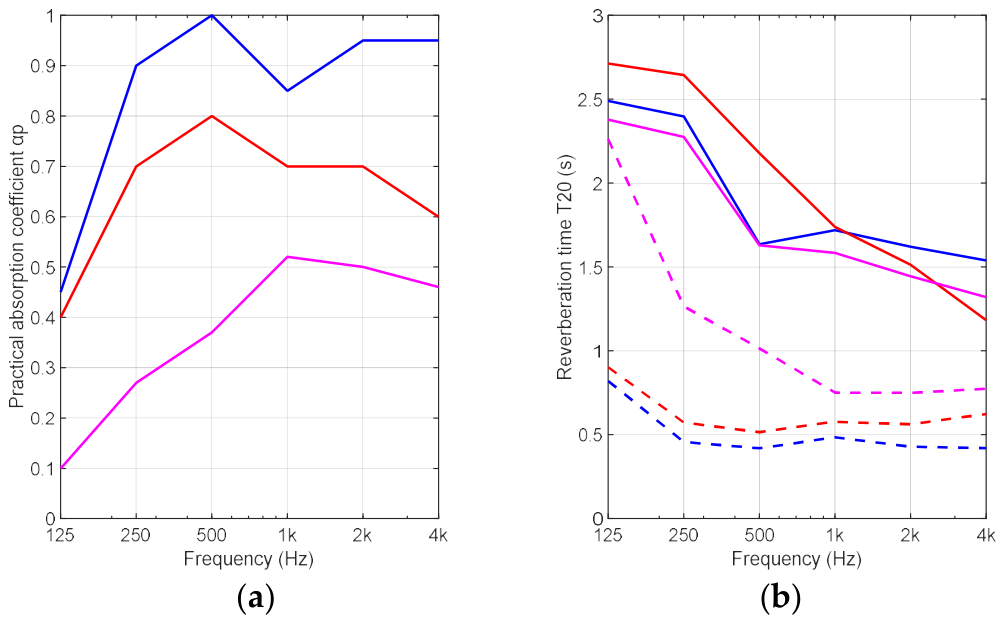
Figure 4.
A comparison of room acoustic parameters for ceilings corresponding to the highest and lowest practical absorption coefficients in Figure 3(a). Blue corresponds to the highest and green to the lowest practical absorption coefficient. (a) shows the reverberation time T20 (s), (b) shows the speech clarity C50 (dB), and (c) shows the sound strength G (dB).
Figure 4.
A comparison of room acoustic parameters for ceilings corresponding to the highest and lowest practical absorption coefficients in Figure 3(a). Blue corresponds to the highest and green to the lowest practical absorption coefficient. (a) shows the reverberation time T20 (s), (b) shows the speech clarity C50 (dB), and (c) shows the sound strength G (dB).
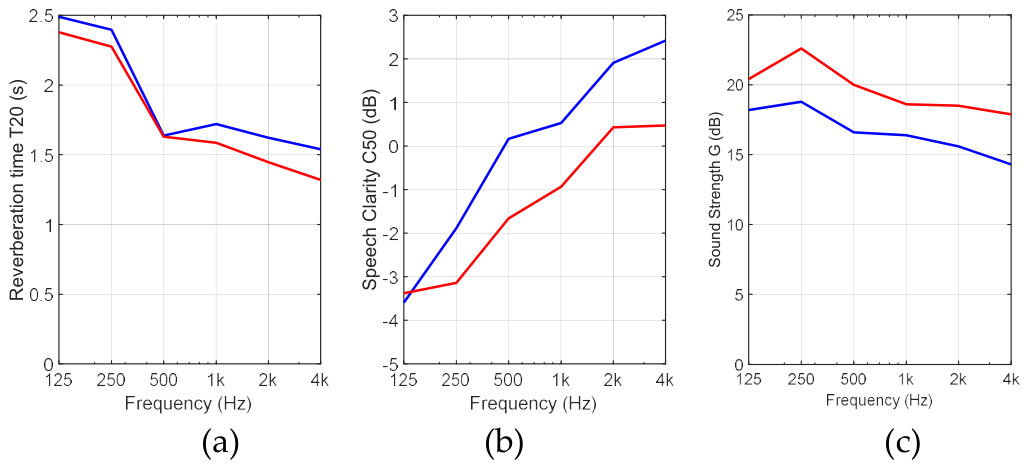
Figure 5.
(a) A densely furnished room containing wall panels, office screens, upholstered chairs, and tables with computer screens. (b) A sparsely furnished room containing tables, upholstered chairs, and computer screens, i.e., the same as (a) but without the wall panels and office screens.
Figure 5.
(a) A densely furnished room containing wall panels, office screens, upholstered chairs, and tables with computer screens. (b) A sparsely furnished room containing tables, upholstered chairs, and computer screens, i.e., the same as (a) but without the wall panels and office screens.
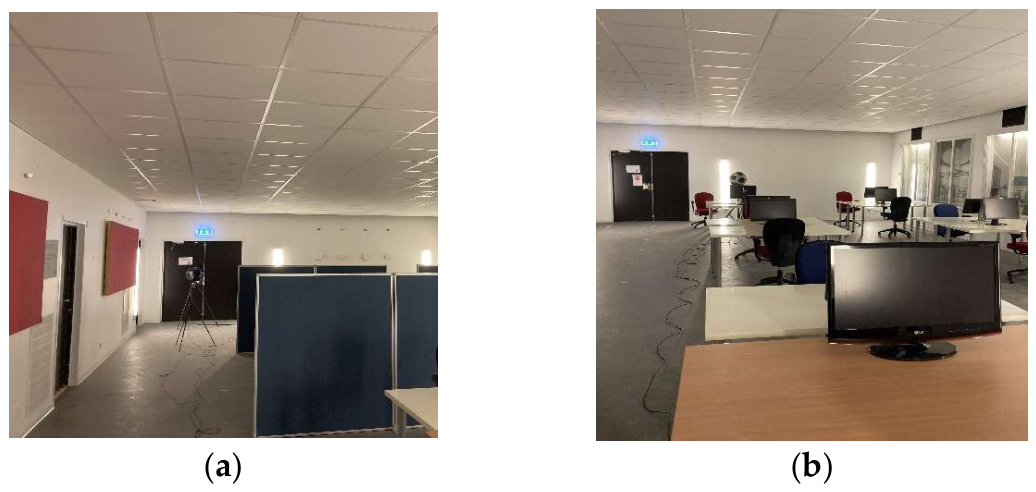
Figure 6.
(a) An empty room used to measure the equivalent absorption area (Afurn) of furniture. Only the grid system is present. (b) A room with a ceiling treatment for measuring the equivalent scattering absorption area (Asc) of furnishings.
Figure 6.
(a) An empty room used to measure the equivalent absorption area (Afurn) of furniture. Only the grid system is present. (b) A room with a ceiling treatment for measuring the equivalent scattering absorption area (Asc) of furnishings.
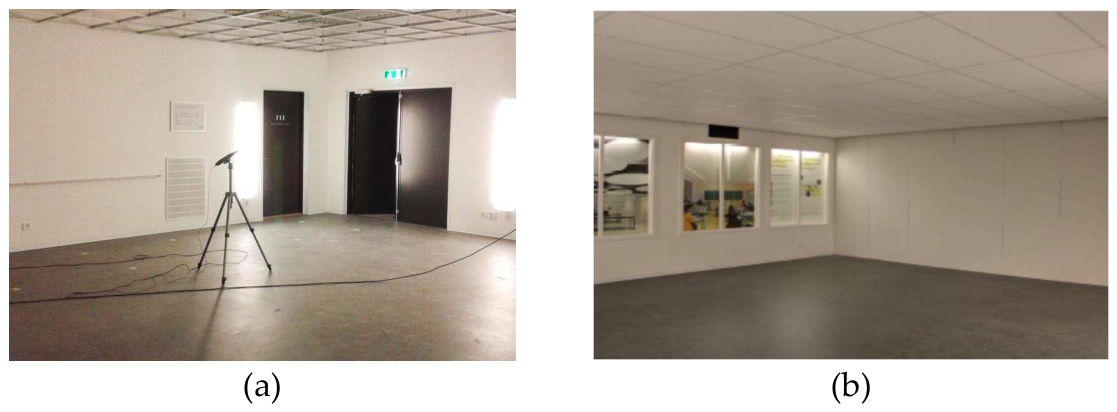
Figure 7.
(a) Red curve: The equivalent scattering absorption area Asc,furn for dense furnishings (see Figure 5a) measured in the room with a suspended ceiling having a high practical absorption coefficient, i.e., the blue curve in Figure 3a. Blue curve: The equivalent absorption area Afurn for dense furnishings measured in the room without a ceiling (see Figure 6a). (b) Red curve: The equivalent scattering absorption area Asc,furn for dense furnishings measured in the room with a suspended ceiling having a low practical absorption coefficient, i.e., the magenta curve in Figure 3a. Blue curve: same as in (a). (c, d) Same as (a) and (b), respectively, but for sparse furnishings shown in Figure 5b.
Figure 7.
(a) Red curve: The equivalent scattering absorption area Asc,furn for dense furnishings (see Figure 5a) measured in the room with a suspended ceiling having a high practical absorption coefficient, i.e., the blue curve in Figure 3a. Blue curve: The equivalent absorption area Afurn for dense furnishings measured in the room without a ceiling (see Figure 6a). (b) Red curve: The equivalent scattering absorption area Asc,furn for dense furnishings measured in the room with a suspended ceiling having a low practical absorption coefficient, i.e., the magenta curve in Figure 3a. Blue curve: same as in (a). (c, d) Same as (a) and (b), respectively, but for sparse furnishings shown in Figure 5b.
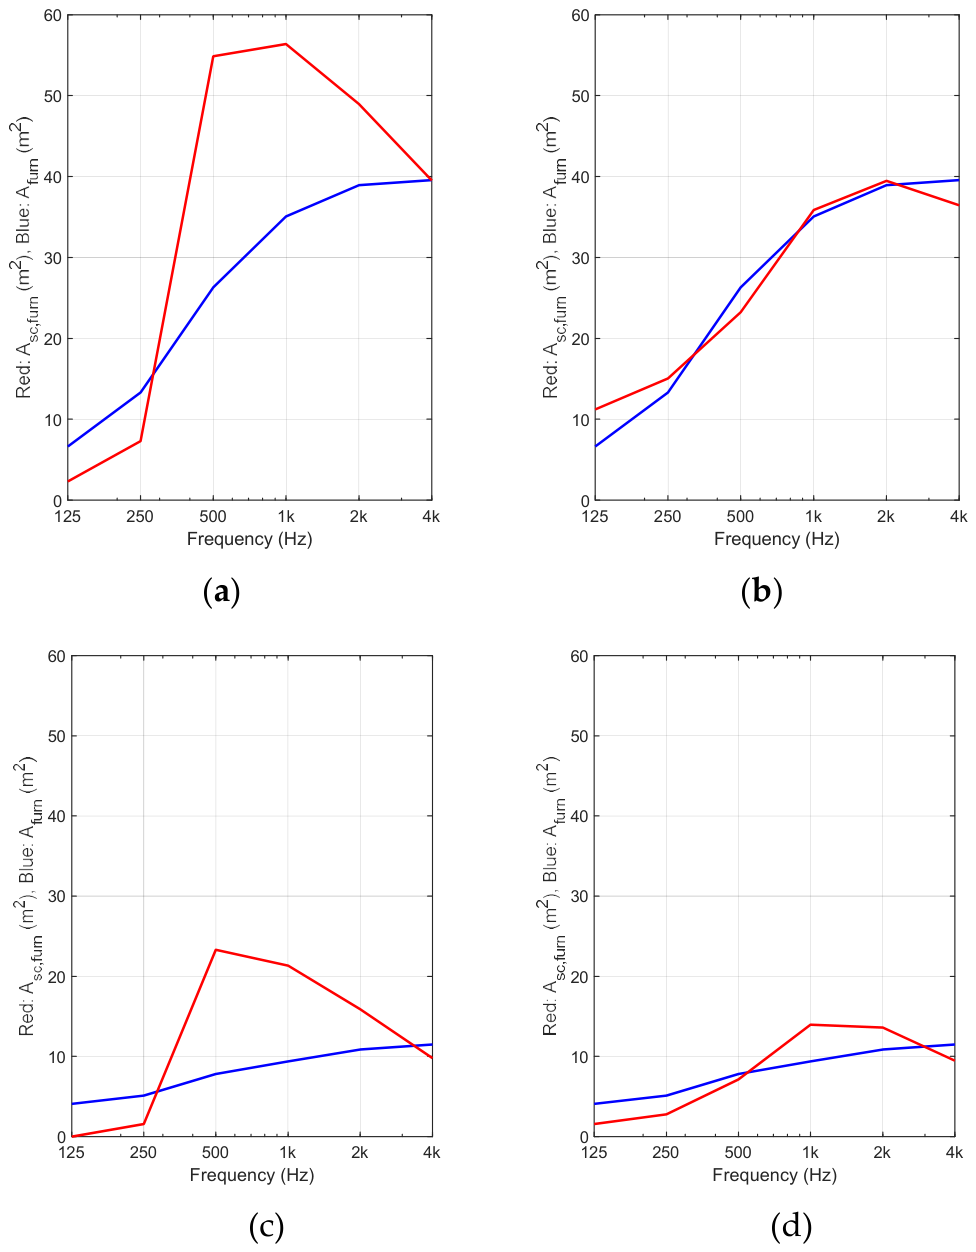
Figure 8.
In all panels, green represents the measured data, blue represents the calculation using the non-diffuse model, and red represents the calculation using the diffuse model. (a) Reverberation time T20 (s) (b) speech clarity C50 (dB) (c) sound strength G (dB).
Figure 8.
In all panels, green represents the measured data, blue represents the calculation using the non-diffuse model, and red represents the calculation using the diffuse model. (a) Reverberation time T20 (s) (b) speech clarity C50 (dB) (c) sound strength G (dB).
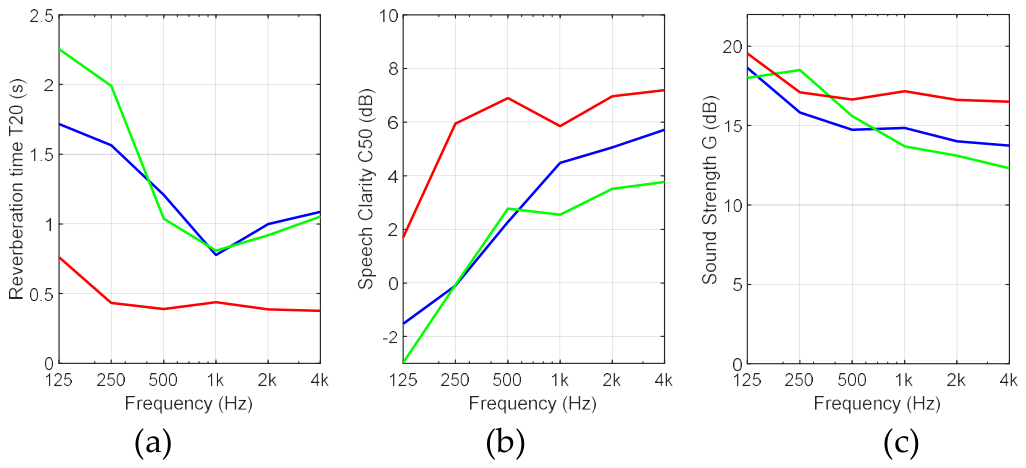
Figure 9.
(a) A sparsely furnished classroom with red wall panels on two adjacent walls. (b) The solid curves represent measurements without wall panels, and the dashed curves show measurements with wall panels. The green curves represent the measurements, the blue curves represent the calculations using the non-diffuse model, and the red curves represent the calculations using the diffuse model.
Figure 9.
(a) A sparsely furnished classroom with red wall panels on two adjacent walls. (b) The solid curves represent measurements without wall panels, and the dashed curves show measurements with wall panels. The green curves represent the measurements, the blue curves represent the calculations using the non-diffuse model, and the red curves represent the calculations using the diffuse model.
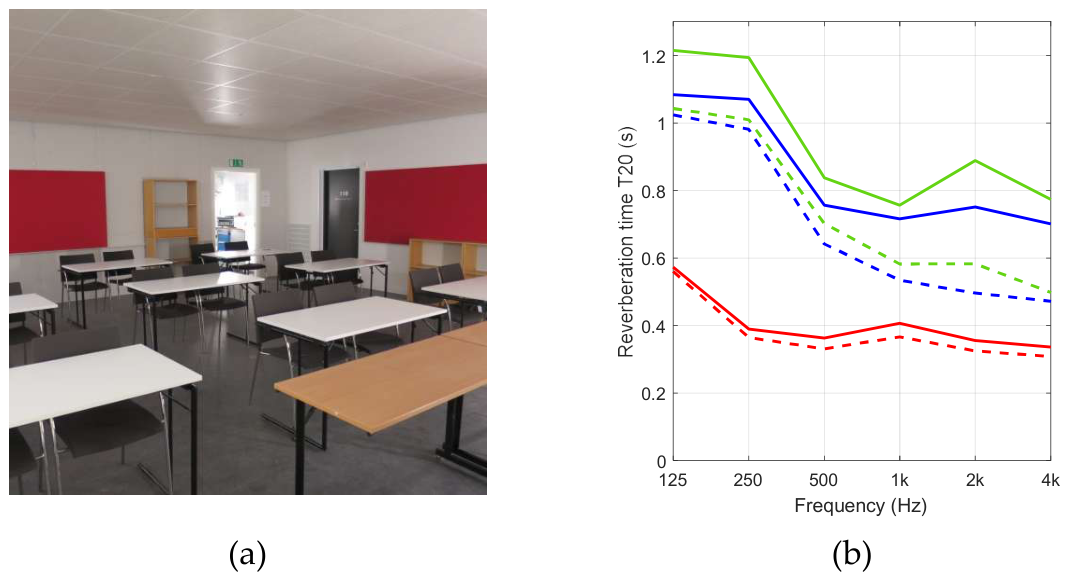
Figure 10.
Measured and calculated reverberation times in a small open-plan office with different furnishings and ceiling types. The green curve shows the measured reverberation time, the blue curve shows the non-diffuse calculation, and the red curve shows the diffuse calculation. (a) Sparse furnishings and high ceiling absorption; (b) Dense furnishings and high ceiling absorption; (c) Sparse furnishings and low ceiling absorption; (d) Dense furnishings and low ceiling absorption.
Figure 10.
Measured and calculated reverberation times in a small open-plan office with different furnishings and ceiling types. The green curve shows the measured reverberation time, the blue curve shows the non-diffuse calculation, and the red curve shows the diffuse calculation. (a) Sparse furnishings and high ceiling absorption; (b) Dense furnishings and high ceiling absorption; (c) Sparse furnishings and low ceiling absorption; (d) Dense furnishings and low ceiling absorption.
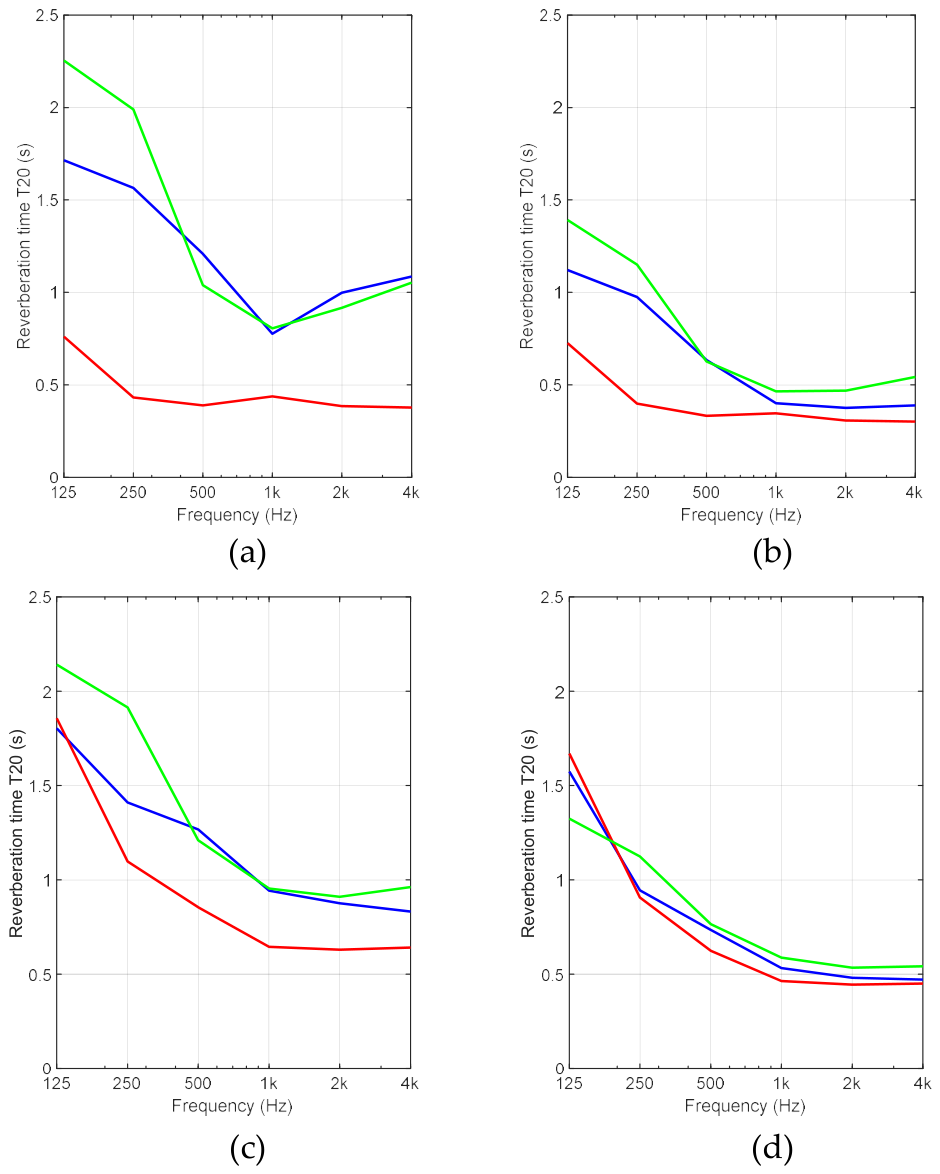
Figure 11.
Statistics showing the difference between measured and calculated room acoustic parameters: (a) Reverberation time T20 (s), (b) speech clarity C50 (dB) and (c) sound strength G (dB). Blue refers to values calculated using the non-diffuse model with data from Table A1, Table A2 and Table A3 in Appendix A. Red refers to values calculated using the diffuse model.
Figure 11.
Statistics showing the difference between measured and calculated room acoustic parameters: (a) Reverberation time T20 (s), (b) speech clarity C50 (dB) and (c) sound strength G (dB). Blue refers to values calculated using the non-diffuse model with data from Table A1, Table A2 and Table A3 in Appendix A. Red refers to values calculated using the diffuse model.
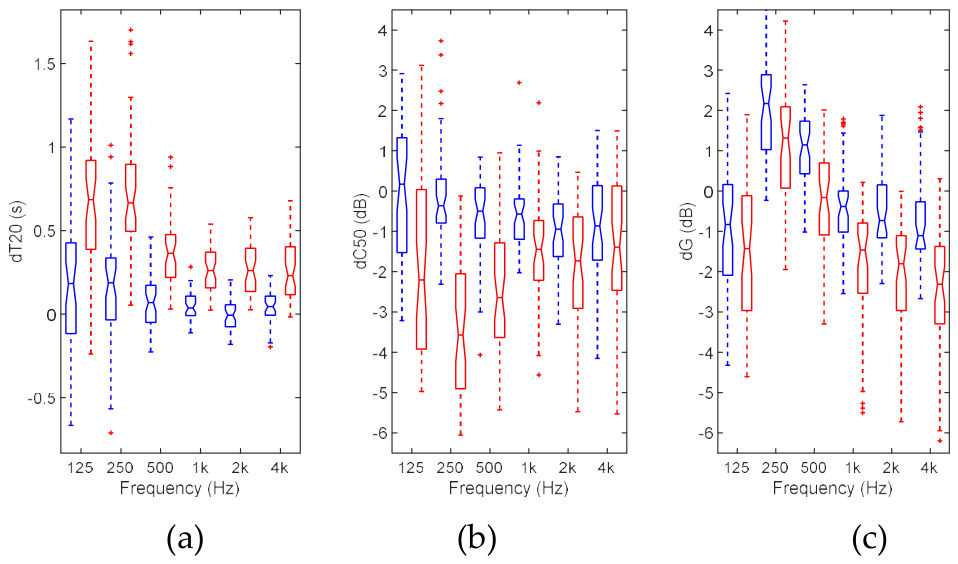
Table 1.
Room types. Different mounting heights for the suspended ceiling were tested for the classroom.
Table 1.
Room types. Different mounting heights for the suspended ceiling were tested for the classroom.
| Room | Volume up to suspended ceiling (m3) | Height up to suspended ceiling (m) |
Width (m) |
Length (m) |
| Small open-plan office | 264 m3 | 2.80 m | 7.33 m | 12.9 m |
| Classroom | 150 m3, 183 m3 | 2.70 m, 3.33 m | 7.33 m | 7.57 m |
| Small reverberation chamber [24] | 40 m3 | 2.8 m | 3.6 m | 4.0 m |
Disclaimer/Publisher’s Note: The statements, opinions and data contained in all publications are solely those of the individual author(s) and contributor(s) and not of MDPI and/or the editor(s). MDPI and/or the editor(s) disclaim responsibility for any injury to people or property resulting from any ideas, methods, instructions or products referred to in the content. |
© 2026 by the authors. Licensee MDPI, Basel, Switzerland. This article is an open access article distributed under the terms and conditions of the Creative Commons Attribution (CC BY) license (http://creativecommons.org/licenses/by/4.0/).
Copyright: This open access article is published under a Creative Commons CC BY 4.0 license, which permit the free download, distribution, and reuse, provided that the author and preprint are cited in any reuse.