

Submitted:
12 October 2026
Posted:
13 October 2026
You are already at the latest version
Abstract
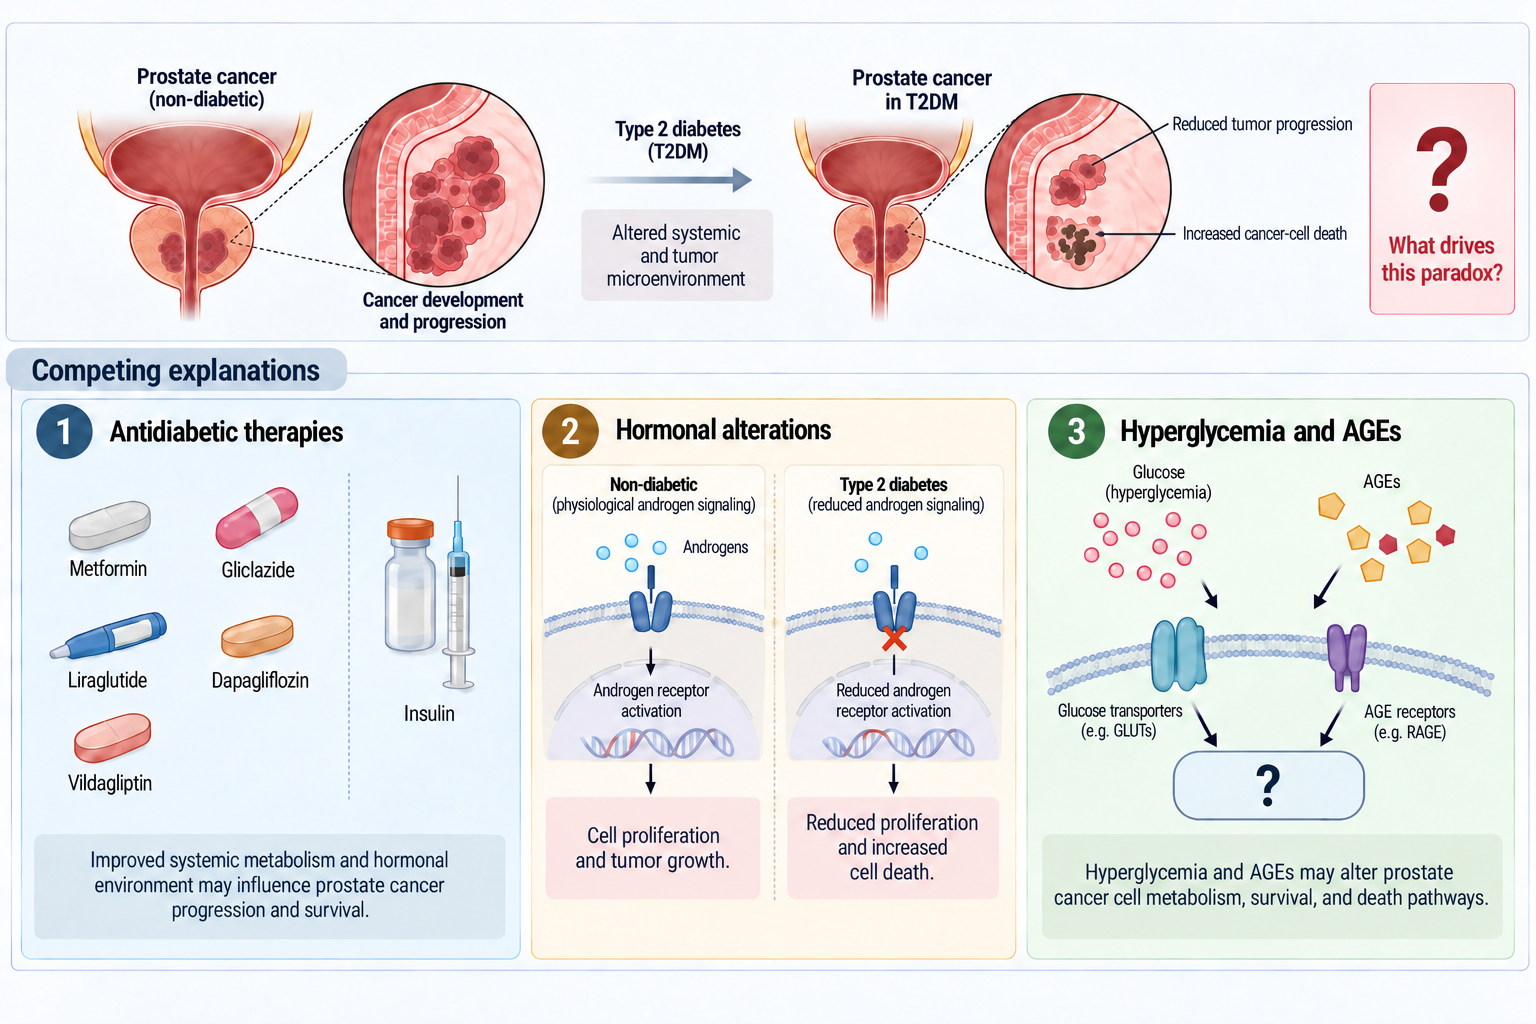
Type 2 diabetes mellitus (T2DM) is associated with a tumor-promoting metabolic environment, yet epidemiological evidence suggests an inverse association with prostate cancer (PCa), giving rise to the PCa–T2DM paradox. We investigated whether major proposed mechanisms could reproduce the effects of plasma from patients with T2DM in prostate cell models. PC3, LNCaP, and HPEpiC cells were exposed to 10% plasma from 16 patients with T2DM for 24 h. Antidiabetic drugs, testosterone and estradiol, glucose, and methylglyoxal were then evaluated independently. Patient-derived plasma markedly reduced viability to 29.0 ± 3.9% in PC3, 67.4 ± 13.6% in LNCaP, and 53.1 ± 2.0% in HPEpiC cells. None of the tested antidiabetic drugs reproduced this response at clinically relevant concentrations. Hormonal modulation altered macrophage polarization and prostate-cell viability but produced only selective, cell-dependent effects. Increasing glucose concentrations enhanced viability in PC3 and LNCaP cells, whereas methylglyoxal reduced viability only in HPEpiC cells at the highest concentrations tested. Overall, none of the major isolated pharmacological, hormonal, glycemic, or glycation-related mechanisms reproduced the plasma-associated phenotype, suggesting that it may arise from the integrated influence of multiple circulating components and signaling pathways.
Keywords:
antidiabetic medication
; hormonal shift
; hyperglycemia
; prostate cancer
; type 2 diabetes mellitus
1. Introduction
Type 2 diabetes mellitus (T2DM) creates a complex systemic environment in which glucose homeostasis is altered, endocrine function is remodeled, chronic low-grade inflammation is present, and metabolic stress is sustained [1,2]. Despite these changes, prostate cancer (PCa) does not follow the same epidemiological trends seen in many other cancers. A lower overall frequency of PCa diagnosis, especially in earlier stages, has been repeatedly associated with diabetes, while the links with clinically significant or aggressive PCa are much more variable and can even move in the opposite direction [3,4,5]. This mismatch has been called the PCa–T2DM paradox, and it suggests that the effects of diabetes on prostate biology cannot be explained by a straightforward connection between systemic metabolic dysfunction and tumor growth.
Different mechanisms have been proposed to explain this paradox, but these have usually been studied separately instead of being directly compared within the same experimental setting. One possible explanation involves antidiabetic medications, since glucose-lowering drugs can affect metabolic and survival pathways important in cancer, although their associations with PCa in epidemiological studies differ by drug class and clinical outcome [6,7]. Endocrine remodeling is another candidate. Obesity, insulin resistance, and T2DM drive changes in sex-steroid biology, while androgen and estrogen signaling remain major factors in how prostate epithelial and tumor cells behave [8,9,10]. A third possible mechanism involves hyperglycemia and carbonyl stress. When glucose levels are high and reactive carbonyl metabolites like methylglyoxal build up, redox balance, macromolecular integrity, and stress-response signaling can be affected, and methylglyoxal-related pathways have also been directly linked to PCa models [11,12]. These mechanisms are biologically plausible, but it remains unclear whether any can fully reproduce the cellular effects seen with whole plasma from patients with T2DM.
In this study, we directly tested these competing explanations within a shared prostate-cell framework. PC3, LNCaP, and HPEpiC cells were exposed to plasma from individual patients with T2DM as well as to a pooled plasma sample. At the same time, we used representative antidiabetic drugs, sex-steroid modulation, glucose, and methylglyoxal as candidate single-factor explanations. These isolated exposures produced selective, model-dependent biological effects, but they did not reproduce the full range and strength of the acute viability changes seen with whole plasma from patients with T2DM. These results shift the experimental focus from searching for a single dominant circulating factor to understanding the integrated biological activity of the plasma environment, providing a basis for comparing different systemic metabolic states.
2. Results
2.1. Clinical and Therapeutic Characterization of the T2DM Cohort
The study cohort comprised 16 men diagnosed with T2DM. Overall, the group showed a mean age of 64.19 ± 5.82 years and a mean disease duration of 10.06 ± 8.16 years. The mean body mass index was 30.23 ± 5.26 kg/m², consistent with an overall profile ranging from overweight to obesity. Biochemically, the cohort had a mean fasting glucose of 151.75 ± 31.06 mg/dL and a mean HbA1c of 7.42 ± 1.01%, consistent with persistent diabetic dysregulation. Mean LDH remained within the expected range, while lipid-related parameters showed overall controlled average values, including total cholesterol of 157.44 ± 30.89 mg/dL, triglycerides of 143.50 ± 66.90 mg/dL, HDL cholesterol of 44.75 ± 9.86 mg/dL, and LDL cholesterol of 87.88 ± 27.42 mg/dL (Table 1).
Antidiabetic therapy within the cohort was heterogeneous and included representatives from all major drug classes considered in the experimental design. Biguanides were the most used class, followed by DPP-4 inhibitors and SGLT2 inhibitors, whereas GLP-1 receptor agonists, sulfonylureas, and insulin were less common. This therapeutic distribution guided the selection of representative antidiabetic agents for subsequent in vitro testing. Complete patient-level clinical data and full therapeutic profiles are provided in Supplementary Tables S1 and S2.
2.2. Plasma from Patients with T2DM Reduces Viability Across Prostate Cell Models
To determine whether plasma from patients with T2DM affected prostate cell viability, PC3, LNCaP, and HPEpiC cells were exposed to plasma from patients in the T2DM cohort. Across the three models, exposure to plasma from patients with T2DM consistently reduced viability relative to the untreated control condition, although the magnitude of this effect varied by cellular context. PC3 cells showed the strongest reduction, with a mean viability of 29.0 ± 3.9%. HPEpiC cells also displayed a marked decrease, reaching a mean viability of 53.1 ± 2.0%, whereas LNCaP cells showed a milder but still evident reduction, with a mean viability of 67.4 ± 13.6% (Figure 1).
Despite inter-patient variability, the viability pattern remained consistent across the cohort. PC3 cells showed the lowest viability values and the narrowest dispersion, indicating a recurrent sensitivity to plasma from patients with T2DM. LNCaP cells displayed the greatest inter-patient variability, suggesting a less uniform response in this androgen-responsive tumor context. HPEpiC cells were also consistently affected, although with narrower dispersion than LNCaP cells. Importantly, the pooled plasma sample reproduced the same overall response pattern observed with the individual patient-derived samples, supporting its use as a representative cohort-level exposure in subsequent experiments (Figure 1).
2.3. Antidiabetic Drugs Do Not Reproduce the Plasma-Associated Phenotype at Clinically Relevant Concentrations
To determine whether antidiabetic therapy could reproduce the viability phenotype observed under exposure to plasma from patients with T2DM, representative drugs from the major pharmacologic classes present in the cohort were tested in PC3, LNCaP, and HPEpiC cells. The overall response profile is summarized in Table 2, and dose-response curves for conditions in which an IC₅₀ could be determined are shown in Supplementary Figure S1.
Overall, none of the tested drugs reproduced the marked reduction in viability induced by plasma from patients with T2DM. Metformin and dapagliflozin did not reach an IC₅₀ in any of the three prostate cell models, and all insulin formulations likewise showed no detectable cytotoxic effect under the tested conditions. By contrast, liraglutide, vildagliptin, and gliclazide yielded measurable IC₅₀ values only in selected tumoral contexts. No IC₅₀ was identified in HPEpiC for any of the tested agents.
2.4. Hormonal Modulation Produces Biological Effects but Does Not Reproduce the Dominant Phenotype Induced by Plasma from Patients with T2DM
To investigate whether hormone-associated changes could contribute to the prostate cancer paradox, testosterone- and estradiol-based modulation was evaluated both indirectly, through macrophage polarization assays, and directly, through short-term exposure of prostate cell models to the same hormonal stimuli.
In Raw264.7 macrophages, hormonal stimulation produced morphologic changes consistent with polarization-associated activity (Figure 2). Relative to the negative control, LPS stimulation and selected hormonal conditions produced higher proportions of polarized cells, particularly testosterone at 10-9 M and estradiol at 10-6 M. By contrast, testosterone at 10-12 M did not reproduce this pattern. Transcriptional profiling further supported a predominantly pro-inflammatory response under selected conditions, with higher IL-1β, IL-6, and TLR4 expression and lower IL-10 expression relative to control levels. Among the tested conditions, testosterone at 10-9 M and estradiol at 10-6 M showed the clearest polarization-associated profile and were therefore selected for subsequent macrophage-based assays.
Direct hormone exposure also altered prostate cell viability, with responses varying by concentration and cellular context (Figure 3). In PC3 cells, testosterone at 10-6 M reduced viability to 85.3 ± 4.2%, whereas estradiol at 10-9 M and 10-12 M increased viability to 121.0 ± 11.8% and 112.7 ± 9.6%, respectively. In LNCaP cells, testosterone at 10-6 M reduced viability more markedly, to 66.6 ± 1.8%, while testosterone at 10-9 M and 10-12 M increased viability to 114.3 ± 9.9% and 110.3 ± 5.0%, respectively. Estradiol also increased LNCaP viability at 10-6 M and 10-9 M, reaching 108.2 ± 5.6% and 111.3 ± 2.9%. In contrast, no significant changes in viability were detected in HPEpiC cells under the tested hormonal conditions.
Additional macrophage-based assays are shown in Supplementary Figures S2–S5. Co-culture with hormonally conditioned macrophages did not reduce viability in any prostate cell model. Macrophage-conditioned medium produced selective, nonuniform effects: testosterone-associated conditioned media enhanced migration-related readouts in tumor cells under selected conditions, whereas HPEpiC cells showed a more inhibitory profile, including reduced proliferation and higher PTEN expression in specific conditions. These effects supported biologic activity of the hormone–macrophage axis but did not reproduce the strong viability loss induced by plasma from patients with T2DM.
2.5. T2DM Levels of Methylglyoxal Selectively Impaired HPEpiC Viability While Hyperglycemia Does Not Reproduce the Dominant Effect of Plasma from Patients with T2DM
To investigate whether hyperglycemia-associated conditions could reproduce the phenotype induced by plasma from patients with T2DM, PC3, LNCaP, and HPEpiC cells were exposed to increasing concentrations of glucose or methylglyoxal, and viability was assessed after 24 h (Figure 4).
Glucose exposure produced a selective response that was more evident in tumoral models than in HPEpiC cells. In PC3 cells, viability increased significantly at 5 mM, 15 mM, 20 mM, and 25 mM, reaching 110.4 ± 2.9%, 113.5 ± 4.2%, 118.8 ± 2.5%, and 121.9 ± 1.3%, respectively. In LNCaP cells, significant increases were observed only at the two highest concentrations tested, with viability reaching 112.7 ± 3.3% at 20 mM and 113.0 ± 2.2% at 25 mM. By contrast, HPEpiC cells did not show significant changes in viability across the tested glucose concentrations.
Methylglyoxal exposure produced a different pattern. No significant changes in viability were detected in PC3 or LNCaP cells within the tested range. In contrast, HPEpiC cells showed reduced viability at the highest concentrations, decreasing to 88.3 ± 1.3% at 210 nmol/L and 72.8 ± 9.1% at 240 nmol/L. Thus, glucose increased viability predominantly in tumoral models, whereas methylglyoxal reduced viability only in HPEpiC cells at the highest concentrations tested.
3. Discussion
The present findings show that none of the major single-factor explanations tested for the PCa–T2DM paradox could reproduce the acute viability phenotype seen with plasma from patients with T2DM. Patient-derived plasma consistently reduced viability across PC3, LNCaP, and HPEpiC cells, with the strongest and most consistent response in PC3. When plasma from different donors was pooled, the overall pattern remained similar to that seen with individual samples. In contrast, antidiabetic drugs, sex-steroid modulation, glucose, and methylglyoxal produced selective, model-dependent responses that differed in magnitude, distribution, or direction from the whole-plasma effect. Glucose increased viability in PC3 and LNCaP cells, while methylglyoxal preferentially reduced HPEpiC viability at the highest concentrations tested. These findings suggest that the acute phenotype induced by plasma from patients with T2DM should be understood as an integrated property of the circulating environment, rather than as the result of any single pharmacological, hormonal, glycemic, or glycation-related factor.
The inability of isolated factors to reproduce the plasma-associated phenotype is consistent with the systemic complexity of T2DM. Rather than reflecting a single circulating abnormality, T2DM integrates disturbances in glucose homeostasis, inflammatory signaling, endocrine regulation, carbonyl stress, and broader metabolic composition [2,11,13,14,15]. Hyperglycemia is a defining component of the disease, but it coexists with chronic low-grade inflammation and altered circulating inflammatory mediators [2,14]. Dicarbonyl stress adds another layer to this environment. Methylglyoxal, a reactive glycolytic by-product and major AGE precursor, is increased in diabetes and contributes to oxidative damage and tissue dysfunction [11,16,17]. Metabolomic studies further demonstrate reproducible alterations in circulating amino acids and intermediary metabolites in T2DM, reinforcing the view that the diabetic plasma environment represents a coordinated biochemical state rather than an isolated disturbance in glucose concentration [15]. Importantly, this complexity implies that the biological effect of diabetic plasma may emerge from interactions among circulating components whose isolated actions can differ substantially from their behavior within the complete systemic environment. The failure of glucose, methylglyoxal, hormones, or individual drugs to reproduce the plasma phenotype therefore supports a model in which the biological activity of plasma from patients with T2DM emerges from the combined circulating environment [14,15,17].
The reproducibility of the viability phenotype across individual donor plasmas supports the presence of a shared biological signal within the T2DM cohort. Even though age, disease duration, body composition, metabolic control, and treatment history varied among donors, PC3 cells consistently showed the strongest response, and pooled plasma maintained the overall pattern seen in individual samples. This means that the phenotype was not driven by a small subset of donors and could still be detected when inter-individual variation was combined at the cohort level. It is possible that non-antidiabetic medications contributed to the biochemical composition of individual samples. However, reported associations between statins, aspirin, renin–angiotensin system inhibitors, beta-blockers, and PCa or cancer outcomes are heterogeneous and mostly come from chronic observational exposures [18,19,20,21]. These factors do not provide a clear single explanation for the recurrent acute phenotype observed across the cohort. Rather, persistence of the response despite donor heterogeneity suggests that the relevant biological signal is either shared across different diabetic profiles or arises from convergent systemic alterations that remain functionally detectable despite variation in their individual composition .
A second major feature of the present findings is that susceptibility to the diabetic circulating environment was strongly conditioned by cellular state. PC3 showed the largest and most reproducible loss of viability, while LNCaP showed a weaker, more variable response, and HPEpiC remained clearly susceptible to the exposure. This means that the effect was not limited to malignant cells and was not uniform across prostate models. Instead, the response magnitude depended on the biological state of each cell type. This interpretation fits with the known differences in lineage identity, androgen dependence, molecular background, stress adaptation, and death competence among commonly used prostate cell models [22,23,24,25]. These findings do not require HPEpiC, LNCaP, and PC3 to represent a linear disease progression. Instead, they show that the same circulating exposure can produce different outcomes depending on the prostate cell’s biological state. This distinction is mechanistically important because it provides a framework for interpreting the isolated-factor experiments: if one circulating abnormality were primarily responsible for the whole-plasma phenotype, its effects would be expected to reproduce, at least approximately, not only the magnitude but also the cellular distribution of the response. This was not observed. Instead, pharmacological, hormonal, glycemic, and carbonyl perturbations generated distinct response patterns across PC3, LNCaP, and HPEpiC, indicating that the PC3-dominant susceptibility to diabetic plasma cannot be reduced to the direct action of any one of these components.
The pharmacological experiments did not support direct exposure to the major antidiabetic drug classes as the main cause of the acute plasma phenotype. It was found that metformin, dapagliflozin, and the tested insulin formulations did not reach an IC₅₀ in any prostate cell model, while liraglutide, vildagliptin, and gliclazide produced measurable cytotoxicity only in selected malignant contexts. None of these drugs reproduced the broad response seen with plasma from patients with T2DM. Pharmacological activity observed in vitro is most meaningful when considered in relation to clinically achievable exposures, such as Cmax, AUC, protein binding, and the pharmacologically available fraction [26]. This is especially valid for metformin, since many reported anticancer effects require millimolar concentrations in vitro, which are much higher than the systemic concentrations reached during clinical treatment [27,28]. Clinical pharmacokinetic data also provide the right context for interpreting the concentrations tested for dapagliflozin, liraglutide, vildagliptin, and gliclazide [29,30,31,32]. In this context, the cytotoxic concentrations observed for some agents do not fit with a simple direct-exposure explanation for the plasma-associated phenotype. Moreover, the selective responses produced by some compounds show that these drugs can influence prostate-cell fitness under experimental conditions, but their activity did not reproduce the characteristic cross-model pattern induced by diabetic plasma. These findings therefore separate possible long-term oncological effects of antidiabetic therapy from the acute cellular response produced by whole plasma.
This distinction is important because antidiabetic drugs may still affect PCa biology through mechanisms that are not reflected by acute cytotoxicity. Epidemiological and clinical evidence has linked metformin to PCa incidence or outcomes in some populations, but the strength and consistency of these associations vary depending on the endpoint and analytical approach [6,33]. Recent studies have also examined associations between SGLT2 inhibitors, GLP-1 receptor agonists, DPP-4 inhibitors, and cancer or PCa risk [7,34,35,36]. These observations reflect chronic treatment, systemic metabolic effects, and possibly indirect mechanisms, making them biologically distinct from a rapid reduction in cell viability after direct exposure. The current data do not rule out these longer-term possibilities; instead, they show that direct exposure to the tested drug classes does not explain the main acute effect produced by whole plasma. Thus, treatment history may contribute to the long-term systemic context in which PCa develops or progresses without being the proximate cause of the acute phenotype reproduced by patient plasma in this experimental setting [33,34,35,36].
Sex-steroid modulation was biologically active but did not reproduce the plasma-associated phenotype. It is known that altered androgen and estrogen balance is a feature of obesity and T2DM in men, with lower testosterone and changes in aromatase-dependent estrogen biology contributing to endocrine remodeling in these conditions [37,38,39]. In these experiments, testosterone and estradiol changed viability in selected prostate cell contexts and modified macrophage-associated responses, showing that endocrine changes can influence both epithelial and immune compartments. However, the direction and magnitude of these effects depended strongly on hormone concentration and the cellular model. Direct hormone exposure increased or decreased tumor-cell viability, while HPEpiC was comparatively insensitive under the tested conditions. Similarly, hormone-conditioned macrophages and their secreted products changed selected inflammatory, proliferative, migratory, and survival-associated readouts but did not reproduce the marked plasma-induced loss of viability. This context dependence fits with the known ability of estrogens and androgen signaling to remodel macrophage inflammatory states [40,41] and with evidence that macrophage androgen-receptor signaling can directly influence prostate tumor biology [42]. The endocrine experiments therefore provide evidence that hormonal remodeling can alter prostate-cell and macrophage behavior, but they also reveal a response topology distinct from that induced by diabetic plasma. This is important because it argues against a simple endocrine explanation while leaving open the possibility that sex-steroid alterations contribute to the composite diabetic environment through interactions with inflammatory and metabolic pathways [37,38,39,40,41,43]. Immune–endocrine remodeling can contribute to the biological environment associated with T2DM, but the present data do not support it as a sufficient explanation for the dominant plasma phenotype.
Glucose and methylglyoxal were found to provide especially informative contrasts because their effects differed from each other and from whole plasma. When glucose concentrations increased, viability improved in PC3 cells and, at higher concentrations, in LNCaP cells, while HPEpiC viability stayed mostly unchanged. This response was in the opposite direction to the reduction in viability caused by plasma from patients with T2DM, which argues against hyperglycemia alone as the main cause of the acute plasma-associated phenotype. This direction matches previous experimental work in PC3 cells, where a high-glucose environment was shown to enhance proliferation and other tumor-associated behaviors [44]. More generally, PCa cells are known to have substantial metabolic plasticity, with glucose utilization and glycolytic dependencies varying by lineage state and disease context [45,46,47]. The opposing responses to isolated glucose and diabetic plasma are particularly informative because they indicate that increased substrate availability does not inherently impose the loss of cellular fitness observed with the complete diabetic circulating environment. In PC3, the model most strongly affected by diabetic plasma, additional glucose instead supported viability. The glucose response seen here therefore highlights an important distinction: the biological effect of plasma from patients with T2DM cannot be explained simply by increased glucose availability [44].
Methylglyoxal was found to produce a different pattern, preferentially reducing HPEpiC viability at the highest concentrations tested, while no similar response was seen in PC3 or LNCaP. This shows that glycation-associated stress is biologically active in the diabetic context, but its cellular distribution differs from the PC3-dominant plasma phenotype. Methylglyoxal is a major precursor of AGEs and can promote oxidative injury, DNA damage, protein modification, and cell-death signaling [11,48,49]. Methylglyoxal-associated cytotoxicity has also been shown directly in PCa cells, supporting the broader importance of carbonyl stress in prostate biology [50]. Its circulating concentration increases in diabetes, further supporting the physiological relevance of chronic dicarbonyl exposure [16,17]. The response in HPEpiC therefore points to a distinct epithelial sensitivity to methylglyoxal under these conditions, while also showing that methylglyoxal alone cannot explain the broader effect of plasma from patients with T2DM. Considered together, the glucose and methylglyoxal experiments reveal two qualitatively different components of diabetic biology: increased glucose availability preferentially favored viability in malignant cells, whereas high carbonyl stress preferentially compromised non-tumoral HPEpiC. Neither response reproduced the PC3-dominant pattern generated by whole diabetic plasma. Whole plasma likely reflects how multiple metabolic and stress signals integrate within each cellular background.
Evidence from diabetic tissues and AGE/RAGE biology provides additional context for this epithelial response. Experimental diabetes has been associated with prostate epithelial atrophy, altered glandular organization, and stromal remodeling in rodent models, although these systems do not fully reproduce insulin-resistant human T2DM [51]. Related evidence of epithelial atrophy and fibrosis in male reproductive tissue from individuals and experimental models with T2DM further supports chronic diabetic stress’s capacity to alter tissue homeostasis [52]. Glycation-associated signaling is also directly relevant to PCa. RAGE expression has been reported to increase in prostate neoplasia, particularly in the presence of diabetes, while experimental RAGE inhibition can promote apoptosis and restrict prostate tumor growth [53,54]. AGE-modified extracellular matrix can additionally alter PCa cell behavior through matrix–cell interactions [55]. Together, these observations reinforce the biological relevance of glycation and diabetic tissue stress while emphasizing that their consequences depend strongly on cellular and microenvironmental context. They also help reconcile the apparent discrepancy between the limited effect of acute methylglyoxal exposure on malignant cells in the present experiments and the broader evidence implicating AGE/RAGE biology in PCa. Chronic glycation-associated signaling, extracellular-matrix modification, and tissue remodeling are mechanistically distinct from short-term exposure to a single reactive carbonyl and may therefore influence prostate biology without reproducing the acute viability response observed [48,49,51,52,53,54].
Across these experiments, a consistent conceptual pattern emerges. The isolated factors were not biologically inert; several produced clear effects on viability, inflammatory signaling, migration, or macrophage-associated responses. They failed to reproduce the combination of magnitude, direction, and cell-state distribution generated by whole diabetic plasma. This distinction argues against interpreting the negative single-factor comparisons as evidence that glucose, carbonyl stress, hormones, or pharmacological exposures are irrelevant to the diabetic environment. Rather, these components may contribute to a higher-order systemic state in which simultaneous changes in inflammatory mediators, metabolites, endocrine signals, redox balance, and other circulating factors modify their effects [14,15,17]. The plasma from patients with T2DM phenotype may therefore represent an emergent biological property of the circulating environment, expressed differently according to the exposed prostate cell’s intrinsic adaptive capacity. Such a model also provides a plausible framework for the particularly strong PC3 response: the relevant determinant may not be exposure to a uniquely toxic circulating factor, but an interaction between the composite diabetic environment and vulnerabilities specific to the PC3 cellular state.
Several limitations should be considered when interpreting these findings. The T2DM cohort was relatively small, which did not allow for adequately powered stratification by obesity, treatment regimen, disease duration, or metabolic control. The experiments modeled acute exposure in vitro, so they did not reproduce endocrine feedback, tissue architecture, drug metabolism, stromal organization, or the full immune environment. RAW264.7 cells were used as a tractable model of macrophage responses, but these are murine cells and their phenotype can change with culture history and passage [56]. Finally, treatments were performed on 24-hour viability responses; exposure duration can greatly affect apparent drug sensitivity and IC₅₀ estimates [57], and metabolic viability assays measure cellular impairment without identifying the specific regulated cell-death pathway [58]. These limitations are particularly relevant to interpreting the whole-plasma effect: the present experiments identify a reproducible cell-state-dependent phenotype but do not establish which combination of circulating components is necessary or sufficient to generate it, nor whether the same response is maintained during chronic exposure. Future work should resolve the circulating determinants of this phenotype and establish whether its cell-state dependence is maintained under chronic exposure.
4. Materials and Methods
4.1. Human Plasma Cohort and Sample Processing
Human plasma was obtained from a cohort of 16 men diagnosed with T2DM, recruited at the Centro Hospitalar Universitário do Porto and the Centro Hospitalar de Vila Nova de Gaia/Espinho, after written informed consent. The local ethics committee approved the study (approval no. 227/2018-2 CHVNG/E). Clinical data were collected according to standardized procedures and included age, duration of T2DM diagnosis, body weight, height, BMI, fasting glucose, glycated hemoglobin (HbA1c), lactate dehydrogenase (LDH), total cholesterol, triglycerides, high-density lipoprotein (HDL), low-density lipoprotein (LDL), and current antidiabetic medication. Plasma was isolated from whole blood by centrifugation at 4 °C for 10 min at 4000 rpm. The supernatant was collected, heat-inactivated at 56 °C for 30 min, filtered through a sterile 0.22 μm membrane, and stored at −80 °C until use.
For in vitro experiments, patient-derived plasma samples were analyzed individually. In addition, an equal-volume pooled plasma sample from patients with T2DM, representative of the cohort average, was generated by combining plasma from all 16 patients.
4.2. Cell Models and Culture Conditions
Three prostate cell models were used: PC3, LNCaP, and HPEpiC. PC3 and LNCaP were tumoral models, whereas HPEpiC was a non-tumoral epithelial comparator. All cell lines were maintained in RPMI-1640 medium (Biowest, VWR, P0860-N10L) supplemented with 10% FBS and 1% penicillin/streptomycin. Cells were cultured at 37 °C in a humidified atmosphere containing 5% CO₂.
For all experimental conditions, cells were seeded at densities adjusted to each model and assay, as described below. Culture conditions were kept constant across experiments unless otherwise specified.
4.3. Exposure to Plasma from Patients with T2DM
To evaluate the direct effect of plasma from patients with T2DM on prostate cell viability, PC3, LNCaP, and HPEpiC cells were exposed to individual patient-derived plasma samples from the cohort. For MTS-based viability assays, PC3 cells were seeded at 1.0 × 10⁵ cells/mL, LNCaP cells at 2.0 × 10⁵ cells/mL, and HPEpiC cells at 2.5 × 10⁵ cells/mL in 96-well plates and allowed to grow until approximately 80% confluence. Plasma treatments were performed in FBS-free RPMI-1640 containing 10% patient-derived plasma. The corresponding control consisted of cells maintained under identical culture conditions without human plasma supplementation.
After treatment, the cell monolayer was washed with warm PBS and incubated with CellTiter 96® AQueous ONE Solution reagent (MTS, Promega) diluted to a final concentration of 15% in culture medium. After 1 h at 37 °C and 5% CO₂, absorbance was measured at 492 nm using a Multiskan Ascent® microplate reader (Thermo Fisher Scientific). Results were obtained in triplicate and normalized to the untreated control, defined as 100% viability.
This assay was initially performed on individual plasma samples from each patient in the cohort. In addition, a pooled plasma sample from patients with T2DM, representative of the cohort average, was generated for subsequent experimental use.
4.4. Selection and Testing of Antidiabetic Drugs
To evaluate whether antidiabetic therapy could reproduce the phenotype associated with exposure to plasma from patients with T2DM, one representative drug from each major antidiabetic class present in the patient cohort was selected for in vitro testing. Drug selection was based on the therapeutic profiles identified in the recruited patients. Within each pharmacological class, the most frequently used drug (or, when relevant, the most representative agent in the cohort) was selected for subsequent viability testing. These experiments were performed independently of the plasma exposure assays.
The drugs tested were metformin (biguanide), dapagliflozin (SGLT-2 inhibitor), liraglutide (GLP-1 receptor agonist), vildagliptin (DPP-4 inhibitor), gliclazide (sulfonylurea), and insulin formulations representing human recombinant, rapid-acting, and long-acting insulin exposure. Concentration ranges were defined based on estimates of bloodstream exposure and pharmacokinetic data from the literature. The tested ranges were 20–2000 µM for metformin, 0.005–20.000 µM for dapagliflozin, 0.01–10.00 µM for liraglutide, 0.1–10.0 µM for vildagliptin, 500–50000 µM for gliclazide, and 1–30 µUI/mL for insulin.
For viability testing, cells were exposed to each drug for 24 h, diluted in culture medium containing 0.1% DMSO. Cytotoxicity was then assessed using an MTS assay, following the same general procedure as for plasma exposure. IC₅₀ values were determined, when applicable, by fitting dose–response curves to a four-parameter logistic model and selecting the concentration that yielded a 50% reduction in viability within the tested concentration range. Experiments were performed in independent triplicate, and results were normalized to the corresponding vehicle-treated control, which was set to 100%.
4.5. Hormonal Modulation in Macrophage and Prostate Cell Models
To evaluate whether hormone-associated changes could contribute to the PCa paradox, testosterone- and estradiol-based treatments were assessed both directly in prostate cell models and indirectly through macrophage modulation.
For direct hormonal exposure, PC3, LNCaP, and HPEpiC cells were incubated for 24 h in RPMI-1640 medium containing testosterone (T5641, Merck) or estradiol (E2758, Merck) at 10⁻⁶, 10⁻⁹, and 10⁻¹² M. Hormones were dissolved in 0.1% DMSO. Cell viability was then determined by MTS assay.
To investigate hormone-associated immune modulation, the murine macrophage cell line Raw264.7 was cultured in DMEM (Biowest, VWR, P0103-N10L) supplemented with 10% FBS and 1% penicillin/streptomycin, under standard conditions (37 °C, humidified atmosphere, 5% CO₂). After reaching confluence, cells were split 1:8, and macrophage polarization was induced when the monolayer reached approximately 70% confluence. Lipopolysaccharide (LPS; L2654, Merck) at a final concentration of 10 ng/mL was used as a positive control for M1-like polarization, whereas incomplete medium served as a negative control. Testosterone or estradiol was added together with LPS at final concentrations of 10⁻⁶, 10⁻⁹, and 10⁻¹² M.
After 24 h of stimulation, the macrophage monolayer was washed with PBS and documented using an inverted microscope (Invitrogen™ EVOS™ XL Core Imaging System) at 20× magnification. Fresh incomplete medium was then added for an additional 24 h to produce macrophage-conditioned medium (secretome, used later at 100% concentration). At the end of this period, conditioned medium was collected and stored at −80 °C for subsequent use. Polarized macrophages were either processed for RNA extraction or used in co-culture experiments with prostate cell models.
For co-culture-based viability experiments, PC3, LNCaP, and HPEpiC cells were exposed for 24 h to either polarized macrophages or macrophage-conditioned medium. Viability was determined using the MTT assay (Abcam) at a final concentration of 0.5 mg/mL for 2 h at 37 °C and 5% CO₂. After discarding the MTT solution, 100 μL of DMSO was added, and absorbance was measured at 570 nm in a Multiskan Ascent® microplate reader. Results were obtained in triplicate and normalized to the respective untreated control condition, defined as 100%.
Cell proliferation under macrophage-conditioned medium was assessed by BrdU incorporation using a BrdU kit (Roche Diagnostics). PC3, LNCaP, and HPEpiC were incubated with the corresponding treatments and 0.01 mM BrdU for 24 h. Optical density was measured at 660 nm, and results were normalized to the control condition.
Cell migration was evaluated using a scratch (injury) assay. PC3, LNCaP, and HPEpiC were seeded in 6-well plates at 4.0 × 10⁵, 6.0 × 10⁵, and 8.0 × 10⁵ cells/mL, respectively, until confluence. A wound was then created using a pipette tip, treatments were applied, and images were acquired immediately after scratching and again after 24 h. Wound width was quantified using ImageJ software, and migration was expressed relative to the control condition.
4.6. RNA Extraction and RT-qPCR
RNA extraction and one-step RT-qPCR were performed to evaluate macrophage polarization markers and survival-associated genes in prostate cell models. Raw264.7, PC3, LNCaP, and HPEpiC cells were grown until confluence and exposed to the corresponding treatments. Cells were then washed with PBS, detached, and centrifuged at 950 rpm and 37 °C for 3 min.
Total RNA was extracted using the Lab-Aid 824s Nucleic Acid Extraction System (Zeesan). RNA purity was assessed in a Thermo Scientific™ Multiskan SkyHigh microplate spectrophotometer by measuring the A260/A280 and A260/A230 ratios. Gene-specific primers were designed using Primer-BLAST and obtained from Integrated DNA Technologies Europe. Primer sequences are provided in Table II.1.
RT-qPCR was performed using the NZY One-step RT-qPCR Probe kit, ROX (NZYTech), on a qTOWER3 system (Analytik Jena). Relative expression was calculated using the 2⁻ΔΔCT method, with 18S as the housekeeping gene. RT-qPCR analyses were performed in three independent biological experiments, with technical duplicates in each run.
For macrophage polarization analysis, the following genes were evaluated: IL-1β, IL-6, IL-10, and TLR4. For prostate cell response analysis, the following genes were assessed: AKT1, PIK3CA, mTOR, and PTEN.

Table 3.
Set of primer sequences for the one-step multiplex RT-qPCR.
| Gene | Primer Forward | Primer Reverse | Finality |
|---|---|---|---|
| IL-1β | ACCTAGCTGTCAACGTGTGG | TCAAAGCAATGTGCTGGTGC | For macrophage polarization |
| IL-6 | TGTGTGAAAGCAGCAAAGAGG | TTTTCACCAGGCAAGTCTCC | |
| IL-10 | TGAAAACAAGAGCAAGGCCG | ATAGAGTCGCCACCCTGATG | |
| TLR4 | GGATTTATCCAGGTGTGAAAT | TTTGTCTCCACAGCCACCAG | |
| AKT1 | GCAAGGAGGGGATCAAGGAC | CCTGGTTGTAGAAGGGCAGG | For cell survival assessment in prostate cell lines |
| PiK3CA | TGCATTGTTTTGCACCCCAAA | TAGTGCCTGAGCCTCATCTA | |
| mTOR | TTGGCTGTGCCAGGAACATA | GGCCTCTGCTTGGATGTGAT | |
| PTEN | TCCATCCTGCAGAAGAAGCC | CTGTCATGTCTGGGAGCCTG | |
| 18s | ACCGCAGCTAGGAATAATGGA | CCTCAGTTCCGAAAACCA | Housekeeping |
4.7. Glucose and Methylglyoxal Exposure
To investigate whether hyperglycemia-associated conditions could reproduce the phenotype associated with exposure to plasma from patients with T2DM, PC3, LNCaP, and HPEpiC cells were exposed to increasing concentrations of glucose or methylglyoxal.
For glucose exposure, cells were incubated for 24 h in RPMI-1640 glucose-free medium supplemented with glucose concentrations ranging from 5 to 25 mM. For glycation stress, methylglyoxal was tested at concentrations of 60 to 240 nmol/L. These ranges were selected to represent conditions spanning physiological to diabetic-associated levels.
After treatment, cell viability was determined by MTS assay following the same general procedure described for exposure to plasma from patients with T2DM. Experiments were performed in triplicate, and results were normalized to the untreated control, set to 100%.
4.8. Statistical Analysis
Data are presented as mean ± standard deviation (SD). Statistical comparisons were performed using one-way ANOVA followed by Dunnett’s multiple comparisons test in GraphPad Prism 8.0.2. Differences were considered statistically significant when p < 0.05.
5. Conclusions
Taken together, these findings establish plasma from patients with T2DM as an integrated experimental exposure whose acute effects on prostate cells could not be reproduced by the major isolated pharmacological, hormonal, glycemic, or glycation-related explanations tested here. The response was found to be strongly dependent on cell state, with PC3 showing the greatest and most reproducible loss of viability, while LNCaP and HPEpiC displayed distinct response profiles. In this experimental framework, the PCa–T2DM paradox cannot be explained by a single circulating factor or treatment-associated effect. Instead, the data suggest an interaction between the composite diabetic circulating environment and the biological state of the responding prostate cell. Importantly, this shifts the explanatory focus from identifying a single diabetogenic factor with direct toxicity toward understanding how a multidimensional systemic environment interacts with cell-intrinsic metabolic and stress-response programs. The divergent responses to glucose, methylglyoxal, hormonal modulation, and pharmacological exposure further indicate that different components of T2DM biology can act in distinct, and sometimes opposing, directions depending on cellular context. Determining how distinct metabolic plasma environments reshape cellular fitness and death competence across prostate cell states will therefore be important for resolving the biological basis of the PCa–T2DM paradox.
Supplementary Materials
The following supporting information can be downloaded at the website of this paper posted on Preprints.org.
Author Contributions
Conceptualization, APS, CL, DMM, RC, MGA, RF; methodology, APS, ACR, ACP, CL, JR, DF, RS, FD, PeB, RC, MGA, RF, ; software, APS, ACR, ACP, JR, DF; validation, RC, MGA, RF; formal analysis, APS, RC, MGA, RF; investigation, APS, RC, MGA, RF; resources, APS, ACP, PB, RS, RC, MGA, RF; data curation, APS, RC, MGA, RF; writing—original draft preparation, APS, RC, MGA, RF; writing—review and editing, APS, PB, RS, RC, MGA, RF; visualization, APS, RC, MGA, RF; supervision, RC, MGA, RF; project administration, APS, RC, MGA, RF; funding acquisition, ACP, DMM, PB, PeB, RC, MGA, RF. All authors have read and agreed to the published version of the manuscript.
Funding
Pilar Baylina (PB) and Rúben Fernandes (RF) acknowledge on the behalf of the authors the support of Fundação para a Ciência e Tecnologia (FCT), Portuguese Government, under the Strategic Project Reference: NORTE-01-0145-FEDER-000012, UID/BIM/04293/2013. PB & RF were also supported by FEDER/02/SAICT/2020/072560. ACR acknowledges FCT under the Project Reference: 2022.09032.PTDC. MGA supported this research through FCT funding to IBIMED (UIDP/04501/2020 and UIDB/04501/2020).
Institutional Review Board Statement
The study was conducted in accordance with the Declaration of Helsinki, and approved by the Ethics Committee of Secretariado da Comissão de Ética, Serviço de Medicina Interna do Hospital de Gaia/Espinho (approval no. 227/2018-2, approved on 18 July 2019). and the Comissão de Ética para a Saúde, Hospital-Escola da Fundação Fernando Pessoa (approval no. 09/2023, approved on 4 May 2023).
Informed Consent Statement
Informed consent was obtained from all subjects involved in the study. Written informed consent has been obtained from the patient(s) to publish this paper.
Data Availability Statement
The original contributions presented in this study are included in the article/supplementary material. Further inquiries can be directed to the corresponding author(s).
Acknowledgments
Graphical Abstract were conceived and sketched by the authors and assembled it in Microsoft PowerPoint. OpenAI ChatGPT was used to assist in refining the English text, organization, formatting, and overall visual layout. The authors defined and verified the scientific content and interpretation.
Conflicts of Interest
The authors declare no conflicts of interest.
References
- Sousa, A.P.; Costa, R.; Alves, M.G.; Soares, R.; Baylina, P.; Fernandes, R. The Impact of Metabolic Syndrome and Type 2 Diabetes Mellitus on Prostate Cancer. Front Cell Dev Biol. 2022, 10, 843458. [Google Scholar] [CrossRef] [PubMed] [PubMed Central]
- Ahmad, E.; Lim, S.; Lamptey, R.; Webb, D.R.; Davies, M.J. Type 2 diabetes. Lancet 2022, 400(10365), 1803–20. [Google Scholar] [CrossRef] [PubMed]
- Drab, A.; Wdowiak, K.; Kanadys, W.; Zajączkowski, K.; Koczkodaj, P.; Religioni, U.; et al. Diabetes Mellitus and Prostate Cancer Risk—A Systematic Review and Meta-Analysis. Cancers 2024, 16(23), 4010. [Google Scholar] [CrossRef] [PubMed] [PubMed Central]
- Pagano, A.P.; da Silva, B.R.; Vieira, F.T.; Meira Filho, L.F.; Purcell, S.A.; Lewis, J.D.; et al. Association Between Diabetes and Risk of Prostate Cancer: A Systematic Review and Meta-Analysis of Observational Studies. World J. Mens. Health 2025, 43(2), 304–20. [Google Scholar] [CrossRef] [PubMed]
- Amirmokri, A.J.; Loffredo, C.A.; Makambi, K.H.; Dawson, N.A. Assessing the relationship between cardiometabolic diseases and the risk of developing aggressive prostate cancer: a systematic review and meta-analysis. BMC Cancer 2025, 25, 1645. [Google Scholar] [CrossRef] [PubMed] [PubMed Central]
- Cui, H.; Wang, Y.; Yang, S.; He, G.; Jiang, Z.; Gang, X.; et al. Antidiabetic medications and the risk of prostate cancer in patients with diabetes mellitus: A systematic review and meta-analysis. Pharmacol. Res. 2022, 177, 106094. [Google Scholar] [CrossRef] [PubMed]
- Chou, O.H.I.; Lu, L.; Chung, C.T.; Chan, J.S.K.; Chan, R.N.C.; Lee, A.Y.H.; et al. Comparisons of the risks of new-onset prostate cancer in type 2 diabetes mellitus between SGLT2I and DPP4I users: A population-based cohort study. Diabetes Metab. 2025, 51(1), 101571. [Google Scholar] [CrossRef] [PubMed]
- Lafront, C.; Germain, L.; Campolina-Silva, G.H.; Weidmann, C.; Berthiaume, L.; Hovington, H.; et al. The estrogen signaling pathway reprograms prostate cancer cell metabolism and supports proliferation and disease progression. J Clin Invest. 2024, 134(11), e170809. [Google Scholar] [CrossRef] [PubMed] [PubMed Central]
- Christakoudi, S.; Tsilidis, K.K.; Evangelou, E.; Riboli, E. Interactions of obesity, body shape, diabetes and sex steroids with respect to prostate cancer risk in the UK Biobank cohort. Cancer Med. 2024, 13(3), e6918. [Google Scholar] [CrossRef] [PubMed] [PubMed Central]
- Di, H.; Wen, Y.; Wang, J.; Wang, J.; Wang, Y.; Li, Y.; et al. The impact of obesity and sexual behavior on prostate cancer risk is mediated by testosterone levels: a mendelian randomization study and mediation analysis. Prostate Int. 2024, 12(2), 96–103. [Google Scholar] [CrossRef] [PubMed] [PubMed Central]
- Vašková, J.; Kováčová, G.; Pudelský, J.; Palenčár, D.; Mičková, H. Methylglyoxal Formation—Metabolic Routes and Consequences. Antioxidants 2025, 14(2), 212. [Google Scholar] [CrossRef] [PubMed]
- Hsia, Y.J.; Lin, Z.M.; Zhang, T.; Chou, T.C. Butyrate increases methylglyoxal production through regulation of the JAK2/Stat3/Nrf2/Glo1 pathway in castration-resistant prostate cancer cells. Oncol. Rep. 2024, 51(5), 1–13. [Google Scholar] [CrossRef] [PubMed]
- Li, J.; Li, Z.P.; Xu, S.S.; Wang, W. Unraveling the biological link between diabetes mellitus and prostate cancer: Insights and implications. World J. Diabetes 2024, 15(6), 1367–73. [Google Scholar] [CrossRef] [PubMed]
- Pellegrini, V.; La Grotta, R.; Carreras, F.; Giuliani, A.; Sabbatinelli, J.; Olivieri, F.; et al. Inflammatory Trajectory of Type 2 Diabetes: Novel Opportunities for Early and Late Treatment. Cells 2024, 13(19), 1662. [Google Scholar] [CrossRef] [PubMed] [PubMed Central]
- Sun, Y.; Gao, H.Y.; Fan, Z.Y.; He, Y.; Yan, Y.X. Metabolomics Signatures in Type 2 Diabetes: A Systematic Review and Integrative Analysis. J. Clin. Endocrinol. Metab. 2020, 105(4), 1000–8. [Google Scholar] [CrossRef] [PubMed]
- Nemet, I.; Varga-Defterdarović, L.; Turk, Z. Preparation and quantification of methylglyoxal in human plasma using reverse-phase high-performance liquid chromatography. Clin. Biochem. 2004, 37(10), 875–81. [Google Scholar] [CrossRef] [PubMed]
- Lu, J.; Randell, E.; Han, Y.; Adeli, K.; Krahn, J.; Meng, Q.H. Increased plasma methylglyoxal level, inflammation, and vascular endothelial dysfunction in diabetic nephropathy. Clin. Biochem. 2011, 44(4), 307–11. [Google Scholar] [CrossRef] [PubMed]
- Sun, J.X.; Liu, C.Q.; Zhong, X.Y.; Xu, J.Z.; An, Y.; Xu, M.Y.; et al. Statin Use and the Risk of Prostate Cancer Biochemical Recurrence Following Definitive Therapy: A Systematic Review and Meta-Analysis of Cohort Studies. Front Oncol. 2022, 12. [Google Scholar] [CrossRef] [PubMed]
- Ma, S.; Xia, W.; Wu, B.; Sun, C.; Jiang, Y.; Liu, H.; et al. Effect of aspirin on incidence, recurrence, and mortality in prostate cancer patients: integrating evidence from randomized controlled trials and real-world studies. Eur. J. Clin. Pharmacol. 2023, 79(11), 1475–503. [Google Scholar] [CrossRef] [PubMed]
- Shin, K.; Yang, J.; Yu, Y.; Son, E.; Kim, K.; Kim, Y.H. Angiotensin-converting enzyme inhibitors or angiotensin receptor blockers and cancer risk: an updated meta-analysis of observational studies. Ther Adv Drug Saf 2022, 13, 20420986221129335. [Google Scholar] [CrossRef] [PubMed] [PubMed Central]
- Uleri, A.; Baboudjian, M.; Tedde, A.; Rajwa, P.; Pradere, B.; Gallioli, A.; et al. The association between beta-blockers use and prostate cancer mortality: A mini systematic review and meta-analysis. The Prostate 2024, 84(1), 3–7. [Google Scholar] [CrossRef] [PubMed]
- Campbell, K.J.; Leung, H.Y. Evasion of cell death: A contributory factor in prostate cancer development and treatment resistance. Cancer Lett. 2021, 520, 213–21. [Google Scholar] [CrossRef] [PubMed]
- Basak, D.; Gregori, L.; Johora, F.; Deb, S. Preclinical and Clinical Research Models of Prostate Cancer: A Brief Overview. Life 2022, 12(10), 1607. [Google Scholar] [CrossRef] [PubMed] [PubMed Central]
- Germain, L.; Lafront, C.; Paquette, V.; Neveu, B.; Paquette, J.S.; Pouliot, F.; et al. Preclinical models of prostate cancer — modelling androgen dependency and castration resistance in vitro, ex vivo and in vivo. Nat. Rev. Urol. 2023, 20(8), 480–93. [Google Scholar] [CrossRef] [PubMed]
- Beatson, E.L.; Risdon, E.N.; Napoli, G.C.; Price, D.K.; Chau, C.H.; Figg, W.D. Genomic Characterization of Preclinical Prostate Cancer Cell Line Models. Int J Mol Sci. 2024, 25(11), 6111. [Google Scholar] [CrossRef] [PubMed] [PubMed Central]
- Liston, D.R.; Davis, M. Clinically relevant concentrations of anticancer drugs: A guide for nonclinical studies. Clin Cancer Res Off J Am Assoc Cancer Res 2017, 23(14), 3489–98. [Google Scholar] [CrossRef] [PubMed] [PubMed Central]
- Dowling, R.J.O.; Niraula, S.; Stambolic, V.; Goodwin, P.J. Metformin in cancer: translational challenges. J. Mol. Endocrinol. 2012, 48(3), R31–43. [Google Scholar] [CrossRef] [PubMed]
- Li, L.; Guan, Z.; Li, R.; Zhao, W.; Hao, G.; Yan, Y.; et al. Population pharmacokinetics and dosing optimization of metformin in Chinese patients with type 2 diabetes mellitus. Medicine (Baltimore) 2020, 99(46), e23212. [Google Scholar] [CrossRef] [PubMed] [PubMed Central]
- Watada, H.; Shiramoto, M.; Ueda, S.; Tang, W.; Asano, M.; Thorén, F.; et al. Pharmacokinetics and pharmacodynamics of dapagliflozin in combination with insulin in Japanese patients with type 1 diabetes. Diabetes Obes Metab. 2019, 21(4), 876–82. [Google Scholar] [CrossRef] [PubMed] [PubMed Central]
- Watson, E.; Jonker, D.M.; Jacobsen, L.V.; Ingwersen, S.H. Population Pharmacokinetics of Liraglutide, a Once-Daily Human Glucagon-Like Peptide-1 Analog, in Healthy Volunteers and Subjects With Type 2 Diabetes, and Comparison to Twice-Daily Exenatide. J. Clin. Pharmacol. 2010, 50(8), 886–94. [Google Scholar] [CrossRef] [PubMed]
- Główka, F.K.; Hermann, T.W.; Zabel, M. Bioavailability of gliclazide from some formulation tablets. Int. J. Pharm. 1998, 172(1), 71–7. [Google Scholar] [CrossRef]
- He, Y.L.; Serra, D.; Wang, Y.; Campestrini, J.; Riviere, G.J.; Deacon, C.F.; et al. Pharmacokinetics and Pharmacodynamics of Vildagliptin in Patients with Type 2 Diabetes Mellitus. Clin. Pharmacokinet. 2007, 46(7), 577–88. [Google Scholar] [CrossRef] [PubMed]
- Liu, Y.; Zhang, Q.; Huang, X. Effect of metformin on incidence, recurrence, and mortality in prostate cancer patients: integrating evidence from real-world studies. Prostate Cancer Prostatic Dis. 2025, 28(1), 210–9. [Google Scholar] [CrossRef] [PubMed]
- Sharma, N.; Khatib, M.N.; Balaraman, A.K.; Roopashree, R.; Kaur, M.; Srivastava, M.; et al. Effect of GLP-1 receptor agonists on prostate cancer risk reduction: a systematic review and meta-analysis. Int. Urol. Nephrol. 2025, 57(4), 1039–49. [Google Scholar] [CrossRef] [PubMed]
- Zhao, M.; Chen, J.; Yuan, Y.; Zou, Z.; Lai, X.; Rahmani, D.M.; et al. Dipeptidyl peptidase-4 inhibitors and cancer risk in patients with type 2 diabetes: a meta-analysis of randomized clinical trials. Sci Rep. 2017, 7, 8273. [Google Scholar] [CrossRef] [PubMed] [PubMed Central]
- Zheng, J.; Lu, J.; Qi, J.; Yang, Q.; Zhao, H.; Liu, H.; et al. The effect of SGLT2 inhibition on prostate cancer: Mendelian randomization and observational analysis using electronic healthcare and cohort data. Cell Rep Med. 2024, 5(8), 101688. [Google Scholar] [CrossRef] [PubMed] [PubMed Central]
- Corona, G.; Monami, M.; Rastrelli, G.; Aversa, A.; Sforza, A.; Lenzi, A.; et al. Type 2 diabetes mellitus and testosterone: a meta-analysis study. Int. J. Androl. 2011, 34(6pt1), 528–40. [Google Scholar] [CrossRef] [PubMed]
- Ahmed, F.; Hetty, S.; Laterveer, R.; Surucu, E.B.; Mathioudaki, A.; Hornbrinck, E.; et al. Altered Expression of Aromatase and Estrogen Receptors in Adipose Tissue From Men With Obesity or Type 2 Diabetes. J Clin Endocrinol Metab 2025, 110(10), e3410–24. [Google Scholar] [CrossRef] [PubMed] [PubMed Central]
- Tun, N.N.Z.; Livingstone, D.E.W.; Gibb, F.W. Low Testosterone in Men With Type 2 Diabetes: The Role of Estrogen Excess and Aromatase Activity. Clin Endocrinol (Oxf) 2026, 104(4), 362–71. [Google Scholar] [CrossRef] [PubMed] [PubMed Central]
- Villa, A.; Rizzi, N.; Vegeto, E.; Ciana, P.; Maggi, A. Estrogen accelerates the resolution of inflammation in macrophagic cells. Sci Rep. 2015, 5, 15224. [Google Scholar] [CrossRef] [PubMed] [PubMed Central]
- Enright, S.; Werstuck, G.H. Investigating the Effects of Sex Hormones on Macrophage Polarization. Int J Mol Sci. 2024, 25(2), 951. [Google Scholar] [CrossRef] [PubMed] [PubMed Central]
- Fang, L.Y.; Izumi, K.; Lai, K.P.; Liang, L.; Li, L.; Miyamoto, H. Infiltrating macrophages promote prostate tumorigenesis via modulating androgen receptor-mediated CCL4-STAT3 signaling 10.1158/0008-5472.CAN-12–3228. Cancer Res. 2013, 73(18). [Google Scholar] [CrossRef] [PubMed] [PubMed Central]
- Becerra-Diaz, M.; Song, M.; Heller, N. Androgen and Androgen Receptors as Regulators of Monocyte and Macrophage Biology in the Healthy and Diseased Lung. Front Immunol 2020, 11, 1698. [Google Scholar] [CrossRef] [PubMed] [PubMed Central]
- Rezende, L.P.; Galheigo, M.R.U.; Landim, B.C.; Cruz, A.R.; Botelho, F.V.; Zanon, R.G.; et al. Effect of glucose and palmitate environment on proliferation and migration of PC3-prostate cancer cells. Cell Biol. Int. 2019, 43(4), 373–83. [Google Scholar] [CrossRef] [PubMed]
- Ahmad, F.; Cherukuri, M.K.; Choyke, P.L. Metabolic reprogramming in prostate cancer. Br. J. Cancer 2021, 125(9), 1185–96. [Google Scholar] [CrossRef] [PubMed]
- Pujana-Vaquerizo, M.; Bozal-Basterra, L.; Carracedo, A. Metabolic adaptations in prostate cancer. Br. J. Cancer 2024, 131(8), 1250–62. [Google Scholar] [CrossRef] [PubMed]
- Mossa, F.; Robesti, D.; Sumankalai, R.; Corey, E.; Titus, M.; Kang, Y.; et al. Subtype and site specific-induced metabolic vulnerabilities in prostate cancer. Mol Cancer Res MCR 2023, 21(1), 51–61. [Google Scholar] [CrossRef] [PubMed] [PubMed Central]
- Rungratanawanich, W.; Qu, Y.; Wang, X.; Essa, M.M.; Song, B.J. Advanced glycation end products (AGEs) and other adducts in aging-related diseases and alcohol-mediated tissue injury. Exp Mol Med. 2021, 53(2), 168–88. [Google Scholar] [CrossRef] [PubMed] [PubMed Central]
- Kim, J.; Kim, N.H.; Sohn, E.; Kim, C.S.; Kim, J.S. Methylglyoxal induces cellular damage by increasing argpyrimidine accumulation and oxidative DNA damage in human lens epithelial cells. Biochem Biophys. Res. Commun. 2010, 391(1), 346–51. [Google Scholar] [CrossRef] [PubMed]
- Antognelli, C.; Mezzasoma, L.; Fettucciari, K.; Talesa, V.N. A novel mechanism of methylglyoxal cytotoxicity in prostate cancer cells. Int. J. Biochem Cell Biol. 2013, 45(4), 836–44. [Google Scholar] [CrossRef] [PubMed]
- Soudamani, S.; Yuvaraj, S.; Malini, T.; Balasubramanian, K. Experimental diabetes has adverse effects on the differentiation of ventral prostate during sexual maturation of rats. Anat. Rec. A Discov. Mol. Cell Evol. Biol. 2005, 287A(2), 1281–9. [Google Scholar] [CrossRef] [PubMed]
- Yu, Y.; Liu, P.F.; Zhan, M.W.; Chen, Y.Q.; Lai, Y.Q.; Wang, L.; et al. Lysyl oxidase promotes seminal vesicle atrophy and fibrosis in type-2 diabetes mellitus through TGF-β1 signaling. J Transl Med. 2025, 23, 854. [Google Scholar] [CrossRef] [PubMed] [PubMed Central]
- Akkus, G.; Izol, V.; Ok, F.; Evran, M.; Inceman, M.; Erdogan, S.; et al. Possible role of the receptor of advanced glycation end products (RAGE) in the clinical course of prostate neoplasia in patients with and without type 2 diabetes mellitus. Int. J. Clin. Pract. 2021, 75(3), e13723. [Google Scholar] [CrossRef] [PubMed]
- Elangovan, I.; Thirugnanam, S.; Chen, A.; Zheng, G.; Bosland, M.C.; Kajdacsy-Balla, A.; et al. Targeting receptor for advanced glycation end products (RAGE) expression induces apoptosis and inhibits prostate tumor growth. Biochem Biophys. Res. Commun. 2012, 417(4), 1133–8. [Google Scholar] [CrossRef] [PubMed]
- Rodriguez-Teja, M.; Gronau, J.H.; Breit, C.; Zhang, Y.Z.; Minamidate, A.; Caley, M.P.; et al. AGE-modified basement membrane cooperates with Endo180 to promote epithelial cell invasiveness and decrease prostate cancer survival. J. Pathol. 2015, 235(4), 581–92. [Google Scholar] [CrossRef] [PubMed]
- Taciak, B.; Białasek, M.; Braniewska, A.; Sas, Z.; Sawicka, P.; Kiraga, Ł.; et al. Evaluation of phenotypic and functional stability of RAW 264.7 cell line through serial passages. PLoS ONE 2018, 13(6), e0198943. [Google Scholar] [CrossRef] [PubMed]
- Larsson, P.; Engqvist, H.; Biermann, J.; Werner Rönnerman, E.; Forssell-Aronsson, E.; Kovács, A.; et al. Optimization of cell viability assays to improve replicability and reproducibility of cancer drug sensitivity screens. Sci Rep. 2020, 10, 5798. [Google Scholar] [CrossRef] [PubMed] [PubMed Central]
- Ghasemi, M.; Turnbull, T.; Sebastian, S.; Kempson, I. The MTT Assay: Utility, Limitations, Pitfalls, and Interpretation in Bulk and Single-Cell Analysis. Int J Mol Sci. 2021, 22(23), 12827. [Google Scholar] [CrossRef] [PubMed] [PubMed Central]
Figure 1.
Heatmap of viability responses across prostate cell models after exposure to plasma from patients with T2DM. PC3, LNCaP, and HPEpiC cells were exposed for 24 h to plasma from 16 individual patients with T2DM and to an equal-volume pooled plasma sample generated from the same cohort. Viability is expressed as a percentage of the untreated control, defined as 100%. Lower values are shown in red and higher values in blue. Data were obtained from three independent measurements and are shown as normalized viability values.
Figure 1.
Heatmap of viability responses across prostate cell models after exposure to plasma from patients with T2DM. PC3, LNCaP, and HPEpiC cells were exposed for 24 h to plasma from 16 individual patients with T2DM and to an equal-volume pooled plasma sample generated from the same cohort. Viability is expressed as a percentage of the untreated control, defined as 100%. Lower values are shown in red and higher values in blue. Data were obtained from three independent measurements and are shown as normalized viability values.
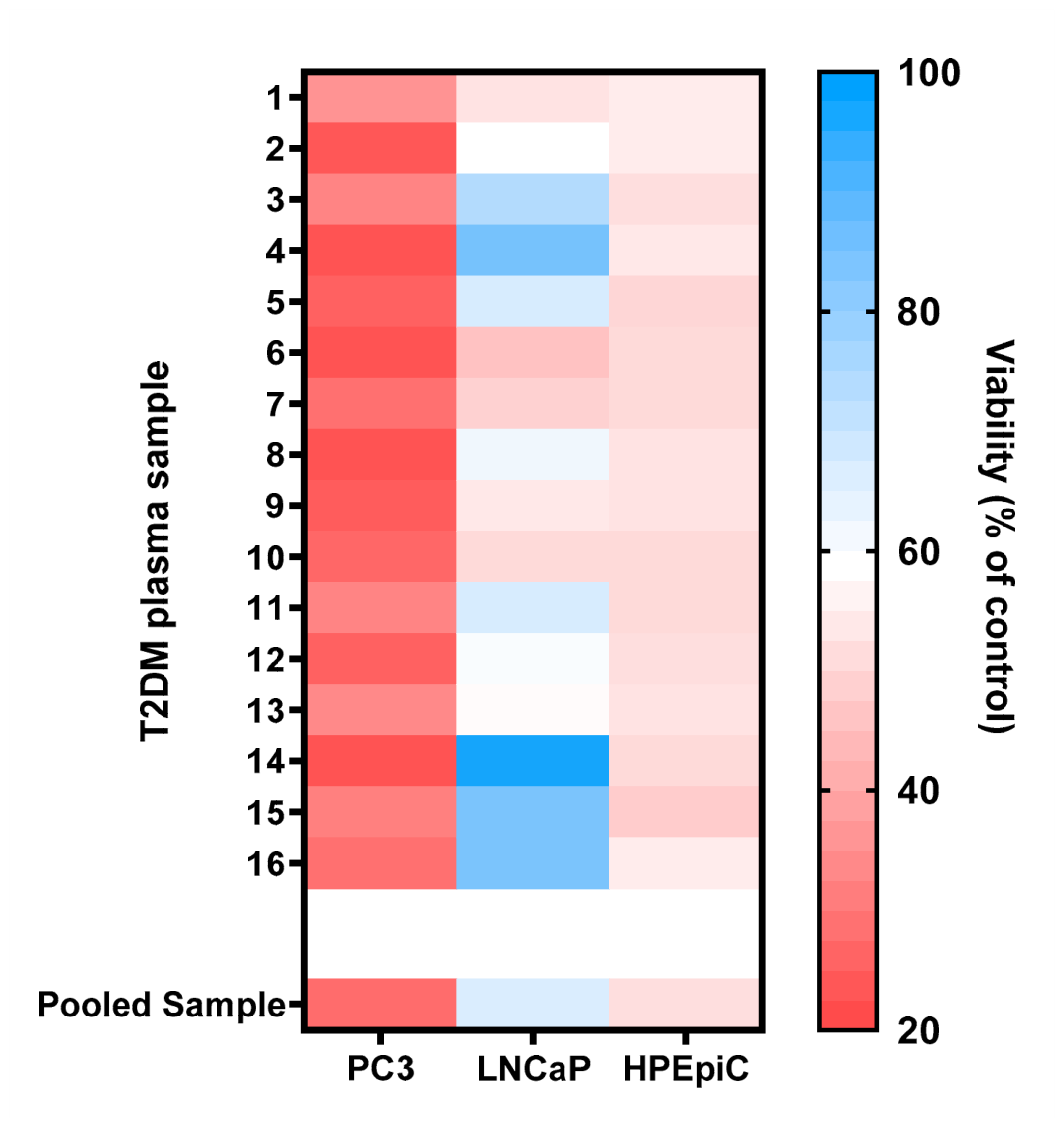
Figure 2.
Sex-steroid co-stimulation modulates LPS-associated polarization readouts in Raw264.7 macrophages. Representative micrographs show control macrophages (A), LPS-stimulated macrophages (B), and macrophages exposed to LPS together with testosterone at 10-9 M (C) or estradiol at 10-6 M (D). Images were acquired at 20× magnification using an inverted microscope (Invitrogen™ EVOS™ XL Core Imaging System), with a scale bar = 50 µm. Polarization-associated cell counts across all tested conditions are shown in panel E. Relative expression of IL-1β (F.i), IL-6 (F.ii), IL-10 (F.iii), and TLR4 (F.iv) was assessed by RT-qPCR. Data are presented as mean ± SD. Statistical significance was determined relative to the control condition: * p < 0.05, ** p < 0.01, *** p < 0.001, **** p < 0.0001. Complete representative micrographs for all tested conditions are provided in Supplementary Figure S2.
Figure 2.
Sex-steroid co-stimulation modulates LPS-associated polarization readouts in Raw264.7 macrophages. Representative micrographs show control macrophages (A), LPS-stimulated macrophages (B), and macrophages exposed to LPS together with testosterone at 10-9 M (C) or estradiol at 10-6 M (D). Images were acquired at 20× magnification using an inverted microscope (Invitrogen™ EVOS™ XL Core Imaging System), with a scale bar = 50 µm. Polarization-associated cell counts across all tested conditions are shown in panel E. Relative expression of IL-1β (F.i), IL-6 (F.ii), IL-10 (F.iii), and TLR4 (F.iv) was assessed by RT-qPCR. Data are presented as mean ± SD. Statistical significance was determined relative to the control condition: * p < 0.05, ** p < 0.01, *** p < 0.001, **** p < 0.0001. Complete representative micrographs for all tested conditions are provided in Supplementary Figure S2.
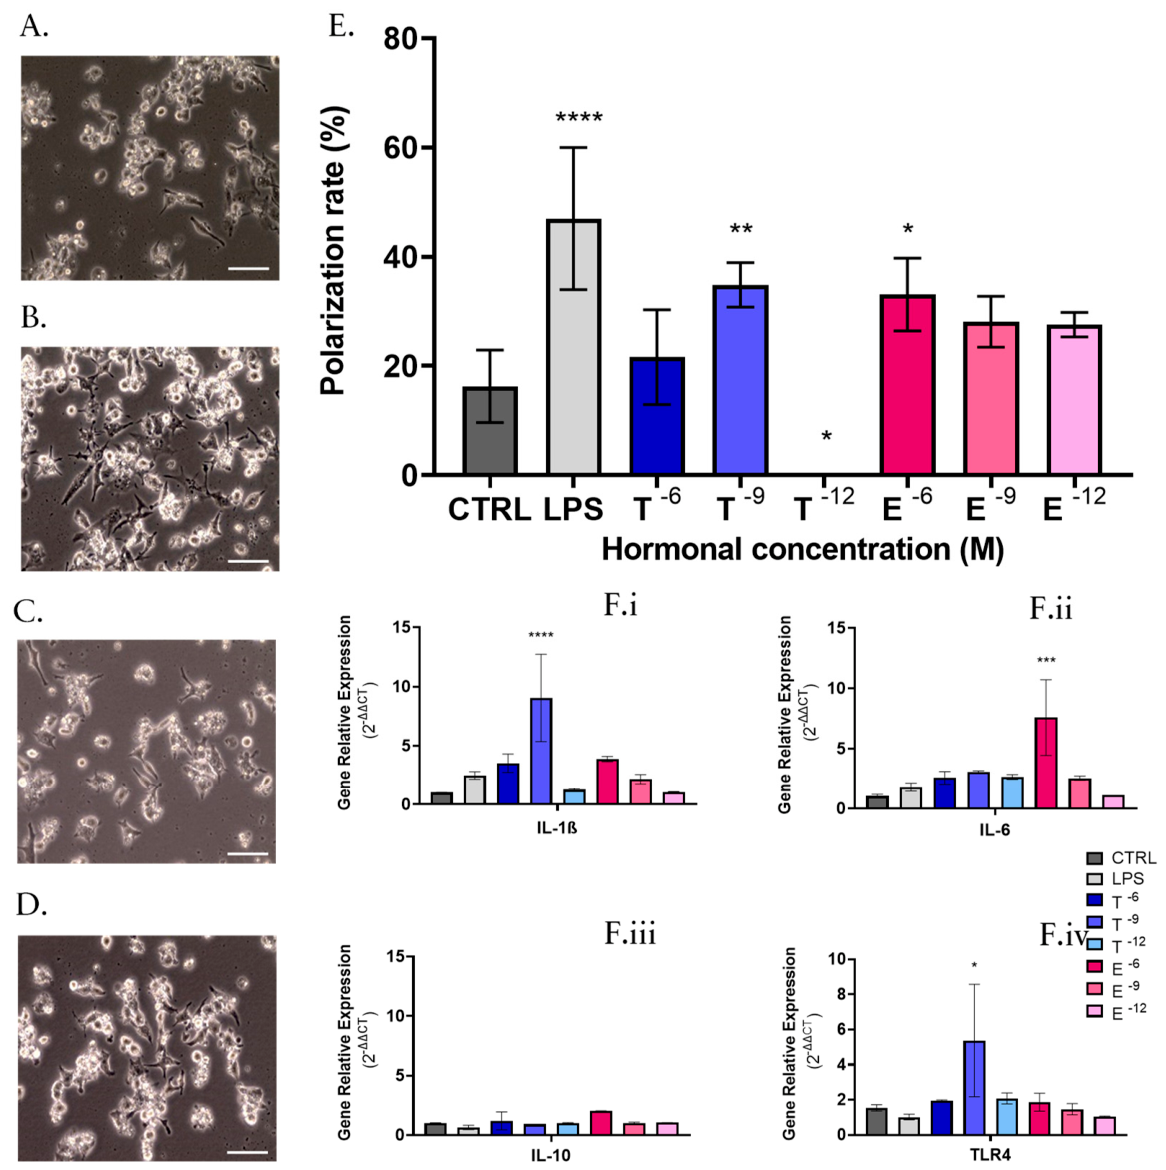
Figure 3.
Direct hormone exposure differentially affects viability across prostate cell models. PC3, LNCaP, and HPEpiC cells were exposed to testosterone or estradiol for 24 h at the indicated concentrations. Viability is expressed as a percentage of the untreated control. Data are presented as mean ± SD. Statistical significance was determined relative to the corresponding control condition: * p < 0.05, ** p < 0.01, *** p < 0.001, **** p < 0.0001.
Figure 3.
Direct hormone exposure differentially affects viability across prostate cell models. PC3, LNCaP, and HPEpiC cells were exposed to testosterone or estradiol for 24 h at the indicated concentrations. Viability is expressed as a percentage of the untreated control. Data are presented as mean ± SD. Statistical significance was determined relative to the corresponding control condition: * p < 0.05, ** p < 0.01, *** p < 0.001, **** p < 0.0001.
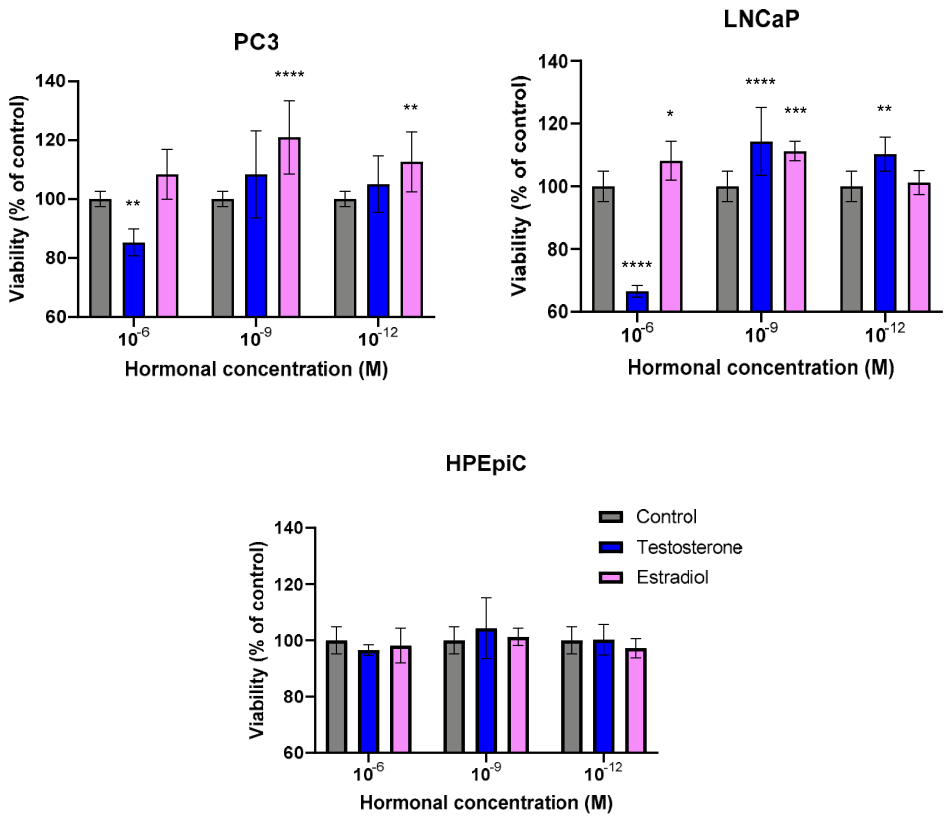
Figure 4.
Glucose and methylglyoxal produce partial viability effects across prostate cell models. The upper row shows viability responses to increasing glucose concentrations in PC3, LNCaP, and HPEpiC cells, whereas the lower row shows viability responses to increasing methylglyoxal concentrations in the same cell models. Cells were exposed for 24 h under the indicated conditions. Viability is expressed as a percentage of the untreated control. Data are presented as mean ± SD. Statistical significance was determined relative to the corresponding control condition: * p < 0.05, ** p < 0.01, *** p < 0.001, **** p < 0.0001.
Figure 4.
Glucose and methylglyoxal produce partial viability effects across prostate cell models. The upper row shows viability responses to increasing glucose concentrations in PC3, LNCaP, and HPEpiC cells, whereas the lower row shows viability responses to increasing methylglyoxal concentrations in the same cell models. Cells were exposed for 24 h under the indicated conditions. Viability is expressed as a percentage of the untreated control. Data are presented as mean ± SD. Statistical significance was determined relative to the corresponding control condition: * p < 0.05, ** p < 0.01, *** p < 0.001, **** p < 0.0001.
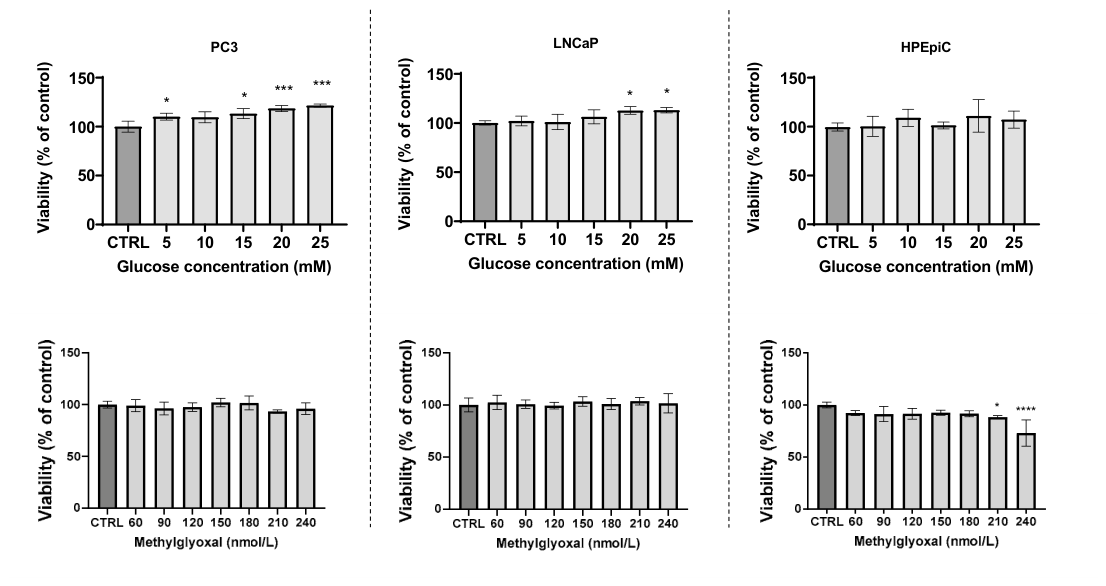
Table 1.
Clinical and therapeutic summary of the T2DM cohort. Clinical and biochemical parameters are presented as mean ± SD for the 16 patients included in the cohort. Antidiabetic therapy is shown as the number and percentage of patients receiving each pharmacological class. Complete individual clinical data and patient-level therapeutic information are provided in Supplementary Tables S1 and S2.
Table 1.
Clinical and therapeutic summary of the T2DM cohort. Clinical and biochemical parameters are presented as mean ± SD for the 16 patients included in the cohort. Antidiabetic therapy is shown as the number and percentage of patients receiving each pharmacological class. Complete individual clinical data and patient-level therapeutic information are provided in Supplementary Tables S1 and S2.
| Clinical and Biochemical Characteristics | |
| Variables | Value |
| Number of patients (n) | 16 |
| Age (years) | 64.19 ± 5.82 |
| Time since T2DM diagnosis (years) | 10.06 ± 8.16 |
| BMI (kg/m2) | 30.23 ± 5.26 |
| Fasting glucose (mg/dL) | 151.75 ± 31.06 |
| HbA1c (%) | 7.42 ± 1.01 |
| LDH (U/L) | 176.63 ± 29.29 |
| Total cholesterol (mg/dL) | 157.44 ± 30.89 |
| Triglycerides (mg/dL) | 143.50 ± 66.90 |
| HDL cholesterol (mg/dL) | 44.75 ± 9.86 |
| LDL cholesterol (mg/dL) | 87.88 ± 27.42 |
| Antidiabetic Therapy Represented in the Cohort | |
| Drug Class | Patients, n (%) |
| Biguanides | 14 (87.50) |
| SGLT2 inhibitors | 8 (50.00) |
| GLP-1 receptor agonists | 3 (18.75) |
| DPP-4 inhibitors | 9 (56.25) |
| Sulfonylureas | 3 (18.75) |
| Insulin | 4 (25.00) |
Table 2.
Effects of representative antidiabetic drugs on viability across prostate cell models. Representative antidiabetic drugs from the major pharmacologic classes present in the T2DM cohort were tested in PC3, LNCaP, and HPEpiC cells. IC₅₀ values are shown when reached; “no IC₅₀” indicates that no 50% reduction in viability was observed within the tested concentration range. Dose-response curves for conditions in which an IC₅₀ could be determined are shown in Supplementary Figure S1.
Table 2.
Effects of representative antidiabetic drugs on viability across prostate cell models. Representative antidiabetic drugs from the major pharmacologic classes present in the T2DM cohort were tested in PC3, LNCaP, and HPEpiC cells. IC₅₀ values are shown when reached; “no IC₅₀” indicates that no 50% reduction in viability was observed within the tested concentration range. Dose-response curves for conditions in which an IC₅₀ could be determined are shown in Supplementary Figure S1.
| Pharmacological class | Drug | PC3 | LNCaP | HPEpiC |
|---|---|---|---|---|
| Biguanide | Metformin | no IC₅₀ | no IC₅₀ | no IC₅₀ |
| SGLT-2 inhibitor | Dapagliflozin | no IC₅₀ | no IC₅₀ | no IC₅₀ |
| GLP-1 receptor agonist | Liraglutide | 4.4 ± 0.1 µM | 6.7 ± 0.2 µM | no IC₅₀ |
| DPP-4 inhibitor | Vildagliptin | 7.7 ± 0.2 µM | no IC₅₀ | no IC₅₀ |
| Sulfonylurea | Gliclazide | 48.6 ± 0.1 mM | 23.3 ± 8.5 mM | no IC₅₀ |
| Insulins | Human recombinant | no IC₅₀ | no IC₅₀ | no IC₅₀ |
| Rapid-acting | no IC₅₀ | no IC₅₀ | no IC₅₀ | |
| Slow-acting | no IC₅₀ | no IC₅₀ | no IC₅₀ |
Disclaimer/Publisher’s Note: The statements, opinions and data contained in all publications are solely those of the individual author(s) and contributor(s) and not of MDPI and/or the editor(s). MDPI and/or the editor(s) disclaim responsibility for any injury to people or property resulting from any ideas, methods, instructions or products referred to in the content. |
© 2026 by the authors. Licensee MDPI, Basel, Switzerland. This article is an open access article distributed under the terms and conditions of the Creative Commons Attribution (CC BY) license.
Copyright: This open access article is published under a Creative Commons CC BY 4.0 license, which permit the free download, distribution, and reuse, provided that the author and preprint are cited in any reuse.