

Submitted:
12 October 2026
Posted:
13 October 2026
You are already at the latest version
Abstract
Background and Objectives: Preeclampsia (PE) and gestational arterial hypertension (GAH) are major hypertensive disorders of pregnancy with overlapping clinical manifestations, which may complicate their differential diagnosis. Circulating microRNAs (miRNAs) are emerging as potential minimally invasive biomarkers reflecting placental dysfunction, hypoxia, impaired trophoblast invasion, angiogenic imbalance, and endothelial dysfunction. This study aimed to evaluate the expression profile of circulating miRNAs in women with PE and GAH and to identify candidate molecular markers capable of differentiating these conditions. Materials and Methods: A case-control study included 101 pregnant women: 39 women with physiologic pregnancy (control group), 23 women with GAH, and 39 women with PE. Plasma levels of 15 candidate miRNAs were quantified using TaqMan-based quantitative reverse-transcription PCR. Results: Twelve of the 15 investigated miRNAs demonstrated significant differences between PE and the control group and between PE and GAH after multiple-testing correction. The most pronounced decrease in PE was observed for miR-210-3p, with a log2 fold-change of −2.06 versus controls and −2.12 versus GAH. In ROC analysis, miR-210-3p showed the highest discriminatory performance for both comparisons, with an area under the curve (AUC) of 0.830 (95% CI, 0.735–0.925) for PE versus controls and 0.823 (95% CI, 0.720–0.925) for PE versus GAH. Other miRNAs, including miR-144-3p, miR-363-3p, miR-29a-3p, and miR-16-5p, also demonstrated moderate-to-good discriminatory performance. Conclusions: PE is characterized by a distinct circulating miRNA profile that differs from both physiologic pregnancy and GAH, whereas the molecular profile of GAH was broadly comparable to that of controls. Among the investigated candidates, miR-210-3p demonstrated the most consistent discriminatory performance and may represent a promising biomarker candidate for differentiating PE from GAH. A combination of several miRNAs may provide greater diagnostic value than individual markers.
Keywords:
preeclampsia
; gestational hypertension
; microRNA
; circulating miRNA
; biomarkers
; placental dysfunction
; miR-210-3p
; precision medicine
; maternal health
1. Introduction
According to the American College of Obstetricians and Gynecologists, preeclampsia complicates 2–8% of pregnancies worldwide and is an important cause of maternal and perinatal mortality. In Latin American countries, hypertensive disorders account for almost 26% of maternal deaths, while in Africa and Asia they account for up to 9% of deaths [1]. Preeclampsia is a severe obstetric condition that develops after 20 weeks of gestation and is characterized by new-onset hypertension (≥140/90 mmHg) accompanied by proteinuria (≥300 mg/24 h) or other signs of maternal organ dysfunction. Preeclampsia is currently classified into two phenotypes: early-onset preeclampsia (before 34 weeks of gestation), in which inadequate trophoblast invasion followed by placental hypoperfusion triggers antiangiogenic imbalance and endothelial dysfunction and is more often associated with fetal growth restriction and placental insufficiency, and late-onset preeclampsia (after 34 weeks), in which maternal cardiovascular and metabolic factors are more prominent and which is more frequently accompanied by eclampsia and HELLP syndrome [2,3].
Current strategies for the prevention of preeclampsia focus on risk reduction and symptom control and include antihypertensive therapy, low-dose aspirin prophylaxis, and magnesium sulfate for seizure prevention. However, once preeclampsia has clinically manifested, delivery is the only definitive treatment. This highlights the need to validate reliable early predictive and diagnostic biomarkers to enable timely clinical intervention and improve outcomes for both mothers and newborns.
Since the discovery of circulating RNAs released by various tissues, including the placenta, numerous studies have investigated their potential for real-time, minimally invasive monitoring of pathological processes [5]. This approach makes it possible to assess associations between physiological changes in circulating RNA levels and disease states. Circulating RNAs include molecules that are not translated into proteins (non-coding RNAs, ncRNAs) [6], which are generally classified into four groups: PIWI-interacting RNAs (piRNAs), circular RNAs (circRNAs), long non-coding RNAs (lncRNAs), and small RNAs (miRNAs) [5]. Recent studies have suggested that approximately 75% of the human genome is transcribed into RNA, whereas only about 3% of transcripts are translated into proteins [7].
In recent years, microRNAs have emerged as a promising area of research. These are small non-coding RNAs, approximately 20–24 nucleotides in length, that regulate gene expression at the post-transcriptional level. MicroRNAs participate in the regulation of trophoblast proliferation, migration and invasion, angiogenesis, immune responses, cellular adaptation to hypoxia, and vascular endothelial function. They bind to specific regions within the 3′ untranslated regions (3′-UTRs) of target transcripts and inhibit target-gene expression, leading to transcript degradation or translational repression [8,9,10]. MicroRNAs are relatively stable in biological samples and may retain their stability for more than 10 years when frozen, making them potential minimally invasive biomarkers of placental dysfunction. However, findings from studies of circulating RNAs remain heterogeneous because of differences in sampling time, study populations, RNA isolation methods, and normalization procedures [5].
Placenta-specific microRNAs of the chromosome 19 microRNA cluster (C19MC) are of particular interest [13]. The present panel included miR-516b-5p, miR-517a-5p, miR-520a-5p, and miR-525-5p. Hromadnikova et al. reported that increased circulating levels of these microRNAs are characteristic of clinically manifest preeclampsia [11]. In first-trimester samples, the strongest association with subsequent development of preeclampsia was observed for miR-517a-5p, whereas miR-516b-5p, miR-520a-5p, and miR-525-5p showed a tendency toward increased levels and were more indicative of the risk of preeclampsia at later gestational ages. However, in a subsequent study, the authors reported that the sensitivity of miR-517a-5p as a single biomarker was only 42.9%, with a specificity of 86.2%, highlighting the limitations of a single-microRNA approach and supporting the investigation of multimarker panels [12].
Another important molecule is miR-210-3p, a well-known hypoxia-inducible microRNA. Increased expression of miR-210 has repeatedly been detected in placental tissue and maternal circulation in preeclampsia [14,15,16]. miR-210 may contribute to impaired trophoblast invasion and placental angiogenesis, in particular through regulation of hypoxia-dependent signaling pathways and suppression of the THSD7A gene [17]. These findings suggest that miR-210-3p may be considered not only a potential circulating biomarker but also a functional participant in the development of placental dysfunction.
The other microRNAs investigated in this study also represent several interconnected pathways involved in the pathogenesis of preeclampsia. miR-149-5p has been associated with regulation of endoglin (ENG) and trophoblast invasion; reduced miR-149-5p expression has been accompanied by increased ENG expression and impaired invasive capacity of trophoblast cells [18]. miR-517-5p has been linked to regulation of the ERK/MMP-2 pathway and trophoblast invasion, whereas miR-525-5p participates in the control of trophoblast invasive activity [19,20]. miR-18a-5p may impair trophoblast invasion through regulation of SMAD [21]. Reduced miR-144-3p has been associated with altered Cox-2 expression [22], while decreased miR-376c-3p has been linked to disruption of TGF-β/Nodal-dependent regulation of trophoblast proliferation and invasion [23]. Reduced plasma levels of miR-188-3p have been reported in women with preeclampsia [24], whereas evidence regarding miR-29a-3p, miR-200c-3p, miR-411-3p, and miR-506-5p remains limited or heterogeneous, supporting the need for further investigation [24].
Thus, analysis of a combined panel of circulating microRNAs may be more informative than assessment of individual molecules. However, the reproducibility of these changes across populations, the dependence of expression on gestational age and clinical phenotype, and the influence of the normalization method used for quantitative PCR remain insufficiently studied. These issues support the relevance of a comprehensive investigation of candidate microRNA expression in women with preeclampsia and physiologically progressing pregnancy.
The aim of the study was to assess the expression profile of a panel of circulating microRNAs associated with placental hypoxia, trophoblast invasion, angiogenesis, and endothelial dysfunction in women with preeclampsia compared with physiologically progressing pregnancy, and to identify the most promising molecular markers of the complication.
2. Materials and Methods
2.1. Study Design.
This case–control study included 101 pregnant women: 39 healthy controls, 23 women with gestational arterial hypertension (GAH), and 39 women with preeclampsia (PE).
2.2. Ethical Approval.
The study was conducted in accordance with the Declaration of Helsinki and the Code of the Republic of Kazakhstan “On Public Health and Healthcare System.” The protocol was approved by the Local Ethics Committee of the “Academy of Preventive Medicine” Public Association, Almaty, Kazakhstan (protocol code №XIII-R dated May 21, 2025). All participants provided written informed consent before enrollment. The material was anonymized.
2.3. Blood Collection and Plasma Preparation
Venous blood was collected from fasting participants into vacuum tubes containing 3.2% sodium citrate. Plasma was separated within 30 min by centrifugation at 1912 × g for 15 min; the upper fraction was aliquoted in 200-µL portions and stored at −20 °C for no longer than one month before transfer to the laboratory. Before RNA extraction, thawed aliquots were centrifuged at 10,000 × g for 10 min at 4 °C to remove residual platelets, and 100 µL of the upper fraction was used.
2.4. RNA Extraction
The molecular stage was performed centrally at the Laboratory of Structural and Functional Genomics, M.A. Aitkhozhin Institute of Molecular Biology and Biochemistry (Almaty). Total RNA was extracted from 100 µL of plasma using the MagMAX mirVana Total RNA Isolation Kit (Applied Biosystems, Waltham, MA, USA) according to the manufacturer’s protocol. Immediately after addition of lysis buffer, 2 fmol of the synthetic exogenous control ath-miR-159a was added to each sample for subsequent normalization and monitoring of extraction efficiency.
2.5. Reverse Transcription and Quantitative PCR
cDNA was synthesized using the TaqMan Advanced miRNA cDNA Synthesis Kit (Cat. No. A28007; Applied Biosystems). PCR was performed in a 10-µL reaction volume in duplicate using TaqMan Advanced miRNA Assays and TaqMan Fast Advanced Master Mix on a QuantStudio 3 instrument (Applied Biosystems), according to the manufacturer’s recommendations. Extraction and amplification quality were monitored using the Ct of the spike-in control: samples in which ath-miR-159a Ct deviated from the cohort mean (10.1 ± 0.5) by more than three standard deviations were excluded from molecular analysis.
Fifteen candidate microRNAs (miR-144-3p, miR-16-5p, miR-18a-5p, miR-191-5p, miR-200c-3p, miR-20b-5p, miR-210-3p, miR-23a-3p, miR-29a-3p, miR-363-3p, miR-376c-3p, miR-411-5p, miR-516b-5p, miR-520a-5p, miR-525-5p) were selected based on published evidence of differences in their serum or plasma levels in hypertensive disorders of pregnancy. Levels of the 15 circulating miRNAs were normalized to the exogenous spike-in control ath-miR-159a.
Relative microRNA abundance was expressed as ΔCt = Ct(ath-miR-159a) − Ct(target). Between-group differences were expressed as ΔΔCt = ΔCt(comparison group) − ΔCt(reference group) and interpreted as log₂ fold change (log₂FC) using a modified comparative Ct method.
2.6. Statistical Analysis
Molecular data were analyzed using jamovi 2.6. Continuous data are presented as mean ± standard deviation. Categorical data were analyzed using Fisher’s exact test, Student’s t-test, Welch’s t-test, Pearson’s χ² test, and the Freeman–Halton exact test, as appropriate. Pairwise comparisons of miRNA levels between independent groups were performed using the Mann–Whitney U test followed by false discovery rate (FDR) correction for multiple comparisons, with p<0.05 considered significant. The median difference in ΔCt/log₂FC was presented with a 95% confidence interval. ROC analysis with 95% confidence intervals for the AUC was performed to assess the discriminatory ability of individual miRNAs.
3. Results
The main clinical, obstetric, anamnestic, gestational, and laboratory characteristics are presented in Table 1 and Table 2.
The mean age was 28.74±5.57 years in the control group, 26.17±4.06 years in the gestational arterial hypertension group, and 29.8±6.22 years in the PE group. No age difference was observed between the control and PE groups (p=0.423), whereas patients with PE were older than those with GAH (p=0.0071). The number of deliveries differed only between the control and GAH groups (p=0.014).
The PE group had a shorter gestational age (36.07±3.19 weeks) than the control group (39.28±1.32 weeks; p<0.001) and the GAH group (38.48±1.98 weeks; p=0.0020). Gestational age at delivery was also lower in the PE group (36.72±2.75 weeks) than in the control and GAH groups (p<0.001 for both comparisons). Mean fetal weight in the PE group was 2831±659.6 g, which was lower than in the control group (3614±448.1 g) and the GAH group (3634±355.4 g; p<0.001 for both comparisons).
The most pronounced between-group differences were observed for blood pressure; all pairwise comparisons for systolic and diastolic blood pressure were statistically significant (p<0.001).
Pregnancy in the PE group was accompanied by more pronounced clinical symptoms. Headache was reported by 25 patients with PE and was virtually absent in the comparison groups; differences between PE and both the control and GAH groups were statistically significant (p<0.001). Nausea and vomiting were also more frequent in PE. Edema differed substantially across all three groups, with generalized edema recorded only in the PE group. Mode of delivery also differed significantly in PE: emergency cesarean section was performed in 25 PE patients compared with 5 controls and 2 GAH patients (p<0.001 for both PE comparisons).
The laboratory profile of PE was characterized most prominently by proteinuria, reduced total protein, and increased creatinine and fibrinogen. Urinary protein at admission and 24-hour proteinuria were higher in PE than in both comparison groups. Creatinine was 60.51±9.82 in PE and was higher than in the control group (50.88±6.81; p<0.001) and GAH group (51.17±11.89; p=0.0057). Fibrinogen concentration was 4.36±0.69 in PE versus 3.56±0.43 in controls and 3.44±0.70 in GAH (p<0.001 for both comparisons). AST was also higher in PE, whereas hemoglobin and platelet counts did not differ substantially between groups. Differences in INR were observed between controls and PE (p=0.0048) and between GAH and PE (p=0.0068), while aPTT differed between GAH and PE (p=0.017).
Between-group differences in circulating microRNA levels are presented in Table 3.
Levels of the 15 circulating miRNAs were normalized to the exogenous spike-in control ath-miR-159a. Pairwise comparisons between independent groups were performed using the Mann–Whitney U test followed by false discovery rate (FDR) correction for multiple comparisons.
No statistically significant differences were detected between the control and GAH groups for any of the 15 miRNAs. In contrast, after FDR correction, 12 of 15 miRNAs differed significantly between PE and controls, and the same 12 miRNAs differed significantly between PE and GAH. Thus, the overall molecular pattern was Control ≈ GAH ≠ PE.
When PE was compared with controls, p<0.001 was observed for 10 miRNAs: miR-210-3p, miR-29a-3p, miR-363-3p, miR-144-3p, miR-16-5p, miR-191-5p, miR-18a-5p, miR-20b-5p, miR-23a-3p, and miR-525-5p. After FDR correction, miR-520a-5p (p=0.0010) and miR-516b-5p (p=0.011) also remained significant. The largest absolute log₂FC was observed for miR-210-3p (log₂FC|=2.06), followed by miR-363-3p (1.80) and miR-144-3p (1.77).
When GAH and PE were compared, the largest log₂FC values were also observed for miR-210-3p (−2.12), miR-144-3p (−1.99), and miR-363-3p (−1.85). miR-200c-3p, miR-376c-3p, and miR-411-5p did not show statistically significant differences between groups (Figure 1).
ROC Analysis of Circulating miRNAs
ROC analysis was performed to assess the discriminatory ability of individual miRNAs. The main table presents EasyROC results with 95% confidence intervals for the AUC.

Table 4.
ROC analysis of circulating miRNAs for differentiating preeclampsia from healthy pregnancy and arterial hypertension.
Table 4.
ROC analysis of circulating miRNAs for differentiating preeclampsia from healthy pregnancy and arterial hypertension.
| Comparison | miRNA | p | AUC [95% CI] | Cut-off | Sensitivity, % [95% CI] | Specificity, % [95% CI] |
| Control vs PE | miR-210-3p | <0,001 | 0,830 [0,735; 0,925] | −16,35 | 66,7 [49,8; 80,9] | 94,9 [82,7; 99,4] |
| miR-29a-3p | <0,001 | 0,793 [0,693; 0,893] | −13,44 | 53,8 [37,2; 69,9] | 92,3 [79,1; 98,4] | |
| miR-363-3p | <0,001 | 0,785 [0,680; 0,890] | −12,63 | 64,1 [47,2; 78,8] | 92,3 [79,1; 98,4] | |
| miR-144-3p | <0,001 | 0,782 [0,673; 0,891] | −10,86 | 66,7 [49,8; 80,9] | 89,7 [75,8; 97,1] | |
| miR-16-5p | <0,001 | 0,771 [0,665; 0,876] | −7,95 | 56,4 [39,6; 72,2] | 87,2 [72,6; 95,7] | |
| miR-191-5p | <0,001 | 0,757 [0,644; 0,869] | −11,92 | 84,6 [69,5; 94,1] | 66,7 [49,8; 80,9] | |
| miR-18a-5p | <0,001 | 0,736 [0,623; 0,850] | −14,33 | 53,8 [37,2; 69,9] | 92,3 [79,1; 98,4] | |
| miR-20b-5p | <0,001 | 0,730 [0,617; 0,844] | −11,16 | 59,0 [42,1; 74,4] | 87,2 [72,6; 95,7] | |
| miR-525-5p | <0,001 | 0,728 [0,613; 0,843] | −18,32 | 56,4 [39,6; 72,2] | 92,3 [79,1; 98,4] | |
| miR-23a-3p | <0,001 | 0,725 [0,610; 0,840] | −11,81 | 51,3 [34,8; 67,5] | 87,2 [72,6; 95,7] | |
| miR-520a-5p | <0,001 | 0,713 [0,593; 0,833] | −17,49 | 64,1 [47,2; 78,8] | 82,1 [66,5; 92,5] | |
| miR-516b-5p | 0,0090 | 0,668 [0,544; 0,792] | −15,53 | 43,6 [27,8; 60,4] | 92,3 [79,1; 98,4] | |
| GAH vs PE | miR-210-3p | <0,001 | 0,823 [0,720; 0,925] | −16,35 | 66,7 [49,8; 80,9] | 87,0 [66,4; 97,2] |
| miR-144-3p | <0,001 | 0,816 [0,712; 0,920] | −10,86 | 66,7 [49,8; 80,9] | 91,3 [72,0; 98,9] | |
| miR-363-3p | <0,001 | 0,793 [0,681; 0,905] | −13,00 | 69,2 [52,4; 83,0] | 78,3 [56,3; 92,5] | |
| miR-29a-3p | <0,001 | 0,788 [0,666; 0,911] | −13,93 | 71,8 [55,1; 85,0] | 78,3 [56,3; 92,5] | |
| miR-16-5p | <0,001 | 0,773 [0,653; 0,892] | −8,69 | 79,5 [63,5; 90,7] | 69,6 [47,1; 86,8] | |
| miR-20b-5p | <0,001 | 0,740 [0,617; 0,864] | −10,56 | 43,6 [27,8; 60,4] | 95,7 [78,1; 99,9] | |
| miR-18a-5p | 0,0027 | 0,715 [0,574; 0,855] | −15,26 | 82,1 [66,5; 92,5] | 69,6 [47,1; 86,8] | |
| miR-520a-5p | 0,0019 | 0,712 [0,578; 0,846] | −17,54 | 66,7 [49,8; 80,9] | 82,6 [61,2; 95,0] | |
| miR-191-5p | 0,0065 | 0,709 [0,559; 0,859] | −11,92 | 84,6 [69,5; 94,1] | 69,6 [47,1; 86,8] | |
| miR-23a-3p | 0,010 | 0,704 [0,548; 0,860] | −12,99 | 84,6 [69,5; 94,1] | 69,6 [47,1; 86,8] | |
| miR-525-5p | 0,0049 | 0,688 [0,557; 0,819] | −18,15 | 43,6 [27,8; 60,4] | 91,3 [72,0; 98,9] | |
| miR-516b-5p | 0,0085 | 0,678 [0,545; 0,810] | −15,53 | 43,6 [27,8; 60,4] | 91,3 [72,0; 98,9] |
When controls and PE were compared, the highest observed AUC was obtained for miR-210-3p: AUC=0.830 (95% CI 0.735–0.925; p<0.001). At a cut-off of −16.35, sensitivity was 66.7% and specificity was 94.9%. The next highest AUC values were observed for miR-29a-3p (0.793), miR-363-3p (0.785), miR-144-3p (0.782), and miR-16-5p (0.771).
When GAH and PE were compared, the highest observed AUC values were for miR-210-3p (0.823; 95% CI 0.720–0.925) and miR-144-3p (0.816; 95% CI 0.712–0.920). For miR-363-3p, miR-29a-3p, and miR-16-5p, AUC values were 0.793, 0.788, and 0.773, respectively. For miR-210-3p at a cut-off of −16.35, sensitivity was 66.7% and specificity was 87.0%; for miR-144-3p at a cut-off of −10.86, these values were 66.7% and 91.3%, respectively.
4. Discussion
Therefore, the present study demonstrates differential changes in selected microRNAs in preeclampsia and provides a molecular basis for developing an additional tool for the differential diagnosis of preeclampsia and arterial hypertension. The most justified candidates for further investigation are miR-520a-5p, miR-210-3p, miR-29a-3p, and miR-411-5p. At the same time, the observed ROC characteristics should be considered preliminary and require confirmation in larger independent studies, consistent with the current literature emphasizing the need for standardized analytical approaches and external validation of circulating miRNAs as biomarkers of preeclampsia [3,5,6].
These findings provide a rationale for further investigation of a combined diagnostic panel rather than individual microRNAs. In theory, combining several markers may provide more robust classification of patients than a single marker; development of multimarker models is considered a promising direction in contemporary systematic reviews [3,5,6]. However, validation of such a model requires a larger sample size, independent confirmation of the observed associations, and evaluation in a separate test cohort. It is particularly important to confirm the findings while accounting for potential clinical factors that may influence the microRNA profile.
Taken together, the results suggest that changes in the microRNA profile in preeclampsia are selective and may reflect molecular processes that distinguish preeclampsia from other hypertensive disorders of pregnancy. The most important finding is the identification of four microRNAs predominantly associated with differences between hypertension and preeclampsia. miR-520a-5p appears particularly promising because statistically significant differences were identified in both comparisons—control versus preeclampsia and hypertension versus preeclampsia. Given the previously described role of C19MC miRNAs in placental processes, this finding has biological plausibility but requires independent confirmation [11,12,13].
Thus, the ROC results are broadly consistent with the comparative analysis of microRNA levels: miR-520a-5p, miR-210-3p, miR-29a-3p, and miR-411-5p are the most promising candidates for further investigation in the differential diagnosis of preeclampsia and arterial hypertension. It is important to emphasize that statistical significance of between-group differences and diagnostic significance of an ROC model are distinct characteristics. In the present study, statistically significant between-group differences were observed for these microRNAs; however, the ROC analysis did not reach statistical significance. Therefore, these findings should be interpreted as a stage of biomarker discovery and candidate selection rather than evidence that these microRNAs are ready for independent clinical application [3,5,6].
For miR-29a-3p, AUC was 0.729 (95% CI 0.35–1.00), sensitivity was 0.308, and specificity was 1.00; p=0.236. This result was characterized by maximal specificity with low sensitivity. Therefore, within this sample, miR-29a-3p may be regarded as a potentially specific but insufficiently sensitive candidate for further study rather than as an independent diagnostic test. For miR-411-5p, AUC was 0.749 (95% CI 0.34–1.00), with sensitivity of 0.769 and specificity of 0.737 at p=0.229. Overall, this marker also demonstrated potential ability to distinguish hypertension from preeclampsia; however, the lack of a statistically significant ROC model and the wide confidence interval do not allow this measure to be regarded as a definitively validated diagnostic characteristic. This caution is consistent with systematic reviews emphasizing the need for external validation of miRNA biomarkers before clinical application [3,6].
When hypertension and PE were compared, miR-520a-5p showed an AUC of 0.765 (95% CI 0.34–1.00), sensitivity of 0.769, and specificity of 0.790; p=0.222. The AUC suggests a potential ability of this marker to differentiate the two study groups, but the wide confidence interval and lack of statistical significance require cautious interpretation. For miR-210-3p, AUC was 0.745 (95% CI 0.34–1.00), sensitivity was 0.462, and specificity was 0.947; p=0.234. Thus, the marker demonstrated high specificity with relatively moderate sensitivity. This may potentially be useful for reducing false-positive classification; however, statistically confirmed diagnostic performance was not demonstrated in this sample.
Additional assessment of the diagnostic characteristics of the identified microRNAs was performed using ROC analysis. For miR-520a-5p, when distinguishing controls from PE, the area under the ROC curve was AUC=0.714 (95% CI 0.37–1.00), with an optimal cut-off of −16.37, sensitivity of 0.385, and specificity of 0.929. However, the statistical significance of the ROC model was not confirmed (p=0.220). Therefore, despite relatively high specificity at the selected threshold, these findings should be considered preliminary. This is particularly important in view of published meta-analytic data showing substantial variability in the diagnostic performance of circulating non-coding RNAs across studies [3,6].
The lack of statistical significance for most of the investigated microRNAs is itself informative. It indicates that the observed molecular profile is not simply the result of nonspecific global changes in microRNA expression during pregnancy or hypertensive disorders. Rather, changes are concentrated predominantly in a limited number of molecules, with the most pronounced differences observed specifically when preeclampsia is compared with arterial hypertension. This selectivity is consistent with the current understanding that circulating miRNAs reflect a combination of placental, vascular, immune, and metabolic processes, and that their diagnostic value may depend on a combination of molecular features [5,6].
Interestingly, several other investigated microRNAs—miR-144-3p, miR-16-5p, miR-18a-5p, miR-191-5p, miR-200c-3p, miR-20b-5p, miR-23a-3p, miR-363-3p, miR-376c-3p, miR-516b-5p, and miR-525-5p—did not demonstrate statistically significant differences in individual pairwise comparisons, despite the fact that some of them have previously been associated with the pathogenesis of preeclampsia [18,19,20,21,22,23,24]. For example, p values for miR-144-3p were 0.0741, 0.8867, and 0.2087 for the control–hypertension, control–preeclampsia, and hypertension–preeclampsia comparisons, respectively. A similar pattern was observed for miR-16-5p and miR-191-5p. Discrepancies with individual published findings do not necessarily indicate the absence of a biological role for these molecules and may reflect differences in populations, gestational age, disease severity, specimen type, and analytical approaches [5,6,24].
For miR-29a-3p, no statistically significant difference was observed between controls and PE (p=0.3166), whereas the difference between hypertension and PE was statistically significant (p=0.0302). A similar pattern was observed for miR-411-5p: no significant difference was detected between controls and PE (p=0.2485), whereas the difference between hypertension and PE reached statistical significance (p=0.0177). In view of published data on the heterogeneity of plasma miRNA profiles in preeclampsia [24], these findings should be interpreted cautiously. Within the present study, these miRNAs may be considered primarily as potential markers for differentiating preeclampsia from arterial hypertension rather than as universal markers of preeclampsia.
miR-210-3p deserves particular attention because it showed the largest effect size among the four microRNAs: log₂FC −1.204. However, the difference was statistically significant only when hypertension was compared with preeclampsia (p=0.0197), whereas the control–preeclampsia comparison did not reach statistical significance (p=0.0926). This pattern may indicate that, in the present sample, changes in miR-210-3p levels are more closely related to the transition from a hypertensive state to the preeclampsia phenotype than to the mere presence of preeclampsia compared with physiological controls. This observation is of interest given experimental evidence linking miR-210 to the hypoxic response, impaired trophoblast invasion, and regulation of THSD7A [14,17]. At the same time, differences among studies indicate that the direction of miR-210 changes may depend on clinical phenotype, gestational age, and sample characteristics [15,16].
In addition to miR-520a-5p, statistically significant differences between hypertension and preeclampsia were identified for miR-210-3p, miR-29a-3p, and miR-411-5p. For miR-210-3p, p=0.0197 and log₂FC was −1.204 (95% CI −2.221 to −0.156). For miR-29a-3p, p=0.0302 and log₂FC was −0.786 (95% CI −1.584 to −0.077). For miR-411-5p, the difference was also statistically significant: p=0.0177, log₂FC −0.754 (95% CI −1.292 to −0.183). Thus, all four microRNAs—miR-520a-5p, miR-210-3p, miR-29a-3p, and miR-411-5p—had negative log₂FC values when the hypertension group was compared with PE, indicating lower relative levels of these microRNAs in PE. The identification of miR-210-3p among the most markedly altered molecules is consistent with previously published data linking this hypoxia-inducible miRNA to preeclampsia and impaired placental function [14,15,16,17].
These findings are particularly relevant to the differential diagnosis of preeclampsia. Comparing hypertension with preeclampsia has clear clinical importance because it allows assessment of whether molecular markers can distinguish different hypertensive disorders of pregnancy. In this regard, miR-520a-5p is of interest as a potential candidate marker specifically associated with the preeclampsia phenotype. This approach is consistent with systematic reviews suggesting that combined assessment of several non-coding RNAs may be more informative than analysis of a single marker [3,6].
The most pronounced differences in the present study were observed for miR-520a-5p. Compared with controls, its level differed significantly in PE (p=0.0286), with a log₂FC of −0.750 (95% CI −1.558 to −0.078). An even greater difference was observed when women with arterial hypertension were compared with women with PE: p=0.0111, log₂FC −1.081 (95% CI −1.899 to −0.165). Thus, reduced relative miR-520a-5p levels characterized not only the difference between PE and physiologically progressing pregnancy but also the difference between PE and arterial hypertension. This finding is of particular interest given that miR-520a-5p belongs to the placenta-specific C19MC cluster, whose members have previously been studied in the context of preeclampsia and other placental complications [11,12,13]. At the same time, the direction and magnitude of changes in C19MC miRNAs may depend on population, gestational age, and biological material; therefore, our findings should be regarded as supporting the potential of this candidate rather than as definitive evidence of its specific role [5,11,12].
The analysis of the microRNA profile identified several differences in relative expression among the study groups, which included controls, pregnant women with arterial hypertension, and patients with preeclampsia. Quantification was performed after normalization to the exogenous ath-miR-159a control, ensuring comparability across study groups. Overall, most investigated microRNAs did not show statistically significant differences between groups, consistent with the concept of a selective rather than global alteration of the circulating microRNA profile in preeclampsia. Recent reviews also emphasize heterogeneity in circulating miRNA studies related to differences in gestational age, clinical phenotypes, biological material, and normalization methods [3,5,6].
5. Conclusions
Overall, the analysis identified a characteristic circulating miRNA profile in preeclampsia. Twelve of the 15 investigated miRNAs differed significantly in patients with PE from both healthy controls and patients with arterial hypertension, whereas no significant differences were identified between controls and GAH for any miRNA. This pattern suggests specificity of the identified molecular profile for PE compared with isolated arterial hypertension; however, the independence of these differences from clinical covariates requires confirmation in multivariable analysis.
The highest observed AUC in both comparative ROC analyses was obtained for miR-210-3p. miR-144-3p, miR-363-3p, miR-29a-3p, and miR-16-5p also combined pronounced between-group differences, statistical associations with clinical parameters, and AUC values of approximately 0.77–0.82. These miRNAs may be considered candidate markers for further validation; however, definitive assessment of their diagnostic value requires an independent validation cohort.
Author Contributions
Conceptualization, A.K. and D.S.; Data curation, A.K.; Formal analysis, D.S., N.K. and V.T; Funding acquisition, A.A.; Investigation, A.N., E.A., Z.K., M.K. and S.A.; Methodology, A.K., E.A.; Supervision, A.K.; Validation, A.N.; Writing – original draft, A.K. and A.N.; Writing – review & editing, A.K., A.N., D.S. and E.A. All authors have read and agreed to the published version of the manuscript.
Funding
This research was funded by the Ministry of Healthcare of the Republic of Kazakhstan on program-targeted financing No. BR27308739 "Innovative approaches to improving the reproductive health of the female population of the Republic of Kazakhstan".
Institutional Review Board Statement
The study was conducted in accordance with the Declaration of Helsinki and the Code of the Republic of Kazakhstan “On Public Health and Healthcare System.” The protocol was approved by the Local Ethics Committee of the “Academy of Preventive Medicine” Public Association, Almaty, Kazakhstan (protocol code №XIII-R dated May 21, 2025).
Informed Consent Statement
All participants provided written informed consent before enrollment. The material was anonymized.
Data Availability Statement
The data presented in this study are available on request from the corresponding author. The data are not publicly available due to privacy and ethical issues.
Conflicts of Interest
The authors declare no conflicts of interest.
References
- ACOG Practice Bulletin No. 202: gestational hypertension and preeclampsia. Obstet. Gynecol. 2019, 133(1), 1. [CrossRef]
- Staff, A.C. The two-stage placental model of preeclampsia: an update. J. Reprod. Immunol. 2019, 134, 1–10. [Google Scholar] [CrossRef]
- Liu, J.; Zhao, Q.; Zhu, Y. Non-coding RNAs as diagnostic biomarkers for preeclampsia: a systematic review and meta-analysis. BMC Pregnancy Childbirth Published. 2025, 25(1), 949. [Google Scholar] [CrossRef]
- Dhariwal, N.K.; Lynde, G.C. Update in the Management of Patients with Preeclampsia. Anesthesiol. Clin. 2017, 35(1), 95–106. [Google Scholar] [CrossRef]
- Giannubilo, S.R.; Cecati, M.; Marzioni, D.; Ciavattini, A. Circulating miRNAs and Preeclampsia: From Implantation to Epigenetics. Int. J. Mol. Sci. 2024, 25(3), 1418. [Google Scholar] [CrossRef] [PubMed] [PubMed Central]
- Su, S.; Yang, F.; Zhong, L.; Pang, L. Circulating noncoding RNAs as early predictive biomarkers in preeclampsia: a diagnostic meta-analysis. Reprod. Biol. Endocrinol. 2021, 19(1), 177. [Google Scholar] [CrossRef] [PubMed] [PubMed Central]
- Kimura, T. Yakugaku Zasshi 2020, 140(5), 687–700. [CrossRef]
- Bartel, D.P. MicroRNAs: genomics, biogenesis, mechanism, and function. Cell 2004, 116(2), 281–297. [Google Scholar] [CrossRef]
- He, L.; Hannon, G.J. MicroRNAs: small RNAs with a big role in gene regulation. Nat. Rev. Genet. 2004, 5(7), 522–531. [Google Scholar] [CrossRef]
- Ping, Z.; Feng, Y.; Lu, Y.; Ai, L.; Jiang, H. Integrated analysis of microRNA and mRNA expression profiles in Preeclampsia. BMC Med. Genom. 2023, 16(1), 309. [Google Scholar] [CrossRef] [PubMed] [PubMed Central]
- Hromadnikova, I.; Kotlabova, K.; Ondrackova, M.; Kestlerova, A.; Novotna, V.; Hympanova, L.; Doucha, J.; Krofta, L. Circulating C19MC microRNAs in preeclampsia, gestational hypertension, and fetal growth restriction. Mediat. Inflamm. 2013, 2013, 186041. [Google Scholar] [CrossRef] [PubMed] [PubMed Central]
- Hromadnikova, I.; Kotlabova, K.; Ivankova, K.; Krofta, L. First trimester screening of circulating C19MC microRNAs and the evaluation of their potential to predict the onset of preeclampsia and IUGR. PLoS ONE Published. 2017, 12(2), e0171756. [Google Scholar] [CrossRef]
- Jaszczuk, I.; Winkler, I.; Koczkodaj, D.; Skrzypczak, M.; Filip, A. The Role of Cluster C19MC in Pre-Eclampsia Development. Int. J. Mol. Sci. Published. 2022, 23(22), 13836. [Google Scholar] [CrossRef]
- Jaszczuk, I.; Koczkodaj, D.; Kondracka, A.; Kwaśniewska, A.; Winkler, I.; Filip, A. The role of miRNA-210 in pre-eclampsia development. Ann. Med. 2022, 54(1), 1350–1356. [Google Scholar] [CrossRef]
- Youssef, H.M.G.; Marei, E.S. Association of MicroRNA-210 and MicroRNA-155 with severity of preeclampsia. Pregnancy Hypertens. 2019, 17, 49–53. [Google Scholar] [CrossRef]
- Kolkova, Z.; Holubekova, V.; Grendar, M.; et al. Association of Circulating miRNA Expression with Preeclampsia, Its Onset, and Severity. Diagnostics Published. 2021, 11(3), 476. [Google Scholar] [CrossRef]
- Luo, R.; Wang, Y.; Xu, P.; et al. Hypoxia-inducible miR-210 contributes to preeclampsia via targeting thrombospondin type I domain containing 7A. Sci. Rep. 2016, 6, 19588. [Google Scholar] [CrossRef]
- Xiaobo, Z. 赵肖波; Qizhi, H.; Zhiping, W.; Tao, D. Down-regulated miR-149-5p contributes to preeclampsia via modulating endoglin expression. Pregnancy Hypertens. 2019, 15, 201–208. [Google Scholar] [CrossRef]
- Fu, J.Y.; Xiao, Y.P.; Ren, C.L.; et al. Up-regulation of miR-517-5p inhibits ERK/MMP-2 pathway: potential role in preeclampsia. Eur. Rev. Med. Pharmacol. Sci. 2018, 22(20), 6599–6608. [Google Scholar] [CrossRef]
- Zhang, M.; Li, P.; Mao, X.; Zhang, H. Regulatory mechanism of miR-525-5p in over-invasion of trophoblast. J. Obstet. Gynaecol. Res. 2021, 47(2), 679–688. [Google Scholar] [CrossRef]
- Xu, P.; Li, Z.; Wang, Y.; Yu, X.; Shao, X.; Li, Y.X.; Peng, C.; Zhao, Y.; Wang, Y.L. miR-18a Contributes to Preeclampsia by Downregulating Smad2 (Full Length) and Reducing TGF-β Signaling. Mol. Ther. Nucleic Acids 2020, 22, 542–556. [Google Scholar] [CrossRef] [PubMed] [PubMed Central]
- Hu, S.; Li, J.; Tong, M.; et al. MicroRNA-144-3p may participate in the pathogenesis of preeclampsia by targeting Cox-2. Mol. Med. Rep. 2019, 19(6), 4655–4662. [Google Scholar] [CrossRef]
- Fu, G.; Ye, G.; Nadeem, L.; et al. MicroRNA-376c impairs transforming growth factor-β and nodal signaling to promote trophoblast cell proliferation and invasion. Hypertension 2013, 61(4), 864–872. [Google Scholar] [CrossRef]
- Zhong, Y.; Zhu, F.; Ding, Y. Differential microRNA expression profile in the plasma of preeclampsia and normal pregnancies. Exp. Ther. Med. 2019, 18(1), 826–832. [Google Scholar] [CrossRef]
- Fallen, S.; Baxter, D.; Wu, X.; et al. Extracellular vesicle RNAs reflect placenta dysfunction and are a biomarker source for preterm labour. J. Cell Mol. Med. 2018, 22(5), 2760–2773. [Google Scholar] [CrossRef]
Figure 1.
Relative expression of the studied circulating miRNAs in healthy controls, GAH patients, and PE patients. Comparisons between independent groups were performed using the Mann–Whitney U test.
Figure 1.
Relative expression of the studied circulating miRNAs in healthy controls, GAH patients, and PE patients. Comparisons between independent groups were performed using the Mann–Whitney U test.
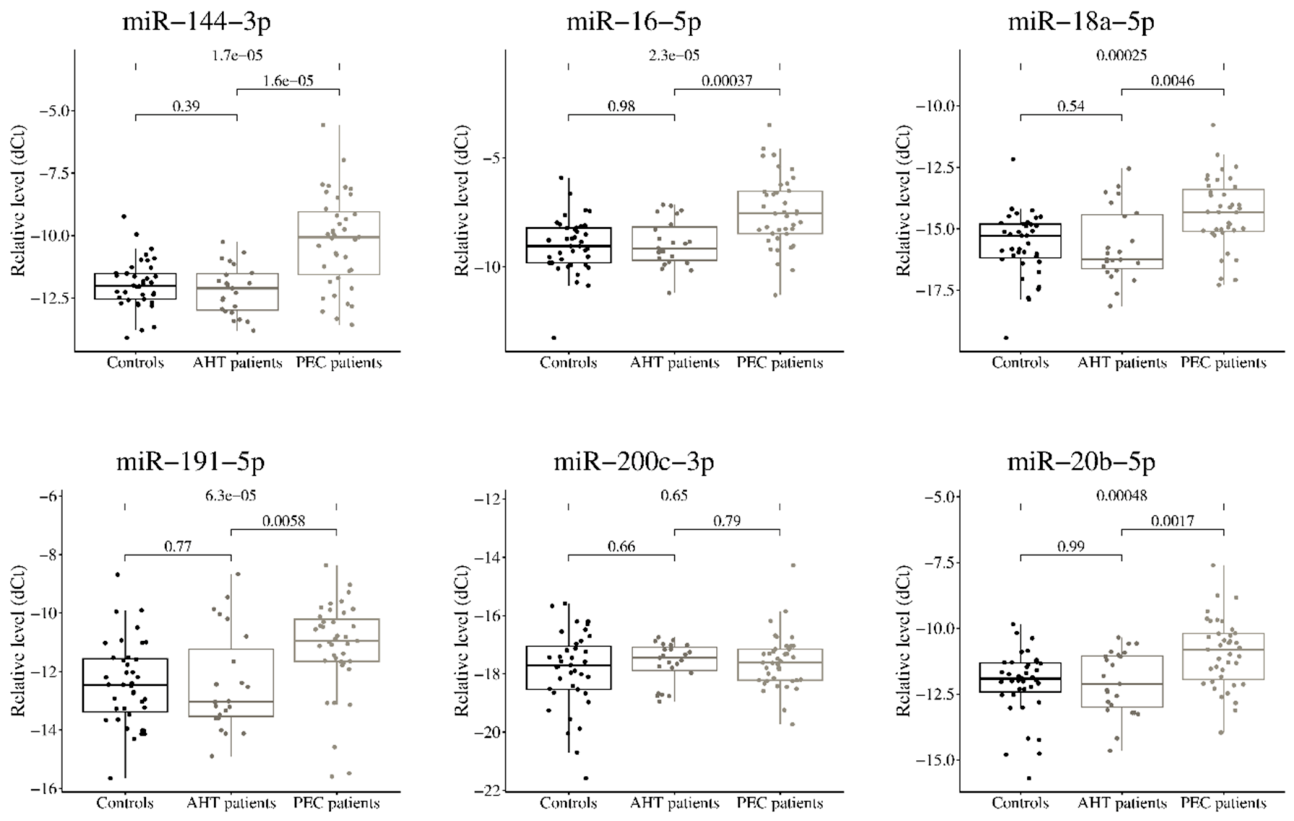
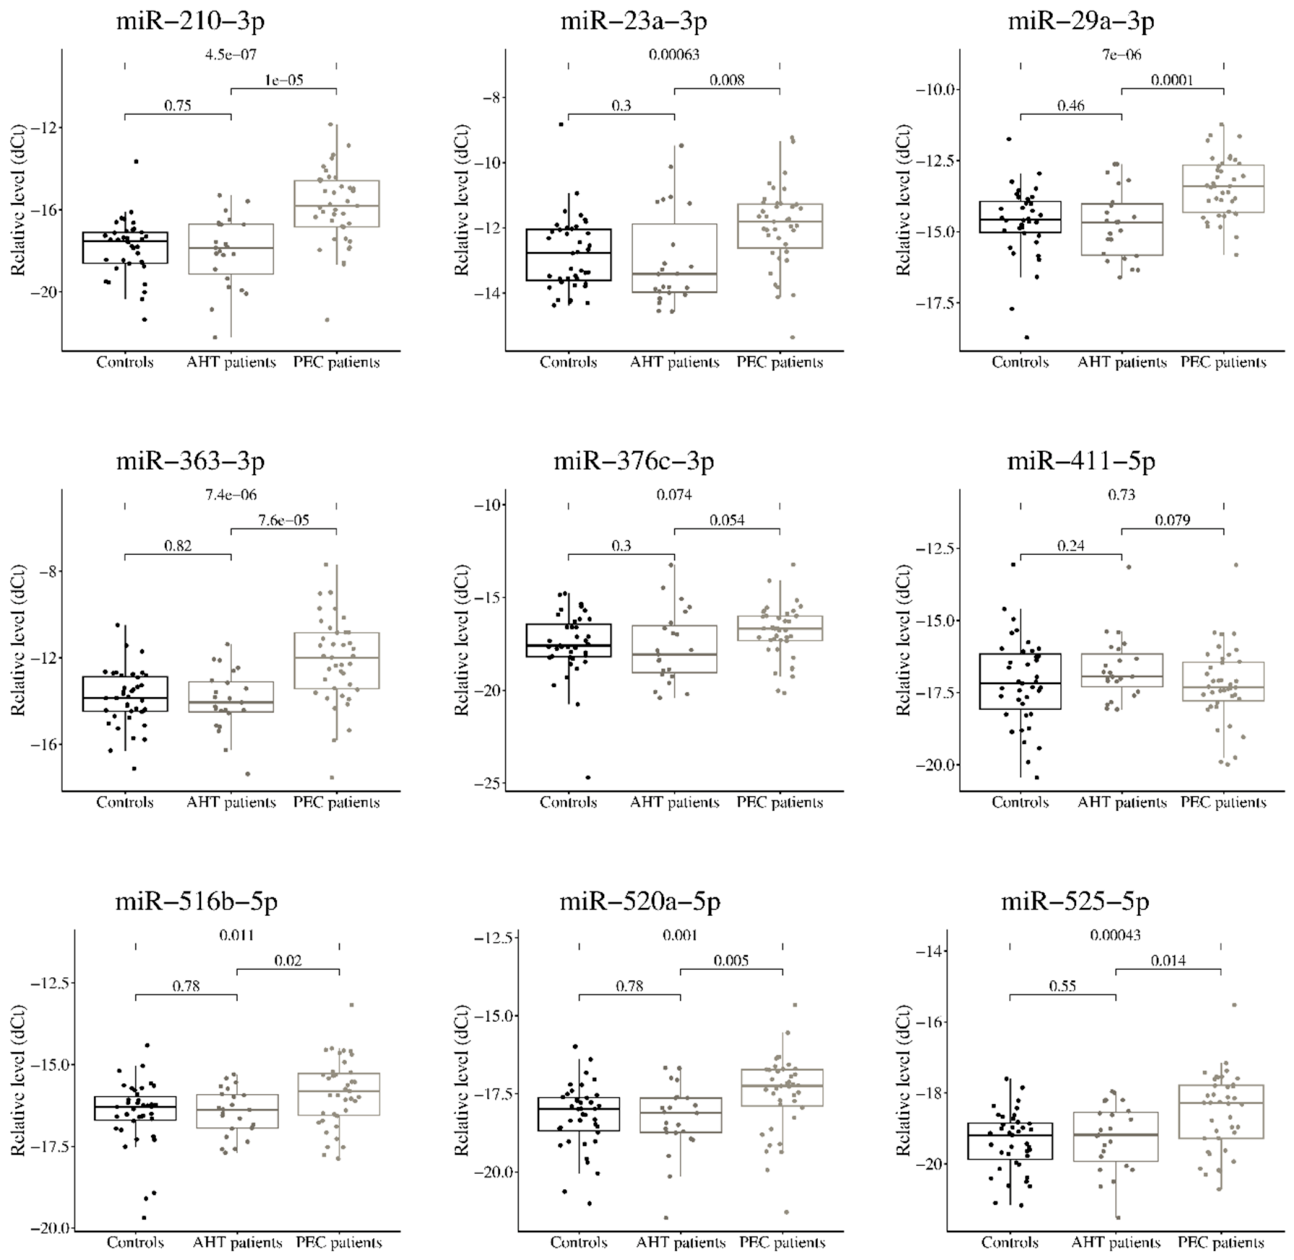
Table 1.
Clinical and obstetric-anamnestic characteristics of the study groups.
| Parameter | Control (n=39) | GAH (n=23) | PE (n=39) | Control vs GAH, p-value | Control vs PE, p-value | GAH vs PE, p-value |
| Age, years | 28,74±5,57 | 26,17±4,06 | 29,8±6,22 | 0,059 (S) | 0,423 (S) | 0,0071 (S) |
| Number of deliveries | 1,90±0,97 | 1,30±0,64 | 1,59±0,94 | 0,014 | 0,144 | 0,262 |
| Gestational age, weeks | 39,28±1,32 | 38,48±1,98 | 36,07±3,19 | 0,062 (S) | <0,001 (W) | 0,0020 (W) |
| Fetal weight, g | 3614±448,1 | 3634±355,4 | 2831±659,6 | 0,868 (S) | <0,001 (W) | <0,001 (W) |
| Systolic blood pressure, mmHg | 111,4±7,8 | 127,6±15,4 | 150,8±14,4 | <0,001 | <0,001 | <0,001 |
| Diastolic blood pressure, mmHg | 69,74±5,19 | 78,43±10,33 | 95,87±9,67 | <0,001 | <0,001 | <0,001 |
| Delivery, Natural / Emergency CS/ Planned CS |
25/3/5 | 15/1/2 | 7/6/25 | 0,597 (H) | <0,001 (H) | <0,001 (H) |
| Headache, no/yes | 39/0 | 22/1 | 14/25 | 0,371 | <0,001 (P) | <0,001 (P) |
| Nausea/vomiting, no/yes | 38/1 | 23/0 | 31/8 | 1,000 | 0,029 | 0,021 |
| Edema, none/legs/generalized | 34/5/0 | 10/13/0 | 10/10/19 | <0,001 | <0,001 (P) | <0,001 (P) |
Note. Continuous data are presented as mean ± standard deviation; categorical data are presented as the number of observations. Unless otherwise indicated, comparisons were performed using the Mann–Whitney U test; categorical variables were compared using Fisher’s exact test. S – Student’s t-test; W – Welch’s t-test; P – Pearson’s χ² test; H – Freeman–Halton exact test; CS – cesarian section.
Table 2.
Laboratory parameters of the study groups.
| Parameter | Control (n=39) | GAH (n=23) | PE (n=39) | Control vs GAH, p-value | Control vs PE, p-value | GAH vs PE, p-value |
| Urinary protein at admission | 0,065 ± 0,230 | 0,060 ± 0,117 | 1,901 ± 8,226 | 0,319 | <0,001 | <0,001 |
| Hemoglobin | 111,7 ± 11,2 | 110,0 ± 11,0 | 115,1 ± 13,8 | 0,563 (S) | 0,244 (S) | 0,137 (S) |
| Platelets | 242,3 ± 55,2 | 243,9 ± 60,8 | 241,7 ± 88,8 | 0,933 | 0,457 | 0,518 |
| White blood cells | 10,48 ± 2,12 | 9,80 ± 2,54 | 15,34 ± 31,16 | 0,259 (S) | 0,946 | 0,225 |
| Total protein | 68,96 ± 4,55 | 67,28 ± 4,38 | 60,10 ± 11,28 | 0,303 (S) | <0,001 | <0,001 |
| 24-hour protein | 0,000 ± 0,000 | 0,068 ± 0,183 | 0,256 ± 0,332 | 0,278 | 0,0046 | <0,001 |
| ALT | 10,44 ± 3,68 | 12,04 ± 3,09 | 15,91 ± 8,21 | 0,181 (S) | 0,036 | 0,094 |
| AST | 15,96 ± 2,31 | 17,98 ± 3,42 | 20,82 ± 7,07 | 0,072 (S) | <0,001 (W) | 0,046 (W) |
| Urea | 3,34 ± 0,58 | 3,53 ± 0,89 | 4,31 ± 3,45 | 0,901 | 0,106 | 0,128 |
| Creatinine | 50,88 ± 6,81 | 51,17 ± 11,89 | 60,51 ± 9,82 | 0,235 | <0,001 (W) | 0,0057 |
| Glucose | 5,32 ± 1,01 | 7,00 ± 8,88 | 5,12 ± 1,21 | 0,754 | 0,323 | 0,704 |
| Bilirubin | 8,32 ± 4,18 | 9,22 ± 3,84 | 7,51 ± 3,57 | 0,535 | 0,504 | 0,054 |
| Fibrinogen | 3,56 ± 0,43 | 3,44 ± 0,70 | 4,36 ± 0,69 | 0,442 | <0,001 (W) | <0,001 |
| aPTT | 29,10 ± 2,14 | 29,84 ± 3,10 | 28,04 ± 2,37 | 0,444 (S) | 0,145 | 0,017 (W) |
| INR | 1,66 ± 2,52 | 0,93 ± 0,28 | 0,89 ± 0,18 | 0,919 | 0,0048 | 0,0068 |
Note. ALT – alanine aminotransferase; AST – aspartate aminotransferase; aPTT - activated partial thromboplastin time; INR - international normalized ratio. S – Student’s t-test; W – Welch’s t-test;.
Table 3.
Comparison of circulating miRNA levels among healthy controls, women with arterial hypertension, and women with preeclampsia.
Table 3.
Comparison of circulating miRNA levels among healthy controls, women with arterial hypertension, and women with preeclampsia.
| miRNA | GAH vs Control, p | log₂FC [95% CI] | PE vs Control, p | log₂FC [95% CI] | GAH vs PE, p | log₂FC [95% CI] |
| miR-144-3p | 0,388 | 0,26 [−0,32; 0,79] | 1,7×10⁻⁵* | −1,77 [−2,47; −1,02] | 1,6×10⁻⁵* | −1,99 [−2,82; −1,10] |
| miR-16-5p | 0,977 | −0,01 [−0,64; 0,60] | 2,3×10⁻⁵* | −1,45 [−2,06; −0,79] | 3,7×10⁻⁴* | −1,36 [−2,15; −0,68] |
| miR-18a-5p | 0,536 | 0,28 [−0,64; 1,05] | 2,5×10⁻⁴* | −1,15 [−1,79; −0,58] | 0,0046* | −1,37 [−2,14; −0,51] |
| miR-191-5p | 0,772 | 0,11 [−0,74; 0,89] | 6,3×10⁻⁵* | −1,47 [−2,13; −0,81] | 0,0058* | −1,67 [−2,46; −0,53] |
| miR-200c-3p | 0,662 | −0,13 [−0,65; 0,38] | 0,646 | −0,11 [−0,57; 0,36] | 0,793 | 0,05 [−0,35; 0,46] |
| miR-20b-5p | 0,988 | 0,01 [−0,70; 0,73] | 4,8×10⁻⁴* | −1,05 [−1,58; −0,51] | 0,0017* | −1,05 [−1,80; −0,40] |
| miR-210-3p | 0,751 | 0,11 [−0,73; 0,86] | 4,5×10⁻⁷* | −2,06 [−2,73; −1,35] | 1,0×10⁻⁵* | −2,12 [−3,13; −1,31] |
| miR-23a-3p | 0,301 | 0,33 [−0,36; 1,00] | 6,3×10⁻⁴* | −0,90 [−1,49; −0,41] | 0,0080* | −1,36 [−2,00; −0,42] |
| miR-29a-3p | 0,457 | 0,22 [−0,48; 0,85] | 7,0×10⁻⁶* | −1,13 [−1,59; −0,63] | 1,0×10⁻⁴* | −1,36 [−1,97; −0,69] |
| miR-363-3p | 0,817 | 0,07 [−0,61; 0,79] | 7,4×10⁻⁶* | −1,80 [−2,50; −1,01] | 7,6×10⁻⁵* | −1,85 [−2,77; −0,96] |
| miR-376c-3p | 0,297 | 0,44 [−0,54; 1,30] | 0,074 | −0,61 [−1,23; 0,06] | 0,054 | −1,08 [−1,91; 0,02] |
| miR-411-5p | 0,240 | −0,36 [−1,04; 0,32] | 0,728 | 0,11 [−0,47; 0,74] | 0,079 | 0,47 [−0,07; 1,03] |
| miR-516b-5p | 0,784 | 0,06 [−0,35; 0,45] | 0,011* | −0,57 [−1,01; −0,15] | 0,020* | −0,62 [−1,09; −0,11] |
| miR-520a-5p | 0,784 | 0,10 [−0,46; 0,59] | 0,0010* | −0,80 [−1,21; −0,35] | 0,0050* | −0,89 [−1,38; −0,30] |
| miR-525-5p | 0,550 | −0,17 [−0,63; 0,35] | 4,3×10⁻⁴* | −0,86 [−1,31; −0,41] | 0,014* | −0,69 [−1,22; −0,18] |
Note. miRNA levels were normalized to the ath-miR-159a spike-in control. Between-group comparisons were performed using the Mann–Whitney U test. log₂FC is presented with a 95% confidence interval. A positive log₂FC indicates a higher miRNA level in the first group specified in the comparison. * indicates a result that remained statistically significant after FDR correction for multiple comparisons (adjusted p<0.05).
Disclaimer/Publisher’s Note: The statements, opinions and data contained in all publications are solely those of the individual author(s) and contributor(s) and not of MDPI and/or the editor(s). MDPI and/or the editor(s) disclaim responsibility for any injury to people or property resulting from any ideas, methods, instructions or products referred to in the content. |
© 2026 by the authors. Licensee MDPI, Basel, Switzerland. This article is an open access article distributed under the terms and conditions of the Creative Commons Attribution (CC BY) license (http://creativecommons.org/licenses/by/4.0/).
Copyright: This open access article is published under a Creative Commons CC BY 4.0 license, which permit the free download, distribution, and reuse, provided that the author and preprint are cited in any reuse.