
Submitted:
12 October 2026
Posted:
13 October 2026
You are already at the latest version
Abstract
Courtyard-style campus buildings often suffer from poor outdoor wind environments affecting pedestrian comfort. This study proposes a deep learning-based rapid prediction and optimization framework to bypass the computational expense of traditional numerical simulations. A parametric dataset of 216 pedestrian-level wind fields is constructed via CFD simulations, varying building width-to-height ratio and wind incidence angle. A pix2pix conditional generative adversarial network is trained as a surrogate model to learn the direct mapping from building geometry to wind speed distribution. Unlike conventional regression networks that produce over-smoothing, the adversarial training preserves sharp velocity gradients and local extremes—features critical for comfort assessment. The model achieves a single-case inference time of 1.4 seconds. Results reveal that summer comfort coverage reaches 98.4%, while winter coverage drops sharply to 19.5%, identifying winter as the critical season for intervention. Parametric analysis shows that wind incidence angle exerts a pronounced effect: comfort area increases from 12.9% at perpendicular incidence to 24.1% at 45°. The optimal design is W/H = 1.4 and θ = 45°. The framework has been implemented as a prototype software system. This study provides a valuable reference for climate-adaptive design of campus courtyard buildings.
Keywords:
courtyard building
; outdoor wind environment
; deep learning
; pix2pix
; pedestrian comfort
; campus design
1. Introduction
Campus built environment, as an important part of urban residential space, plays a crucial role in shaping the outdoor microclimate and daily living comfort of teachers and students[1]. Poorly planned building forms and spatial layouts can have a significant impact not only on the local wind environment around buildings but also on the natural ventilation effect and pedestrian comfort of the site[2]. In the case of courtyard-style campus buildings, these effects are particularly pronounced, leading to issues such as static wind zones inside the courtyard[3], extensive wind shadow areas on the leeward side[4], and excessive wind speed at building corners[5].
There are three primary research methods for studying building outdoor wind environments: in situ measurements[6], wind tunnel tests, and numerical simulations[7]. Field measurements are greatly affected by the surrounding environment and meteorological conditions, and the resulting conclusions have limited universality for different building forms. Wind tunnel tests are usually expensive[8] and may not provide sufficient efficiency for repeated scheme comparisons in architectural design stages. Computational fluid dynamics (CFD) simulations are the main tool used to analyze wind environments of various building scales at present[9]. However, traditional CFD simulation requires professional operation, long calculation time and high hardware cost, which makes it difficult to meet the demand of rapid wind environment evaluation in the early stage of architectural scheme design.
In the field of studying the outdoor wind environment of single buildings, building morphology plays a crucial role in influencing wind conditions. This includes factors such as the building’s plane form[10], aspect ratio[11], and opening layout[12]. For courtyard-style buildings widely used in campus construction, the enclosure degree and geometric scale directly determine the wind field distribution inside and around the building. Research on the ventilation potential of courtyard spaces has shown that air exchange between the courtyard and its surroundings depends strongly on the courtyard geometry and the incidence angle of the approaching wind[13]. Wind-tunnel investigations of square buildings have further revealed that the corner wind speed amplification at pedestrian level becomes more pronounced as the building facade widens, owing to enhanced downwash and Venturi effects[14].
In recent years, with the development of artificial intelligence technology, deep learning methods have been gradually applied to the field of building performance prediction, providing a new way to replace traditional CFD simulation for rapid calculation[15]. Research indicates that deep learning models can effectively learn the mapping relationship between building morphology and physical performance fields, and realize fast prediction of wind environment, thermal environment and other indicators[16]. Image-to-image translation models represented by generative adversarial networks have achieved good results in the prediction of two-dimensional wind field cloud maps, and the prediction speed is much higher than that of traditional numerical simulation[17]. Additionally, relevant studies have verified that the prediction accuracy of deep learning models can meet the needs of architectural scheme evaluation[18] by training with sufficient CFD sample data. Clemente et al. developed a convolutional neural network (CNN)-based wind field prediction model for simplified urban environments, achieving near-instantaneous pedestrian-level wind speed estimation for early-stage design[19]. However, most existing models are oriented to regular urban block forms, and there are few targeted studies on typical courtyard-style campus buildings.
Upon reviewing the aforementioned studies, it is evident that the majority of existing literature focuses on wind environment simulation and optimization of conventional building forms based on CFD. Most of the deep learning prediction models are oriented to urban block scale, and lack systematic research on the wind environment of courtyard-style campus buildings considering both morphological parameters and wind direction factors. There is still a lack of efficient and accurate rapid prediction tools for the wind environment evaluation of campus building schemes in the early design stage.
Therefore, this paper takes typical courtyard-style buildings in a university in Wuhan as the research object, and constructs a wind environment prediction model based on deep learning, considering the dual variables of building aspect ratio and incoming wind direction. The study first establishes a dataset composed of building plane layouts and corresponding CFD wind speed cloud maps, then trains and verifies the prediction model, and analyzes the prediction accuracy under different working conditions. This research aims to realize rapid prediction of outdoor wind environment of courtyard buildings, and provide efficient technical support for wind environment evaluation and scheme optimization in the early stage of architectural design. The results of this study offer important insights for improving the design efficiency of campus buildings and optimizing the outdoor microclimate of campus.
2. Methodology
2.1. Overview and Implementation Framework
This study develops a rapid prediction and optimization framework for outdoor wind environments around campus courtyard buildings, with the pix2pix conditional generative adversarial network serving as the core surrogate model. The framework is designed to learn a direct mapping from building geometry to two-dimensional pedestrian-level wind speed fields, thereby circumventing the computational expense of traditional CFD simulations. The methodological development proceeds through three interconnected stages. The first stage encompasses the construction of a comprehensive parametric CFD dataset, including the selection of a representative research object, the definition of geometric and wind-direction variables, and the establishment of consistent modeling and simulation protocols. The second stage addresses data preprocessing and dataset partitioning, transforming raw simulation outputs into paired image samples suitable for deep learning while ensuring rigorous separation of training, validation, and test sets. The third stage details the architecture, training strategy, and loss formulation of the pix2pix model, explaining both the Generator and Discriminator designs and their adversarial interplay. The process is shown in Figure 1.
The entire framework—comprising dataset preprocessing, model training, inference, and wind-field post-processing—has been implemented as a prototype software system based on Python and the PyTorch library, with modular components for data management, network definitions, training orchestration, and result visualization. The system supports both paired (pix2pix) and unpaired (CycleGAN) training modes[20] and incorporates practical engineering features such as multi-GPU distributed training, checkpoint-based training resumption, automated learning-rate scheduling with early stopping, and real-time loss monitoring. The post-processing pipeline converts normalized network outputs back to physically meaningful wind speed values and generates standardized wind maps that are directly interpretable for pedestrian comfort assessment. This software has been registered with the National Copyright Administration of China (registration no. 2026SR0789980). By encapsulating the complete workflow into a configurable tool, the framework lowers the barrier to adoption in architectural practice, enabling designers without specialized machine learning expertise to perform rapid wind environment assessment during early-stage campus planning.
2.2. Parametric CFD Dataset Construction
The reliability and generalizability of any data-driven surrogate model depend critically on the quality, coverage, and consistency of its training data. To this end, a comprehensive parametric dataset was constructed using high-fidelity CFD simulations, systematically varying two key design factors that govern courtyard wind behavior: the building width-to-height ratio and the wind incidence angle.
2.2.1. Research Object and Parametric Design
The research focuses on a typical six-story courtyard-style dormitory building located in the western precinct of the Hubei University of Technology campus. A preliminary survey of courtyard buildings across the campus revealed that structures of six to seven stories constitute the majority, accounting for approximately 54% of all such buildings, with the western area exhibiting the highest concentration; the survey results are presented in Table 1. The selected prototype has a fixed height H of 24 m, a reference width-to-height ratio of approximately 0.9, a courtyard width of 22 m, and an opening facing due west, representing the most prevalent morphological type observed on the campus, as shown in Figure 2.
To isolate the influence of building proportion from confounding vertical effects, the width-to-height ratio W/H was selected as the sole geometric control variable[21]. The ratio is defined as the windward facade width W divided by the fixed building height H. Nine discrete levels were adopted, ranging from 0.8 to 1.6 at intervals of 0.1. All parametric models maintain an identical courtyard outline, opening position, and internal layout, with only the windward facade width adjusted accordingly. This controlled variation ensures that any observed changes in the wind field can be attributed unequivocally to changes in the aspect ratio rather than to modifications in courtyard geometry or opening configuration.
For the wind incidence angle, a full-cycle scheme with 15° increments over the range of 0°–345° was adopted, yielding 24 distinct wind directions. This comprehensive angular coverage captures the flow characteristics under any incoming wind orientation encountered in actual campus conditions, because oblique wind approaches often induce strong corner accelerations and asymmetric wake patterns that would be missed by a limited set of cardinal directions. The full factorial combination of the nine width-to-height ratios and 24 wind angles produced a complete set of 216 parametric CFD cases.
2.2.2. Modeling and Simulation Protocol
All 216 cases were simulated with a consistent CFD protocol to guarantee data homogeneity across the dataset. The RNG k-ε turbulence model, which has been extensively validated for building wind environment applications[22], was adopted. Minor facade details (e.g., window sills and ornamental projections) that exert negligible influence on the overall flow field were simplified, while the essential volumetric enclosure, opening positions, and overall dimensions were preserved. The computational domain extended no less than 5H from the building to the inlet, outlet, and lateral boundaries and 6H in height, where H is the building height. The domain was discretized with a fine 0.5 m grid within the building zone and a coarser 1 m grid elsewhere, with a growth rate of 1.02; for the prototype (W/H = 0.9), this configuration yielded approximately 290,000 cells. Along the vertical direction, the grid was locally refined at the pedestrian height of 1.5 m to ensure accurate wind speed extraction.
At the inlet, a power-law vertical mean wind speed profile was applied with a roughness exponent α = 0.3, following the Chinese load code for building structures and matching the dense campus built environment. All cases were run under steady-state conditions with a maximum of 2000 iterations and uniform convergence rules[23]. From each converged simulation, the time-averaged wind speed field at the pedestrian height of 1.5 m was extracted as the ground-truth label for model training.
2.3. Data Preprocessing and Dataset Partitioning
The raw CFD simulation outputs and building geometry data require standardized preprocessing to form paired image samples compatible with the pix2pix model input format. Building morphology was encoded as a single-channel two-dimensional height map, where each pixel value represents the building height at that spatial location. The spatial extent of the height map matches the horizontal computational domain of the CFD simulation, with the hollow courtyard area and surrounding open space assigned a value of zero, representing the ground surface. All geometry maps were uniformly resampled to a resolution of 256 × 256 pixels to standardize model input dimensions and support efficient batch training.
For each CFD simulation case, the time-averaged wind speed field at the pedestrian height of 1.5 m above ground was extracted as the ground-truth label for model training. Invalid wind speed values at building footprint positions were replaced with zero, and the spatial coordinate system was strictly aligned with the building height map to ensure pixel-wise correspondence between input geometry and output wind field. Wind speed maps were likewise resampled to a uniform resolution of 256 × 256 pixels, consistent with the geometry input. To match the output range of the Tanh activation function at the generator’s output layer and improve training stability of the GAN framework, pixel values of both geometry height maps and wind speed maps were linearly normalized to the interval [−1, 1]. After preprocessing, each parametric case corresponds to a paired sample consisting of a building height map as the input and a pedestrian wind speed map as the target output, collectively forming the image-to-image translation dataset for pix2pix model training.
To assess the model’s generalization capacity to unseen parameter combinations, a stratified sampling strategy based on parameter combinations was adopted for dataset partitioning. The full set of 216 cases was divided into training, validation, and test sets at a ratio of 7:2:1, with stratification performed over the combined parameter space of width-to-height ratios and wind incidence angles. This approach ensures that each subset contains representative samples across the entire parametric range, avoiding the scenario where a particular aspect ratio or wind direction is entirely absent from the training set. The training set drives the iterative weight updates during model optimization, the validation set guides early stopping and hyperparameter selection, and the held-out test set, comprising parameter combinations entirely excluded from the training process, is reserved exclusively for the final unbiased assessment of quantitative accuracy and design law analysis.
2.4. Pix2pix Conditional Generative Adversarial Network
2.4.1. Conceptual Framework
The central component of the proposed framework is the pix2pix conditional generative adversarial network, originally introduced by Isola et al.[24] as a general-purpose solution for image-to-image translation tasks. The core insight underlying this architecture is that many problems in computer vision and physical simulation can be framed as translating an input image from one domain to an output image in another domain—in this case, from a building height map to a wind speed field.
The choice of pix2pix over alternative deep learning architectures is motivated by two principal considerations. First, the GAN framework addresses the fundamental limitation of conventional regression networks, such as a plain U-Net trained with L1 or L2 loss: the tendency to produce over-smoothed predictions that average out high-frequency variations. This smoothing behavior arises because pixel-wise loss functions penalize deviations from the mean, encouraging the network to output the conditional average rather than the full distribution of possible outputs. While such averaging may be acceptable for certain regression tasks, it is detrimental for wind field prediction, where sharp gradients at building corners, shear layers along wake boundaries, and localized extreme values carry critical implications for pedestrian comfort. The adversarial loss in pix2pix counteracts this tendency by forcing the generator to produce outputs that are structurally indistinguishable from real CFD fields, thereby recovering the high-frequency content that pixel-wise losses alone would sacrifice.
Second, the image-to-image formulation of pix2pix aligns naturally with the spatial nature of wind field data. Unlike scalar-output surrogates that collapse the wind environment into a few aggregated indicators, pix2pix preserves the full two-dimensional spatial distribution. This spatial fidelity is essential for identifying localized phenomena such as corner jets, courtyard stagnation zones, and wind shadow regions—features that determine the usability of specific outdoor areas for pedestrian activities.
Among deep learning methods for physical field prediction, the pix2pix framework occupies a distinctive position. U-Net-based convolutional networks capture spatial hierarchies and preserve local details through skip connections[25], and generative adversarial networks further impose an adversarial objective that encourages structural realism. Fourier neural operators and physics-informed neural networks have emerged as powerful paradigms for learning solution operators of partial differential equations, while transformer- and graph-based architectures model long-range dependencies and irregular spatial relationships. However, many of these advanced paradigms require specialized implementation expertise and substantial computational resources, whereas pix2pix offers a well-established, readily implementable architecture with demonstrated effectiveness in paired image translation tasks[26]. Its training stability, computational efficiency, and ability to preserve high-frequency spatial details make it particularly suitable for the present application, where the dataset is of moderate size and the primary requirement is accurate reconstruction of spatial wind patterns rather than extrapolation to radically unseen flow regimes. Building on this framework, high-resolution variants such as Pix2PixHD extend the approach to large-scale image synthesis[27].
2.4.2. Generator Architecture: U-Net with Skip Connections
The Generator, denoted G, is tasked with synthesizing a realistic wind field G(x) from the input building height map x. A U-Net architecture was employed, comprising a contracting encoder pathway and an expansive decoder pathway. The encoder progressively downsamples the 256 × 256 input through successive convolutional layers, each followed by batch normalization and LeakyReLU activation, to extract increasingly abstract feature representations of the building geometry. The bottleneck layer at the lowest spatial resolution captures the global context of the courtyard configuration, including the overall enclosure, the opening orientation, and the spatial relationship between the windward facade and the interior void.
The decoder symmetrically upsamples these feature representations back to the original resolution through transposed convolutions, gradually reconstructing the spatial details of the wind field. A critical architectural feature is the inclusion of skip connections that concatenate feature maps from the encoder to the corresponding decoder levels at identical spatial resolutions. First, they propagate fine-grained spatial information directly from the input to the output, bypassing the information bottleneck at the lowest resolution. This is particularly important for preserving the precise footprint of the building and the courtyard void, as well as the sharp edges where flow separation and reattachment occur. Second, they provide the decoder with multi-scale contextual information, enabling the simultaneous reconstruction of both global flow patterns and local details. The final layer of the generator applies a Tanh activation function to constrain the output to the normalized range [−1, 1].
The U-Net architecture is particularly well-suited to the present task because the input and output images share the same spatial structure—the building footprint in the input directly corresponds to the building footprint in the output wind field. The skip connections effectively bypass the need for the network to re-learn this spatial correspondence through the bottleneck, enabling more efficient training and more accurate reconstruction of the wind field geometry.
2.4.3. Discriminator Architecture: PatchGAN
The Discriminator, denoted D in Figure 3, is trained to distinguish between generated (fake) wind fields and real CFD-derived ground truth. Rather than employing a traditional discriminator that outputs a single scalar classification for the entire image, a PatchGAN configuration was adopted. The PatchGAN classifies each N × N patch of the input image independently, outputting a matrix of predictions that indicate whether each patch is real or fake. The final discriminator output is obtained by averaging over all patches, but the patch-level supervision during training provides a stronger signal for local structure refinement than a global image-level discriminator.
This design choice is motivated by the observation that many image generation artifacts manifest at the local scale—blurred edges, unrealistic textures, and inconsistent gradients. By focusing on patch-level realism, the PatchGAN encourages the generator to produce outputs that are locally coherent and detail-preserving, which directly corresponds to the need for accurate representation of local wind speed gradients and extreme values. The receptive field of each patch is sufficiently large to capture the surrounding context while remaining small enough to enforce strict local fidelity. In the present implementation, a 70 × 70 PatchGAN was employed, following the recommended configuration of the pix2pix study[24].
2.4.4. Loss Function and Training Objective
The training objective of the pix2pix model combines two complementary loss components that serve distinct yet synergistic purposes. The conditional adversarial loss drives the minimax game between Generator and Discriminator, enabling the Generator to learn a structured loss that promotes realistic spatial patterns rather than merely minimizing pixel-wise discrepancies. Formally, the adversarial loss is defined as:
where the Generator attempts to minimize this objective to fool the Discriminator, while the Discriminator attempts to maximize it to correctly classify real versus fake. This adversarial interplay compels the Generator to produce outputs that not only approximate the ground truth numerically but also replicate its statistical properties and spatial structure.
LcGAN(G,D) = Εx,y[logD(x,y)] + Εx[log(1 − D(x,G(x)))]
The L1 reconstruction loss penalizes the absolute pixel-wise difference between the generated wind field and the CFD ground truth:
LL1(G) = Ex,y[‖ − G(x)‖1]
The L1 loss, as opposed to L2, is chosen because it penalizes large errors less severely and typically produces sharper results that better preserve edges. The total Generator loss is formulated as a weighted sum:
where the weight coefficient λ for the L1 component is set to 100, following the recommended configuration of the pix2pix study[24]. This high weighting ensures that the model prioritizes quantitative fidelity—a critical requirement for wind environment assessment, where numerical accuracy directly influences comfort classification—while retaining the adversarial regularizer’s capacity to recover high-frequency flow structures. The balance between these two losses is essential: without the adversarial loss, the model would produce over-smoothed predictions that underestimate peak wind speeds; without the L1 loss, the model might generate structurally plausible but numerically inaccurate fields that deviate systematically from the CFD ground truth.
G = arg minG max LcGAN(G,D) + λ · LL1(G)
The training process alternates between updating the Discriminator and the Generator. In each iteration, the Discriminator is first updated using a batch of real paired samples (input geometry, ground-truth wind field) and fake paired samples (input geometry, generated wind field), learning to assign high scores to real pairs and low scores to fake pairs. The Generator is then updated to minimize a combined objective that includes both the adversarial loss (to fool the Discriminator) and the L1 reconstruction loss (to maintain numerical fidelity). This alternating optimization gradually drives both networks toward an equilibrium where the Generator produces outputs indistinguishable from real CFD fields while maintaining quantitative accuracy.
2.5. Model Training and Performance Evaluation
All training and inference experiments were conducted on a workstation equipped with an NVIDIA RTX 4060 GPU with 16 GB of video memory, running in a consistent software environment to ensure reproducibility. The Adam optimizer was employed[28] for both the Generator and Discriminator networks, with β₁ = 0.5, β₂ = 0.999, and a learning rate of 2 × 10⁻⁴ applied uniformly across both networks. A maximum of 200 training epochs was specified, and an early stopping strategy with a patience of 20 epochs was implemented to prevent overfitting. During training, the L1 loss on the validation set was monitored as the stopping criterion: when the validation loss did not decrease for 20 consecutive epochs, the training process was automatically terminated, and the model checkpoint with the minimum validation L1 loss was retained for subsequent accuracy evaluation and design analysis. This approach ensures that the final model generalizes well to unseen data rather than simply memorizing the training set.
The predictive performance of the trained model was quantified using three standard regression metrics computed over all valid pixels within the pedestrian-accessible outdoor domain, explicitly excluding building footprint positions. The root mean square error measures the overall deviation between predicted wind speed values and CFD ground truth, with greater sensitivity to large errors and thus reflecting the overall prediction accuracy. The mean absolute error calculates the average of absolute pixel-wise errors, offering a more robust measure that is less influenced by outliers and can more stably reflect the average prediction level. The coefficient of determination R² measures the linear correlation between predicted values and ground truth, with values closer to unity indicating that the model can better explain the spatial variation of the wind field. These three metrics are respectively formulated as:
where yi is the ground-truth wind speed value from CFD simulation, ŷi is the model-predicted value, ȳ is the mean value of the ground-truth wind speed, and N is the total number of valid pixels excluding building footprints.
In addition to these quantitative metrics, the single-case inference time was recorded to quantify the computational speed advantage relative to conventional CFD, providing practical reference for the application of the surrogate model in early-stage architectural design. The spatial fidelity of the predictions was also assessed qualitatively through side-by-side visual comparisons of predicted and ground-truth wind fields, with particular attention to the reconstruction of sharp gradients, extreme values, and the spatial extent of high- and low-speed zones. These quantitative and qualitative evaluations collectively establish the model’s reliability and efficiency, forming the basis for the subsequent parametric exploration and design optimization presented in the following sections. The evaluation metrics obtained on the held-out test set, including their mean, median, and interquartile range, are reported in Section 3.1 to provide a comprehensive and unbiased assessment of the pix2pix model’s predictive performance across the diverse range of building geometries and wind conditions represented in the dataset.
The training process was monitored through the G_L1 reconstruction loss on the training set. As shown in Figure 4, the loss decreased rapidly from approximately 22.5 at epoch 1 to below 5.0 by epoch 30, and continued to converge gradually to approximately 3.0 at epoch 200, representing an overall reduction of approximately 84.9%. Model checkpoints were saved at 10-epoch intervals, and the learning rate was decayed from epoch 100 onward to enable finer parameter updates. The smooth convergence without significant oscillations or divergence confirms the stability of the adversarial training process.
3. Results
Wuhan is characterized by distinct hot summers and cold winters[29], while spring and autumn are short, with weak and variable prevailing wind conditions that are not representative for outdoor wind environment assessment. Therefore, this study prioritizes summer and winter baseline wind conditions to analyze the pedestrian wind performance of the typical courtyard teaching building at Hubei University of Technology. Meanwhile, the pix2pix conditional generative adversarial network trained on parametric CFD samples is fully evaluated in terms of training convergence and overall prediction accuracy, to verify its reliability for fast wind field prediction of campus courtyard building forms.
3.1. Model Prediction Accuracy
Table 2 reports the full-set quantitative evaluation metrics across all test samples, including the mean, median, and interquartile range (IQR) of the root mean square error (RMSE), mean absolute error (MAE), and coefficient of determination (R²). Averaged over all parametric working conditions, the pix2pix model achieves an RMSE of 0.437 m/s, an MAE of 0.147 m/s, and an R² of 0.712. The median RMSE and MAE are 0.423 m/s and 0.144 m/s, respectively, while the median R² rises to 0.735. The narrow IQRs (RMSE = 0.084 m/s, MAE = 0.033 m/s, R² = 0.087) indicate that the prediction accuracy is consistent across the diverse building width-to-height ratios and incoming wind angles tested, without abrupt performance degradation under extreme geometric or flow conditions. The single-case inference efficiency is also documented for practical architectural design reference: the full end-to-end prediction workflow, including geometry preprocessing and wind-field output, requires approximately 1.4 s for a 256 × 256 input on the configured workstation, which is orders of magnitude faster than the multiple hours needed for a single steady-state CFD simulation of the same campus-building domain.
Figure 5 presents side-by-side qualitative comparisons between the pix2pix-predicted wind fields and the corresponding CFD ground truth for three representative test cases. Visually consistent spatial patterns are observed across all comparison groups. The generator accurately reproduces the core flow signatures characteristic of enclosed courtyard buildings, including accelerated wind jets at vertical building corners, extensive low-velocity wind shadow zones on the leeward enclosure sides, and stagnant airflow within the central courtyard void. Sharp velocity gradients separating high-speed pedestrian corridors and sheltered calm zones are clearly reconstructed, without the over-smoothing artifacts prevalent in single U-Net regression models. Minor pixel-level numerical discrepancies emerge primarily along wake fringe boundaries, as highlighted in the error maps; these local deviations do not alter the overall spatial contour of the wind field or the distribution range of peak wind magnitudes. No systematic overestimation or underestimation of extreme wind speeds is detected across the full dataset, and the spatial extent of high-wind and low-wind pedestrian zones maintains strong alignment with CFD ground truth under all tested wind incidence angles and building proportions.
3.2. Summer Wind Environment of the Prototype Courtyard Building
The benchmark prototype courtyard building retains its original fixed width-to-height ratio of 0.9. The wind field is defined by the typical boundary condition of the prevailing summer monsoon in Wuhan, with a wind speed of 2.35 m/s and the wind direction set to southeast (ESE). The full-domain 1.5 m pedestrian-height wind speed cloud map predicted by the trained pix2pix model under this summer wind input is shown in Figure 6. Table 3 summarizes the core statistical indicators extracted from the predicted wind field over all walkable outdoor areas, including the domain-averaged wind speed, the maximum and minimum local wind speeds, and the area proportions of different wind speed intervals.
Under the summer prevailing wind condition, the predicted outdoor wind speed ranges from 0.30 m/s to 3.68 m/s, with a domain-averaged value of 2.47 m/s. The spatial distribution reveals a largely sheltered pedestrian environment characteristic of an enclosed courtyard layout. The outer perimeter zones, particularly along the eastern and western building walls, exhibit slightly higher wind speeds due to corner acceleration, while the central courtyard void remains uniformly calm. The maximum wind speed of 3.68 m/s is recorded near the northern building corner, and the vast majority of the courtyard interior maintains wind speeds between 1 m/s and 3 m/s.
Quantitative comfort assessment according to widely adopted pedestrian wind criteria[30] confirms a favorable outdoor wind environment for summer campus activities. Approximately 98.4% of the total pedestrian area falls within the 1–3 m/s interval, which is generally regarded as suitable for prolonged sitting and light walking. Only 0.9% of the area experiences wind speeds below 1 m/s, indicating that stagnant air pockets are minimal and that sufficient air movement is maintained throughout the entire courtyard space. These results demonstrate that, under the assumed summer prevailing wind direction, the prototype effectively balances wind shelter and ventilation, creating a calm yet adequately ventilated microclimate in the central communal zone.
3.3. Winter Wind Environment of the Prototype Courtyard Building
The same prototype courtyard teaching building is then evaluated under Wuhan’s typical winter prevailing wind boundary condition, with a wind speed of 3 m/s and the wind direction set to northeast (NE). The predicted results are shown in Figure 7.
Under the winter prevailing wind, the predicted outdoor wind speed ranges from 0.46 m/s to 4.83 m/s, with a domain-averaged value of 3.04 m/s (as shown in Table 4). Compared with the summer baseline (average 2.47 m/s), the overall pedestrian-level wind speed is noticeably higher, reflecting the stronger ambient wind characteristic of Wuhan’s winter months. However, unlike the summer case where 98.4% of the pedestrian area lay within the 1–3 m/s comfort zone, this proportion decreases to 19.5% in winter, indicating that the majority of outdoor spaces now experience wind speeds between 3 m/s and 5 m/s. Only 0.3% of the area falls below 1 m/s. From the perspective of pedestrian wind comfort, the substantial reduction in the 1–3 m/s comfort area suggests that outdoor sitting and prolonged stationary activities may be less pleasant during winter[31]. The fact that no area surpasses 5 m/s, however, confirms that the courtyard still provides effective wind sheltering compared to an open site, owing to the shielding effect of the enclosing building blocks.
4. Discussion
4.1. Influence of Core Architectural Parameters on Campus Pedestrian Wind Environment
The baseline wind environment analyses in Section 3 demonstrated that the prototype courtyard building provides a satisfactory summer microclimate, with 98.4% of the pedestrian area lying within the 1–3 m/s comfort zone. However, the winter evaluation (Section 3.3) revealed a substantial reduction in comfort performance under the stronger winter wind. This seasonal contrast indicates that the prototype building’s spatial form must be refined to improve winter shelter without excessively compromising summer ventilation. Accordingly, this section investigates how two key planning parameters—the courtyard width-to-height ratio and the incoming wind incidence angle—influence the winter pedestrian wind field, aiming to identify optimal parameter ranges for subsequent design optimization.
4.1.1. Influence of the Courtyard Width-to-Height Ratio on the Wind Field
The training dataset for the pix2pix model encompasses width-to-height ratios from 0.8 to 1.6. All simulations are conducted under the fixed winter prevailing wind direction (perpendicular to the main facade). The predicted 1.5 m pedestrian-height wind speed cloud maps are presented in Figure 8, and the outdoor wind statistics are reported in Table 5.
Across all working conditions, the domain-averaged wind speed remains virtually constant at 2.98–2.99 m/s, and the minimum wind speed stays at 0.62 m/s. The maximum wind speed fluctuates between 3.93 m/s and 4.52 m/s with no discernible systematic trend. The only metric that exhibits a slight monotonic variation is the comfort-zone coverage, which rises gradually from 13.0% at the narrowest courtyard (ratio = 0.8) to a peak of 14.6% at ratio = 1.4, then declines slightly to 14.3–14.4% for the widest courtyards (ratio = 1.5–1.6). The results indicate that the maximum improvement in comfort achievable through width-to-height ratio adjustment is less than 2%, making it an ineffective strategy for enhancing pedestrian comfort during winter in such buildings. Previous parametric studies of high-density built environments have reported stronger wind-comfort sensitivities to building height and porosity, underscoring the context dependence of such geometric effects[32]. In contrast to geometric adjustments, alternative design measures such as ground-floor elevation have been demonstrated to improve the wind environment of school courtyard spaces[33].
4.1.2. Influence of the Wind Incidence Angle on the Wind Field
While the previous section demonstrated that the courtyard width-to-height ratio has only a marginal effect on the winter pedestrian wind environment, the direction of the incoming wind relative to the building is expected to play a more decisive role. In this section, the prototype building (width-to-height ratio = 0.9) is used, and the winter prevailing wind boundary condition is applied at six representative incidence angles: 0° (perpendicular to the main facade), 15°, 30°, 45°, 60°, and 75°. The pix2pix-predicted 1.5 m pedestrian-height wind speed cloud maps for all six angles are presented in Figure 9, and the corresponding outdoor wind statistics are summarized in Table 6.
The results reveal that, as the wind direction deviates from the normal, the domain-averaged wind speed initially decreases from 2.99 m/s at 0° to a minimum of 2.82–2.86 m/s at 15°–45°, before rising again to 3.07 m/s at 75°. Simultaneously, the minimum wind speed climbs from 0.62 m/s at perpendicular incidence to a peak of 1.08 m/s at 45°, then declines to 0.88 m/s at 75°. These two trends act in concert to drive a pronounced parabolic variation in the comfort-zone coverage: the area proportion within the 1–3 m/s interval rises steadily from 12.9% at 0° to a maximum of 24.1% at 45°, then falls back to 17.4% at 75°.
At 0°, the wind impinges perpendicularly on the windward facade and enters the courtyard with maximum streamwise momentum. The flow is concentrated along a relatively narrow central corridor, where wind speeds are elevated, while the lateral zones near the side walls experience weaker recirculation, with wind speeds dropping as low as 0.62 m/s. This bimodal distribution limits the fraction of the pedestrian area that falls within the comfort zone. As the incidence angle increases to 15°–45°, the effective opening width of the courtyard entrance decreases, and the upstream building increasingly shelters the interior. The total wind energy entering the courtyard is reduced, leading to a lower domain-averaged wind speed. At the same time, the oblique entry causes the airflow to spread more evenly across the pedestrian plane, filling the previously stagnant corners and raising the minimum wind speed. The combined effect of lower mean speed and higher minimum speed shifts a substantially larger share of the area into the comfort range. Beyond 45°, the trend reverses. At 60° and 75°, the effective inlet becomes excessively narrow, and the velocity field becomes less uniform. The minimum wind speed drops as large portions of the courtyard fall into the aerodynamic shadow of the side walls, and the comfort area contracts accordingly.
The results indicate that by adjusting the building orientation to direct the dominant winter wind at an incidence angle of approximately 45°, the comfortable zone area can be increased by approximately 12% compared to the case of vertical incidence. This approach differs fundamentally from the method for adjusting the courtyard’s width-to-height ratio discussed in Section 4.1.1, and yields significantly superior results.
4.1.3. Compound Coupling Effect of the Width-to-Height Ratio and Wind Incidence Angle
The parametric analyses in Section 4.1.1 and Section 4.1.2 reveal a compound coupling effect of the width-to-height ratio and the wind incidence angle on the pedestrian wind environment. The angle effect dominates across the entire ratio range: at every tested ratio, oblique incidence angles (30°–60°) consistently enlarge the comfort zone relative to perpendicular incidence, whereas the ratio itself shifts the comfort coverage by no more than about two percentage points at any fixed angle.
Such coupling patterns would be expensive to establish through repeated single-case CFD simulation. The pix2pix surrogate model constructed in this study can output full-field wind speed maps for all 216 parameter combinations within minutes, providing a convenient quantitative analysis tool for exploring the joint influence of multiple architectural morphological parameters[16].
4.2. Optimization Design
The parametric analyses in Section 4.1 revealed a clear hierarchy of design influences on the winter pedestrian wind environment of courtyard buildings. The courtyard width-to-height ratio was found to have only a marginal effect, with the comfort area varying within two percentage points across the full tested range (13.0%–14.6%). In contrast, the wind incidence angle exerted a substantial impact: at 45° the comfort coverage peaked at 24.1%.
4.2.1. Optimal Control Range of the Courtyard Width-to-Height Ratio
Although the sensitivity to the width-to-height ratio is weak, the data show a gentle optimum at a ratio of approximately 1.4, where the winter comfort area reaches its maximum (14.6%). Ratios lower than 1.0 tend to slightly reduce comfort, while ratios beyond 1.4 offer no further benefit. Therefore, for new courtyard teaching buildings on the Wuhan campus, a width-to-height ratio of 1.4 is recommended as the preferred baseline geometry.
4.2.2. Building Orientation Matching the Seasonal Prevailing Wind
The dominant factor is orientation. Wuhan’s winter prevailing wind typically approaches from the north or northeast, whereas the summer monsoon arrives from the south or southeast. By rotating the building such that the main facade forms an incidence angle of approximately 45° with the winter prevailing wind, the pedestrian-level wind comfort can be substantially enhanced. This rotation alters the summer wind incidence as well, but given the extremely high summer comfort baseline, it is unlikely to cause a critical degradation—a hypothesis that must be verified through coupled summer–winter simulation.
5. Conclusions
This study presents a rapid pedestrian-level wind environment prediction framework for campus courtyard buildings based on the pix2pix image-to-image translation model, and systematically investigates the influence of the courtyard width-to-height ratio and wind incidence angle on the outdoor wind comfort of a courtyard building at Hubei University of Technology. Based on the parametric analysis, a climate-adaptive design optimization strategy is proposed. The main findings are as follows: (1) The trained pix2pix surrogate model demonstrates satisfactory predictive accuracy, achieving an average RMSE of 0.437 m/s and a median R² of 0.735 on the test set, while delivering a 1.5 m pedestrian-height wind speed cloud map within approximately 1.4 s, establishing the feasibility of deep-learning surrogates for rapid wind assessments in early-stage architectural design. (2) The seasonal baseline evaluation reveals a pronounced contrast in the outdoor wind environment: under the summer prevailing wind, the prototype provides an excellent pedestrian microclimate with 98.4% of the outdoor area within the comfort zone, whereas under the winter prevailing wind, the comfort coverage drops substantially to 19.5%, identifying winter as the critical period requiring design intervention. (3) The courtyard width-to-height ratio exerts only a marginal influence on winter pedestrian wind comfort, with the comfort area varying within a narrow range of 13.0% to 14.6% across the full tested interval of 0.8–1.6, peaking at a ratio of 1.4. (4) The wind incidence angle exerts a substantially stronger and non-monotonic effect: as the angle increases from 0° to 45°, the comfort area increases from 12.9% to 24.1%. (5) Synthesizing these findings, the theoretically optimal layout scheme for courtyard buildings under the climatic conditions of Wuhan should maintain a wind incidence angle of 45° and a courtyard width-to-height ratio of 1.4.
There are numerous factors influencing the outdoor wind environment of campus buildings, including surrounding building massing, vegetation distribution, and topographic variations. This study focuses specifically on the influence of the courtyard width-to-height ratio and wind incidence angle, excluding the effects of adjacent buildings, landscaping elements, and transient wind fluctuations. The current pix2pix model is trained on a specific range of courtyard geometries and wind directions, and, as a purely data-driven image translation approach, it may not fully resolve near-wall velocity gradients or subtle bulk-flow attenuation. Future research should extend the training dataset to encompass a wider variety of building typologies and heights, and explore physics-informed or hybrid surrogate-CFD frameworks to further enhance the quantitative fidelity of the predictions.
With the continued advancement of deep learning and computational sciences, the simulation of complex urban microclimates is becoming increasingly efficient and accessible. In the context of rapid campus expansion and urbanization in China, the integration of image-based surrogate models such as pix2pix offers a practical tool to address pedestrian wind comfort challenges at the neighborhood scale. By employing the controlled variables method within a parametric modeling framework, underlying wind-regulating patterns can be identified and translated into optimal design strategies. This “simulation–design” feedback loop provides a promising mechanism to improve outdoor ventilation quality and thermal comfort in campus environments, contributing to the creation of more livable and climate-responsive educational spaces.
Author Contributions
Z.Z. analyzed the data and wrote the paper; S.Z. (Sitan Zhu) participated in the revision of the paper. All authors have read and agreed to the published version of the manuscript.
Funding
This research received no external funding.
Data Availability Statement
The data presented in this study are available on request from the corresponding author.
Conflicts of Interest
The authors declare no conflicts of interest.
Abbreviations
The following abbreviations are used in this manuscript:
| CFD | Computational Fluid Dynamics |
| GAN | Generative Adversarial Network |
| CNN | Convolutional Neural Network |
| RMSE | Root Mean Square Error |
| MAE | Mean Absolute Error |
| IQR | Interquartile Range |
| R² | Coefficient of Determination |
| W/H | Width-to-Height Ratio |
| GPU | Graphics Processing Unit |
References
- Zhang, S.; Li, S.; Shu, L.; Xiao, T.; Shui, T. Landscape configuration effects on outdoor thermal comfort across campus—A case study. Atmosphere 2023, 14, 270. [Google Scholar] [CrossRef]
- Deng, J.-Y.; Xia, Y.; Lao, H.; Ye, Y.; Wang, Z.; Jiang, H. Natural ventilation potential of teaching building complexes with different block shapes and layout patterns. J. Build. Eng. 2024, 110420. [Google Scholar] [CrossRef]
- Yang, L.; Liu, X.; Qian, F.; Niu, S. Research on the wind environment and air quality of parallel courtyards in a university campus. Sustain. Cities Soc. 2020, 56, 102019. [Google Scholar] [CrossRef]
- Jiang, Z.; Gao, W.; Yao, W. Research on the wind environment in an enclosed courtyard: Effect of the opening position, size and wind angle. Urban Clim. 2023, 52, 101737. [Google Scholar] [CrossRef]
- Uematsu, Y.; Yamada, M.; Higashiyama, H.; Orimo, T. Effects of the corner shape of high-rise buildings on the pedestrian-level wind environment with consideration for mean and fluctuating wind speeds. J. Wind Eng. Ind. Aerodyn. 1992, 44, 2289–2300. [Google Scholar] [CrossRef]
- Shui, T.; Liu, J.; Yuan, Q.; Qu, Y.; Jin, H.; Cao, J.; Liu, L.; Chen, X. Assessment of pedestrian-level wind conditions in severe cold regions of China. Build. Environ. 2018, 135, 53–67. [Google Scholar] [CrossRef]
- Tse, K.T.; Weerasuriya, A.U.; Zhang, X.; Li, S.; Kwok, K.C.S. Pedestrian-level wind environment around isolated buildings under the influence of twisted wind flows. J. Wind Eng. Ind. Aerodyn. 2017, 162, 12–23. [Google Scholar] [CrossRef]
- Abohela, I.; Sundararajan, R. Analytical review of wind assessment tools for urban wind turbine applications. Atmosphere 2024, 15, 1049. [Google Scholar] [CrossRef]
- Blocken, B.; Stathopoulos, T.; Carmeliet, J.; Hensen, J.L.M. Application of computational fluid dynamics in building performance simulation for the outdoor environment: An overview. J. Build. Perform. Simul. 2011, 4, 157–184. [Google Scholar] [CrossRef]
- Saadatjoo, P.; Badamchizadeh, P.; Mahdavinejad, M. Towards the new generation of courtyard buildings as a healthy living concept for post-pandemic era. Sustain. Cities Soc. 2023, 97, 104726. [Google Scholar] [CrossRef]
- Ali-Toudert, F.; Mayer, H. Numerical study on the effects of aspect ratio and orientation of an urban street canyon on outdoor thermal comfort in hot and dry climate. Build. Environ. 2006, 41, 94–108. [Google Scholar] [CrossRef]
- Rajapaksha, I.; Nagai, H.; Okumiya, M. A ventilated courtyard as a passive cooling strategy in the warm humid tropics. Renew. Energy 2003, 28, 1755–1778. [Google Scholar] [CrossRef]
- Moonen, P.; Dorer, V.; Carmeliet, J. Evaluation of the ventilation potential of courtyards and urban street canyons using RANS and LES. J. Wind Eng. Ind. Aerodyn. 2011, 99, 414–423. [Google Scholar] [CrossRef]
- Tamura, Y.; Xu, X.; Yang, Q. Characteristics of pedestrian-level mean wind speed around square buildings: Effects of height, width, size and approaching flow profile. J. Wind Eng. Ind. Aerodyn. 2019, 192, 74–87. [Google Scholar] [CrossRef]
- Tien, P.W.; Wei, S.; Darkwa, J.; Wood, C.; Calautit, J.K. Machine learning and deep learning methods for enhancing building energy efficiency and indoor environmental quality—A review. Energy AI 2022, 10, 100198. [Google Scholar] [CrossRef]
- Huang, C.; Zhang, G.; Yao, J.; Wang, X.; Calautit, J.K.; Zhao, C.; An, N.; Peng, X. Accelerated environmental performance-driven urban design with generative adversarial network. Build. Environ. 2022, 224, 109575. [Google Scholar] [CrossRef]
- Kastner, P.; Dogan, T. A GAN-based surrogate model for instantaneous urban wind flow prediction. Build. Environ. 2023, 242, 110384. [Google Scholar] [CrossRef]
- Javanroodi, K.; Nik, V.M.; Giometto, M.G.; Scartezzini, J.-L. Combining computational fluid dynamics and neural networks to characterize microclimate extremes: Learning the complex interactions between meso-climate and urban morphology. Sci. Total Environ. 2022, 829, 154223. [Google Scholar] [CrossRef]
- Clemente, A.V.; Giljarhus, K.E.T.; Oggiano, L.; Ruocco, M. Rapid pedestrian-level wind field prediction for early-stage design using Pareto-optimized convolutional neural networks. Comput.-Aided Civ. Infrastruct. Eng. 2024, 39, 2826–2839. [Google Scholar] [CrossRef]
- Zhu, J.-Y.; Park, T.; Isola, P.; Efros, A.A. Unpaired image-to-image translation using cycle-consistent adversarial networks. In Proceedings of the IEEE International Conference on Computer Vision (ICCV), Venice, Italy, 22–29 October 2017; pp. 2223–2232. [Google Scholar]
- Yuan, C.; Ng, E. Building porosity for better urban ventilation in high-density cities—A computational parametric study. Build. Environ. 2012, 50, 176–189. [Google Scholar] [CrossRef]
- Blocken, B. Computational fluid dynamics for urban physics: Importance, scales, possibilities, limitations and ten tips and tricks towards accurate and reliable simulations. Build. Environ. 2015, 91, 219–245. [Google Scholar] [CrossRef]
- Liu, J.; Niu, J. CFD simulation of the wind environment around an isolated high-rise building: An evaluation of SRANS, LES and DES models. Build. Environ. 2016, 96, 91–106. [Google Scholar] [CrossRef]
- Isola, P.; Zhu, J.-Y.; Zhou, T.; Efros, A.A. Image-to-image translation with conditional adversarial networks. In Proceedings of the IEEE Conference on Computer Vision and Pattern Recognition (CVPR), Honolulu, HI, USA, 21–26 July 2017; pp. 1125–1134. [Google Scholar]
- Ronneberger, O.; Fischer, P.; Brox, T. U-Net: Convolutional networks for biomedical image segmentation. LNCS 9351; Medical Image Computing and Computer-Assisted Intervention (MICCAI 2015). Springer: Cham, Switzerland, 2015; pp. 234–241. [Google Scholar]
- Pang, Y.; Lin, J.; Qin, T.; Chen, Z. Image-to-image translation: Methods and applications. IEEE Trans. Multimed. 2022, 24, 3859–3881. [Google Scholar] [CrossRef]
- Wang, T.-C.; Liu, M.-Y.; Zhu, J.-Y.; Tao, A.; Kautz, J.; Catanzaro, B. High-resolution image synthesis and semantic manipulation with conditional GANs. In Proceedings of the IEEE/CVF Conference on Computer Vision and Pattern Recognition, Salt Lake City, UT, USA, 18–23 June 2018; pp. 8798–8807. [Google Scholar]
- Kingma, D.P.; Ba, J.L. Adam: A method for stochastic optimization. In Proceedings of the 3rd International Conference on Learning Representations (ICLR), San Diego, CA, USA, 7–9 May 2015. [Google Scholar]
- Xu, X.; Luo, F.; Wang, W.; Hong, T.; Fu, X. Performance-based evaluation of courtyard design in China’s cold-winter hot-summer climate regions. Sustainability 2018, 10, 3950. [Google Scholar] [CrossRef]
- Shi, X.; Zhu, Y.; Duan, J.; Shao, R.; Wang, J. Assessment of pedestrian wind environment in urban planning design. Landsc. Urban Plan. 2015, 140, 17–28. [Google Scholar] [CrossRef]
- Kim, H.; Lee, K.; Kim, T. Investigation of pedestrian comfort with wind chill during winter. Sustainability 2018, 10, 274. [Google Scholar] [CrossRef]
- Du, Y.; Mak, C.M.; Tang, B.-S. Effects of building height and porosity on pedestrian level wind comfort in a high-density urban built environment. Build. Simul. 2018, 11, 1215–1228. [Google Scholar] [CrossRef]
- Wen, Q.; Liu, H.; Zhou, Q.; Guo, Q.; Wang, P.; Zhang, L. The impact of ground-floor elevation of school buildings on courtyard wind environment. Buildings 2024, 14, 1146. [Google Scholar] [CrossRef]
Figure 1.
Overall research framework of the proposed methodology.
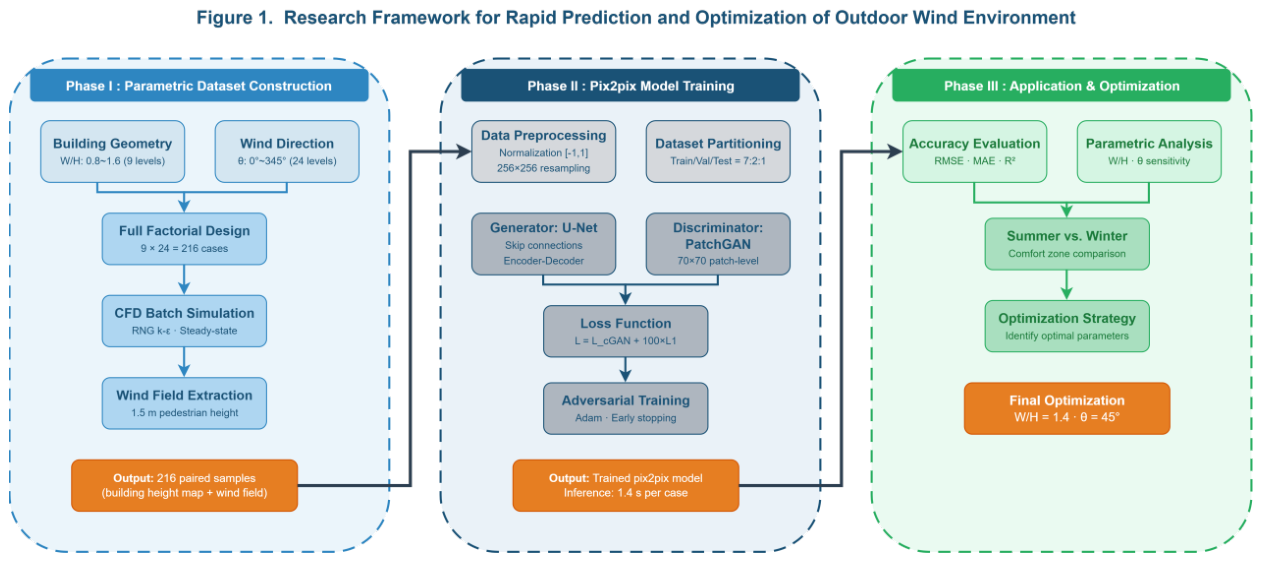
Figure 2.
Prototype simulation model.
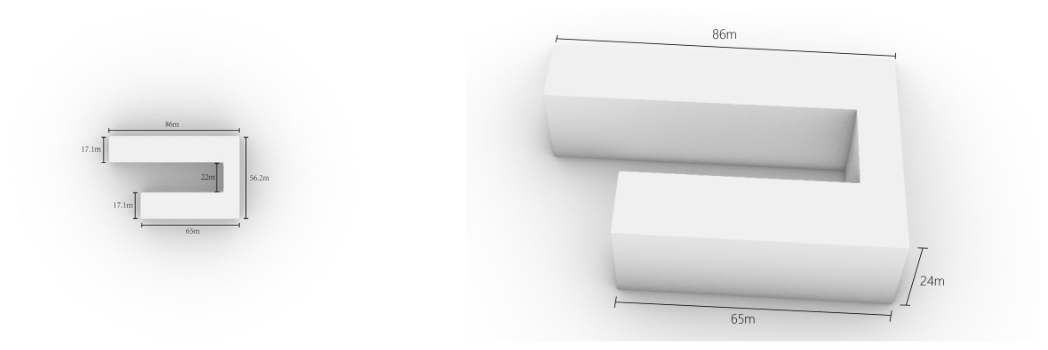
Figure 3.
Architecture of the pix2pix conditional generative adversarial network.
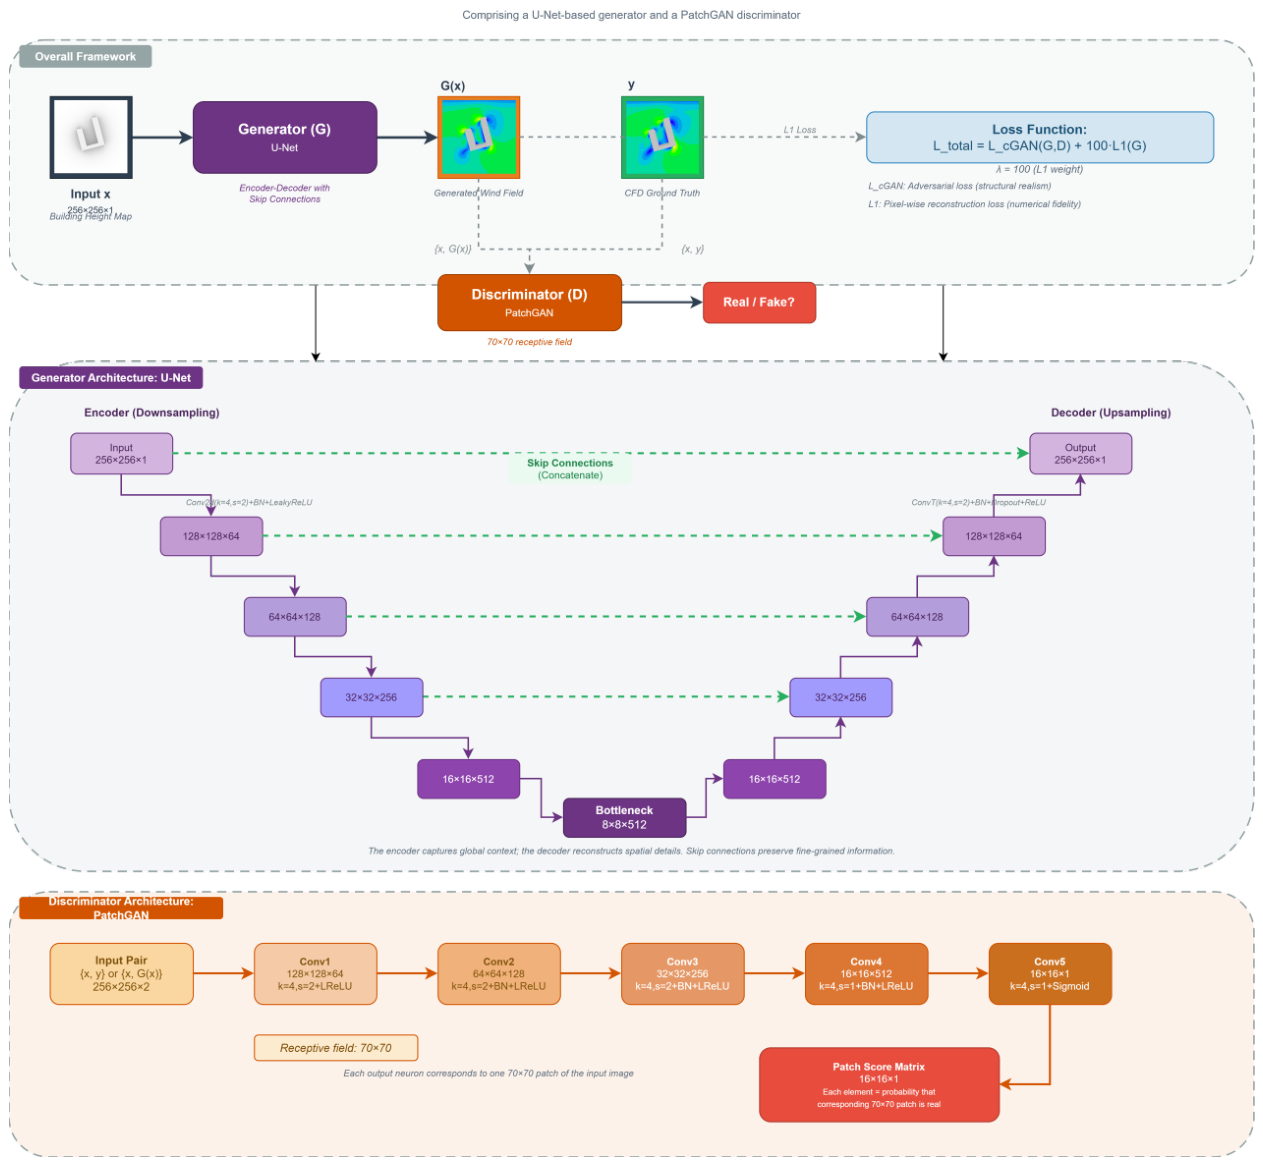
Figure 4.
Training loss convergence of the pix2pix model over 200 epochs.
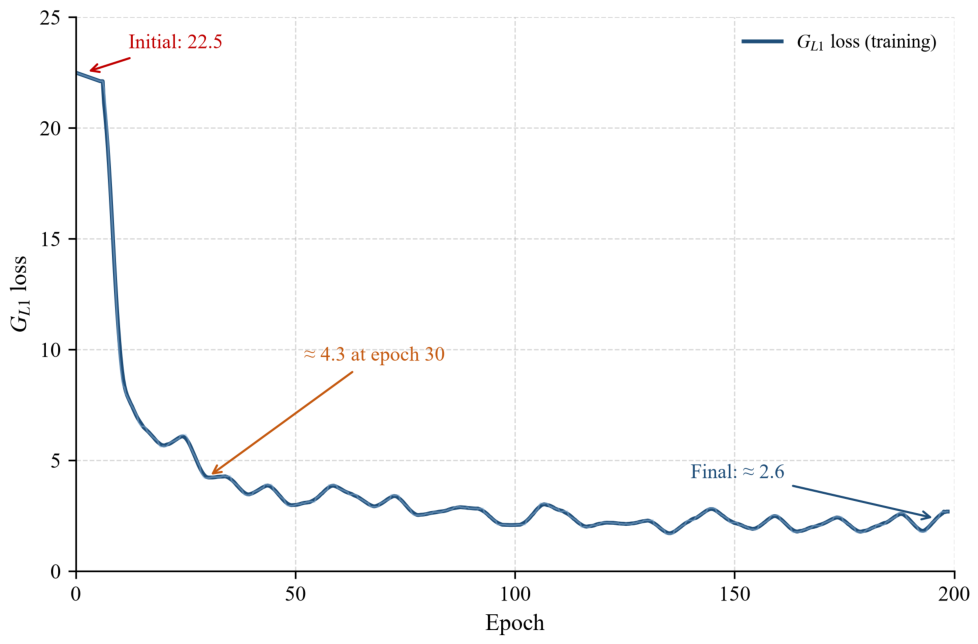
Figure 5.
Qualitative comparison of wind speed fields for three representative test cases. Each row corresponds to a single case, with columns from left to right: (a) input building geometry, (b) pix2pix-predicted wind speed, (c) high-fidelity CFD reference, and (d) absolute pointwise error (predicted − CFD). Wind speeds are shown in m/s.
Figure 5.
Qualitative comparison of wind speed fields for three representative test cases. Each row corresponds to a single case, with columns from left to right: (a) input building geometry, (b) pix2pix-predicted wind speed, (c) high-fidelity CFD reference, and (d) absolute pointwise error (predicted − CFD). Wind speeds are shown in m/s.
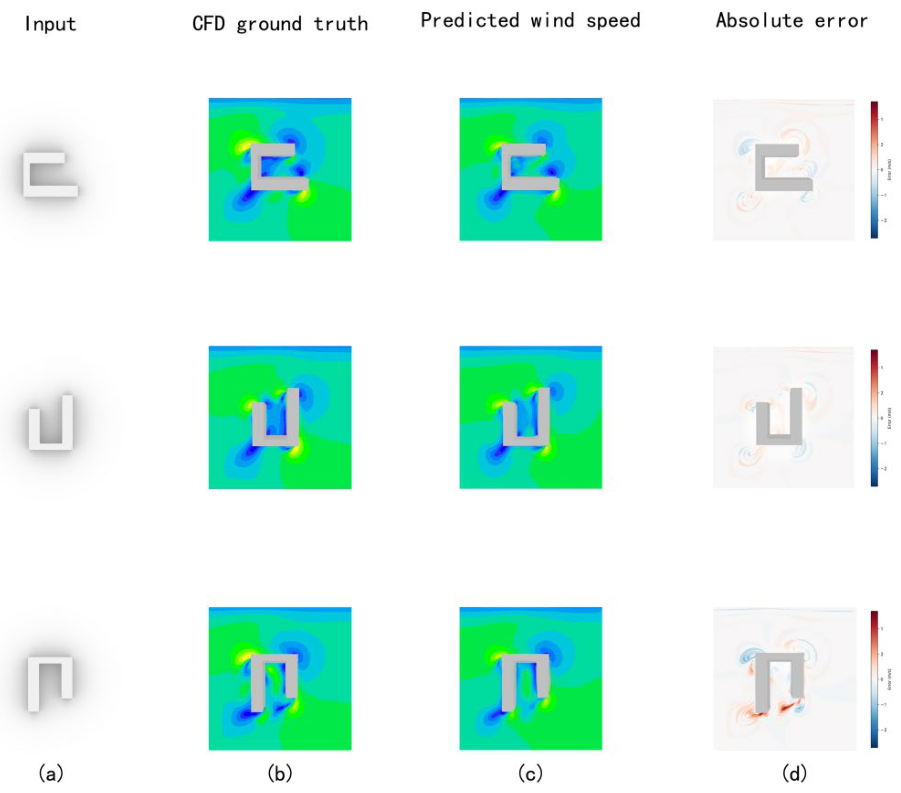
Figure 6.
Predicted 1.5 m pedestrian-height wind speed distribution for the summer baseline case.
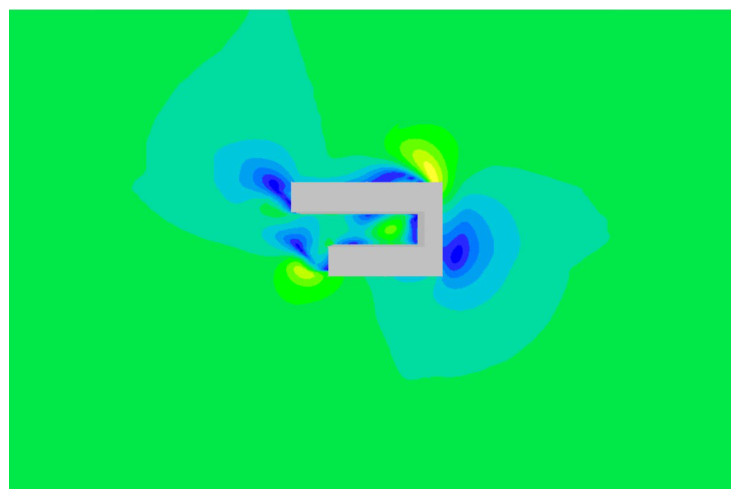
Figure 7.
Predicted 1.5 m pedestrian-height wind speed distribution for the winter baseline case.
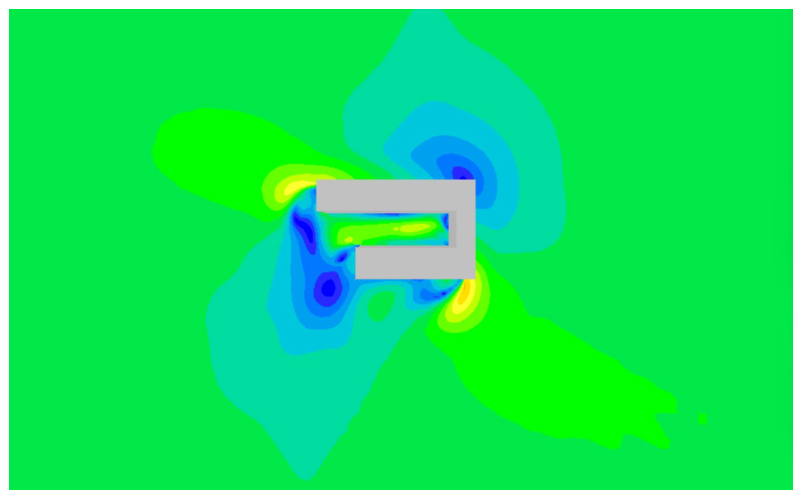
Figure 8.
Predicted 1.5 m pedestrian-height winter wind speed cloud maps for different courtyard width-to-height ratios: (a) 0.8, (b) 0.9, (c) 1.0, (d) 1.1, (e) 1.2, (f) 1.3, (g) 1.4, (h) 1.5, (i) 1.6. Wind speeds are given in m/s.
Figure 8.
Predicted 1.5 m pedestrian-height winter wind speed cloud maps for different courtyard width-to-height ratios: (a) 0.8, (b) 0.9, (c) 1.0, (d) 1.1, (e) 1.2, (f) 1.3, (g) 1.4, (h) 1.5, (i) 1.6. Wind speeds are given in m/s.
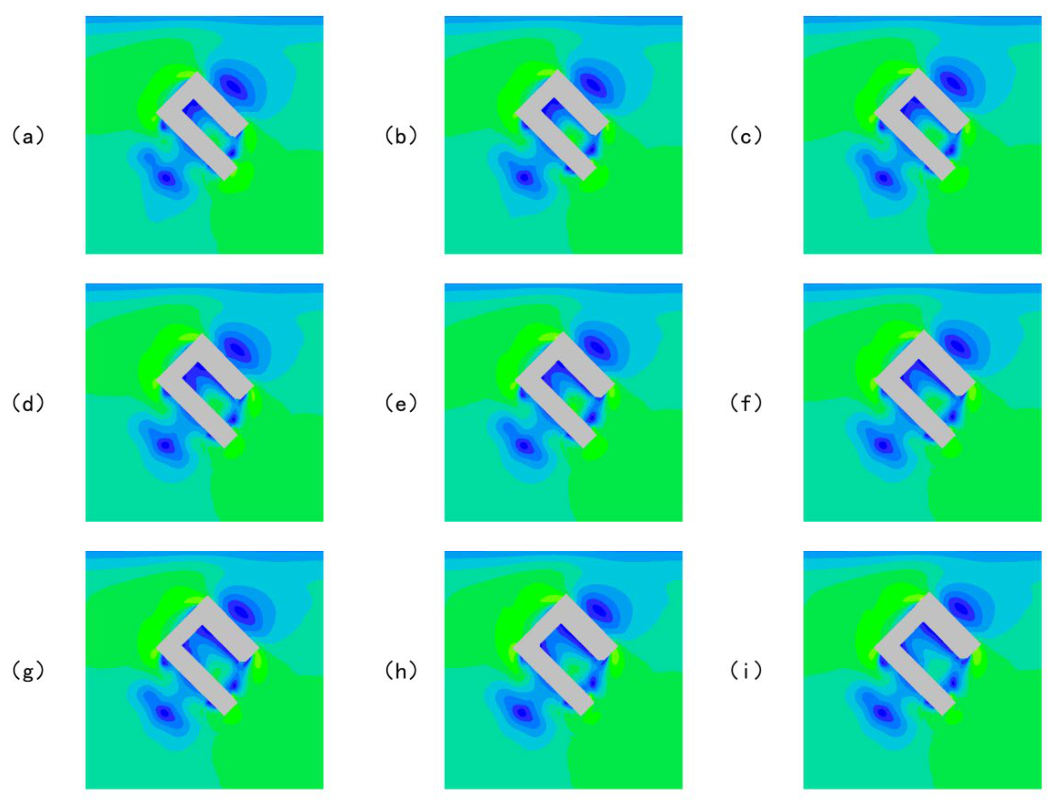
Figure 9.
Predicted 1.5 m pedestrian-height winter wind speed cloud maps for the prototype courtyard building under different wind incidence angles: (a) 0°, (b) 15°, (c) 30°, (d) 45°, (e) 60°, (f) 75°. Wind speeds are given in m/s.
Figure 9.
Predicted 1.5 m pedestrian-height winter wind speed cloud maps for the prototype courtyard building under different wind incidence angles: (a) 0°, (b) 15°, (c) 30°, (d) 45°, (e) 60°, (f) 75°. Wind speeds are given in m/s.
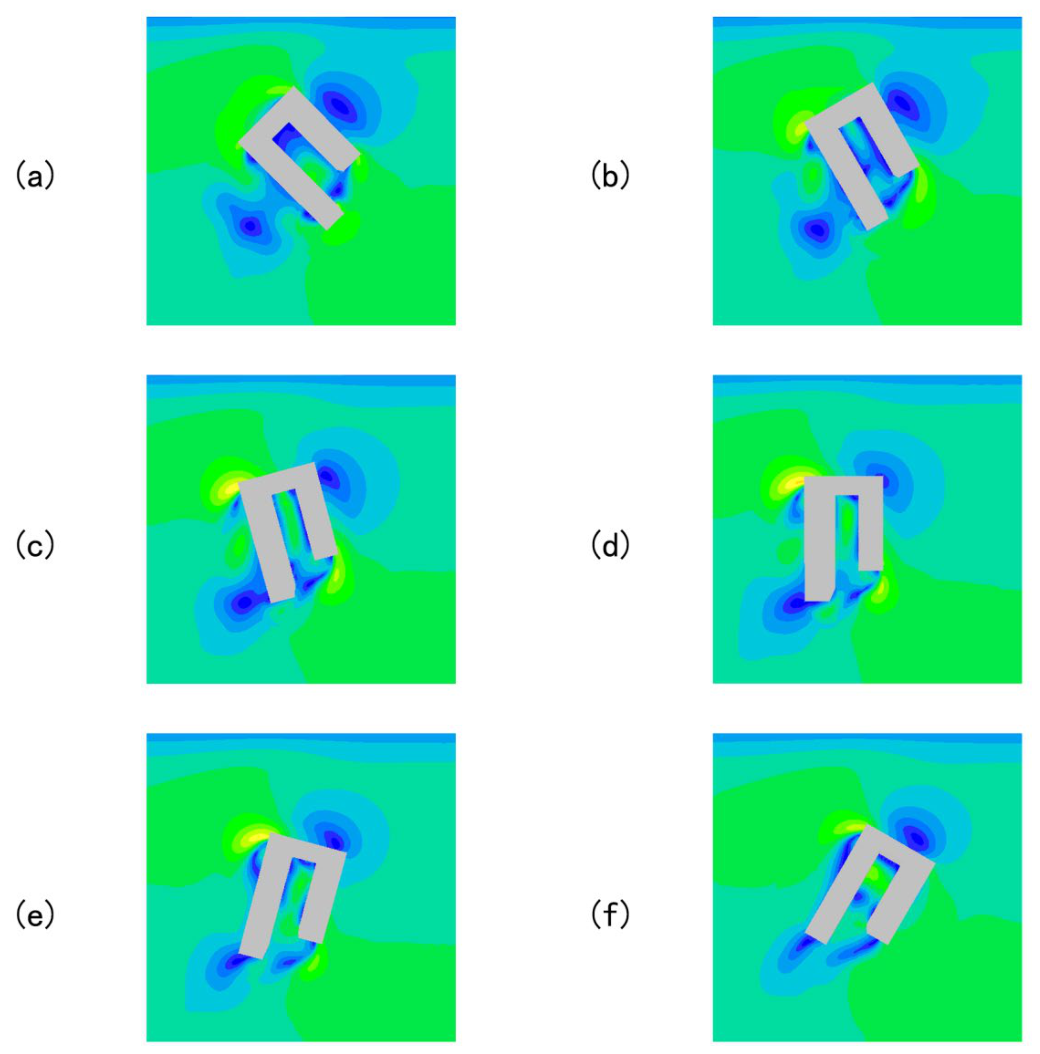

Table 1.
Survey summary of courtyard-style buildings at Hubei University of Technology.
| number | direction | Building Floor | Building Width | ||||
| ≤5 | 6–7 | ≥8 | 30–39 m | 40–49 m | ≥50 m | ||
| 1 | North | 1 | 1 | — | — | 2 | — |
| 2 | West | 1 | 3 | 2 | — | — | 6 |
| 3 | South | 2 | 2 | — | — | — | 4 |
| 4 | East | 2 | — | — | — | 1 | 1 |
| Total | 6 | 6 | 2 | 0 | 3 | 11 | |
Table 2.
Quantitative evaluation metrics on the test set.
| Metric | Mean | Median | Q1 | Q3 | IQR |
| RMSE (m/s) | 0.437 | 0.423 | 0.387 | 0.47 | 0.084 |
| MAE (m/s) | 0.147 | 0.144 | 0.123 | 0.157 | 0.033 |
| R² | 0.712 | 0.735 | 0.677 | 0.764 | 0.087 |
Table 3.
Pedestrian-level wind environment statistics for the summer baseline case, extracted from the pix2pix-predicted wind speed map.
Table 3.
Pedestrian-level wind environment statistics for the summer baseline case, extracted from the pix2pix-predicted wind speed map.
| Statistic | Value |
| Domain-averaged outdoor wind speed | 2.47 m/s |
| Maximum outdoor wind speed | 3.68 m/s |
| Minimum outdoor wind speed | 0.30 m/s |
| Area proportion 1–3 m/s (comfort) | 98.40% |
| Area proportion < 1 m/s (stagnant) | 0.90% |
| Area proportion > 5 m/s (uncomfortable) | 0.00% |
Table 4.
Pedestrian-level wind environment statistics for the winter baseline case, extracted from the pix2pix-predicted wind speed map.
Table 4.
Pedestrian-level wind environment statistics for the winter baseline case, extracted from the pix2pix-predicted wind speed map.
| Statistic | Value |
| Domain-averaged outdoor wind speed | 3.04 m/s |
| Maximum outdoor wind speed | 4.83 m/s |
| Minimum outdoor wind speed | 0.46 m/s |
| Area proportion 1–3 m/s (comfort) | 19.50% |
| Area proportion < 1 m/s (stagnant) | 0.30% |
| Area proportion > 5 m/s (uncomfortable) | 0.00% |
Table 5.
Pedestrian-level winter wind statistics for different courtyard width-to-height ratios.
| Case | Width-to-height ratio | Mean wind speed (m/s) | Max wind speed (m/s) | Min wind speed (m/s) | Area 1–3 m/s (%) | Area <1 m/s (%) |
| a | 0.8 | 2.99 | 3.93 | 0.62 | 13.0 | 0.5 |
| b | 0.9 | 2.99 | 4.42 | 0.62 | 12.9 | 0.5 |
| c | 1.0 | 2.99 | 4.03 | 0.62 | 13.2 | 0.4 |
| d | 1.1 | 2.98 | 3.93 | 0.62 | 13.7 | 0.4 |
| e | 1.2 | 2.98 | 4.48 | 0.62 | 13.9 | 0.4 |
| f | 1.3 | 2.98 | 4.52 | 0.62 | 14.0 | 0.4 |
| g | 1.4 | 2.98 | 4.35 | 0.62 | 14.6 | 0.4 |
| h | 1.5 | 2.98 | 4.33 | 0.62 | 14.4 | 0.5 |
| i | 1.6 | 2.98 | 4.48 | 0.62 | 14.3 | 0.5 |
Table 6.
Pedestrian-level winter wind statistics for the prototype courtyard building under different wind incidence angles.
Table 6.
Pedestrian-level winter wind statistics for the prototype courtyard building under different wind incidence angles.
| Case | Incidence angle | Mean wind speed (m/s) | Max wind speed (m/s) | Min wind speed (m/s) | Area 1–3 m/s (%) | Area <1 m/s (%) |
| a | 0° | 2.99 | 4.42 | 0.62 | 12.9 | 0.5 |
| b | 15° | 2.82 | 4.68 | 0.82 | 15.1 | 0.4 |
| c | 30° | 2.84 | 4.95 | 1.02 | 21.3 | 0.3 |
| d | 45° | 2.86 | 4.95 | 1.08 | 24.1 | 0.2 |
| e | 60° | 2.97 | 4.95 | 0.92 | 18.9 | 0.1 |
| f | 75° | 3.07 | 4.52 | 0.88 | 17.4 | 0.2 |
Disclaimer/Publisher’s Note: The statements, opinions and data contained in all publications are solely those of the individual author(s) and contributor(s) and not of MDPI and/or the editor(s). MDPI and/or the editor(s) disclaim responsibility for any injury to people or property resulting from any ideas, methods, instructions or products referred to in the content. |
© 2026 by the authors. Licensee MDPI, Basel, Switzerland. This article is an open access article distributed under the terms and conditions of the Creative Commons Attribution (CC BY) license (http://creativecommons.org/licenses/by/4.0/).
Copyright: This open access article is published under a Creative Commons CC BY 4.0 license, which permit the free download, distribution, and reuse, provided that the author and preprint are cited in any reuse.