

Submitted:
12 October 2026
Posted:
13 October 2026
You are already at the latest version
Abstract
Genome-wide association studies (GWAS) identify an association between a single nucleotide polymorphism (SNP) and a phenotype. The complex traits are often the result of the combined effect of multiple genetic variants, each with a small individual effect and these small effects may be missed due to stringent p-value thresholds in GWAS studies. Gene-based association tests combine the effects of multiple variants within a gene and provide more interpretable associations and enable researchers to detect associations that might be missed in single-SNP analyses. Gene-based tests increase statistical power by considering the cumulative effect of several variants in a gene, reducing the multiple testing burden and prioritizing variants based on their likelihood of contributing to the phenotype. The power of gene-based tests depends on the weights assigned to SNPs within a gene, and misspecification of these weights can lead to a reduction in power. Two commonly used weighting schemes in gene-based test are equal weight and minor allele frequency-based weights. The equal weighting assumption implies that all SNPs within the gene have an equal effect on the trait, while minor allele frequency (MAF)-based weights, such as inverse or beta distribution of MAF, upweight rare variants under the assumption that they are more likely to be deleterious. These weighting schemes do not account for the underlying biological function of SNPs, which, if incorporated, could improve the power of gene-based tests by prioritizing functionally relevant SNPs. In this study, we propose a novel gene-based test approach (H2-Gene) that uses SNP level heritability as weights estimated using multiple functional annotations. Extensive simulation studies at both the single-gene and GWAS levels demonstrated that the proposed method effectively controls the type I error rate and achieves higher power compared to equal and MAF-based weighting schemes. When applied to GWAS summary statistics for Bipolar Disorder, Schizophrenia and Attention Deficit Hyperactivity Disorder, H2-Gene identified more significant genes than equal or MAF-based weighting schemes.
Keywords:
GWAS
; gene-based test
; functional annotations
1. Introduction
Genome-wide association studies (GWAS) identify an association between a single nucleotide polymorphism (SNP) and a phenotype [1]. Although GWAS have identified numerous genetic loci associated with the complex trait, the biological mechanisms that explain these associations remain unclear [2], and a large proportion of heritability is attributed to SNPs that do not reach genome-wide significance thresholds at current sample size [3,4] . The standard limitation of GWAS is that they test only one variant at a time which limit the power to identify clinically or biologically meaningful genetic associations [5]. Complex traits often arise from the combined effect of multiple genetic variants, each with a small individual effect and these small effects may be missed due to stringent p-value thresholds used in GWAS . In addition, because many complex phenotypes are correlated or share the common genetic variants, jointly analyzing multiple phenotypes can increase statistical power and identify SNPs that may not be detected in the single trait analysis [6]. Gene-based association tests combine the effects of multiple variants within a gene and provide more interpretable associations than single SNP associations [7]. Gene-based tests increase statistical power by considering the cumulative effect of several variants in a gene, thereby reducing the multiple testing burden [8] and enabling the prioritization of genetic variants most likely to influence the phenotype [9]. Several gene-based tests have been developed to aggregate genetic information across all variants within a gene or region , including : Burden Test [10], Sequence Kernel Association Tests (SKAT) [9], Optimized SKAT (SKAT-O) [11] and Variable Weight Test for testing the effect of an Optimally Weighted combination of variants (VW-TOW) [12], and Meta-analysis of set-based multiple phenotype association tests based on GWAS summary statistics from different cohorts (Meta-Tow-S) [13].
In gene or region-based association testing, the power depends on the genetic architecture of the phenotype and the weighting scheme applied to individuals SNPs within a gene or region, such as equal or MAF-based weights [9,14]. However, the underlying genetic architecture of the complex trait is rarely known [15]. Equal weighting assumes that all variants within the gene have the same effect on the trait, which dilutes the signal from causal variants and thereby reduces statistical power. MAF-based weighting scheme assumes that rare variants contribute more to the phenotype than common variants [9], reflecting the expectation that , under evolutionary selection pressure, rare variants tend to have larger effect sizes [16]. Consequently, MAF-based weighting schemes are aimed to enhance statistical power by assigning higher weights to variants with lower allele frequencies. The power of gene-based tests is adversely affected when SNP weights are mis-specified [11] or in unbalanced case-control designs, in which the number of cases and controls differs substantially [17]. These weighting schemes do not account for the underlying biological functions of SNPs. Incorporating weights based on functional annotations could improve the power of gene-based tests by prioritizing SNPs that are more likely to be biologically relevant.
While early studies on the genetic basis of the complex traits focused on protein-coding regions, it is now evident that a substantial portion of the noncoding genome is functionally important and harbor genetic variants that influence disease risk [18]. Functional annotation of genetic variants or SNPs enhances biological interpretation by assigning them to specific functional categories, thereby providing insights into their potential functional role. While the impact of coding variants on disease is relatively well established, the contribution of non-coding variants is still under investigation [19]. Understanding the functional roles of genetic variants is essential for determining how they contribute to trait heritability. The heritability model specifies how the expected heritability contributed by SNPs varies across the genome [20]. Several studies suggest that heritability is not uniformly distributed across the genome but is enriched in specific functional categories, such as promoters, enhancers, and evolutionary conserved regions, highlighting the importance of functional annotations in the genetic architecture of complex traits [20,21,22]. A single SNP can have multiple functional roles such as being in a regulatory element, a conserved region, or a coding sequence, potentially influencing traits through overlapping biological mechanisms [22,23].
Previous studies have incorporated the functional roles of the SNPs into gene-based tests by grouping or weighting variants based on their assumed functional effects. One example the use of rare, non-synonymous exonic variants to test the association between genes and psychophysiological endophenotypes [24]. A similar strategy for incorporating functional information into gene-based tests involves methods such as S-PrediXcan [25] , TWAS [26] and Overall [27], which leverage eQTL variants to estimate genetically regulated gene expression and test its association with complex traits using GWAS summary statistics. Integrating multiple annotations capture diverse biological mechanisms and improves the ability to identify likely causal SNPs by enhancing the signal-to-noise ratio [28,29]. Furthermore, using annotation-informed weights or combining results across different annotations enables more precise modeling of gene-trait associations in complex traits [30]. In a study conducted by Li et al [31] incorporating functional variants from FAVOR database [32] resulted in substantially greater power than conventional variant set tests, while controlling type I error rates for both quantitative and dichotomous phenotypes.
In this study, we developed a novel gene-based test (H2-Gene) that weights SNPs according to their heritability estimated using multiple functional annotations. We systematically evaluated the performances of three gene-based tests - Burden, SKAT and SKAT-O across three different weighting schemes (equal, MAF and H2-Gene) using both simulations and real data analysis. Extensive simulation studies demonstrate that H2-Gene adequately controls the type I error rate while achieving higher power than both equal and MAF-based weighting schemes across all simulation settings. We applied H2-Gene to GWAS summary statistics of three psychiatric traits: Schizophrenia, Bipolar Disorder and Attention Deficit Hyperactivity Disorder and found that it identified more significant genes than equal and MAF-based weighting schemes.
2. Materials and Methods
Consider a set of k genetic variants in a genomic region, and Z be the vector of Z-scores of these variants. When individual level genotype and phenotype data are available, Z scores can be computed using linear or logistic regression depending on the type of phenotype. If Individual-level data are not available, Z-scores can be obtained from publicly available GWAS summary statistics. In the gene-based test, we are interested in testing the null hypothesis H0: none of the genetic variants in a gene is associated with the phenotype of interest against the alternate hypothesis, H1: at least one of the variants in a gene is associated with the phenotype. Under H0, we assume that , where R is k×k correlation matrix that captures the pairwise linkage disequilibrium (LD) among the variants in a gene and can be estimated from the sample data [26,33,34]. If genotype data is unavailable, the LD among the genetic variants can be estimated using the external reference panel (such as 1000 genome project [35]) with population matching GWAS sample. With the growing availability of GWAS summary statistics, there has been an increasing interest in gene-based tests that can be applied directly to summary statistics without the need for individual-level data, offering a powerful and computationally efficient way to detect gene-level associations. In this study, we compared three gene-based tests that can be applied on GWAS summary statistics: Burden Test (BT) [7], Sequence kernel Association Tests (SKAT) [6], Optimal Sequence Kernel Association Tests (SKAT-O) [8] with different weighting schemes.
Where, W = diag(w1,w2,…wk) is k × k diagonal matrix of pre-defined weights and 1k is a k × 1 vector of ones. We considered three different weighting schemes to evaluate the power and type I error rate of each method. Under equal, W is an identity matrix. In minor allele frequency-based weight, the weight depends on the minor allele frequency (MAF) and can be computed as so the rarer variants receive higher weights reflecting their presumed larger effect sizes. Under the null hypothesis, QBT follows a χ2−distribution with 1 degree of freedom; QSKAT follows a weighted sum of χ2-distributions with 1 degree of freedom and QSKAT−O follows a mixture of χ2distributions. The corresponding p-values can be calculated using the R package “mkatr” [36].
H2-Gene requires the heritability contribution of each SNP to the phenotype, which is estimated using multiple functional annotations. The following section provides an overview of per-SNP heritability and how it is estimation using GWAS summary statistics and functional annotations.
Let X denote the matrix of genotypes of size N × M, where column Xj contains the genotype for SNP j, and Y contains an N × 1vector of phenotypes, where N and M are the number of individuals and number of SNPs, respectively. For convenience, we assume that Y and Xj are standardized so that and Var(Xj) = Var(Y) = 1. We consider the linear model E(Y) = Xβ, where is the vector of effect sizes and βj is the effect size of SNP j. Since Xj and Y are standardized, the heritability contributed (uniquely) by SNP j is and the total heritability explained by M SNPs is . Although the linear regression model can directly estimate SNP effect sizes, it requires individual-level genotype and phenotype data, which are often difficult to obtain for privacy reasons. Furthermore, accurate estimation of effect sizes is complicated by the high dimensionality of genotype data, where the number of SNPs (M) is very large compared to the number of individuals. Linkage disequilibrium (LD) among SNPs further complicates the estimation of individual SNP effect sizes. Moreover, incorporating many functional annotations increases the model complexity and poses additional computational challenges. These challenges motivated the development of methods based on GWAS summary statistics.
Suppose GWAS summary statistics is available from N individuals and M SNPs, along with P functional annotations corresponding to those SNPs. We further assume access to an ancestrally matched reference panel, from which we can estimate , the squared correlation between SNPs j and l (genotypes coded additively). Under the polygenic model, expected χ2 statistics of SNP j is
Where N is the sample size, ‘a’ measures the contribution of confounding bias [37] and τP represents the per-SNP contribution of annotation category P to heritability. Equation 1 allows us to estimate τP via simple linear regression of χ2 statistics against l(j,P) for both quantitative and case-control traits. In the case of overlapping functional annotations, per-SNP heritability of SNP j is obtained by summing its contributions across all annotations . Mathematically, the heritability explained by SNP j can be written in the form of Equation 2.
Where ajk,k = 1,2,...P is the pre-specified functional annotation for SNP j. Given GWAS summary statistics and LD information, either from the sample or an external reference panel, we can estimate the annotation specific coefficients to l(j,P). This can be efficiently accomplished using stratified LD score regression (S-LDSC) [22]. Although S-LDSC provides robust estimates of functional enrichment, its annotation-based predictions of per-SNP heritability estimates may be imprecise when many annotations are included and may be sensitive to model misspecification. PolyFun improves the stability and robustness of annotation-informed per-SNP heritability estimates by reducing overfitting and sensitivity to model misspecification [38].
3. Simulation
We conducted a comprehensive simulation study to evaluate the performance of three gene-based tests: Burden, SKAT, and SKAT-O, across different weighting schemes. For our study, simulations were based on real genotype data from unrelated European individuals from 1000 Genomes Project Phase 3 [35] . To mimic a realistic representation of genes in terms of size and linkage disequilibrium (LD) structure, we considered 94 loci identified as risk regions in a genome-wide association study (GWAS) of breast cancer [39]. We used R package sim1000G [40] to simulate the genotypes of 10,000 individuals for each region. To evaluate the performance of H2-Gene, we conducted two different simulation studies. First, we considered a single gene to assess the type I error rate and power. Second, to mimic a more realistic genetic architecture of the trait, we extended the simulation to include 91 genes using real functional annotations and simulated GWAS summary statistics. The ADCY3 gene, located on chromosome 2, was randomly selected from the set of 91 genes for type I error rate and power calculations. The gene ADCY3 contained 1,762 SNPs with MAF ranging between 0.01 to 0.5. We simulated both continuous and case control phenotypes. The case control phenotype was simulated from the continuous phenotype using a liability threshold model based on specified case-control ratio.
We simulated continuous phenotype using the linear model Y = Xβ + ϵ where X is the matrix of standardized genotypes, , was selected to achieve the desired heritability level. To simulate an unbalanced case-control phenotype, we first generated a continuous phenotype for all individuals, then used liability threshold model to assign them in cases and controls. The individuals whose continuous values exceeded a predefined threshold (90%) were classified as cases, and the remaining individuals as controls. A total of eight functional annotations were considered, including seven binary annotations and a baseline annotation. For each functional annotation category, SNPs were randomly assigned to that category according to annotation specific pre-specified probability allowing individual SNP to belong to multiple functional annotations simultaneously. The total functional annotation score for each SNP was computed as the inner product of the annotation vector and the corresponding pre-specified annotation-specific weights (τ).
To evaluate type I error rate, the phenotypes were generated following N (0,1). To evaluate power, 10 SNPs with the highest total functional annotation scores were designated as causal variants. The effect sizes of causal variants were generated under different genetic architectures. Under the first genetic architecture, the variance of the effect size is proportional to MAF reflecting the frequency dependent genetic architecture [41], where effect sizes were generated following βj∼N(0,1/(pj (1 − pj)) . Where pj is the minor allele frequency of the SNP j. Under the second genetic architecture, the effect sizes of causal variants were drawn from a normal distribution with mean zero and variance equal to the per-SNP heritability derived from functional annotations [22]. Under the third genetic architecture, the effect sizes were drawn independently of both MAF and per-SNP heritability. The type I error rate and power were computed using a single gene under the first and second genetic architectures. The power was calculated using 100 replications, whereas type I error rate was evaluated based on 10,000 replications.
Additionally, we generated GWAS summary statistics under the third genetic architecture using 91 non-overlapping genes following Fachal, L., et al [39] . The total trait heritability was distributed equally among 46 causal genes such that , and within each causal gene 5% of the SNPs were designated as causal based on their total functional annotation scores. Let C denotes the number of causal variants in the gene. For each of the selected causal variants, the effect sizes were generated from . Finally, the residuals (ϵ) were generated from . Details of these gene regions, including the number of SNPs in each gene, are provided in Supplementary Table S1. The final analysis included 209,473 SNPs, with the number of SNPs per gene ranging from 1,069 to 6,349.
Across all 91 gene regions, the proportion of rare variants, defined as SNPs with 0.01< MAF < 0.05, ranged from 24.48% and 60.79%. The details of the ten functional annotations used in the simulation are provided in Supplementary Table S2. These annotations were sampled from 72 binary annotations from 1000 Genomes Phase 3 baseline LD version 2.2 [42]. The number of SNPs across functional annotations range from 5,002 (2.38%) to 87,110 (41.59%), with the proportion of rare variants range between 34.90% and 41.22%. The annotation weights were drawn from N (0, 0.012). We simulated GWAS summary statistics using two separate MAF ranges: 0.01–0.50 (all variants) and 0.05–0.50 (common variants only). For each heritability level, we simulated 200 datasets, calculated GWAS summary statistics and per-SNP heritability, and subsequently performed gene-bases tests. In each simulation, we applied a Bonferroni-corrected significance threshold of α = 0.05/91 to control the family-wise error rate across all tested genes.
We compared the performances of three gene-based tests under different weighting schemes in terms of power and false discovery rate. The power was defined as the proportion of causal genes correctly identified as significant, whereas the false discovery rate (FDR) was defined as the proportion of significant genes that were non-causal. Following mathematical framework was used to evaluate performance across simulations.. Let R be the total number of simulations and G be the number of causal genes. In each replicate r, let Sr denote the number of causal genes declared significant, Dr denote the total number of genes declared significant (including both causal and non-causal) and Fr denote the number of non-causal genes falsely declared significant. Then, the empirical power and false discovery rate (FDR) are defined as follows:
4. Results
4.1. Simulation Results
4.1.1. Type I Error Rate
The type I error rates of three gene-based tests (Burden, SKAT, and SKAT-O) were assessed across three weighting schemes: Equal, MAF, and H2-Gene. The empirical type I error rates were evaluated based on 10,000 simulations with phenotype generated from a standard normal distribution N(0,1). Based on 10,000 replications, the 95% confidence interval for significance level 0.05 and 0.01 were (0.0457,0.0543) and (0.0080,0.0120) respectively. Table 1 shows the type I error rates for continuous and unbalanced case control phenotypes. The type I error rates were within the 95% confidence interval for the given significance level indicating that all tests adequately controlled type I error.
4.1.2. Power Analysis
The power of three gene-based association tests (Burden, SKAT, and SKAT-O) were compared using three weighting schemes (Equal, MAF, and H2-Gene) across varying levels of trait heritability, with 10 causal variants within a gene. Figure 1 compares the power of different gene-based tests across various weighting schemes for a continuous phenotype. The power of all three methods increased as heritability increased. The Burden test exhibited relatively low power across all heritability levels, whereas SKAT and SKAT-O showed substantially higher power. When comparing the three weighting schemes, H2-Gene consistently yielded the highest power, followed by MAF and Equal weighting. The benefit of incorporating per-SNP heritability weight in the gene-based test is most evident for SKAT and SKAT-O whereas, Burden test showed only modest differences in the power across various weighting schemes.
Similarly, Figure 2 compares the power of three gene-based tests for unbalanced case-control phenotype at varying level of trait heritability. The overall pattern remained consistent across all heritability levels, with SKAT and SKAT-O outperforming the Burden test. The MAF and H2-Gene weighting schemes exhibited comparable power for the Burden test, whereas the H2-Gene weighting scheme consistently outperformed the Equal and MAF weighting schemes for both SKAT and SKAT-O across all heritability levels.
The power of the three gene-based tests was further evaluated under a simulation scenario in which the effect sizes of the causal variants were generated according to their per-SNP heritability values. The performance of the three weighting schemes was assessed using both continuous and unbalanced case-control phenotypes. Supplementary Figure S1 presents the power comparison of the three gene-based tests under different weighting schemes for the continuous phenotype, whereas supplementary Figure S2 presents the corresponding results for the unbalanced case-control phenotype. The H2-Gene weighting schemes outperformed the Equal and MAF weighting schemes in all methods across different heritability levels. Notably, the MAF weighting scheme consistently exhibited low power compared to both the Equal and H2-Gene weighting schemes across all methods and levels of trait heritability.
Additionally, , the power and false discovery rate of the three gene-based association tests were evaluated using simulated GWAS summary statistics incorporating real functional annotations. Per-SNP heritability estimates required for H2-Gene were subsequently computed using the Python package “PolyFun” [38] .
Supplementary Figure S3 presents the bar plots illustrating the performance of three gene-based tests: Burden, SKAT, and SKAT-O for continuous phenotype simulated using variants with minor allele frequency between 0.01 and 0.5 and real functional annotations. The plots compare the power and false discovery rate (FDR) of each method under three different weighting schemes (Equal, MAF, and H2-Gene) across increasing levels of total trait heritability. Importantly, across all heritability levels, the empirical false discovery rate is well controlled and remains below 5%. For the Burden test, when heritability was 0.2, the FDR under MAF-based weighting scheme was slightly higher than those observed with Equal and H2-Gene weighting schemes. As heritability increases, differences in FDR across different weighing schemes diminish, following the same pattern across all three gene-based tests. The power of all methods increases with heritability levels across all weighting schemes, indicating improved ability to detect true causal genes. The power of the Burden test is consistently lower compared to the SKAT and SKAT-O across heritability levels. If we compare weighting schemes, the power of tests using MAF-based weighting scheme are consistently lower than that under Equal and H2-Gene weighting schemes. The H2-Gene weighting scheme consistently yielded higher power, whereas the MAF-based weighting scheme showed lower power. This pattern was observed across all three methods, with H2-Gene achieving the greatest power in each case.
Supplementary Figure S4 present the bar diagram showing the power and FDR of three gene-based tests for an unbalanced case-control phenotype across different heritability levels. The phenotype was generated using genotypes with minor allele frequency between 0.01 and 0.5 across using real functional annotations. The FDR remains well controlled (below 5%) across all methods and weighting scheme. The burden test showed a higher false discovery rate than did SKAT and SKAT-O. Overall, SKAT and SKAT-O outperform the Burden test in terms of power, and the H2-Gene outperforms the Equal and MAF-based weighing schemes across all three methods. Supplementary Figures S5 and S6 present the power and false discovery rate (FDR) of three gene-based tests under three different weighting schemes, evaluated on continuous and unbalanced case-control phenotypes, respectively. The phenotypes were simulated with SNPs having minor allele frequencies between 0.05 and 0.5 and real functional annotations. The Burden test shows lower power than do SKAT and SKAT-O, with similar performance observed under Equal and MAF-based weighting schemes. Similarly, SKAT and SKAT-O exhibited only marginal differences in power between these two weighting schemes (Figure S5). Across all methods, H2-Gene yields the highest power. In the unbalanced case-control phenotype, the FDR remains well controlled (below 5%) across all settings, and H2-Gene consistently achieves the highest power among all three weighting schemes (Figure S6). These findings demonstrate that the H2-Gene consistently outperforms Equal and MAF weighting schemes in terms of power while effectively controlling false discovery rate (FDR).
4.2. Real Data Analysis
To evaluate the performance of the proposed method, three gene-based tests under different weighting schemes were applied to GWAS summary statistics from individuals of European ancestry. The analyses included three psychiatric disorders: bipolar disorder (BD), attention-deficit/hyperactivity disorder (ADHD), and schizophrenia (SCZ). These diseases are complex neurological disorders characterized by distinct and overlapping clinical and genetic features. The GWAS summary statistics of bipolar disorder includes 20,352 cases and 31,358 controls with follow up analysis of 822 variants with P < 1 × 10⁻⁴ in an additional 9,412 cases and 137,760 controls [43]. The GWAS summary statistics of Schizophrenia contains 11260 cases and 24542 controls [44] and ADHD GWAS summary data contains 38691 cases and 38691 controls [45]. The stratified Linkage Disequilibrium Score Regression (LDSC) [22] with baselineLD v2.2 model [42] was used to assess whether the functional categories are significantly enriched for trait heritability. Figure 3 displays two bar plots illustrating the proportion of heritability explained by each functional category, along with the corresponding heritability enrichment for those annotations for Schizophrenia. Figure 3(a) exhibits the proportion of heritability explained by each functional category along with error bars representing 95% confidence intervals. Categories such as H3K4me1_Trynka, Intron_UCSC, and H3K27ac_Hnisz account for a relatively larger proportion of heritability. Similarly, Figure 3(b) illustrates the corresponding heritability enrichment, calculated as the proportion of heritability attributed to SNPs in each annotation divided by the proportion of SNPs in that annotation, with error bars representing 95% confidence intervals. Notably, functional annotations such as PrimateAI_boosted. perc999, Human_Promoter_Villar_ExAC and Ancient_Sequence_Age_Human_Enhancer exhibited very high enrichment, suggesting these regions contribute disproportionately to the heritability of Schizophrenia.
Similarly, Figures S7 and S8 represent bar plots of proportion of heritability and the corresponding heritability enrichment across functional annotations, with error bars representing 95% confidence interval for bipolar disorder and ADHD, respectively. For Bipolar Disorder, categories such as Intron_UCSC, H3K9ac_peaks_Trynka_boosted, DHS_Trynka explained the largest proportion of heritability while PrimateAI_boosted. perc999 showed the strongest enrichment (Figure S7). For ADHD, the annotations including H3K4me1_Trynka, DFG_ENCODE, and EigenAll_boosted contributed the most to heritability, while annotations such as ReMM_boosted, GERP.RSsup4, ReMM, and CADD showed the highest heritability enrichment (Figure S8).
To test gene-trait associations, the genomic coordinates for each gene were obtained from the UCSC Genome Browser and used these coordinates for SNP-to-gene mapping. SNPs were assigned to genes if they were located within 20 kb upstream of the transcription start site or 20 kb downstream of its transcription end site. After excluding genes with no mapped SNPs, a total of 24880 genes for Schizophrenia, 25207 genes for ADHD and 25242 genes for bipolar disorder were included in the final association tests. Therefore, Bonferroni corrected significance levels for each phenotype are defined as 0.05 divided by number of genes tested. The LD structure of SNPs within a gene was obtained using European ancestry population from 1000G Phase 3 reference panel [35]. The performances of three gene-based tests: Burden, SKAT and SKAT-O were compared with three different weighting schemes: Equal weights, MAF weight and H2-Gene.
Figure 4 presents the Venn diagram of number of significant genes identified by three gene-based tests: Burden, SKAT and SKAT-O for Schizophrenia across three different weighting schemes. For the Burden test (Figure 4(a)) , H2-Gene identified 1075 significant genes, Equal weight identified 980 genes, and MAF-based weighting scheme identified 468 genes. Among these significant genes, 326 genes were shared by all three weighting schemes. Additionally, the Equal, MAF, and H2-Gene weighting schemes detected 185, 40, and 376 unique significant genes, respectively. Similarly, for SKAT (Figure 4(b)) MAF weighting scheme identified 209 significant genes, whereas equal weight and H2-Gene weighting scheme identified 692 and 739 genes, respectively. Out of these 739 genes identified by H2-Gene, 222 genes were unique. For SKAT-O equal weight, MAF-based and H2-Gene weighting schemes identified 1,249, 538, and 1381 significant genes respectively (Figure 4(c)). Across all three gene-based tests, the H2-Gene weighting scheme identified a greater number of significant genes than equal and MAF-based weighting schemes.
Similarly, Figure S9 displays Venn diagrams illustrating the number of significant genes identified by the three gene-based tests under three weighting schemes for bipolar disorder, while Figure S10 shows the corresponding results for ADHD. In both traits, the H2-Gene weighting scheme consistently identified the largest number of significant genes across all gene-based tests, demonstrating its improved ability to detect gene-trait associations compared to the Equal and MAF-based weighting schemes. In the Burden test (Figure S9(a)), H2-Gene identified 213 significant genes, including 120 unique to H2-Gene, while 46 genes were shared across all three weighting schemes. In SKAT (Figure S9(b)), although fewer genes were identified as significant, H2-Gene still detected 114 significant genes. In SKAT-O, H2-Gene identified 246 significant genes, with 49 shared by all the weighting schemes and 128 unique to H2-Gene weighting scheme (Figure S9(c)). Figure S10 presents Venn diagrams showing the overlap in significant genes identified by the three weighting schemes, Equal, MAF, and H2-Gene, for each test applied to ADHD. In the Burden test (Figure S10(a)), H2-Gene identified 109 significant genes, of which 61 were unique to H2-Gene weighting scheme, while 30 genes were shared by all three weighting schemes. In SKAT (Figure S10(b)), the H2-Gene weighting scheme identified 35 genes, including 15 unique genes and two shared genes by all three weighting schemes. In SKAT-O (Figure S10(c)), H2-Gene again outperformed the other two weighting schemes, identifying 119 significant genes, with 61 unique to the H2-Gene weighting scheme and 31 shared across all three weighting schemes. Overall, these results demonstrate that the H2-Gene weighting scheme substantially improves gene discovery across all three gene-based tests.
4.2.1. Enrichment Analysis
For the enrichment analysis, 438 significant genes uniquely identified by the H2-Gene weighting scheme in SKAT-O method for Schizophrenia were selected. Functional and pathway enrichment analyses were conducted using ShinyGO [46] covering three levels: biological processes, cellular components, and KEGG pathways. The pathway or process was considered significantly enriched if the false discovery rate was below 0.05. Figure 5 illustrates the significantly enriched cellular processes in Schizophrenia. The two most significantly enriched cellular processes were the MHC class II protein complex and MHC protein complex each containing 23 genes, indicating strong immune-related involvement in Schizophrenia. Several large-scale genetic studies, including genome-wide association studies (GWAS), have consistently identified the MHC region as one of the strongest genetic associations with Schizophrenia [47,48]. In addition to the MHC-related protein complexes, several other cellular components were significantly enriched including plasma membrane protein complex (40 genes), endosome membrane (36 genes), and late endosome membrane (19 genes).
Similarly, Figure S11 illustrates thirty significantly enriched biological processes of the genes associated with Schizophrenia. Most of the significantly enriched biological processes are closely related to the MHC regions. The top four most significantly enriched biological processes - peptide antigen assembly with MHC class II protein complex (15 genes), MHC class II protein complex assembly (15 genes), peptide antigen assembly with MHC protein complex, and MHC protein complex assembly (15 genes), are all central to the adaptive immune response. Moreover, Figure S12 demonstrates 17 significantly enriched KEGG pathways. Several enriched immune and neurodevelopmental pathways have prior evidence linking them to Schizophrenia. Notably, the Toll-like receptor signaling pathway (7 genes), and NF-κB pathways (6 genes), both significantly enriched in our analysis, have been reported to be associated with Schizophrenia [49,50,51,52].
5. Discussion
With the increasing availability of GWAS summary statistics, gene-based tests have gained popularity as an efficient approach for identifying trait-associated genes without requiring individual-level data. Incorporating functional annotation information for SNPs within a gene into these methods can further increase power by prioritizing functionally relevant variants.
In this paper, we developed a novel gene-based test, H2-Gene, that uses GWAS summary statistics and weight SNPs within a gene by their heritability contributions estimated using multiple functional annotations. Extensive simulations and the real data analyses demonstrated the effectiveness of theH2-Gene . Simulation studies based on a single gene demonstrated that H2-Gene can effectively control the type I error rate while achieving higher power. Additionally, simulations designed to mimic real genetic architectures, functional annotations, and GWAS summary statistics showed that H2-Gene effectively controlled the false discovery rate and exhibited higher statistical power. The proposed method H2-Gene demonstrated superior performance for both continuous and unbalanced case-control phenotypes. These results highlight the robustness of H2-Gene in diverse genetic architectures and phenotype models.
A major advantage of using H2-Gene is that it does not add any substantial computational burden in gene-based tests. Per-SNP heritability can be efficiently estimated genome-wide using stratified LD-score regression (S-LDSC) [21] or PolyFun [38] , with negligible additional computational burden for subsequent gene-based tests. One limitation of this method is that the accuracy of per-SNP heritability estimate depends on the ancestry matching, as mismatch in linkage disequilibrium (LD) structure can bias the estimated weights and adversely affect the test performance of H2-Gene.
Supplementary Materials
The following supporting information can be downloaded at the website of this paper posted on Preprints.org.
Author Contributions
M.S. formed the primary analytical work and drafted the manuscript. X.C. and L.Z. contributed to the analysis and manuscript revision. Q.S. supervised the study and contributed to the methodology and manuscript revision. All authors approved the final version of the manuscript.
Data Availability Statement
The data used in this study are publicly available for download.
Acknowledgments
This work was supported in part by a Finishing Fellowship from Michigan Technological University awarded to Megh Subedi in support of the completion of the doctoral degree.
References
- Wang, W.Y., et al., Genome-wide association studies: theoretical and practical concerns. Nat Rev Genet, 2005. 6(2): p. 109-18.
- Cano-Gamez, E. and G. Trynka, From GWAS to Function: Using Functional Genomics to Identify the Mechanisms Underlying Complex Diseases. Front Genet, 2020. 11: p. 424.
- Yang, J., et al., Common SNPs explain a large proportion of the heritability for human height. Nat Genet, 2010. 42(7): p. 565-9.
- Stahl, E.A., et al., Bayesian inference analyses of the polygenic architecture of rheumatoid arthritis. Nat Genet, 2012. 44(5): p. 483-9.
- Hebbring, S.J., The challenges, advantages and future of phenome-wide association studies. Immunology, 2014. 141(2): p. 157-65.
- Subedi, M., et al., Network construction using sparse Gaussian graphical model based on GWAS summary statistics. Sci Rep, 2025. 15(1): p. 38601.
- de Leeuw, C.A., et al., MAGMA: generalized gene-set analysis of GWAS data. PLoS Comput Biol, 2015. 11(4): p. e1004219.
- Sham, P.C. and S.M. Purcell, Statistical power and significance testing in large-scale genetic studies. Nat Rev Genet, 2014. 15(5): p. 335-46.
- Wu, M.C., et al., Rare-variant association testing for sequencing data with the sequence kernel association test. Am J Hum Genet, 2011. 89(1): p. 82-93.
- Li, B. and S.M. Leal, Methods for detecting associations with rare variants for common diseases: application to analysis of sequence data. Am J Hum Genet, 2008. 83(3): p. 311-21.
- Lee, S., M.C. Wu, and X. Lin, Optimal tests for rare variant effects in sequencing association studies. Biostatistics, 2012. 13(4): p. 762-75.
- Sha, Q., et al., Detecting association of rare and common variants by testing an optimally weighted combination of variants. Genet Epidemiol, 2012. 36(6): p. 561-71.
- Zhu, L., S. Zhang, and Q. Sha, Meta-analysis of set-based multiple phenotype association test based on GWAS summary statistics from different cohorts. Frontiers in Genetics, 2024. 15: p. 1359591.
- Lee, S., et al., Rare-variant association analysis: study designs and statistical tests. Am J Hum Genet, 2014. 95(1): p. 5-23.
- Zhang, J., et al., A fast and powerful eQTL weighted method to detect genes associated with complex trait using GWAS summary data. Genet Epidemiol, 2020. 44(6): p. 550-563.
- Gorlov, I.P., et al., Evolutionary evidence of the effect of rare variants on disease etiology. Clin Genet, 2011. 79(3): p. 199-206.
- Zhou, W., et al., Scalable generalized linear mixed model for region-based association tests in large biobanks and cohorts. Nat Genet, 2020. 52(6): p. 634-639.
- French, J. and S. Edwards, The role of noncoding variants in heritable disease. Trends in Genetics, 2020. 36(11): p. 880-891.
- Consortium, G.T., The GTEx Consortium atlas of genetic regulatory effects across human tissues. Science, 2020. 369(6509): p. 1318-1330.
- Speed, D., J. Holmes, and D.J. Balding, Evaluating and improving heritability models using summary statistics. Nat Genet, 2020. 52(4): p. 458-462.
- Gazal, S., et al., Linkage disequilibrium-dependent architecture of human complex traits shows action of negative selection. Nat Genet, 2017. 49(10): p. 1421-1427.
- Finucane, H.K., et al., Partitioning heritability by functional annotation using genome-wide association summary statistics. Nat Genet, 2015. 47(11): p. 1228-35.
- Kircher, M., et al., A general framework for estimating the relative pathogenicity of human genetic variants. Nat Genet, 2014. 46(3): p. 310-5.
- Vrieze, S.I., et al., Genetic associations of nonsynonymous exonic variants with psychophysiological endophenotypes. Psychophysiology, 2014. 51(12): p. 1300-8.
- Barbeira, A.N., et al., Exploring the phenotypic consequences of tissue specific gene expression variation inferred from GWAS summary statistics. Nat Commun, 2018. 9(1): p. 1825.
- Gusev, A., et al., Integrative approaches for large-scale transcriptome-wide association studies. Nat Genet, 2016. 48(3): p. 245-52.
- Cao, X., et al., Gene-based association tests using GWAS summary statistics and incorporating eQTL. Scientific Reports, 2022. 12(1): p. 3553.
- Schork, A.J., et al., All SNPs are not created equal: genome-wide association studies reveal a consistent pattern of enrichment among functionally annotated SNPs. PLoS Genet, 2013. 9(4): p. e1003449.
- Lu, Q., et al., Integrative Tissue-Specific Functional Annotations in the Human Genome Provide Novel Insights on Many Complex Traits and Improve Signal Prioritization in Genome Wide Association Studies. PLoS Genet, 2016. 12(4): p. e1005947.
- Quick, C., et al., Integrating comprehensive functional annotations to boost power and accuracy in gene-based association analysis. PLoS Genet, 2020. 16(12): p. e1009060.
- Li, X., et al., Dynamic incorporation of multiple in silico functional annotations empowers rare variant association analysis of large whole-genome sequencing studies at scale. Nat Genet, 2020. 52(9): p. 969-983.
- Zhou, H., et al., FAVOR: functional annotation of variants online resource and annotator for variation across the human genome. Nucleic Acids Res, 2023. 51(D1): p. D1300-D1311.
- Kwak, I.Y. and W. Pan, Adaptive gene- and pathway-trait association testing with GWAS summary statistics. Bioinformatics, 2016. 32(8): p. 1178-84.
- Conneely, K.N. and M. Boehnke, So many correlated tests, so little time! Rapid adjustment of P values for multiple correlated tests. Am J Hum Genet, 2007. 81(6): p. 1158-68.
- Genomes Project, C., et al., A global reference for human genetic variation. Nature, 2015. 526(7571): p. 68-74.
- Guo, B. and B. Wu, Statistical methods to detect novel genetic variants using publicly available GWAS summary data. Comput Biol Chem, 2018. 74: p. 76-79.
- Bulik-Sullivan, B.K., et al., LD Score regression distinguishes confounding from polygenicity in genome-wide association studies. Nat Genet, 2015. 47(3): p. 291-5.
- Weissbrod, O., et al., Functionally informed fine-mapping and polygenic localization of complex trait heritability. Nat Genet, 2020. 52(12): p. 1355-1363.
- Fachal, L., et al., Fine-mapping of 150 breast cancer risk regions identifies 191 likely target genes. Nat Genet, 2020. 52(1): p. 56-73.
- Dimitromanolakis, A., et al., sim1000G: a user-friendly genetic variant simulator in R for unrelated individuals and family-based designs. BMC Bioinformatics, 2019. 20(1): p. 26.
- Schoech, A.P., et al., Quantification of frequency-dependent genetic architectures in 25 UK Biobank traits reveals action of negative selection. Nat Commun, 2019. 10(1): p. 790.
- Gazal, S., S-LDSC reference files. 2017.
- Stahl, E.A., et al., Genome-wide association study identifies 30 loci associated with bipolar disorder. Nat Genet, 2019. 51(5): p. 793-803.
- Pardinas, A.F., et al., Common schizophrenia alleles are enriched in mutation-intolerant genes and in regions under strong background selection. Nat Genet, 2018. 50(3): p. 381-389.
- Demontis, D., et al., Genome-wide analyses of ADHD identify 27 risk loci, refine the genetic architecture and implicate several cognitive domains. Nat Genet, 2023. 55(2): p. 198-208.
- Ge, S.X., D. Jung, and R. Yao, ShinyGO: a graphical gene-set enrichment tool for animals and plants. Bioinformatics, 2020. 36(8): p. 2628-2629.
- Rothermundt, M., V. Arolt, and T.A. Bayer, Review of immunological and immunopathological findings in schizophrenia. Brain Behav Immun, 2001. 15(4): p. 319-39.
- Mokhtari, R. and H.M. Lachman, The Major Histocompatibility Complex (MHC) in Schizophrenia: A Review. J Clin Cell Immunol, 2016. 7(6).
- Weickert, T.W., et al., Toll-Like Receptor mRNA Levels in Schizophrenia: Association With Complement Factors and Cingulate Gyrus Cortical Thinning. Schizophr Bull, 2024. 50(2): p. 403-417.
- Murphy, C.E., A.K. Walker, and C.S. Weickert, Neuroinflammation in schizophrenia: the role of nuclear factor kappa B. Transl Psychiatry, 2021. 11(1): p. 528.
- Murphy, C.E., et al., Peripheral NF-kappaB dysregulation in people with schizophrenia drives inflammation: putative anti-inflammatory functions of NF-kappaB kinases. Transl Psychiatry, 2022. 12(1): p. 21.
- Garcia-Bueno, B., et al., Evidence of activation of the Toll-like receptor-4 proinflammatory pathway in patients with schizophrenia. J Psychiatry Neurosci, 2016. 41(3): p. E46-55.
Figure 1.
Comparison of the power of three gene-based tests using different weighting schemes across varying levels of trait heritability for a continuous phenotype. The effect sizes of the causal variants were generated as a function of minor allele frequencies (MAFs) of the SNPs.
Figure 1.
Comparison of the power of three gene-based tests using different weighting schemes across varying levels of trait heritability for a continuous phenotype. The effect sizes of the causal variants were generated as a function of minor allele frequencies (MAFs) of the SNPs.
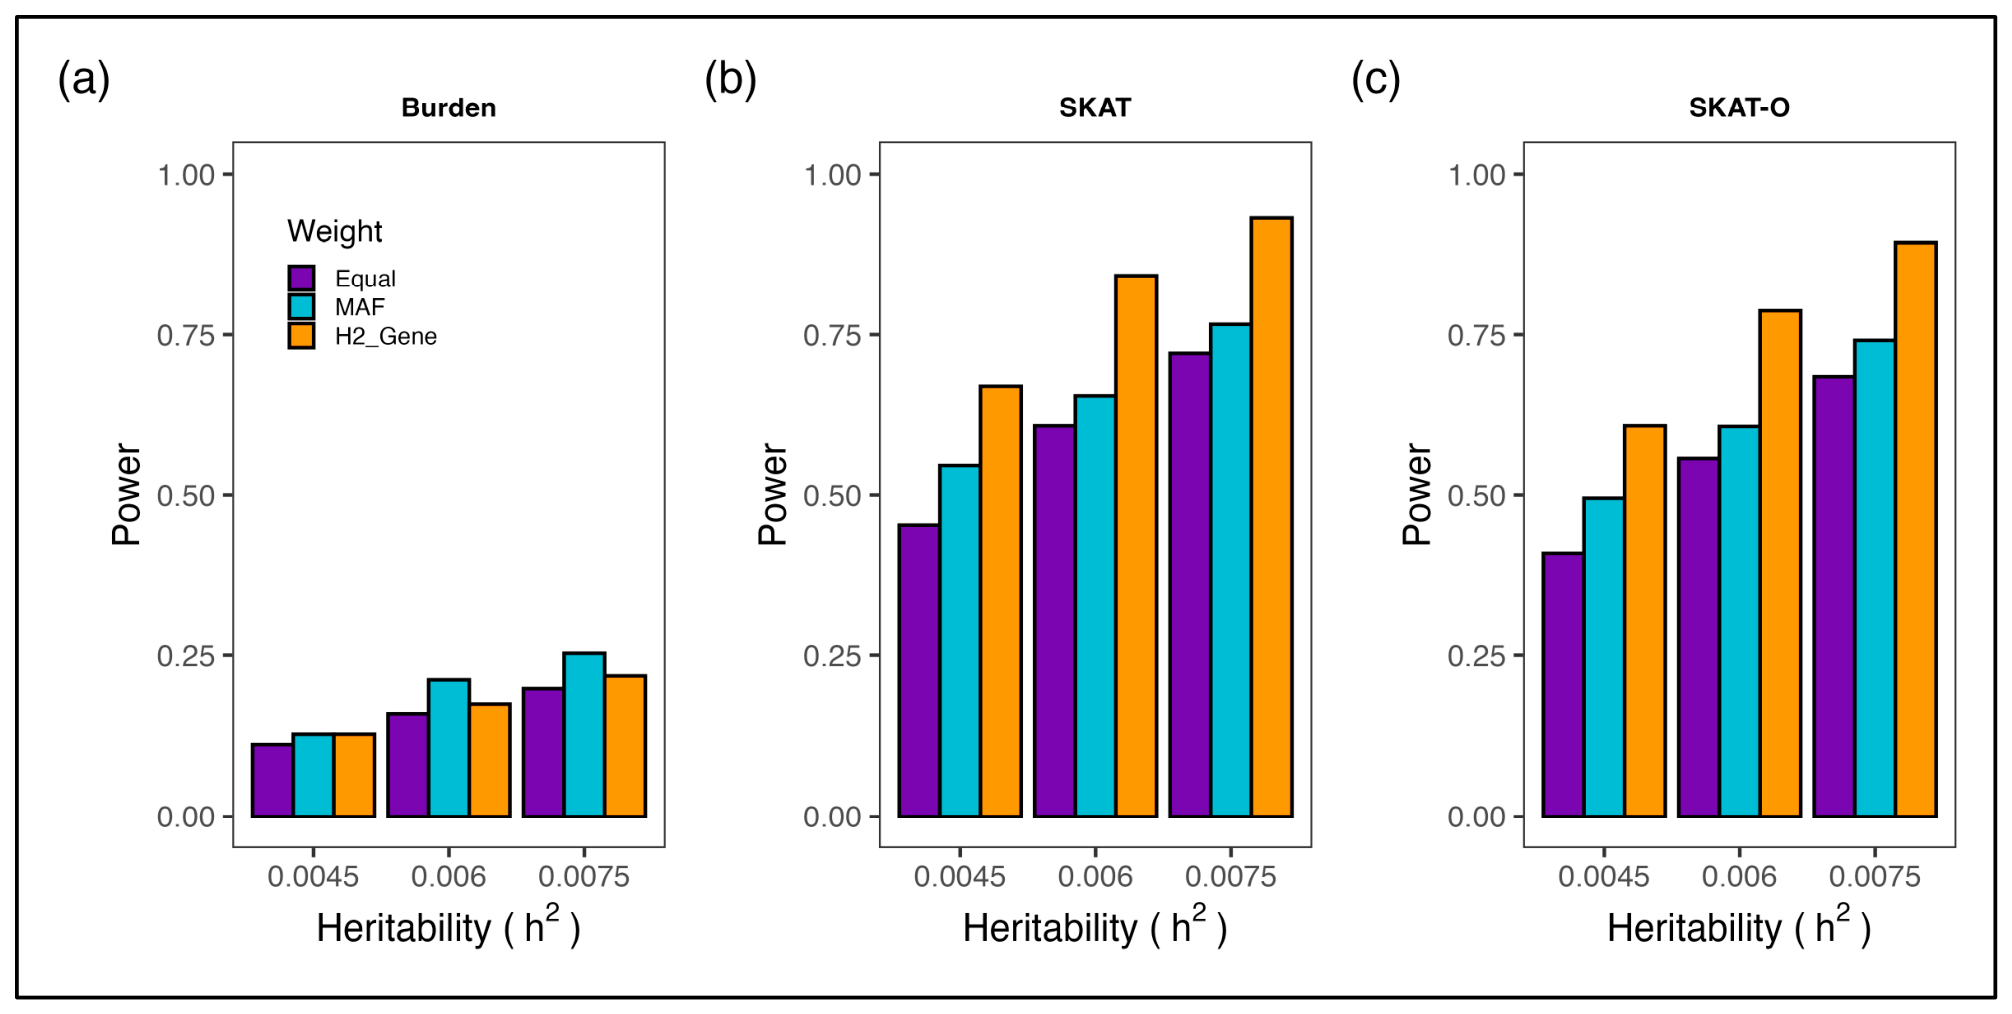
Figure 2.
Comparison of the power of three gene-based tests using different weighting schemes across varying levels of trait heritability for an unbalanced case-control phenotype. The effect sizes of the causal variants were generated as a function of minor allele frequencies (MAFs) of the SNPs.
Figure 2.
Comparison of the power of three gene-based tests using different weighting schemes across varying levels of trait heritability for an unbalanced case-control phenotype. The effect sizes of the causal variants were generated as a function of minor allele frequencies (MAFs) of the SNPs.
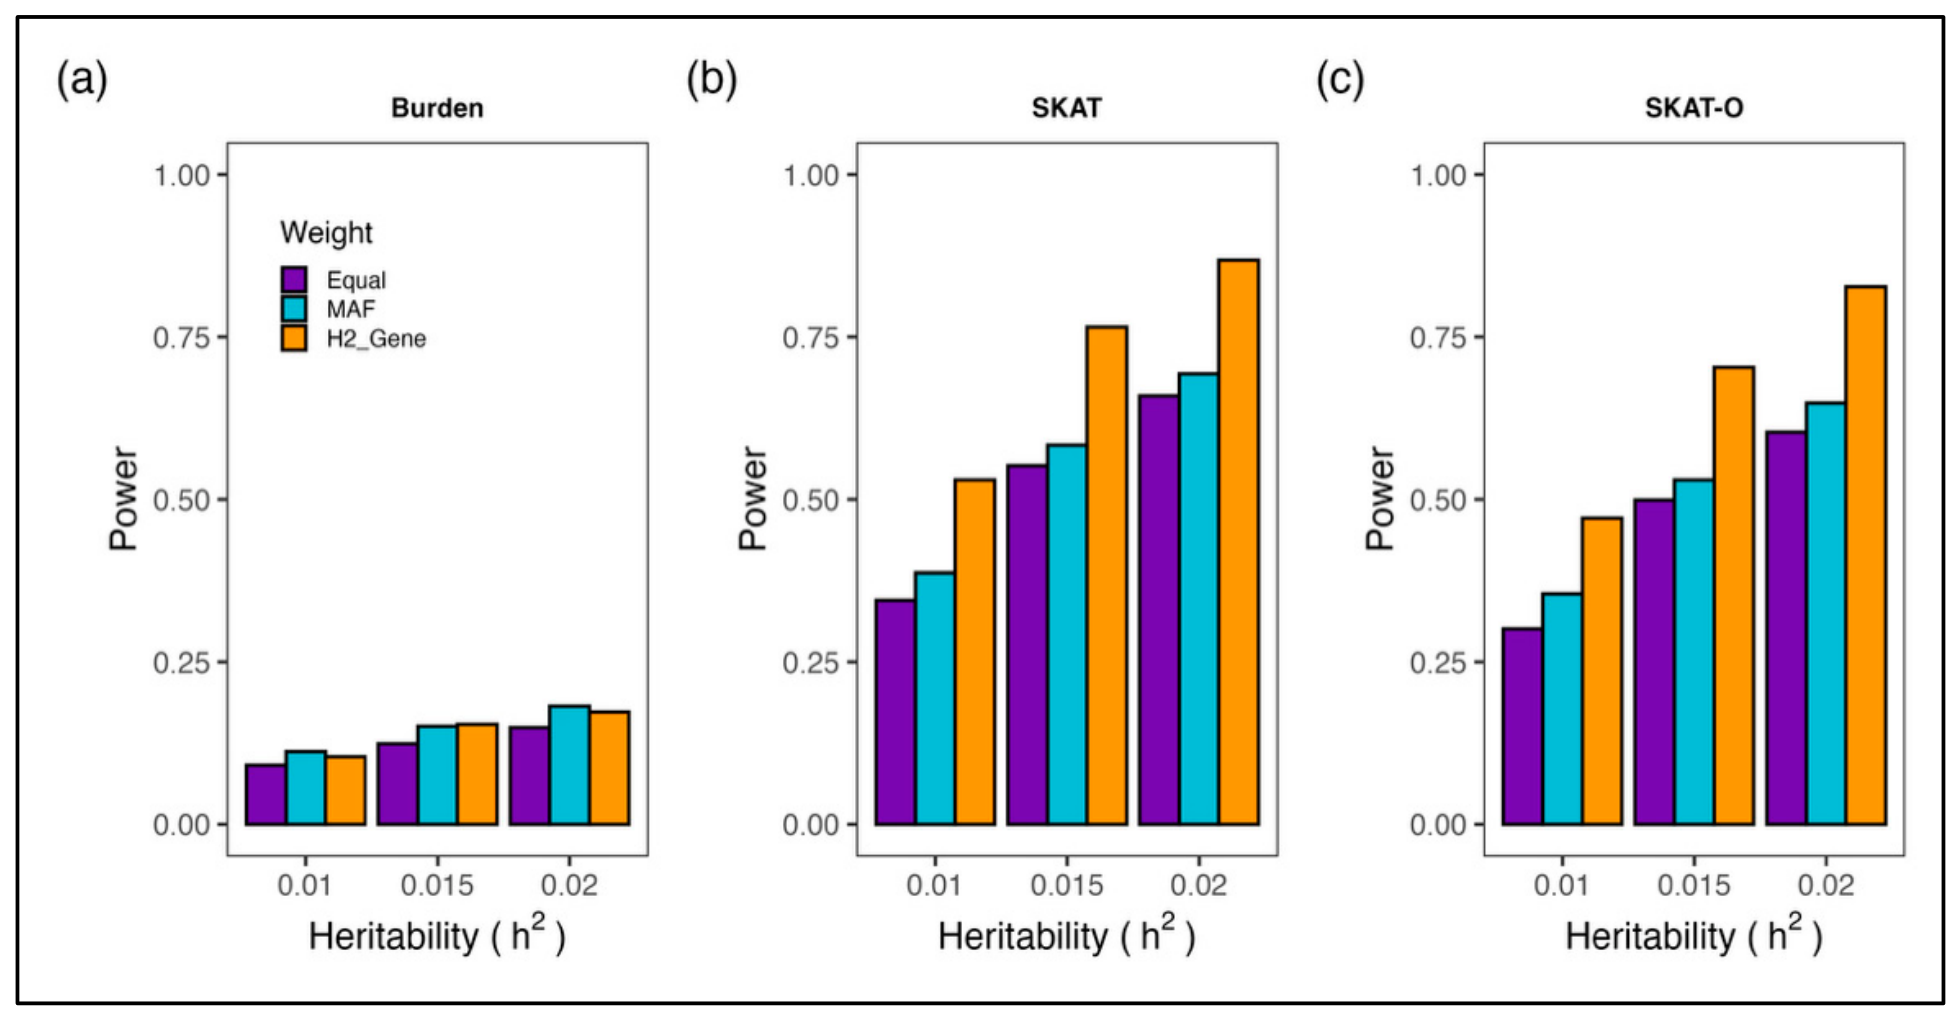
Figure 3.
Bar plots showing the proportion of heritability explained by functional categories (top) and corresponding heritability enrichment of those categories (bottom) for Schizophrenia. The functional annotations with enrichment p-values less than 0.05 are included in the graph. The star (*) beside the names of functional annotation indicates that these annotations are significant after Bonferroni correction based on the total number of tested categories.
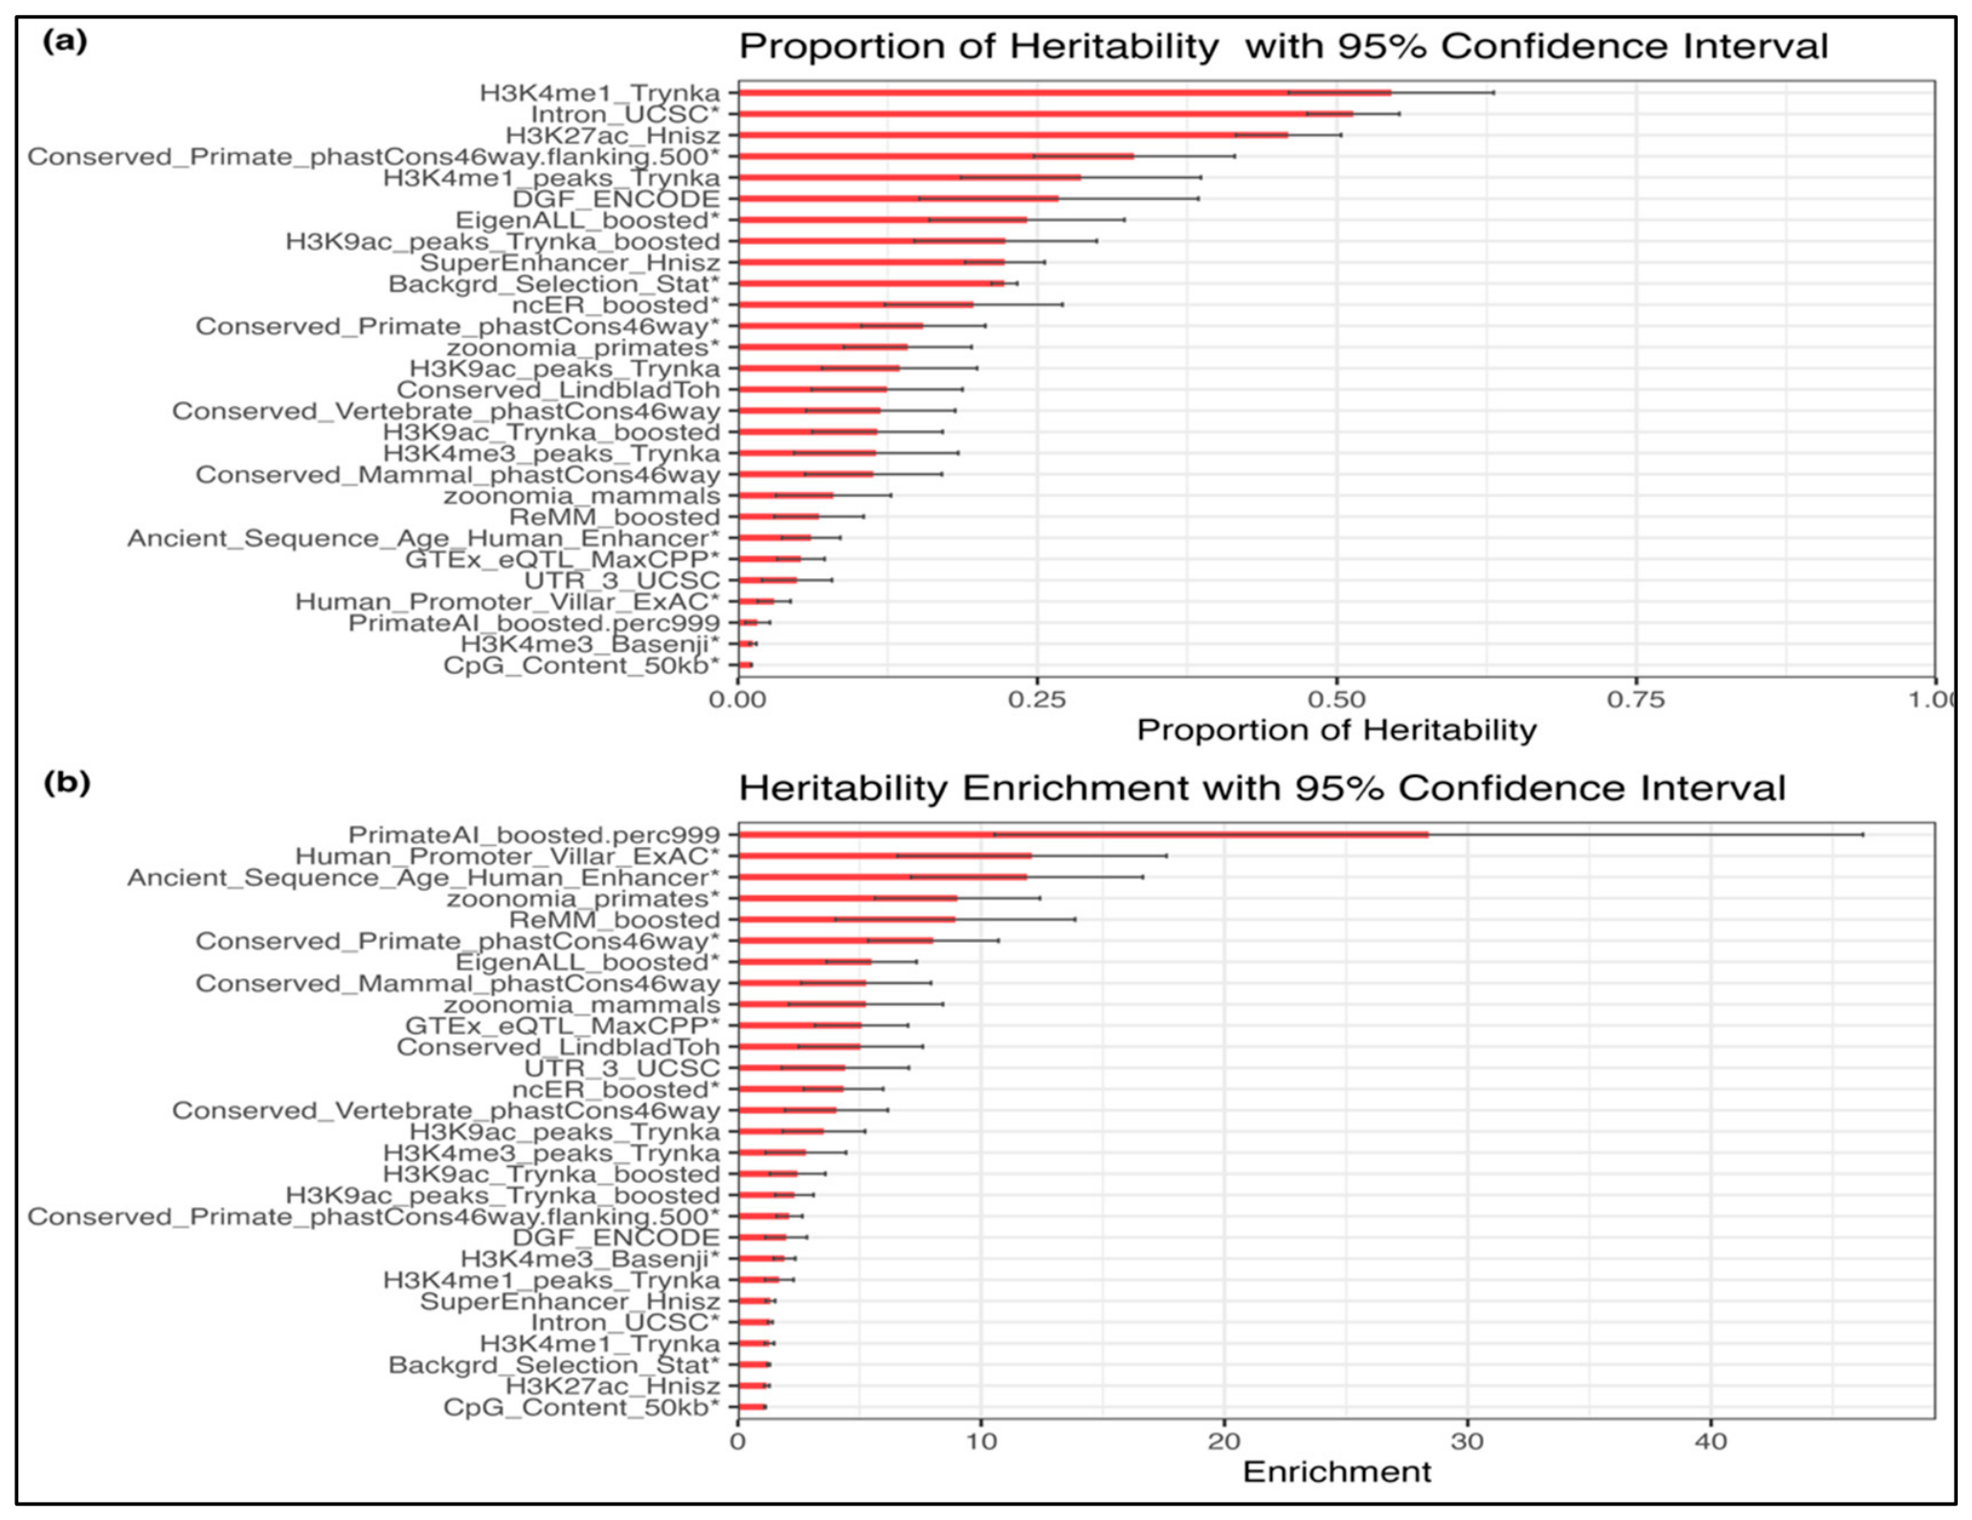
Figure 4.
The Venn diagram of the number of significant genes identified by three gene-based tests using three different weighting schemes: Equal weight, MAF-weight and H2-Gene. The number beside each weight type indicates the total number of significant genes identified by the method using corresponding weight.
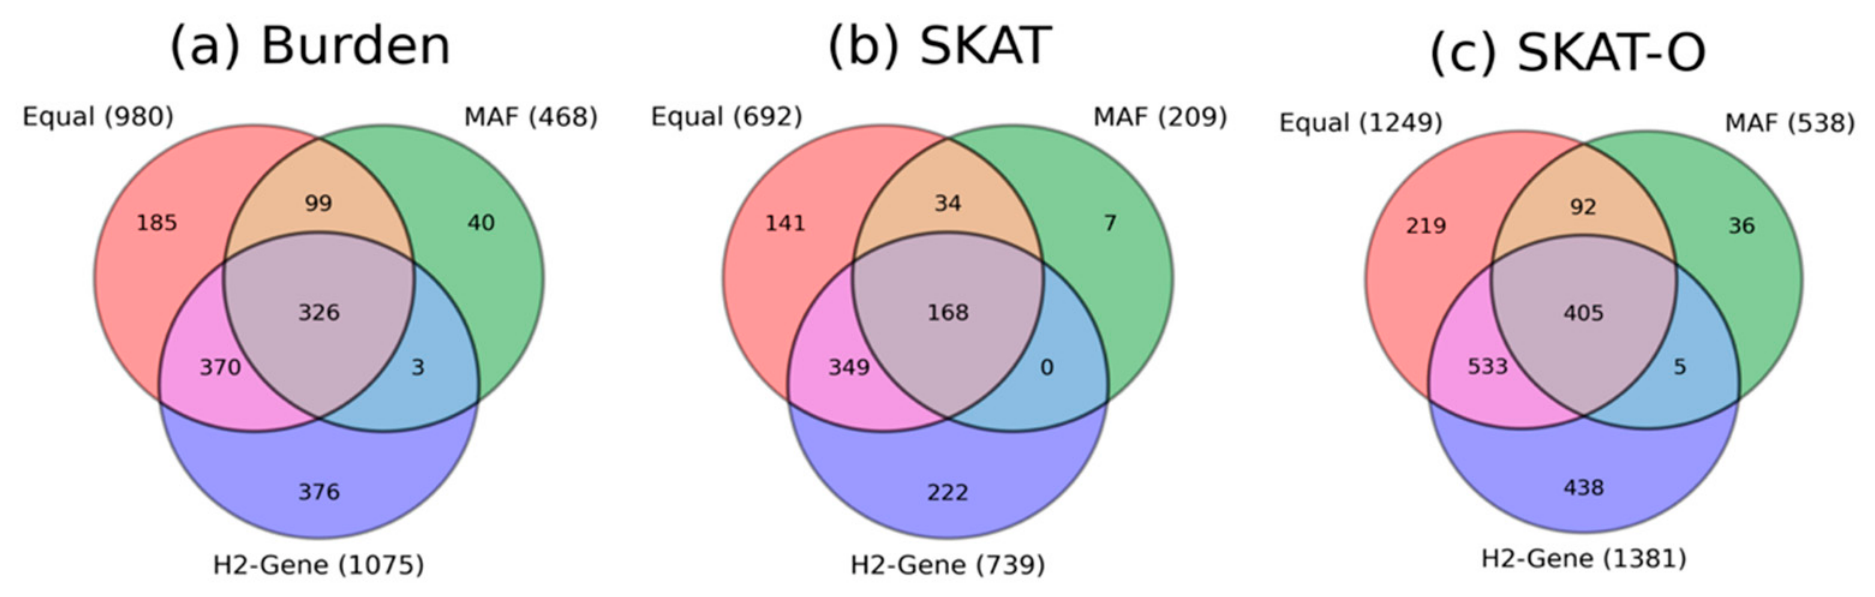
Figure 5.
Cellular process pathway enrichment of the Schizophrenia associated genes. The number beside each process represents the number of genes annotated to that pathway. The x-axis represents the negative log-transformed false discovery rate (–log (FDR)).
Figure 5.
Cellular process pathway enrichment of the Schizophrenia associated genes. The number beside each process represents the number of genes annotated to that pathway. The x-axis represents the negative log-transformed false discovery rate (–log (FDR)).
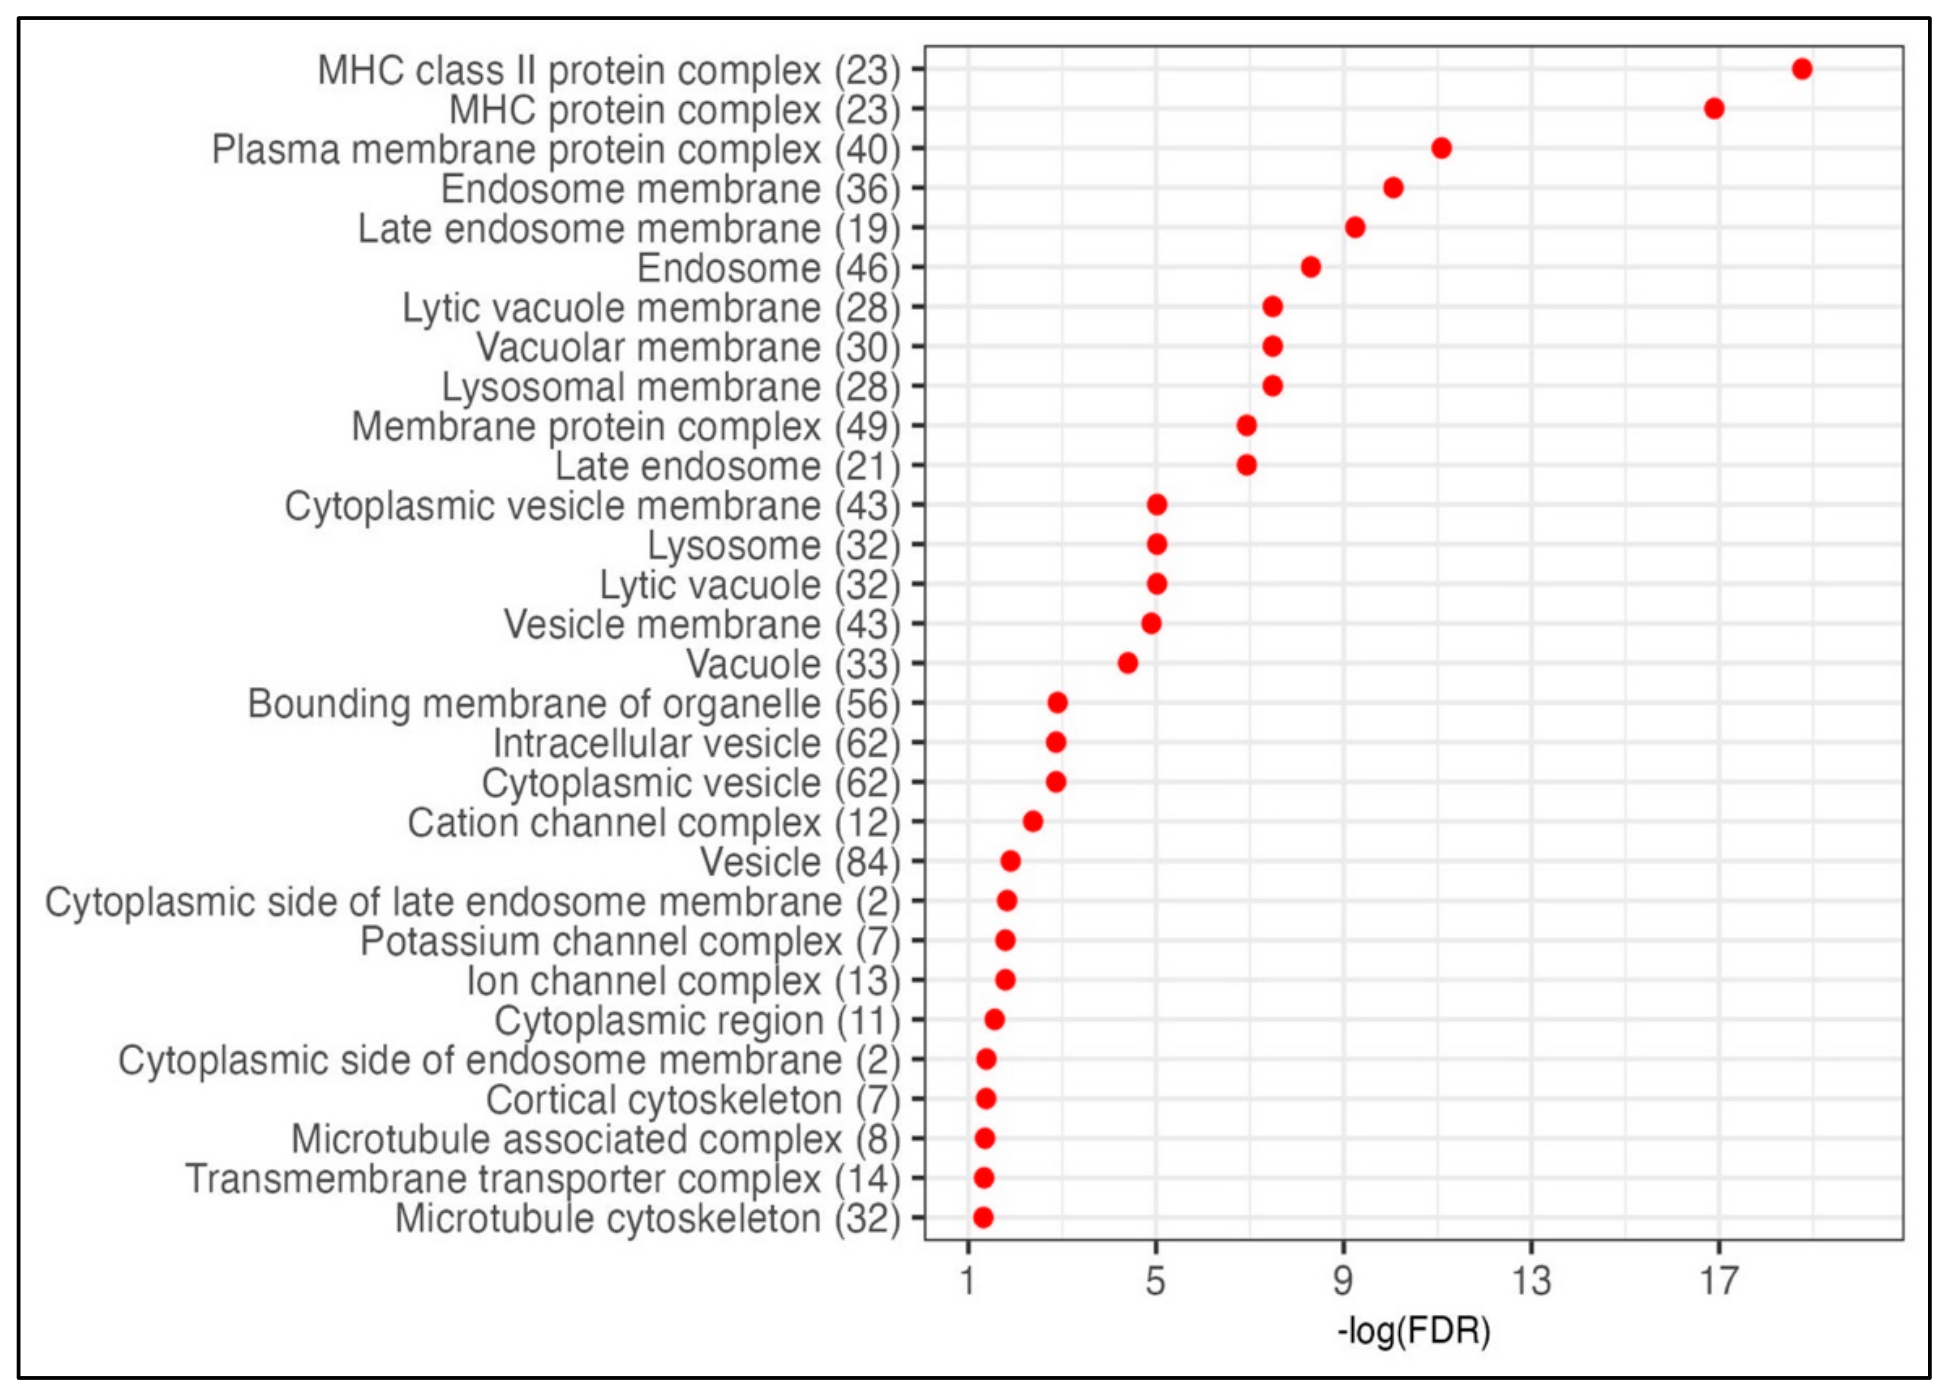

Table 1.
Estimated type I error rate of the three gene-based tests with different weighting schemes for continuous phenotype. Type I error rate was evaluated using 10,000 replicated samples at the significance level 0.05 and 0.01.
Table 1.
Estimated type I error rate of the three gene-based tests with different weighting schemes for continuous phenotype. Type I error rate was evaluated using 10,000 replicated samples at the significance level 0.05 and 0.01.
|
Type of Phenotype |
Tests |
Weight |
Significance Level | |
| 0.05 | 0.01 | |||
|
Continuous |
Burden |
Equal | 0.0464 | 0.0096 |
| MAF | 0.0477 | 0.0083 | ||
| H2-Gene | 0.0479 | 0.0098 | ||
|
SKAT |
Equal | 0.0473 | 0.0082 | |
| MAF | 0.0481 | 0.0089 | ||
| H2-Gene | 0.0464 | 0.0083 | ||
|
SKAT-O |
Equal | 0.0514 | 0.0092 | |
| MAF | 0.0495 | 0.0098 | ||
| H2-Gene | 0.0502 | 0.0091 | ||
|
Unbalanced case-control |
Burden |
Equal | 0.0498 | 0.0105 |
| MAF | 0.0479 | 0.0116 | ||
| H2-Gene | 0.0506 | 0.0104 | ||
|
SKAT |
Equal | 0.0476 | 0.0093 | |
| MAF | 0.0452 | 0.0082 | ||
| H2-Gene | 0.0465 | 0.0087 | ||
|
SKAT-O |
Equal | 0.0498 | 0.0110 | |
| MAF | 0.0471 | 0.0106 | ||
| H2-Gene | 0.0491 | 0.0112 | ||
Disclaimer/Publisher’s Note: The statements, opinions and data contained in all publications are solely those of the individual author(s) and contributor(s) and not of MDPI and/or the editor(s). MDPI and/or the editor(s) disclaim responsibility for any injury to people or property resulting from any ideas, methods, instructions or products referred to in the content. |
© 2026 by the authors. Licensee MDPI, Basel, Switzerland. This article is an open access article distributed under the terms and conditions of the Creative Commons Attribution (CC BY) license (http://creativecommons.org/licenses/by/4.0/).
Copyright: This open access article is published under a Creative Commons CC BY 4.0 license, which permit the free download, distribution, and reuse, provided that the author and preprint are cited in any reuse.