

Submitted:
09 October 2026
Posted:
12 October 2026
You are already at the latest version
Abstract
Under global warming, compound extreme events threaten ecosystems and socio-economic systems more than individual extremes. As a typical arid and semi-arid region, Northwest China has witnessed continuous increases in concurrent summer hot and drought conditions, threatening regional water security, agriculture and ecological stability. Based on observation and reanalysis data since 1961, this paper reviews recent progress on the definition, spatiotemporal variation and formation mechanisms of Summer Compound Hot-Drought Extreme Events (CHDEE) in Northwest China. Results show that the fusion scheme of daily drought and heatwave indicators, as well as the Copula joint probability framework, perform well in regional CHDEE detection. CHDEE frequency has increased significantly, with a pronounced acceleration since the late 1990s. Spatially, CHDEE show a pattern of high values in the west and low values in the east. Affected areas expand from the arid core to the northern margins and southern high-altitude regions. CHDEE are controlled by multi-scale factors: the westerly circulation, the East Asian summer monsoon and the thermal forcing of the Tibetan Plateau. The positive soil moisture–temperature feedback is the key amplification mechanism. Current studies still lack unified definitions, and the mechanisms over complex terrain remain unclear. Future work should strengthen multi-source data fusion and develop physics-informed AI prediction methods.
Keywords:
Northwest China
; summer
; compound hot-drought events
; spatiotemporal characteristics
; mechanisms
1. Introduction
Under global warming, extreme weather and extreme climate events have become more compound, frequent and intense. Compound extreme events involve multiple hazard factors that occur simultaneously or sequentially. Their impacts far exceed the sum of individual extreme events. They have become a key challenge for climate change adaptation and disaster mitigation [1]. The Sixth Assessment Report of the Intergovernmental Panel on Climate Change (IPCC) states that continued warming will further increase the frequency and intensity of compound events. This will bring greater climate risks to agricultural production, infrastructure and ecosystems [1,2].
Northwest China, located deep in the Eurasian continent, is China's largest arid and semi-arid region and one of the regions most sensitive to global climate change. This review covers its five provincial-level administrative regions—Shaanxi, Gansu, Qinghai, Ningxia and Xinjiang—within a domain of approximately 73°21′–108°46′ E and 32°11′–49°33′ N (Figure 1), consistent with the unified grid domain used across the cited literature. The domain spans arid, semi-arid and sub-humid climatic zones, with elevation ranging from −154 m at Ayding Lake in the Turpan Basin to more than 7000 m on the northern margin of the Tibetan Plateau. In recent decades, the region has warmed faster than the global average, and summer extreme high-temperature events have increased in both frequency and intensity [3,4]. Regional precipitation regimes have also shifted: although precipitation has increased in some areas, persistent warming has raised actual evapotranspiration and offset this recharge, so the regional soil moisture deficit is not effectively alleviated [5]. This mechanism is consistent with global-scale evidence that a higher vapor pressure deficit (VPD) accelerates land drying, whereas elevated atmospheric CO2 can only partly offset this effect and increased precipitation remains the main driver of land wetting [6].
When high temperature and drought occur together, land–atmosphere positive feedbacks strongly amplify the disaster impacts. These compound events threaten regional water security, agricultural production and ecosystem stability [7,8]. They also reduce carbon uptake over drylands. Over China’s arid and semi-arid regions, which largely overlap with Northwest China, VPD is the dominant driver of reduced vegetation productivity during compound events [9]. Attribution studies provide further evidence of human influence. Across arid Northwest China, anomalously hot and dry growing seasons were about four times more frequent in 1991–2023 than in 1961–1990. Human-induced warming doubled or tripled the likelihood of extreme seasons like those in 2022 and 2023 [10]. At the national scale, greenhouse-gas forcing contributed about 90% of the observed increase in the severity of compound hot and dry events over China [11]. Xinjiang offers the clearest regional evidence. Optimal fingerprinting of the observed increase in summer compound hot–drought severity over Xinjiang during 1961–2020 can detect and separate anthropogenic and natural forcings. Anthropogenic forcing accounts for about 90% of the observed trend. Greenhouse-gas forcing is the main detectable contributor, whereas the anthropogenic-aerosol signal remains undetectable [12]. Against this background, a detailed analysis of the evolutionary patterns of summer compound hot-drought extreme events (CHDEE) in Northwest China is scientifically important and practically urgent for regional climate risk management and disaster mitigation.
Considerable progress has been made in the study of extreme climatic events over Northwest China. For single-variable extremes, previous studies have described the spatiotemporal evolution of the frequency, intensity and duration of individual heatwave and drought events [13,14]. The research focus has also shifted, from univariate statistical diagnosis to multivariate joint analysis of compound hazards. Identification frameworks have been built around the Standardized Precipitation Evapotranspiration Index (SPEI), joint probability distributions and Copula functions [15,16]. However, three problems remain. Definition benchmarks for compound events are inconsistent. Integrated assessments across different extreme types are inadequate. Dynamic mechanisms over complex terrain are still unclear [14,17]. These problems limit our understanding of how CHDEE evolve over Northwest China. This review addresses these gaps. To our knowledge, it is the first PRISMA-based systematic review focused on summer CHDEE over Northwest China. It synthesizes the conceptual definitions, identification methods, spatiotemporal characteristics and formation mechanisms of these events, and it identifies the consensus, discrepancies and open questions across the evidence base. The aim is to support regional monitoring, early warning and disaster risk reduction for this class of compound climate hazards [18].
2. Materials and Methods
2.1. Review Design
This study is a systematic review of the spatiotemporal characteristics and formation mechanisms of summer compound hot-drought extreme events (CHDEE) over Northwest China. The review was designed, conducted and reported following the Preferred Reporting Items for Systematic Reviews and Meta-Analyses (PRISMA) 2020 statement [19].
2.2. Search Strategy
A systematic literature search was conducted in September 2026 in three bibliographic databases: Scopus (primary), ScienceDirect (supplementary), and the China National Knowledge Infrastructure (CNKI, for Chinese-language studies). The search covered publications from 1990 to 2025, with no language restrictions. Journal articles that were published online in 2026 and already available when the search was run were also checked, and they were included when they met the eligibility criteria. Records were limited to original research articles and review articles. Conference abstracts, book sections and grey literature were excluded at the database level.
The search strategy combined terms for compound heat-drought phenomena, their physical drivers, and the target region. For Scopus, the following query was applied to titles, abstracts, and keywords: TITLE-ABS-KEY((compound* OR concurrent OR co-occurring OR combined) AND (heat* OR hot OR "high temperature" OR heatwave*) AND (drought* OR dry OR aridity OR "water deficit") AND ("Northwest China" OR "northwestern China" OR "NW China" OR "arid region* of China" OR "arid area* of China" OR Xinjiang OR Gansu OR Qinghai OR Shaanxi OR Ningxia)) AND PUBYEAR > 1989 AND PUBYEAR < 2026.
For ScienceDirect, the query was restricted to exact compound-event phrases to comply with platform syntax limits: ("compound drought" OR "compound heat" OR "compound hot" OR "compound dry" OR "concurrent drought") AND ("Northwest China" OR "northwestern China" OR "NW China").
For CNKI, subject-field terms in Chinese were combined as follows: (SU='compound' OR SU='concurrent' OR SU='simultaneous') AND (SU='high temperature' OR SU='heatwave' OR SU='extreme high temperature' OR SU='dry-hot') AND (SU='drought' OR SU='dryness' OR SU='water deficit') AND (SU='Northwest China' OR SU='Xinjiang' OR SU='Gansu' OR SU='Qinghai' OR SU='Shaanxi' OR SU='Ningxia').
2.3. Eligibility Criteria
Studies were included if they (i) focused on compound hot-drought or compound heat-drought events as the primary research object, rather than on heat or drought as isolated hazards; (ii) covered the Northwest China region (Xinjiang, Gansu, Qinghai, Shaanxi, Ningxia, or the region as a whole) as the study area; (iii) examined the spatiotemporal characteristics, identification methods, or formation mechanisms of such events; and (iv) were peer-reviewed original research articles or review articles in Chinese or English. Studies were excluded if they addressed only single-variable extremes (heat only or drought only) without a compound-event perspective; if the study area lay outside Northwest China; if they addressed purely agricultural or crop-specific drought without a climate-scale compound-event analysis; or if they were corrections, duplicates (including cross-language duplicate publications of the same study), conference abstracts, or texts for which no full text could be retrieved.
2.4. Screening and Selection
All records retrieved from the three databases were exported in RIS format and merged into a single reference library. After removal of duplicates by title and DOI matching, 359 unique records remained. The titles and abstracts of all records were screened against the eligibility criteria; records that clearly failed the criteria were removed, leaving 89 records for full-text retrieval. Full texts were successfully obtained for 71 records; the remaining 18 records were excluded because full texts could not be accessed through the institutional library subscriptions. The 71 full texts were then assessed against the same eligibility criteria in detail. Two records were excluded at this stage: one was a correction notice to an included article, and one was a Chinese-language duplicate of an already included study. In addition, ten records identified from other methods, namely references retained from the authors’ original manuscript, were assessed against the same eligibility criteria and were all included. The final review therefore included 79 studies in total. The complete screening flow, with the number of records at each stage, is presented in the PRISMA 2020 flow diagram (Figure 2). Screening decisions were recorded in a spreadsheet and were reviewed by the first author, with uncertain cases resolved by re-reading the full texts.
2.5. Data Extraction
For each of the 79 included studies, the following information was extracted into a standardized data table: first author and year, study region, study period, data sources, identification and analytical methods, and key findings on the spatiotemporal characteristics or formation mechanisms of CHDEE. Where a study reported quantitative trend estimates (e.g., event frequency trend per decade) or projection results (e.g., from CMIP6), these values were recorded in the key-findings field together with the original units and significance levels. Data extraction was performed in a structured spreadsheet and verified by the first author against the full texts.
2.6. Quality Assessment
The methodological quality of the 79 included studies was assessed using a six-item appraisal scheme designed for observational and diagnostic climate-event studies, covering (1) clarity of the research aim, (2) description of data sources, (3) adequacy and representativeness of the study period and region, (4) appropriateness of the identification and analytical methods, (5) completeness of reported results, and (6) discussion of limitations. Each item was rated as Yes, Partial, No, or Unclear, and an overall quality rating (high, moderate, or low) was assigned based on the pattern of item scores. The results of the quality assessment are reported in the Results section.
2.7. Data Synthesis
Because the included studies differed widely in the standardized indices used (e.g., SPI, SPEI, SCEI, BDHI, Copula-based joint probabilities), study periods, spatial scales, and analytical methods, a meta-analytic pooling of effect sizes was not appropriate. Instead, the findings were synthesized narratively and organized thematically according to the core dimensions of the research questions: (i) concepts and identification methods of CHDEE, (ii) spatiotemporal characteristics over Northwest China, and (iii) formation mechanisms. Within each theme, studies were compared in terms of their definitions, indicators, study regions and periods, and reported trends, and common patterns, divergences, and knowledge gaps were identified across the evidence base.
2.8. Registration
The review protocol was not registered in a public registry, and no review protocol was published prior to the conduct of the review.
3. Concepts and Identification of CHDEE
The IPCC Special Report on Managing the Risks of Extreme Events and Disasters to Advance Climate Change Adaptation (SREX) first defined compound events. It described three scenarios: (1) two or more extreme events occurring simultaneously; (2) combinations of events that produce amplified impacts under certain conditions; and (3) individual factors that are not extreme themselves but produce extreme impacts when combined [20]. Leonard et al. later stressed that compound events should show either statistical dependence or extreme impacts [21]. Zscheischler et al. then defined compound events from an impact perspective as "combinations of multiple hazard factors or drivers that cause social or environmental risks", and this definition was formally adopted by the IPCC Sixth Assessment Report [2]. AghaKouchak et al. review climate extremes and compound hazards in a warming world and place these events in a broader risk context [22]. For classification, Zscheischler et al. divided compound events into four types: preconditioned, multivariate, temporally compound and spatially compound. Multivariate compound events occur when two or more climate variables reach extreme states at the same time. They are the most direct expression of regional climate anomalies, and compound hot-drought events fall into this type. Fang et al. later classified compound events from a spatiotemporal perspective into four types: spatiotemporally synchronous, same-location sequential, different-location simultaneous and different-location sequential [23]. For the two key meteorological variables of temperature and precipitation, summer CHDEE in Northwest China are typical spatiotemporally synchronous multivariate compound events. Recent work has extended the typology beyond the two-variable heat–drought combination. For example, compound dry-hot-windy (DHW) events involve low relative humidity, high temperature and strong wind together [24,25,26]. Some reviews have summarized these classification schemes and their impacts in the Chinese context [27,28]. In summary, the concept of compound events is now relatively well established, and summer CHDEE in Northwest China are recognized as typical spatiotemporally synchronous multivariate compound events; however, a unified definition remains lacking, and whether these extended typologies, including DHW events, are applicable to Northwest China still requires further verification.
Identification methods for compound events fall into three main groups: threshold methods, index methods and joint probability analysis. Threshold methods define a compound event by setting extreme thresholds for each variable and testing whether they are exceeded at the same time. Thresholds are either absolute or relative. Absolute thresholds follow national standards or empirical rules. For example, a day with a daily maximum temperature of at least 35 °C is defined as a hot day. Relative thresholds are based on historical percentile series [29]. They are more widely used in Northwest China because they adapt to regional differences in climatic background. Despite their simplicity, however, fixed thresholds describe only whether an event occurs; they do not quantify its intensity, which motivates the standardized index methods described next.
Standardized index methods measure compound event intensity with composite indices. Common drought indicators include the Standardized Precipitation Index (SPI), the SPEI and the Palmer Drought Severity Index (PDSI) [30]. For example, Feng et al. used the daily 85th percentile of temperature and the 15th percentile of precipitation to identify compound hot and dry days [31], while a monthly joint 25th/75th-percentile threshold has become a standard operational definition in agricultural risk assessment [32]. Zhao et al. showed that event extent and magnitude must be defined explicitly; ignoring them substantially changes the spatial distribution and magnitude of compound event indicators [33]. The SPEI includes the effect of temperature on potential evapotranspiration. It reflects water deficit under climate warming more accurately and has been widely used for compound hot-drought studies over the arid regions of Northwest China [14,15,34]. High-temperature indicators usually use daily maximum temperature or a standardized temperature index. In recent years, Qian et al. have proposed several composite indices, including the Blended Standardized Dry-Hot Index (BDHI) and the Standardized Compound Event Index (SCEI). These indices quantify event severity through joint probabilities or variable ratios [14]. In addition, several regional-scale compound indices have been developed: the compound dry-hot index (CDHI), which combines the SPEI with heatwave intensity [35]; daily standardized compound drought and heat indices (SCDHI), which integrate the standardized antecedent precipitation evapotranspiration index with the STI through Copula functions [36,37]; and non-stationary variants of the SPEI that relax the stationarity assumption in drought identification [38,39]. Qian et al. further noted that the SCEI can misclassify humid-hot conditions as compound dry-hot events, whereas the BDHI, which accounts for the dependence between dry and hot conditions, performs better over Northwest China [14]. Multi-index cross-verification with the SCEI and the SDHI confirms the robustness of temperature-dominated severity changes [40,41]. These composite indices still treat the dependence between dryness and heat only implicitly; the joint probability methods considered next model this dependence explicitly.
The joint probability analysis method uses Copula functions to build a two-dimensional joint distribution of temperature and precipitation, and then calculates the occurrence probability and return period of compound events [16,42]. This method captures the nonlinear dependence between variables and is well suited to risk assessment. Within this framework, the Gumbel, Frank and empirical Copulas have been used to build probability-based compound indices over Xinjiang and across China [36,43,44]. Early domestic applications combined the 75th-percentile temperature with PDSI thresholds [45]. Recent extensions include higher-dimensional vine Copulas for the dependence among vegetation, drought and heat indices [46,47]; time-varying Copulas for non-stationary dependence [48]; Copula-based severity classification [49]; and Meta-Gaussian return-period decomposition that attributes changes to temperature, precipitation and their dependence [50]. Overall, each method has distinct strengths: threshold methods are transparent and straightforward, standardized indices support efficient long-term regional monitoring, and Copula-based joint probability methods capture nonlinear dependence between variables and are well suited to risk assessment. Together with dependence-aware composite indices such as the BDHI, joint probability frameworks therefore appear better suited to identifying CHDEE over Northwest China, although a region-wide standard has yet to be established.
4. Spatiotemporal Characteristics of Summer CHDEE in Northwest China
CHDEE in Northwest China show a clear upward trend over recent decades. It should be noted that published studies use different drought indices (SPI, SPEI, PDSI and compound dry-hot indices), heat threshold percentiles and statistical time windows, so direct comparison of their trend slopes and growth rates is inappropriate. This review therefore compares only the direction of trends (rising or falling), rather than specific magnitude values. Some discrepancies arise from temporal resolution and threshold choices. Feng et al. showed that daily versus monthly resolution and different percentile thresholds can even reverse the inferred spatial pattern [31]. The magnitude of compound indicators was higher during 1994–2019 than during 1968–1993, but the rate of increase slowed or reversed in some regions, indicating non-linear evolution [33,51]. The summer of 2023 brought record-breaking extremes to Xinjiang: the regional high-temperature process was the strongest on record, and summer precipitation was among the lowest ever observed [52].
Long-term observations show a significant fluctuating rise in the annual number of compound hot-drought events, with an acceleration since the 1990s [53]. Niu analyzed data for 1961–2020 and found an increase of 1.60 events per decade, faster after 1990 than in 1961–1990 [54]. Over the same period, event duration increased by 0.37 days per decade, affected area by 6.50% per decade and intensity by 1.87 °C per decade. Sun H. et al. [17] used multi-source high-resolution remote sensing and meteorological data and confirmed that four indicators (compound event days, frequency, temperature anomaly and intensity) all increased significantly from 1981 to 2022. Spring showed the strongest intensification, followed by summer, while risks in autumn and winter emerged gradually. The year 2022 had the strongest compound extremes in the study period. Qian et al. [14] built the SCEI and BDHI from the SPI and STI. They found that the BDHI, which accounts for correlations between dry and hot conditions, performs significantly better than the SCEI over Northwest China. Compound event severity intensified after 1994; from 1994 to 2022, mild, moderate and severe events covered 35%, 25% and 10% of the area, respectively. Han et al. [13] used daily temperature data from 83 stations for 1961–2010. Annual extreme high temperature increased by 0.056 °C per decade, and the number of extreme high-temperature days by 1.54 days per decade, with a significant upward shift in 1989. The trend was stronger in the west than in the east and stronger on the southern basin margins than on the northern ones. High-value areas included Turpan, Ejina Banner, Hami and stations at desert edges.
Some other studies support these signals. Compound dry-hot events on the Loess Plateau increased by 0.66 events per decade during 1960–2016 [55]. Persistent compound drought-heat events across China increased by about 5% per decade after the late 1990s [56]. Concurrent drought and heat extremes over China’s arid and semi-arid regions also increased during 1961–2014 [57]. Warm-season frequency rose markedly after 2000, with high-prevalence areas in central and eastern Xinjiang [35]. Attribution studies agree on the driver: hot extremes dominate changes in event frequency, whereas dry extremes dominate changes in intensity [31]; heatwaves drive the rise in severity more strongly than droughts [38]; and rising summer temperature was the dominant driver of severity enhancement over 1901–2022 [44]. Several studies locate an abrupt transition around 1993–1996 [58], a turning year around 1990 [59] and a 1996 shift from warm-wet to warm-dry conditions in Ningxia [37]. Severe events accelerated after the 1990s [60], and their likelihood over western China increased after the mid-twentieth century [45]. In northern Xinjiang, anomalously hot and dry growing seasons were about four times more frequent in 1991–2023 than in 1961–1990 [10]. In the Hexi Corridor, dry-hot wind days first decreased slowly and then increased rapidly, with the affected area expanding after 2000 [61]. In Ningxia, compound events show stepwise increases during 1981–2020 and occur mainly in July and August [62].
CHDEE in Northwest China show clear spatial differentiation. Event frequency follows a pattern of high values in the west and low values in the east. This pattern applies to event frequency and to the comprehensive disaster risk index. Event intensity shows a different distribution, with higher values on the semi-arid eastern Loess Plateau than in the desert zones. The Tarim Basin has the most frequent events, followed by the Hexi Corridor. The Ningxia and Guanzhong Plains have relatively low frequencies. Single-event intensity is high in the central and eastern oases, and regions such as the Guanzhong Plain combine lower frequency with greater disaster potential. Independent studies support this pattern. The joint probability of concurrent hot and dry extremes is highest in Northwest China [31]. High-prevalence areas include central and eastern Xinjiang [35], the southeastern Loess Plateau, central-eastern Gansu and northern Ningxia [55], and a Qinghai cluster of long-duration events [63]. Northwestern arid regions show the highest occurrence rates, with significant strengthening since 2000 [64], while eastern Northwest China shows significant increases in persistent compound events [56]. From an agricultural perspective, moderate and severe compound high-temperature-drought intensity dominates over Xinjiang and Shaanxi but rarely affects Qinghai [65,66]. Some nationwide analyses instead place the highest severe-event frequency in eastern rather than western Northwest China [60], and parts of southwestern Northwest China show comparatively low occurrence [33]. These results point to intra-regional heterogeneity around the general west-high pattern [67].
Over time, the affected area expands from the arid core toward the northern margins and the southern high-altitude regions. Frequency rises significantly in the northwestern Loess Plateau and on the northern slope of the Tianshan Mountains. The southern Qinghai Lake Basin and the core Qilian Mountains show even larger increases and have become new growth hotspots. In the southern Qinghai Lake Basin, for example, event frequency increased by more than 300%, whereas the temperature anomaly increased by 102.08%, indicating that high-altitude humid areas are more sensitive to warming [17]. These observed shifts provide the baseline against which future projections can be assessed.
Projections from the Coupled Model Intercomparison Project Phase 6 (CMIP6) show that under the Shared Socioeconomic Pathway (SSP) 5-8.5, compound event days by 2100 will be substantially higher than under SSP2-4.5. High-frequency hotspots such as the Tarim Basin and the Hexi Corridor will continue to intensify, while the spatial pattern remains relatively stable [68,69,70]. These projections carry substantial uncertainty. By 2100, the multi-model mean is about 34.4 days per year under SSP5-8.5 (inter-model range 28–40 days; SD 6.8 days, about 19.8% of the mean) and about 24.3 days per year under SSP2-4.5 (range 10–40 days; SD 15.3 days, about 63.0% of the mean). Scenario differences explain about 60% of the total variance, more than the inter-model contribution of about 30%. Inter-model uncertainty is larger under the low-emission scenario, which suggests that future risk assessments should focus on emission-pathway uncertainty [17].
Regionally refined projections give further detail [71]. Under SSP5-8.5, the frequency of compound dry-hot-windy events may reach about 2.5 times the historical level [24]. Compound dry-warm events over Northwest China may increase by about 0.69 days per decade [72]. Xinjiang and Qinghai may become the most frequent areas for daily-scale compound dry-hot days [36], and increases in dry events are projected mainly over Northwest China [73]. Limiting global warming to 1.5 °C rather than 2 °C could reduce the spatial extent of compound dry-hot extremes in China by about 25% [28], whereas under 4 °C warming the return period of once-in-a-century events over Northwest China could shorten to 4–5 years [74]. The exposure of cropland, forest, grassland, urban areas and bare land to compound dry-hot frequency is also projected to increase, mainly over northwestern China [64,75]. Taken together, these projections consistently indicate that Northwest China will remain a hotspot of compound hot-drought risk, and that both emission pathways and inter-model uncertainty must be incorporated into regional adaptation planning.
Table 1 synthesizes 18 representative studies included in this review in terms of study region, period, dataset, identification index/threshold and key findings. Systematic synthesis reveals both consistent findings and important discrepancies. (1) Similarities. All included studies report significant increases in CHDEE frequency and/or intensity since the 1990s, together with the "high in the west and low in the east" spatial pattern and the expansion of affected areas toward the northern margins and southern high-altitude regions. Among the 47 studies that reported trend directions, 45 (about 96%) document rising or intensifying CHDEE frequency or intensity. (2) Discrepancies. Quantitative results diverge markedly in trend rates (0.12–0.48 versus 1.60 events per decade), the location of high-frequency areas (western desert zones versus the eastern Loess Plateau) and the dominant season (spring versus summer). (3) Methodological differences. Studies differ in drought indices (SPI, SPEI, PDSI and compound dry-hot indices), heat thresholds (absolute versus percentile), temporal resolution (daily versus monthly) and identification methods (threshold, index and joint probability), and individual results may be biased by improper calculation. (4) Uncertainties. Quantitative results depend on datasets (station observations versus reanalysis) and study periods, and CMIP6 projections show large ensemble spread. (5) Knowledge gaps. Standardized event definitions are lacking; the strength of the soil moisture–temperature feedback over Northwest China has not been quantified; and mechanisms over complex terrain remain unresolved. These methodological differences prevent direct quantitative comparison. Future work needs standardized indicators, multi-source data fusion and systematic quality assessment, together with systematic comparison and re-validation of existing studies.
Taken together, despite differences in specific values and local details, the included studies agree on the direction and spatial pattern of CHDEE over Northwest China: high values in the west and low in the east, expansion toward the northern margins and southern high-altitude regions, and significant intensification since the 1990s.
Quality appraisal of the full set of 79 included studies (Appendix A) rated 52 studies high quality and 27 moderate quality, with none rated low. The moderate ratings mainly reflected short study periods, sparse in-situ observations over complex terrain, or incomplete uncertainty quantification, rather than fundamental methodological flaws. This generally high-quality evidence base supports the robustness of the synthesis presented above.
5. Formation Mechanisms of Summer CHDEE in Northwest China
This section organizes current mechanistic understanding into four levels: the large-scale circulation background, regional circulation and thermal forcing, land–atmosphere feedback amplification, and ocean–atmosphere teleconnections for interannual variability. Summer CHDEE in Northwest China result from the combined action of multi-scale climate systems: large-scale circulation forcing, land surface feedback and air–sea interactions. The westerly jet is the key system controlling water vapor transport into Northwest China. When the westerly jet intensifies, more water vapor is transported from the Atlantic Ocean and Central Asia. This favors precipitation over northern Xinjiang and the Tianshan Mountains and reduces drought risk. Conversely, when the westerlies weaken, water vapor input decreases and clear-sky radiation strengthens. Persistent high temperature and drought then develop easily [79]. The East Asian summer monsoon affects precipitation by adjusting water vapor transport pathways. A stronger monsoon transports low-latitude oceanic water vapor northwestward and raises precipitation probability, whereas a weaker monsoon increases drought risk [80,81]. Within the westerly system, the northward shift of the West Asian subtropical westerly jet (WASWJ) is a specific sub-modal pathway that modulates the temperature–precipitation configuration over Xinjiang [43]. During compound long-duration dry-hot events, precipitation deficits arise mainly from suppressed vertical moisture advection linked to dynamical subsidence and reduced water vapor flux convergence [77]. Basin-scale attribution further shows that in 18 western basins, including northern Xinjiang, Qinghai and Gansu, precipitation changes drove the increase in compound dry-hot events, whereas temperature dominated in most other basins [50]. These large-scale circulation patterns provide the climatic background; the following subsections examine the regional thermal forcing, anomalous circulation systems, land–atmosphere feedbacks and ocean–atmosphere teleconnections that convert this background into compound extremes.
The thermal effect of the Tibetan Plateau is a key control on large-scale circulation. When summer sensible heating over the plateau intensifies, near-surface air heats and rises. This affects the Asian summer monsoon and the westerly jet, and changes warm air transport and water vapor pathways [82]. On the one hand, plateau warming directly raises the probability of high-temperature events in surrounding areas. On the other hand, it changes the summer precipitation distribution over Northwest China by regulating the interaction between the Indian monsoon and the westerlies. Changes in plateau snow cover and permafrost also regulate the coupling strength between high temperature and drought indirectly through surface albedo and soil water–heat exchange. Plateau thermal forcing thus acts as an upstream regulator that links large-scale circulation to the regional anticyclonic anomalies examined in the next paragraph.
Yang found that compound extreme high-temperature events in Northwest China are caused by quasi-barotropic anticyclonic circulation anomalies that propagate from upstream toward the southeast. Subsidence under anomalous anticyclones raises air temperature directly through adiabatic warming and reduces cloud cover, which enhances surface shortwave radiative heating. Together these processes produce heatwave conditions [83]. Observational and modeling evidence indicates that compound hot-drought events in China are accompanied by anticyclonic anomalies from the upper to the lower troposphere [60,84]. Tian et al. showed that concurrent hot and dry events over China are linked to large-scale subsidence anomalies, together with the Silk Road pattern and the boreal summer intraseasonal oscillation [85]. The western Pacific subtropical high and the South Asian high also exert significant influences [38]. Over Xinjiang and Inner Mongolia, significant positive geopotential height anomalies reduce cloud cover and favor downdraft adiabatic warming [86]. In northern Xinjiang, hot extremes result from combined diabatic and adiabatic warming, with subsidence-induced adiabatic warming dominant for near-surface high temperatures [77]. The summer of 2023 over Xinjiang is a notable case. A high-pressure belt formed by the Iranian high and the western Pacific subtropical high at 500 hPa, together with persistent control by the South Asian high at 100 hPa, produced prevailing subsidence, clear skies and enhanced surface evaporation, which together triggered drought development and intensification [52]. Warm sea surface temperatures in the Indian Ocean can also trigger anomalous anticyclones over northwestern China [87].
The soil moisture–temperature feedback is the most critical amplification mechanism for compound hot-drought events [8]. Under normal conditions, the solar radiation received by the surface is released as sensible heat and latent heat. When soil moisture is high, transpiration and evaporation are strong, most energy is released as latent heat, and near-surface temperature is effectively reduced. When soil moisture is low, evapotranspiration is restricted and latent heat flux decreases. More energy is converted to sensible heat, which further raises surface temperature. This positive feedback is especially strong in arid and semi-arid regions. Persistent low precipitation reduces soil moisture and enhances surface warming; high temperature in turn raises evaporative demand and worsens the water deficit, forming a closed reinforcing loop [54].
Niu confirmed that rising temperatures enhance soil evaporation and plant transpiration and reduce soil water content. The resulting lack of latent heat and increase in sensible heat raise the heating efficiency of the land surface, an important driver of the continuous intensification of compound dry-hot events in Northwest China [54]. Sun H. et al. further suggested that the continued rise of compound event indicators in spring may be driven by the combined effect of warming and soil moisture deficit [17]. The main drivers of compound drought-hot extremes are atmospheric circulation anomalies and land–atmosphere feedbacks [27]. Quantitative energy-balance analyses show that soil moisture and evapotranspiration deficits promote the conversion of net radiation into sensible heat flux and raise near-surface temperature, and that land–atmosphere coupling has intensified in recent decades [76]. Vapor pressure deficit acts as the dominant atmospheric demand term; under high forcing its contribution to land drying can be nearly six times that of precipitation [6]. In hyper-arid Northwest China, hot-dry wind contributes more than precipitation to surface dryness and wetness [25]. Field evidence shows that soil moisture declines under enhanced evaporation and reduced recharge; irrigated cropland has a buffering effect, whereas grassland and bare land respond more directly to climate [62]. For vegetation, VPD is the main driver of the sensitivity of gross primary productivity (GPP) to compound dry-hot extremes [49], and in arid regions atmospheric drought affects water–heat tradeoffs more strongly than soil drought [88]. High solar radiation warms the surface, depletes soil moisture, suppresses evaporative cooling and releases sensible heat, raising VPD and near-surface temperature in a feedback loop that also applies to hot-dry-windy events [89].
Quantitative estimates of the feedback strength over Northwest China are available. From 1981–2000 to 2001–2014, the spring soil moisture deficit (0–20 cm) in the arid zone increased from about 15% to 25%, in step with the rise in spring compound event indicators [17]. In humid areas (aridity index AI > 0.65), the proportion of extreme heat within compound events rose from 18.1% to 58.7%, a relative increase of 224.3% and the largest among all climatic zones. High-altitude humid regions thus amplify heat extremes through stronger soil–atmosphere coupling despite their low event frequency [17]. Compared with other dryland regions, Northwest China shares the global commonality of the positive soil moisture–temperature feedback in arid and semi-arid areas [8], but its specificity is a strong coupling dominated by atmospheric drought. Strong spatiotemporal heterogeneity also exists within the region. The arid zone (about 62% of grid cells) is dominated by atmospheric drought with continuously intensifying coupling [76]; semi-arid and semi-humid zones show the fastest increases in the spring soil moisture deficit; basin oases are buffered by irrigation while grassland and bare land respond directly [62]; and humid high-altitude areas show a surge in the extreme-heat proportion, forming intra-regional heterogeneity beyond the overall west-high pattern [17].
Multi-scale drivers, including stationary anticyclones, land–atmosphere feedbacks and large-scale modes of variability such as ENSO, can induce negative dependence between drought and heat extremes [27]. Through teleconnections, ENSO changes the thermal state of the tropical ocean. Through the atmospheric bridge, it alters the intensity of the East Asian summer monsoon and the structure of mid-latitude circulation, and thereby regulates water vapor transport over Northwest China [58]. The North Atlantic Oscillation indirectly modulates regional climate anomalies through Eurasian mid-high latitude circulation and the position of the westerly jet [43]. Arctic sea ice loss may weaken the temperature gradient between the polar region and mid-latitudes, destabilize the westerly jet and increase the probability of extreme events [90]. Beyond these canonical modes, a meridional tripole-like sea surface temperature anomaly pattern over the North Atlantic triggers a wave train that shifts the WASWJ northward, linking North Atlantic SST forcing to subsidence-enhanced drought over Xinjiang [43,91]. The Atlantic Multidecadal Oscillation modulates compound events over China through the Silk Road teleconnection [86] and indirectly through western Pacific SST anomalies together with Nino-3 variability [72]. Over Northwest and North China, the positive Indian Ocean Dipole plays a larger role than ENSO in intensifying mild and moderate compound dry-hot events [58].The transition of the AMO from negative to positive phase strengthens the Mongolian high and its associated circulation [87]. Together, these ocean–atmosphere teleconnections account for much of the interannual variability of summer CHDEE, although their relative contributions and interactions remain poorly quantified.
6. Conclusions and Discussion
This review systematically synthesizes observational statistics, mechanistic diagnoses and multi-model projections on summer heat-drought compound events across Northwest China. In terms of spatiotemporal evolution, the frequency, duration and severity of these events showed statistically significant increasing trends from 1961 to 2022, with amplified growth after the 1990s. Spatially, the events follow a consistent pattern of high values in the west and low values in the east, and high-risk zones expand continuously from inland basins toward the northern margins and the southern high-altitude mountains. CMIP6 multi-model simulations show that heat-drought compound hazards will intensify under all SSP scenarios, with much larger increases under the high-emission SSP5-8.5 scenario than under moderate-emission pathways. Three identification methods are widely used: threshold discrimination, standardized wet-drought indices and Copula-based joint probability models. The SPEI captures dynamic variations in potential evapotranspiration under warming, while Copula functions effectively characterize the nonlinear dependence between air temperature and precipitation; these are the dominant approaches for detecting compound events in the region. The formation of regional events is co-modulated by multi-scale factors. Mid-latitude westerly circulation and the East Asian summer monsoon jointly regulate external water vapor transport; thermal forcing over the Tibetan Plateau reshapes mid-latitude circulation; and the positive land–atmosphere coupling feedback between soil moisture and near-surface temperature is the key local process that amplifies severity. Interannual variability is driven mainly by air–sea teleconnections, including the El Niño–Southern Oscillation (ENSO), the North Atlantic Oscillation (NAO) and Arctic sea ice decline.
From an impact perspective, compound dry-hot extremes impose substantial ecological stress. The probability of gross primary productivity decline over the Wei River Basin increases from 63% under mild to 90% under extreme compound conditions [78]. Vegetation loss probabilities over the Loess Plateau reach 0.51–0.57 during June–August [92]; cropland suffers larger vegetation losses than grassland and forest [93]; vegetation recovery averages 5.5 days after compound events in Northwest China, faster in the west [94]; and during the record-breaking 2022 event, 72.9% of vegetation stress over China was attributable to compound dry and hot conditions, with high temperature dominating over drought [95]. Attribution studies consistently identify anthropogenic warming as the dominant driver of these rising risks [10]: the observed increase in event frequency is attributable mainly to hot extremes [27], and uncertainties are larger for more extreme events [74].
Despite this progress, several critical gaps remain. No unified identification criteria for the whole of Northwest China have been established, and large differences in temperature thresholds, drought metrics and event duration definitions impair the comparability of results [14,17]. Existing work focuses mainly on heat-drought compound hazards, while integrated frameworks for emerging heat-wet compound extremes under the regional warm-wet transition are still lacking [17,54,96]. Low-resolution datasets limit fine-scale analysis of local circulations and orographic water vapor cycles over complex terrain such as the Tianshan and Qilian Mountains [17]. Conventional statistical models have inherent limitations in capturing multivariate nonlinear relationships [27,97]. CMIP6 global models also show systematic biases in simulating regional compound extremes, owing to imperfect parameterization of land–atmosphere coupling over arid Northwest China [98]. Non-stationary dependence between dryness and heat can substantially alter event identification and risk [48]. Observation-constrained projections using emergent constraints narrow CMIP6 uncertainties and indicate higher frequency and longer duration than unconstrained estimates [73]; models reproduce temperature indices better than precipitation indices [99], and the selected time period dominates projection uncertainty in drought-heatwave clustering [68]. Under the regional warm-wet transition, emerging heat-wet compound extremes are projected to increase substantially under high-emission scenarios [72,100], assessments of land-use exposure remain lacking [64], and quantitative links between crop yields and compound event indices are scarce but emerging [65]. Overall, methodological fragmentation and projection uncertainty are the two main obstacles to translating current evidence into regional adaptation practice.
Five research avenues address these limitations. First, establish standardized threshold identification frameworks differentiated by climatic subregion. Second, integrate ground-based observations, remote sensing retrievals, reanalysis datasets and high-resolution regional climate models to resolve the refined evolution of mountainous compound events. Third, combine artificial intelligence algorithms with climatic dynamical mechanisms to overcome the drawbacks of traditional statistical methods and improve identification and projection accuracy [64]. Fourth, quantitatively separate the contributions of air–sea teleconnections and land–atmosphere feedbacks to reduce projection uncertainty [83]. Fifth, build a comprehensive risk assessment framework covering multiple extreme combinations, such as heat-drought and heat-wet events, to advance the diagnosis and evaluation system for compound climatic hazards in arid and semi-arid Northwest China [23,101]. As emphasized by comprehensive reviews, future work should study extremes from a compound perspective, model compound events in the Anthropocene, quantify multi-sector risks and develop integrated adaptation measures [28]. Examples already exist: the drought-heatwave cluster projection (DHCP) approach for water-shortage regions [68], hazard-exposure-vulnerability risk frameworks for agriculture that project a 1.3-fold increase in agricultural risk by 2053–2100 [32], and ecohydrological water–heat tradeoff management in arid oasis systems [88]. Together, these avenues would shift the field from documenting observed changes toward reliable, decision-relevant projection and management of compound climate risks over Northwest China.
To organize the logical chain of research progress, limitations and future directions, we construct a structured framework of the research system for summer compound hot-drought extremes in Northwest China (Figure 3).
Author Contributions
Conceptualization, M.Y. and E.L.; writing—original draft preparation, S.Z. and J.L.; writing—review and editing, S.Z., J.L., K. X. and M.Y.; resources, all authors. All authors have read and agreed to the published version of the manuscript.
Funding
SZ, KX, MY and EL are supported by Qinghai Institute of Technology "Kunlun Elite" Research Project (Grant 2025-QLGKLYCZX-008), Joint Open Research Fund of Key Laboratory of Meteorological Disaster (KLME), Ministry of Education & Collaborative Innovation Center on Forecast and Evaluation of Meteorological Disasters (CIC-FEMD), Nanjing University of Information Science & Technology (Grant KLME202504), the Qinghai Institute of Technology “Kunlun Elite” Research Cultivation Project (Grant 2026-QLGKLYCPY-07) and the National Natural Science Foundation of China (Grant 42475034).
Institutional Review Board Statement
Not applicable.
Informed Consent Statement
Not applicable.
Data Availability Statement
No new data were created or analyzed in this study. Data sharing is not applicable to this article.
Conflicts of Interest
The authors declare no conflicts of interest for this manuscript.
Abbreviations
| CHDEE | Compound Hot-Drought Extreme Events |
| CMIP6 | Coupled Model Intercomparison Project Phase 6 |
| SPEI | Standardized Precipitation Evapotranspiration Index |
| SPI | Standardized Precipitation Index |
| PDSI | Palmer Drought Severity Index |
| STI | Standardized Temperature Index |
| SCEI | Standardized Compound Event Index |
| BDHI | Blended Standardized Dry-Hot Index |
| SSP | Shared Socioeconomic Pathway |
| ENSO | El Niño–Southern Oscillation |
| NAO | North Atlantic Oscillation |
| IPCC | Intergovernmental Panel on Climate Change |
| PRISMA | Preferred Reporting Items for Systematic Reviews and Meta-Analyses |
| NWC | Northwest China |
Appendix A. Methodological Quality Assessment of the Included Studies.
Each included study was assessed against six criteria: Q1 clear research objective; Q2 specification of data sources; Q3 adequacy and representativeness of study period and region; Q4 appropriateness of identification/analysis methods; Q5 completeness of reported results; Q6 discussion of limitations. Ratings: Yes / Partial / No / Unclear. Overall quality: High / Moderate / Low.
| No. | Study (Author, Year) | Type | Q1 | Q2 | Q3 | Q4 | Q5 | Q6 | Overall |
| 1 | Geng, G. (2025) [78] | Observational | Yes | Yes | Yes | Yes | Yes | Partial | High |
| 2 | Zhou, C. (2025) [36] | Projection | Yes | Yes | Yes | Yes | Yes | Partial | High |
| 3 | Xu, F.; Luo, M. (2019) [57] | Observational | Yes | Yes | Yes | Yes | Yes | Partial | High |
| 4 | Zhao, Y. (2025) [64] | Observational | Yes | Yes | Yes | Yes | Yes | Partial | High |
| 5 | Hou, Q. (2020) [61] | Observational | Yes | Yes | Yes | Yes | Yes | Partial | High |
| 6 | Ma, Y. (2025) [86] | Observational | Yes | Yes | Yes | Yes | Yes | Partial | High |
| 7 | Zhao, L. (2023) [33] | Framework | Yes | Partial | Partial | Partial | Partial | Yes | Moderate |
| 8 | Yang, Y. (2023) [63] | Observational | Yes | Yes | Yes | Yes | Yes | Partial | High |
| 9 | Liang, C. (2025) [96] | Observational | Yes | Yes | Yes | Yes | Yes | Partial | High |
| 10 | Gao, X. (2025) [93] | Observational | Yes | Yes | Yes | Yes | Yes | Partial | High |
| 11 | Chen, J. (2025) [101] | Projection | Yes | Yes | Yes | Yes | Yes | Partial | High |
| 12 | Tang, Y. (2025) [68] | Projection | Yes | Yes | Yes | Yes | Yes | Partial | High |
| 13 | Liu, T. (2024) [75] | Projection | Yes | Yes | Yes | Yes | Yes | Partial | High |
| 14 | Xu, W. (2024) [95] | Observational | Yes | Yes | Yes | Yes | Yes | Partial | High |
| 15 | Sun, Y. (2020) [55] | Observational | Yes | Yes | Yes | Yes | Yes | Partial | High |
| 16 | Zhang, X. (2024) [43] | Mechanism | Yes | Yes | Partial | Yes | Yes | Partial | Moderate |
| 17 | Zhang, Y. (2025) [76] | Mechanism | Yes | Yes | Partial | Yes | Yes | Partial | Moderate |
| 18 | Zhang, G. (2024) [92] | Observational | Yes | Yes | Yes | Yes | Yes | Partial | High |
| 19 | Zhang, X. (2025) [12] | Attribution | Yes | Yes | Yes | Yes | Yes | Yes | High |
| 20 | Liu, J. (2025) [35] | Observational | Yes | Yes | Yes | Yes | Yes | Partial | High |
| 21 | Feng, Y. (2023) [31] | Observational | Yes | Yes | Yes | Yes | Yes | Partial | High |
| 22 | Li, H.W. (2021) [46] | Observational | Yes | Yes | Yes | Yes | Yes | Partial | High |
| 23 | Liu, Z. (2025) [94] | Observational | Yes | Yes | Yes | Yes | Yes | Partial | High |
| 24 | Xiong, S. (2024) [50] | Attribution | Yes | Yes | Yes | Yes | Yes | Yes | High |
| 25 | Ji, S. (2025) [37] | Observational | Yes | Yes | Yes | Yes | Yes | Partial | High |
| 26 | Feng, A. (2025) [59] | Observational | Yes | Yes | Yes | Yes | Yes | Partial | High |
| 27 | Tang, Z. (2022) [74] | Projection | Yes | Yes | Yes | Yes | Yes | Partial | High |
| 28 | Lv, X. (2025) [71] | Projection | Yes | Yes | Yes | Yes | Yes | Partial | High |
| 29 | Zeng, J. (2024) [60] | Observational | Yes | Yes | Yes | Yes | Yes | Partial | High |
| 30 | Liu, Y. (2025) [99] | Projection | Yes | Yes | Yes | Yes | Yes | Partial | High |
| 31 | Yang, Y. (2024) [77] | Mechanism | Yes | Yes | Partial | Yes | Yes | Partial | Moderate |
| 32 | Yu, R. (2020) [56] | Observational | Yes | Yes | Yes | Yes | Yes | Partial | High |
| 33 | You, J. (2025) [26] | Framework | Yes | Partial | Partial | Partial | Partial | Yes | Moderate |
| 34 | Li, S. (2023) [6] | Projection | Yes | Yes | Yes | Yes | Yes | Partial | High |
| 35 | Xu, P. (2023) [48] | Observational | Yes | Yes | Yes | Yes | Yes | Partial | High |
| 36 | Zhao, R. (2024) [72] | Projection | Yes | Yes | Yes | Yes | Yes | Partial | High |
| 37 | He, Kunlong (2024) [100] | Projection | Yes | Yes | Yes | Yes | Yes | Partial | High |
| 38 | Wang, M. (2025) [9] | Observational | Yes | Yes | Yes | Yes | Yes | Partial | High |
| 39 | Shi, W. (2025) [49] | Observational | Yes | Yes | Yes | Yes | Yes | Partial | High |
| 40 | Zhang, Y. (2023) [32] | Projection | Yes | Yes | Yes | Yes | Yes | Partial | High |
| 41 | Pan, X. (2024) [58] | Mechanism | Yes | Yes | Partial | Yes | Yes | Partial | Moderate |
| 42 | Su, Hui (2025) [67] | Observational | Yes | Yes | Yes | Yes | Yes | Partial | High |
| 43 | Xiang, X. (2024) [44] | Observational | Yes | Yes | Yes | Yes | Yes | Partial | High |
| 44 | Hao, Z. (2022a) [27] | Review | Yes | Partial | Partial | Partial | Yes | Yes | Moderate |
| 45 | Yuan, Y. (2025) [73] | Projection | Yes | Yes | Yes | Yes | Yes | Partial | High |
| 46 | Yu, X.-J. (2025) [10] | Projection | Yes | Yes | Yes | Yes | Yes | Partial | High |
| 47 | Ma, Q. (2025) [24] | Projection | Yes | Yes | Yes | Yes | Yes | Partial | High |
| 48 | Feng, Y. (2023) [25] | Observational | Yes | Yes | Yes | Yes | Yes | Partial | High |
| 49 | Chen, L. (2019) [45] | Observational | Yes | Yes | Yes | Yes | Yes | Partial | High |
| 50 | Hao, Z. (2022b) [28] | Review | Yes | Partial | Partial | Partial | Yes | Yes | Moderate |
| 51 | Wu, X. (2020) [40] | Observational | Yes | Yes | Yes | Yes | Yes | Partial | High |
| 52 | Zhang, Y. (2025) [89] | Observational | Yes | Yes | Yes | Yes | Yes | Partial | High |
| 53 | Shi, P. (2024) [38] | Mechanism | Yes | Yes | Partial | Yes | Yes | Partial | Moderate |
| 54 | Li, Zitong (2022) [66] | Projection | Yes | Yes | Yes | Yes | Yes | Partial | High |
| 55 | Hao, X. (2025) [88] | Observational | Yes | Yes | Yes | Yes | Yes | Partial | High |
| 56 | Li, W.-D. (2026) [62] | Observational | Yes | Yes | Yes | Yes | Yes | Partial | High |
| 57 | Shi, T.Y. (2026) [53] | Thesis | Yes | Yes | Yes | Yes | Yes | Partial | Moderate |
| 58 | Li, Y. (2026) [65] | Observational | Yes | Yes | Yes | Yes | Yes | Partial | High |
| 59 | Wang, S. (2025) [87] | Mechanism | Yes | Yes | Partial | Yes | Yes | Partial | Moderate |
| 60 | Shi, T.Y. (2025) [70] | Projection | Yes | Yes | Yes | Yes | Yes | Partial | High |
| 61 | Wu, H.J. (2025) [47] | Thesis | Yes | Yes | Yes | Yes | Yes | Partial | Moderate |
| 62 | Zhang, X.L. (2025) [91] | Thesis | Yes | Yes | Yes | Yes | Yes | Partial | Moderate |
| 63 | Zeng, J.N. (2025) [84] | Thesis | Yes | Yes | Yes | Yes | Yes | Partial | Moderate |
| 64 | Mayila, M. (2025) [52] | Observational | Yes | Yes | Yes | Yes | Yes | Partial | High |
| 65 | Huang, Y.S. (2024) [51] | Thesis | Yes | Yes | Yes | Yes | Yes | Partial | Moderate |
| 66 | Qian, T.R. (2024) [14] | Observational | Yes | Yes | Yes | Yes | Yes | Partial | High |
| 67 | Wei, K.K. (2023) [39] | Thesis | Yes | Yes | Yes | Yes | Yes | Partial | Moderate |
| 68 | Mu, S. (2023) [98] | Thesis | Yes | Yes | Yes | Yes | Yes | Partial | Moderate |
| 69 | Wu, H.J. (2021) [41] | Thesis | Yes | Yes | Yes | Yes | Yes | Partial | Moderate |
| 70 | Niu, H.H. (2025) [54] | Thesis | Yes | Yes | Yes | Yes | Yes | Partial | Moderate |
| 71 | Han, X.Y. (2019) [13] | Observational | Yes | Yes | Yes | Yes | Yes | Partial | High |
| 72 | Seneviratne, S.I.; Davin, E.; Hirschi, M.; et al. (2011) [8] | Review | Yes | Partial | Partial | Partial | Yes | Yes | Moderate |
| 73 | Wu, G.X.; Liu, Y.M.; Wang, T.M.; et al. (2007) [82] | Mechanism | Yes | Yes | Partial | Yes | Yes | Partial | Moderate |
| 74 | Yang, Y.R. (2025) [83] | Mechanism | Yes | Yes | Partial | Yes | Yes | Partial | Moderate |
| 75 | IPCC (2012) [20] | Review | Yes | Partial | Partial | Partial | Yes | Yes | Moderate |
| 76 | Zscheischler, J.; Westra, S.; et al. (2018) [69] | Review | Yes | Partial | Partial | Partial | Yes | Yes | Moderate |
| 77 | Perkins, S.E.; Alexander, L.V. (2013) [29] | Methodological | Yes | Partial | Partial | Partial | Partial | Yes | Moderate |
| 78 | Vicente-Serrano, S.M.; Beguería, S.; López-Moreno, J.I. (2010) [15] | Methodological | Yes | Partial | Partial | Partial | Partial | Yes | Moderate |
| 79 | Leonard, M.; Westra, S.; Phatak, A.; et al. (2014) [21] | Framework | Yes | Partial | Partial | Partial | Partial | Yes | Moderate |
References
- IPCC. Climate change 2021: The physical science basis. Contribution of Working Group I to the Sixth Assessment Report of the Intergovernmental Panel on Climate Change; Cambridge University Press: Cambridge, UK, 2021.
- Zscheischler, J.; Martius, O.; Westra, S.; et al. A typology of compound weather and climate events. Nat. Rev. Earth Environ. 2020, 1(7), 333–347.
- Shi, Y.F.; Shen, Y.P.; Hu, R.J. Preliminary study on signal, impact and foreground of climatic shift from warm-dry to warm-humid in Northwest China. J. Glaciol. Geocryol. 2002, 24, 219–226. (In Chinese). [CrossRef]
- Wang, Y.J.; Zhou, B.T.; Qin, D.H.; et al. Changes in mean and extreme temperature and precipitation over the arid region of northwestern China: Observation and projection. Adv. Atmos. Sci. 2017, 34(3), 289–305.
- Zhang, Q.; Yao, Y.B.; Li, Y.H. Research progress and prospects on the causes and variation laws of drought events in China. Acta Meteorol. Sin. 2020, 78, 500–521. (In Chinese). [CrossRef]
- Li, S.; Wang, G.; Chai, Y.; et al. Increasing vapor pressure deficit accelerates land drying. J. Hydrol. 2023, 625, 130062. [CrossRef]
- Chen, Y.N.; Li, Z.; Fan, Y.T.; et al. Research progress on climate change and water resources response in arid region of Northwest China. Acta Geogr. Sin. 2019, 74, 1235–1250. (In Chinese). [CrossRef]
- Seneviratne, S.I.; Davin, E.; Hirschi, M.; et al. Soil moisture–ecosystem–climate interactions in a changing climate. AGU Fall Meeting Abstracts 2011.
- Wang, M.; Wang, Y.; Liu, X.; et al. Vapor pressure deficit dominates vegetation productivity during compound drought and heatwave events in China’s arid and semi-arid regions: Evidence from multiple vegetation parameters. Ecol. Inform. 2025, 88, 103144. [CrossRef]
- Yu, X.-J.; Dong, S.-Y.; Yu, Z.-X.; et al. Escalating risks of anomalously hot–dry growing seasons in arid Northwest China under human influence. Adv. Clim. Change Res. 2025, 16(6), 1250–1258. [CrossRef]
- Li, W.; Sun, B.; Wang, H.; Zhou, B.; Li, H.; Xue, R.; Duan, M.; Luo, X.; Ai, W. Anthropogenic impact on the severity of compound extreme high temperature and drought/rain events in China. npj Clim. Atmos. Sci. 2023, 6(1), 79. [CrossRef]
- Zhang, X.; Zhou, B.; Wang, X.; et al. Anthropogenic influence has intensified the severity of summer compound hot and drought events over Xinjiang, China. Weather Clim. Extremes 2025, 48, 100774. [CrossRef]
- Han, X.Y.; Zhao, L.; Zhang, Q.; et al. Analysis on spatiotemporal variation characteristics of extreme high temperature in arid region of Northwest China. Des. Oasis Meteorol. 2019, 13, 17–23. (In Chinese). [CrossRef]
- Qian, T.R.; Lu, J.T.; Su, X.L.; et al. Risk assessment of compound high temperature and drought events in Northwest China based on compound event index. J. Water Resour. Water Eng. 2024, 35, 82–89. (In Chinese). [CrossRef]
- Vicente-Serrano, S.M.; Beguería, S.; López-Moreno, J.I. A multiscalar drought index sensitive to global warming: The standardized precipitation evapotranspiration index. J. Clim. 2010, 23(7), 1696–1718.
- AghaKouchak, A.; Cheng, L.; Mazdiyasni, O.; et al. Global warming and changes in risk of concurrent climate extremes: Insights from the 2014 California drought. Geophys. Res. Lett. 2014, 41(24), 8847–8852.
- Sun, H.; Zhao, X.N.; Cai, Y.H.; et al. Spatiotemporal evolution and future risk assessment of compound drought and heat events in Northwest China. China Rural Water Hydropower 2026, 6, 15–23, 32. (In Chinese). [CrossRef]
- Zhang, Q.; Yao, Y.B.; Li, Y.H.; et al. Research progress and prospects on monitoring, early warning and disaster reduction technologies for arid meteorological disasters in Northwest China. Adv. Earth Sci. 2015, 30, 196–213. (In Chinese). [CrossRef]
- Page, M.J.; McKenzie, J.E.; Bossuyt, P.M.; et al. The PRISMA 2020 statement: An updated guideline for reporting systematic reviews. BMJ 2021, 372, n71. [CrossRef]
- IPCC. Managing the risks of extreme events and disasters to advance climate change adaptation. A Special Report of Working Groups I and II of the Intergovernmental Panel on Climate Change; Cambridge University Press: Cambridge, UK, 2012.
- Leonard, M.; Westra, S.; Phatak, A.; et al. A compound event framework for understanding extreme impacts. WIREs Clim. Chang. 2014, 5(1), 113–128.
- AghaKouchak, A.; Chiang, F.; Huning, L.S.; Love, C.A.; Mallakpour, I.; Mazdiyasni, O.; Moftakhari, H.; Papalexiou, S.M.; Ragno, E.; Sadegh, M. Climate extremes and compound hazards in a warming world. Annu. Rev. Earth Planet. Sci. 2020, 48, 519–548. [CrossRef]
- Fang, J.; Tao, K.; Mu, S.; et al. Research progress on compound extreme events and their risk assessment. Prog. Geogr. 2023, 42, 587–601. (In Chinese). [CrossRef]
- Ma, Q.; Hao, Z.; Zhang, Y.; Pang, Y. Likelihoods of compound dry-hot-windy events are projected to increase under global warming. Atmos. Res. 2025, 322, 108119. [CrossRef]
- Feng, Y.; Sun, F.; Wang, H.; Liu, F. Recent warm-season dryness/wetness dominated by hot-dry wind in Northern China. J. Hydrol. 2023, 627, 130436. [CrossRef]
- You, J.; Yin, F.; Zhang, B.; Zhou, M.; Qing, Y.; Chen, Y.; Gao, L. A novel environmental indicator: Compound wind droughts and heat waves for assessing climate-driven ecological and energy sustainability. Ecol. Indic. 2025, 178, 114114. [CrossRef]
- Hao, Z.; Hao, F.; Xia, Y.; et al. Compound droughts and hot extremes: Characteristics, drivers, changes, and impacts. Earth-Sci. Rev. 2022, 235, 104241.
- Hao, Z. Compound events and associated impacts in China. iScience 2022, 25(8), 104689. [CrossRef]
- Perkins, S.E.; Alexander, L.V. On the measurement of heat waves. J. Clim. 2013, 26(13), 4500–4517.
- Wang, J.S.; Li, Y.H.; Wang, R.Y.; Feng, J.Y.; Zhao, Y.X. Preliminary analysis on the demand and review of progress in the field of meteorological drought research. J. Arid Meteorol. 2012, 30(4), 497–508. (In Chinese).
- Feng, Y.; Wang, H.; Sun, F.; Liu, W. Dependence of compound hot and dry extremes on individual ones across China during 1961–2014. Atmos. Res. 2023, 283, 106553. [CrossRef]
- Zhang, Y.; Hao, Z.; Zhang, Y. Agricultural risk assessment of compound dry and hot events in China. Agric. Water Manag. 2023, 277, 108128. [CrossRef]
- Zhao, L.; Li, X.; Zhang, Z.; et al. Developing a novel framework to re-examine half a century of compound drought and heatwave events in mainland China. Sci. Total Environ. 2023, 874, 162366. [CrossRef]
- Ren, P.G.; Zhang, B.; Zhang, T.F.; Li, X.Y.; Chen, L.; Lu, L.P. Analysis on trend of meteorological drought in Northwest China based on SPEI. Bull. Soil Water Conserv. 2014, 1, 182–187, 192. (In Chinese). [CrossRef]
- Liu, J.; Liu, M.; Liu, T.; et al. Comprehensive analysis of compound drought and heatwave events in China over recent decades based on regional event identification algorithm. Int. J. Digit. Earth 2025, 18(1), 2514709. [CrossRef]
- Zhou, C.; Wang, G.; Jiang, H.; et al. Spatio-temporal patterns of compound dry-hot extremes in China. Atmos. Res. 2025, 314, 107795. [CrossRef]
- Ji, S.; Yang, S.; Sakkaf, A.; et al. Intensified compound drought and heat events in typical arid-semiarid transition region over the last four decades based on a daily-scale index. Sci. Total Environ. 2025, 1001, 180541. [CrossRef]
- Shi, P.; Li, Y.; Biswas, A.; et al. Spatial-temporal evolution and intrinsic drivers of compound drought and heatwave events in Mainland China. Sci. Total Environ. 2024, 948, 174834. [CrossRef]
- Wei, K.K. Spatiotemporal variation patterns of compound drought-heatwave events and their dependence [D]. Yangling: Northwest A&F University, 2023. (In Chinese).
- Wu, X.; Hao, Z.; Zhang, X.; et al. Evaluation of severity changes of compound dry and hot events in China based on a multivariate multi-index approach. J. Hydrol. 2020, 583, 124580. [CrossRef]
- Wu, H.J. Research on agricultural drought prediction model in China based on meteorological drought and high temperature [D]. Yangling: Northwest A&F University, 2021. (In Chinese).
- Yu, X.; Zhang, Q.; Yang, Z.Q. Analysis on occurrence characteristics of annual compound high temperature and drought events in North China based on Copula function. Chin. J. Agrometeorol. 2023, 44, 695–706. (In Chinese). [CrossRef]
- Zhang, X.; Miao, J.; Wang, X.; Zhou, B. Interannual variation of summer compound hot and drought events in Xinjiang and its relationship with the North Atlantic sea surface temperature. J. Clim. 2024, 37(18), 4949–4960. [CrossRef]
- Xiang, X.; Li, Y.; Wu, X.; et al. Delineating the predominant impact of rising temperature on the enhancement of severity in compound drought-hot events in China: An empirical Copula and path analysis-based approach. J. Hydrol. Reg. Stud. 2024, 53, 101769. [CrossRef]
- Chen, L.; Chen, X.; Cheng, L.; Zhou, P.; Liu, Z. Compound hot droughts over China: Identification, risk patterns and variations. Atmos. Res. 2019, 227, 210–219. [CrossRef]
- Li, H.; Li, Y.; Huang, G.; Sun, J. Quantifying effects of compound dry-hot extremes on vegetation in Xinjiang (China) using a vine-copula conditional probability model. Agric. For. Meteorol. 2021, 311, 108658. [CrossRef]
- Wu, H.J. Prediction methods for compound drought and high-temperature events and the mechanisms of predictability [D]. Yangling: Northwest A&F University, 2025. (In Chinese).
- Xu, P.; Wang, D.; Wang, Y.; et al. Dynamic identification and risk analysis of compound dry-hot events considering nonstationarity. J. Hydrol. 2023, 616, 128852. [CrossRef]
- Shi, W.; Zhang, K.; Huang, S.; et al. Widespread declining sensitivity of terrestrial gross primary productivity to compound dry-hot extremes in China. J. Hydrol. 2025, 660, 133387. [CrossRef]
- Xiong, S.; Zhao, T.; Guo, C.; et al. Evaluation and attribution of trends in compound dry-hot events for major river basins in China. Sci. China Earth Sci. 2024, 67(1), 79–91. [CrossRef]
- Huang, Y.S. Evaluation and projection of compound dry-hot events in Northwest China under climate change [D]. Yinchuan: Ningxia University, 2024. (In Chinese).
- Mayila, M.; Wu, X.; Abulimiti, T.; Cheng, H. Characteristics of extreme high temperature and drought over Xinjiang in summer 2023. Desert Oasis Meteorol. 2025, 19(1), 32–39. (In Chinese).
- Shi, T.Y. Characteristics and mechanisms of compound dry-hot events in Northwest China under climate change [D]. Yinchuan: Ningxia University, 2026. (In Chinese).
- Niu, H.H. Variation characteristics and projection of compound extreme temperature-precipitation events in Northwest China [D]. Jinan: Shandong Normal University, 2025. (In Chinese). [CrossRef]
- Sun, Y.; Liu, X.; Ren, Z.; Duan, Y. Spatiotemporal changes of droughts and heatwaves on the Loess Plateau during 1960–2016. Prog. Geogr. 2020, 39(4), 591–601. [CrossRef]
- Yu, R.; Zhai, P. More frequent and widespread persistent compound drought and heat event observed in China. Sci. Rep. 2020, 10(1), 14576. [CrossRef]
- Xu, F.; Luo, M. Changes of concurrent drought and heat extremes in the arid and semi-arid regions of China during 1961–2014. Atmos. Sci. Lett. 2019, 20(12), e947. [CrossRef]
- Pan, X.; Wang, W.; Shao, Q.; et al. Compound drought and heat waves variation and association with SST modes across China. Sci. Total Environ. 2024, 907, 167934. [CrossRef]
- Feng, A.; Zhang, Q.; Gu, X.; et al. Compound drought-heatwaves in China: Driving factors and risks. Nat. Hazards 2025, 121(18), 21283–21303. [CrossRef]
- Zeng, J.; Li, H.; Sun, B.; et al. Summertime compound heat wave and drought events in China: Interregional and subseasonal characteristics, and the associated driving factors. Environ. Res. Lett. 2024, 19(7), 074046. [CrossRef]
- Hou, Q.; Zhang, B.; He, H.; Li, S. Effects of climate change on characteristics of dry-hot wind in Hexi region of Gansu Province. Plateau Meteorol. 2020, 39(1), 162–171. (In Chinese). [CrossRef]
- Li, W.-D.; Seka, A.M.; Kalisa, W.; Zhang, J. Temporal characteristics of compound hot and dry events in Ningxia and their impacts on soil moisture under different land use types. Chin. J. Agrometeorol. 2026, 47(6), 854–866. (In Chinese).
- Yang, Y.; Maraun, D.; Ossó, A.; Tang, J. Increased spatial extent and likelihood of compound long-duration dry and hot events in China, 1961–2014. Nat. Hazards Earth Syst. Sci. 2023, 23(2), 693–709. [CrossRef]
- Zhao, Y.; Wang, L.; Jiang, Q.; et al. Spatiotemporal evolution of compound soil drought-heat events and their impact mechanisms on ecosystem productivity across China. J. Environ. Manage. 2025, 395, 127981. [CrossRef]
- Li, Y.; Wang, J.; Wang, P.-J.; et al. Spatiotemporal variation trends of high temperature, drought, and their compound events of potato in the North Single-planting region. J. Meteorol. Environ. 2026, 42(1), 20–32. (In Chinese).
- Li, Z.; Liu, W.; Ye, T.; Chen, S.; Shan, H. Observed and CMIP6 simulated occurrence and intensity of compound agroclimatic extremes over maize harvested areas in China. Weather Clim. Extremes 2022, 38, 100503.
- Su, H.; Wu, C.; Zhou, S.; Song, X.; Tian, J.; Han, X.; Zhang, X.; Zhang, T. Analysis of the spatiotemporal evolution pattern of the synergistic relationship among high temperature, drought, and CHTDs in climate transition zones. J. Hydrol. Reg. Stud. 2025, 59, 102312. [CrossRef]
- Tang, Y.X.; Huang, G.H.; Kuang, W.S.; et al. Developing a drought-heatwave cluster projection (DHCP) approach for water shortage areas: A case study in Northwest China. Theor. Appl. Climatol. 2025, 156(6), 296.
- Zscheischler, J.; Westra, S.; et al. Future climate risk from compound events. Nat. Clim. Chang. 2018, 8(6), 469–477.
- Shi, T.Y.; Huang, Y.S.; Feng, D.P.; Ge, J.; Kuang, M.Q. Projection of compound dry-hot events in Northwest China based on CMIP6 models. J. Agric. Sci. 2025. (In Chinese). [CrossRef]
- Lv, X.; Chen, S.; Men, B.; Liu, C.; Wang, H. Impact of future regional climate and land use change on compound dry-hot extreme: A case study of the Luan River Basin, Northwest China. Clim. Change 2025, 178, 62. [CrossRef]
- Zhao, R.; Zhou, X.; Liu, J.; et al. Projections of compound wet-warm and dry-warm extreme events in summer over China. J. Hydrol. 2024, 639, 131635. [CrossRef]
- Yuan, Y.; Sun, Q.-H.; Zhou, B.-T.; Xie, W.-X. More prolonged hot, dry, and compound dry–hot events in China than expected based on observation-constrained projections. Adv. Clim. Change Res. 2025, 16(6), 1206–1217. [CrossRef]
- Tang, Z.; Yang, T.; Lin, X.; et al. Future changes in the risk of compound hot and dry events over China estimated with two large ensembles. PLoS ONE 2022, 17(3), e0264980. [CrossRef]
- Liu, T.; Zhang, Y.; Guo, B.; Zhang, S.; Li, X. Substantial increase in future land exposure to compound droughts and heatwaves in China dominated by climate change. J. Hydrol. 2024, 645, 132219. [CrossRef]
- Zhang, Y.; Li, X.; Wang, S.; et al. Characteristics of land-atmosphere coupling in compound dry-hot events in Northwestern China. J. Hydrol. Reg. Stud. 2025, 61, 102754. [CrossRef]
- Yang, Y.; Tang, J. Process-oriented compound long-duration dry and hot events in China: Atmospheric conditions, moisture, and heat budget analyses. J. Clim. 2024, 37(19), 5131–5151. [CrossRef]
- Geng, G.; Zheng, R.; Deng, T.; et al. Widespread decline of gross primary productivity due to compound heat and drought in the Wei River Basin, China. Theor. Appl. Climatol. 2025, 156(12), 692. [CrossRef]
- Shi, Y.F.; Shen, Y.P.; Li, D.L.; Zhang, G.W.; Ding, Y.J.; Hu, R.J.; Kang, E.S. Discussion on the characteristics and trends of climatic shift from warm-dry to warm-humid in Northwest China. Quat. Sci. 2003, 23, 152–164. (In Chinese). [CrossRef]
- Zhang, C.J.; Xie, J.N.; Li, D.L. Influence of East Asian monsoon on arid climate in Northwest China. Plateau Meteorol. 2002, 21, 193–198. (In Chinese). [CrossRef]
- Cai, Y.; Qian, Z.A. Comparative analysis of water vapor field and East Asian summer monsoon between dry and wet years in North China and Northwest China. Plateau Meteorol. 2003, 22, 14–25. (In Chinese). [CrossRef]
- Wu, G.X.; Liu, Y.M.; Wang, T.M.; et al. The influence of mechanical and thermal forcing by the Tibetan Plateau on Asian climate. J. Hydrometeorol. 2007, 8(4), 770–789.
- Yang, Y.R.; Yuan, C.X. Possible causes of compound extreme high temperature-precipitation events in Northwest China. Trans. Atmos. Sci. 2025, 48, 62–76. (In Chinese). [CrossRef]
- Zeng, J.N. Variation characteristics and mechanisms of compound high-temperature and drought events in China [D]. Nanjing: Nanjing University of Information Science and Technology, 2025. (In Chinese).
- Tian, F.; Klingaman, N.P.; Dong, B. The driving processes of concurrent hot and dry extreme events in China. J. Clim. 2021, 34(5), 1809–1824. [CrossRef]
- Ma, Y.; Shen, X.; Zhao, L.; et al. The increase in hot–dry events with a high risk of mortality in China associated with the phase transition of the Atlantic Multidecadal Oscillation. Atmos. Ocean. Sci. Lett. 2025, 18(4), 100609. [CrossRef]
- Wang, S.; Li, X.; Wang, F.; et al. Variation characteristics in compound drought-heatwave events in Northwest China and the relationship with sea surface temperature. Theor. Appl. Climatol. 2025, 157(1), 22. [CrossRef]
- Hao, X.; Sun, F.; Zhang, J.; et al. Vapor pressure deficit governs oasis cooling efficiency and drought intensified water-heat tradeoffs in arid regions. J. Hydrol. 2025, 661, 133804. [CrossRef]
- Zhang, Y.; Li, X.; Wei, W.; Chen, C. Characteristics of consecutive hot-dry-windy events with different severities in China. J. Hydrol. 2025, 662, 133982. [CrossRef]
- Overland, J.E.; Wang, M.; Walsh, J.E.; et al. Future Arctic climate changes: Adaptation and mitigation time scales. Earth’s Future 2016, 4(3), 39–49.
- Zhang, X.L. Changes in summer compound high-temperature and drought events over Xinjiang and their causes [D]. Nanjing: Nanjing University of Information Science and Technology, 2025. (In Chinese).
- Zhang, G.; Wang, H.; Su, X.; et al. Assessing the vegetation vulnerability of Loess Plateau under compound dry and hot climates. Trans. Chin. Soc. Agric. Eng. 2024, 40(6), 339–346. (In Chinese).
- Gao, X.; Xiao, F.; Liu, Q.; et al. Increasing influence of compound dry-hot events on vegetation in northern China in recent years. J. Arid Environ. 2025, 229, 105393. [CrossRef]
- Liu, Z.; Jiao, L.; Lian, X. Impacts of increasing compound hot-dry events on vegetation under the warming-wetting trend in Northwest China. Geogr. Sustain. 2025, 6(2), 100222. [CrossRef]
- Xu, W.; Yuan, W.; Wu, D.; et al. Impacts of record-breaking compound heatwave and drought events in 2022 China on vegetation growth. Agric. For. Meteorol. 2024, 344, 109799. [CrossRef]
- Liang, C.; Yuan, J. The evolving distribution of humidity conditional on temperature and implications for compound heat extremes across China in a warming world. Atmos. Ocean. Sci. Lett. 2025, 18, 100596. [CrossRef]
- Hao, Z.; Hao, F.; Singh, V.P.; et al. Changes in the severity of compound drought and hot extremes over global land areas. Environ. Res. Lett. 2018, 13(12), 124022.
- Mu, S. Spatiotemporal variation and future projection of compound extreme events in China based on CMIP6 [D]. Wuhan: Central China Normal University, 2023. (In Chinese). [CrossRef]
- Liu, Y.; Fang, J.; Mu, S.; et al. Evaluation and future projection of compound extreme events in China using CMIP6 models. Clim. Change 2025, 178(2), 11. [CrossRef]
- He, K.; Chen, X.; Zhou, J.; Zhao, D.; Yu, X. Compound successive dry-hot and wet extremes in China with global warming and urbanization. J. Hydrol. 2024, 636, 131332. [CrossRef]
- Chen, J.; An, A.; Gao, G. A substantial reduction of total and group-specific population risk to compound heat and drought events in China through achieving carbon neutrality. J. Clean. Prod. 2025, 489, 144694. [CrossRef]
Figure 1.
Study area of Northwest China. The labeled landforms and basins are the key regions repeatedly analyzed in the reviewed literature. Drawn by the authors from public administrative boundary data.
Figure 1.
Study area of Northwest China. The labeled landforms and basins are the key regions repeatedly analyzed in the reviewed literature. Drawn by the authors from public administrative boundary data.
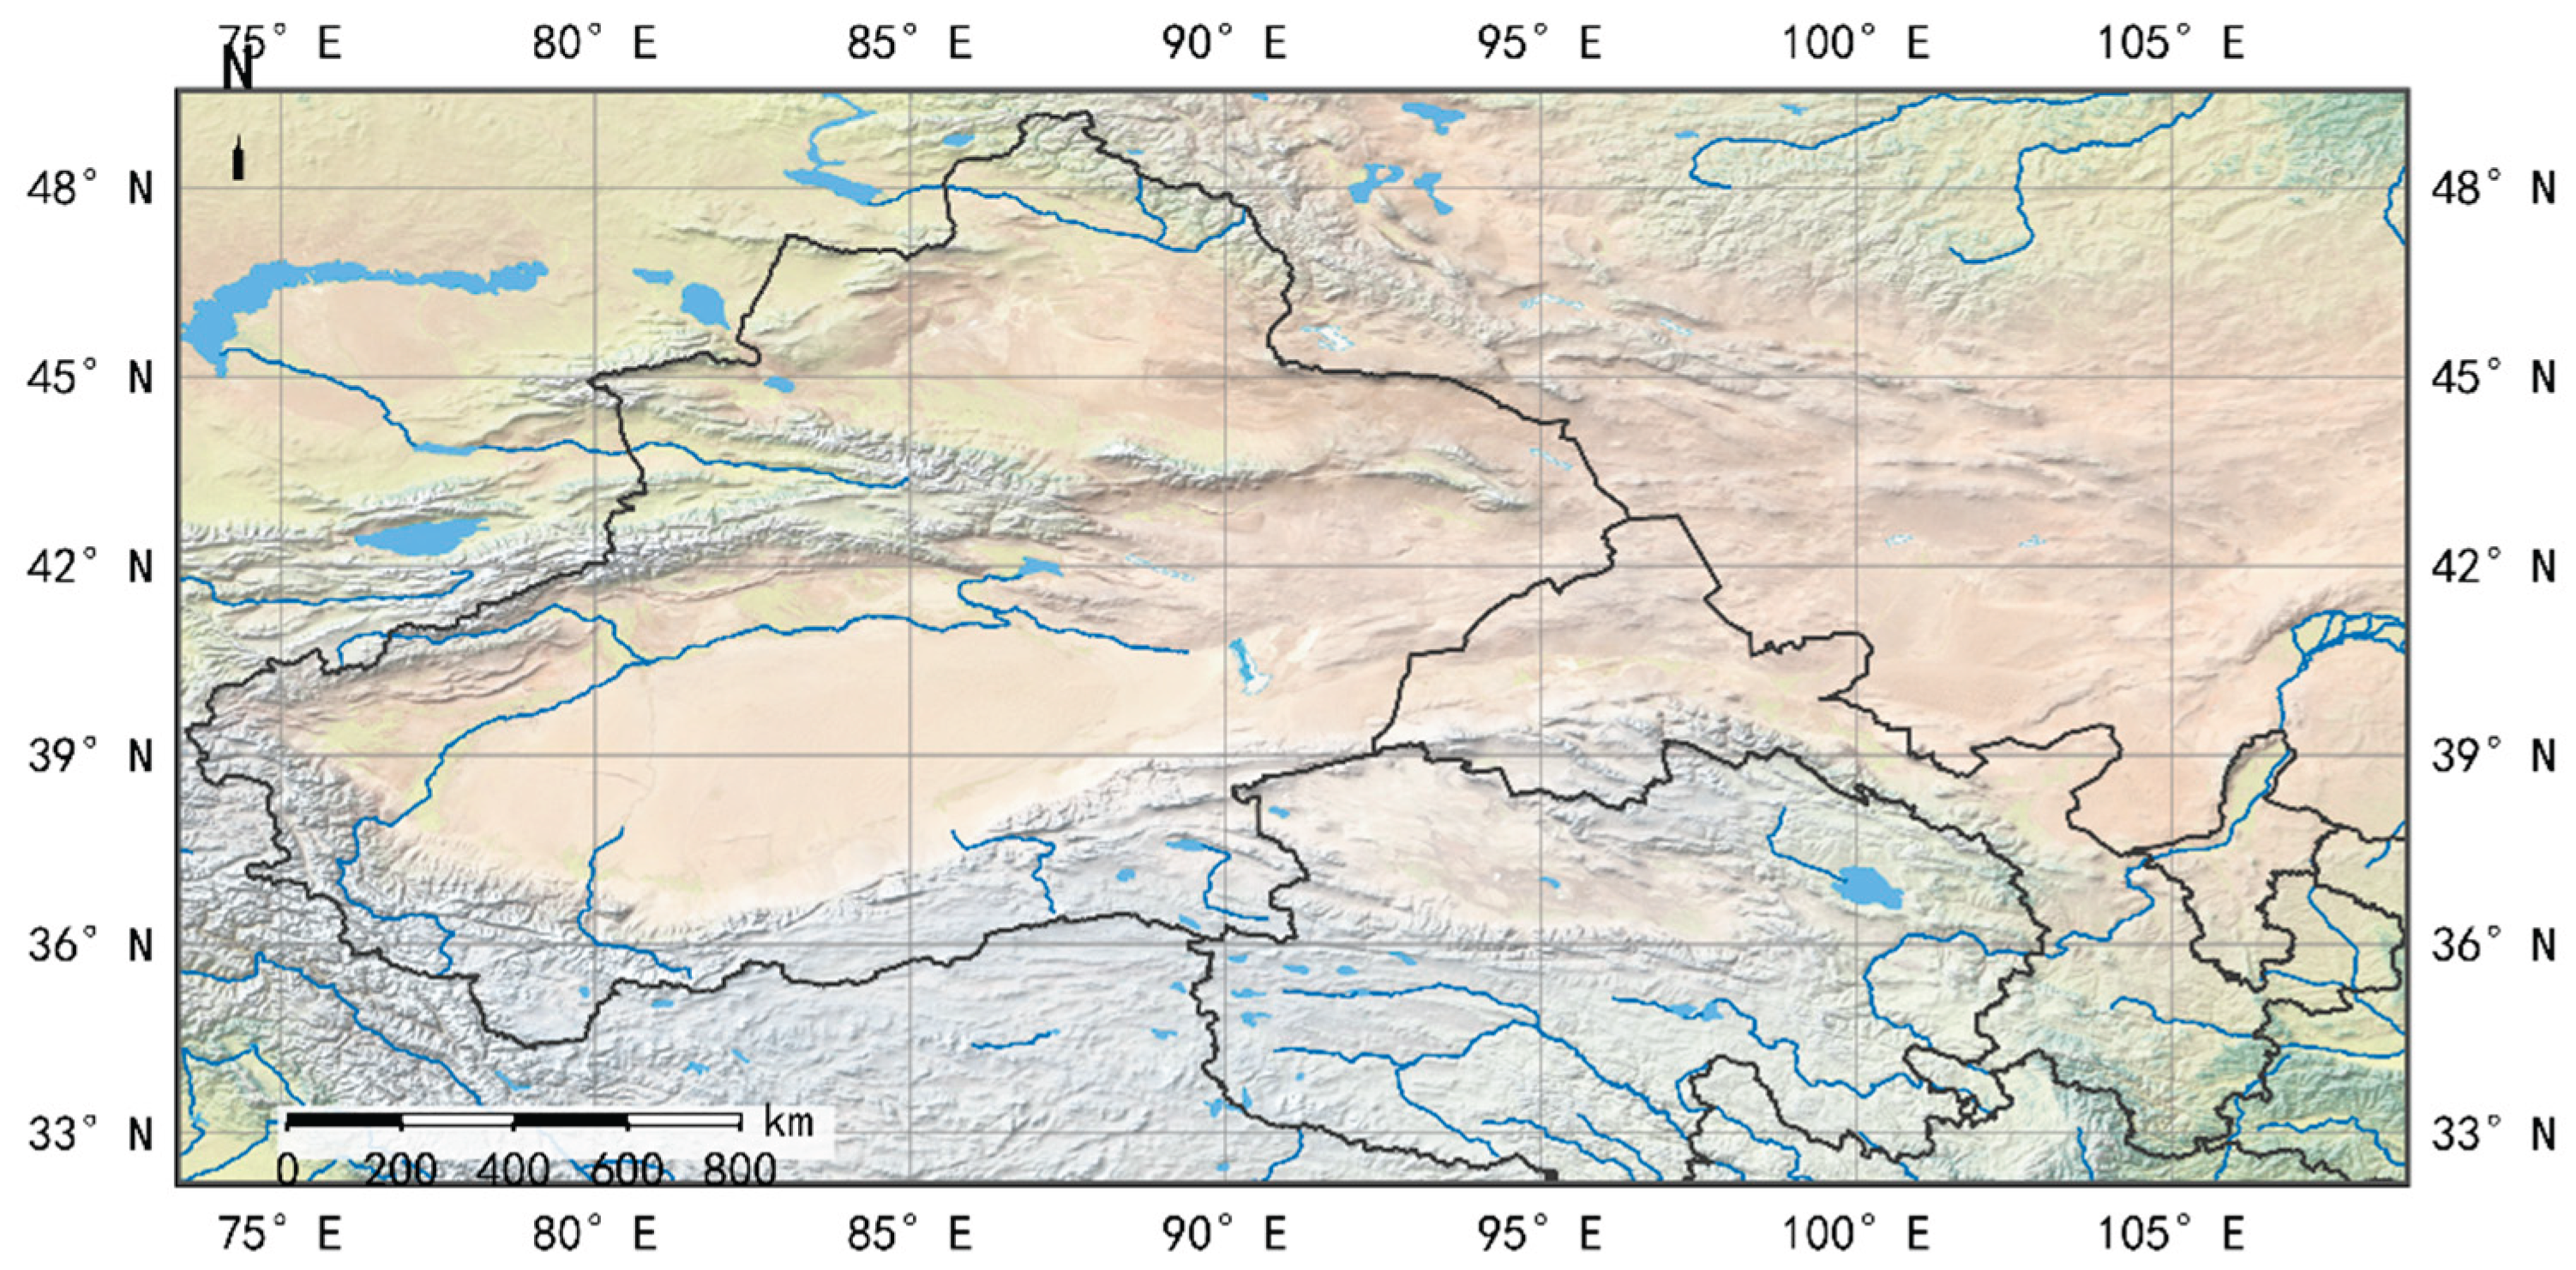
Figure 2.
PRISMA 2020 flow diagram of the systematic review (identification, screening, and inclusion of studies).
Figure 2.
PRISMA 2020 flow diagram of the systematic review (identification, screening, and inclusion of studies).
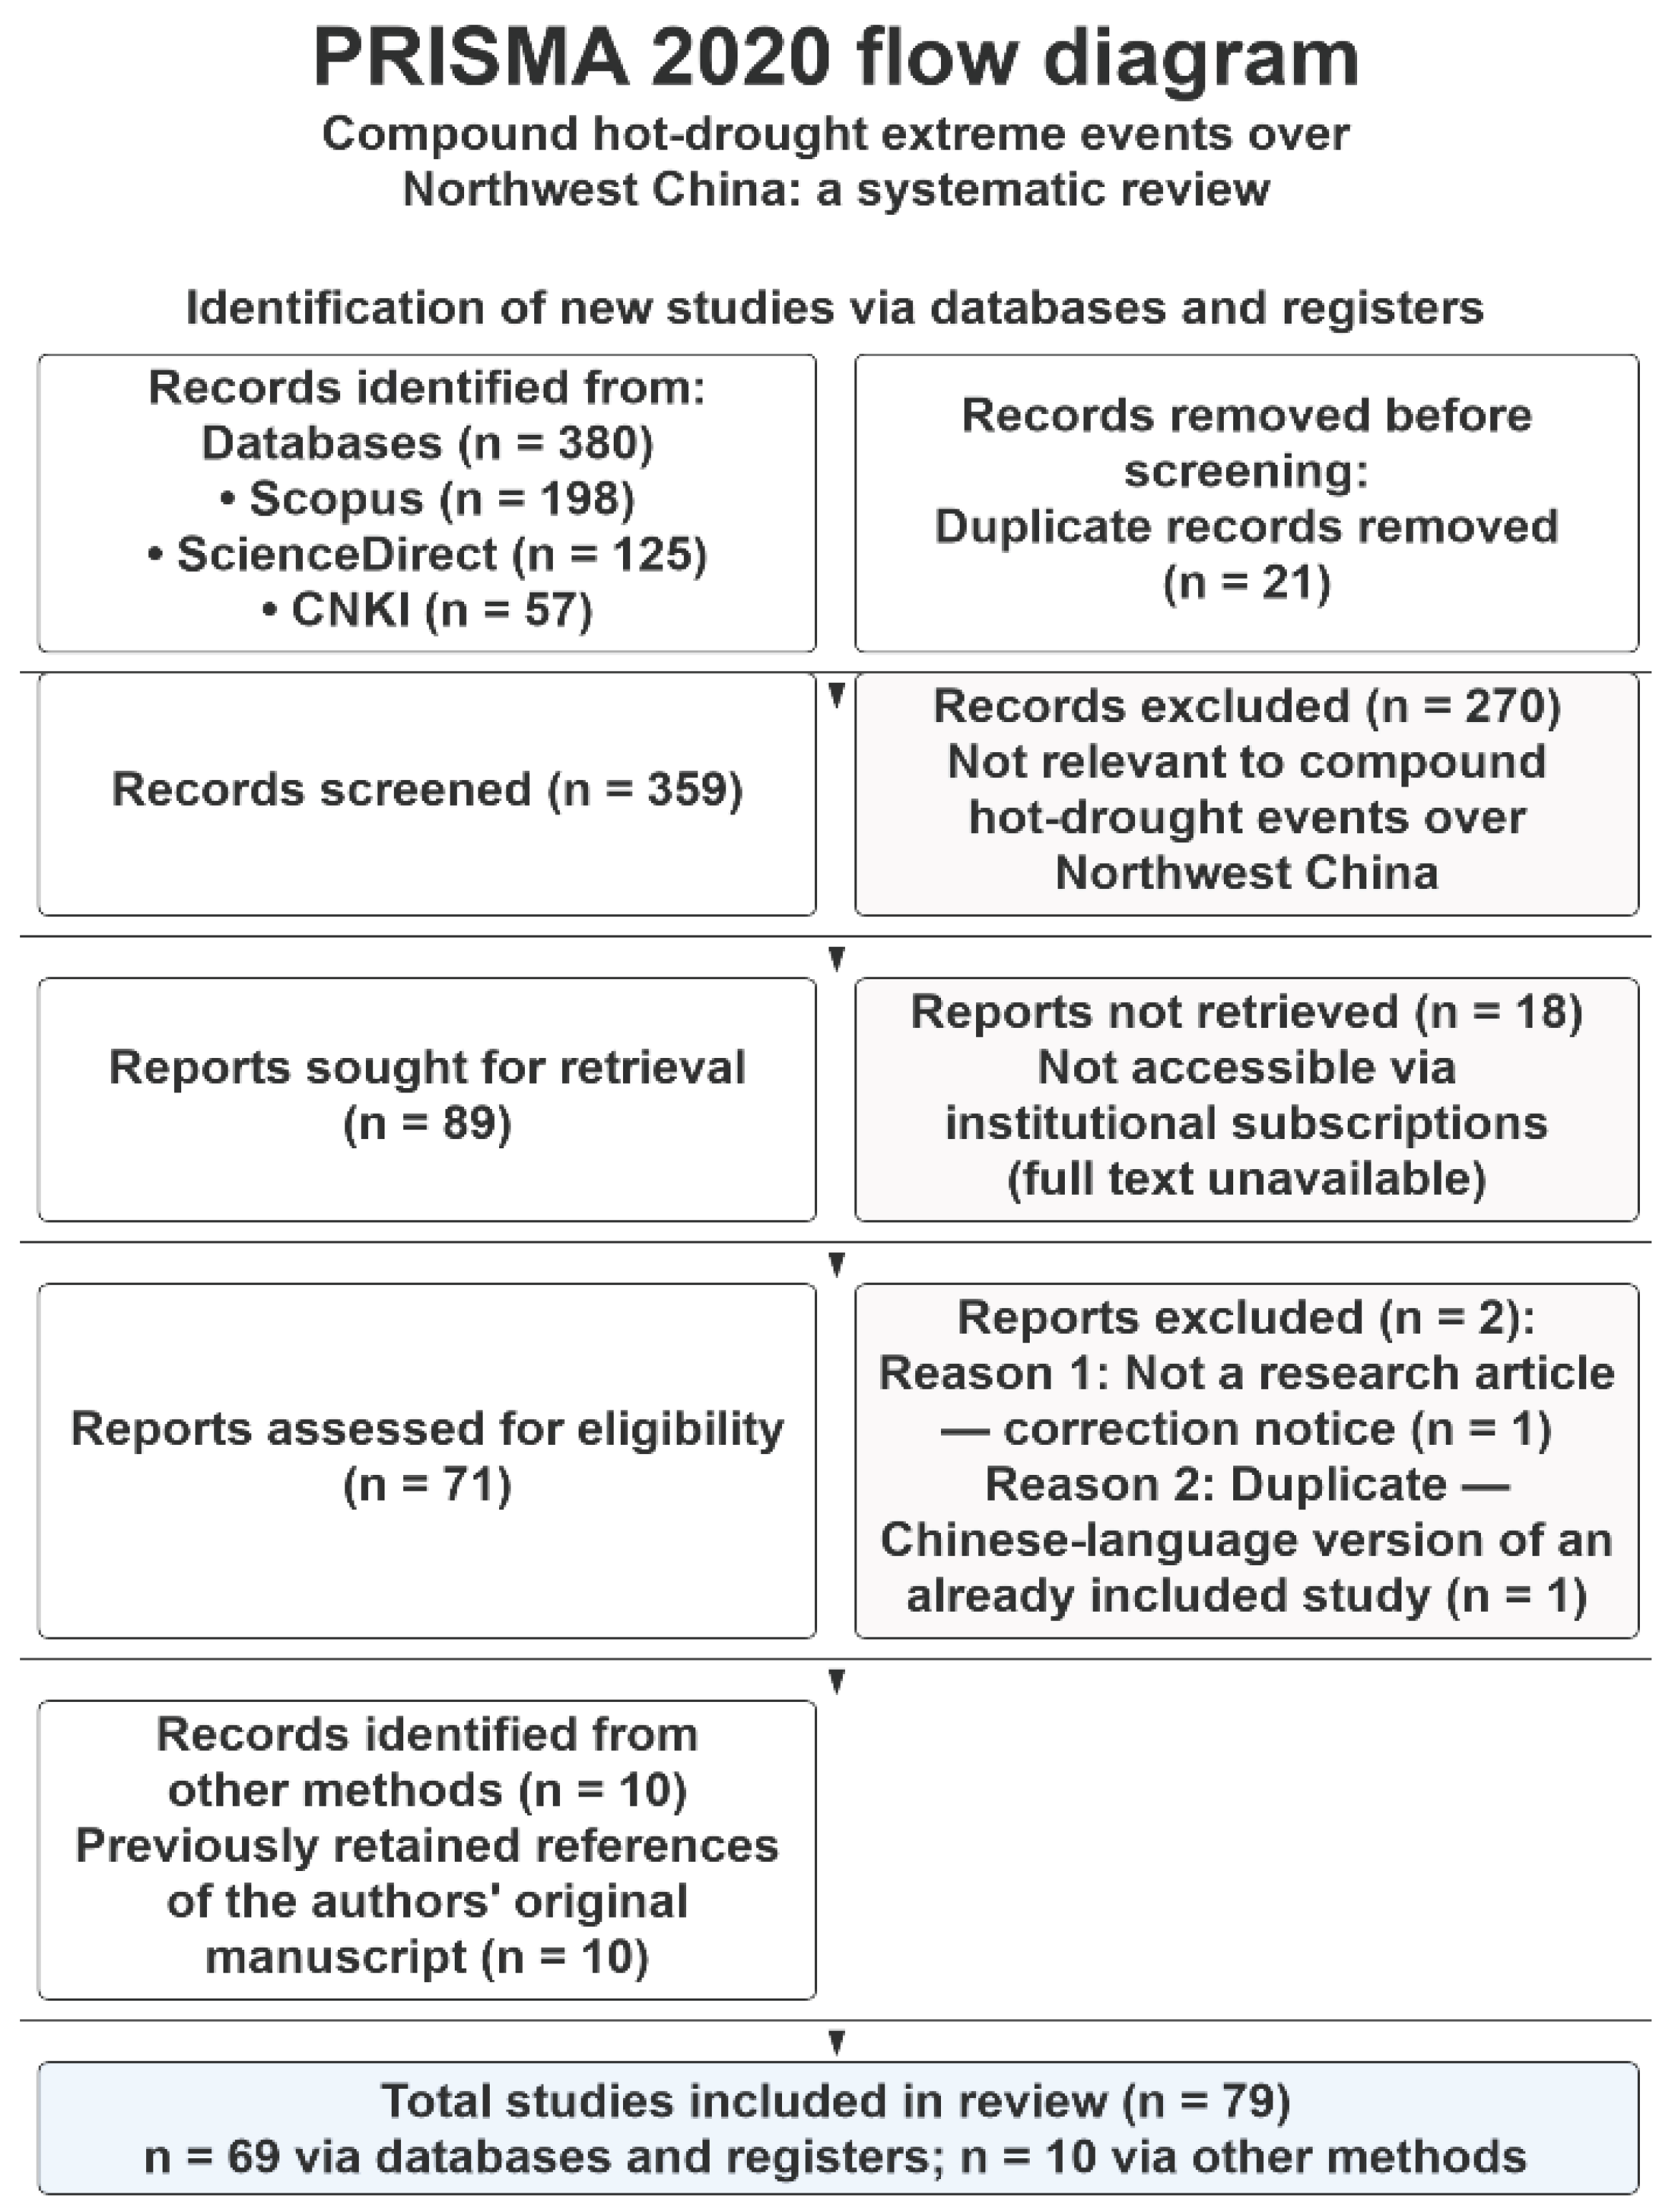
Figure 3.
Current progress and future directions for CHDEE in Northwest China. Summarizes this research system in four progressive layers: identification methods (Section 3), spatiotemporal characteristics (Section 4), formation mechanisms (Section 5), and current limitations together with future directions (Section 6). Methodological choices (threshold-, index- and Copula-based identification) feed directly into the observed spatiotemporal features. These features are in turn explained by multi-scale mechanisms: large-scale circulation, Tibetan Plateau thermal forcing and the soil moisture–temperature feedback. The identified gaps and future avenues then feed back to refine identification and projection methods.
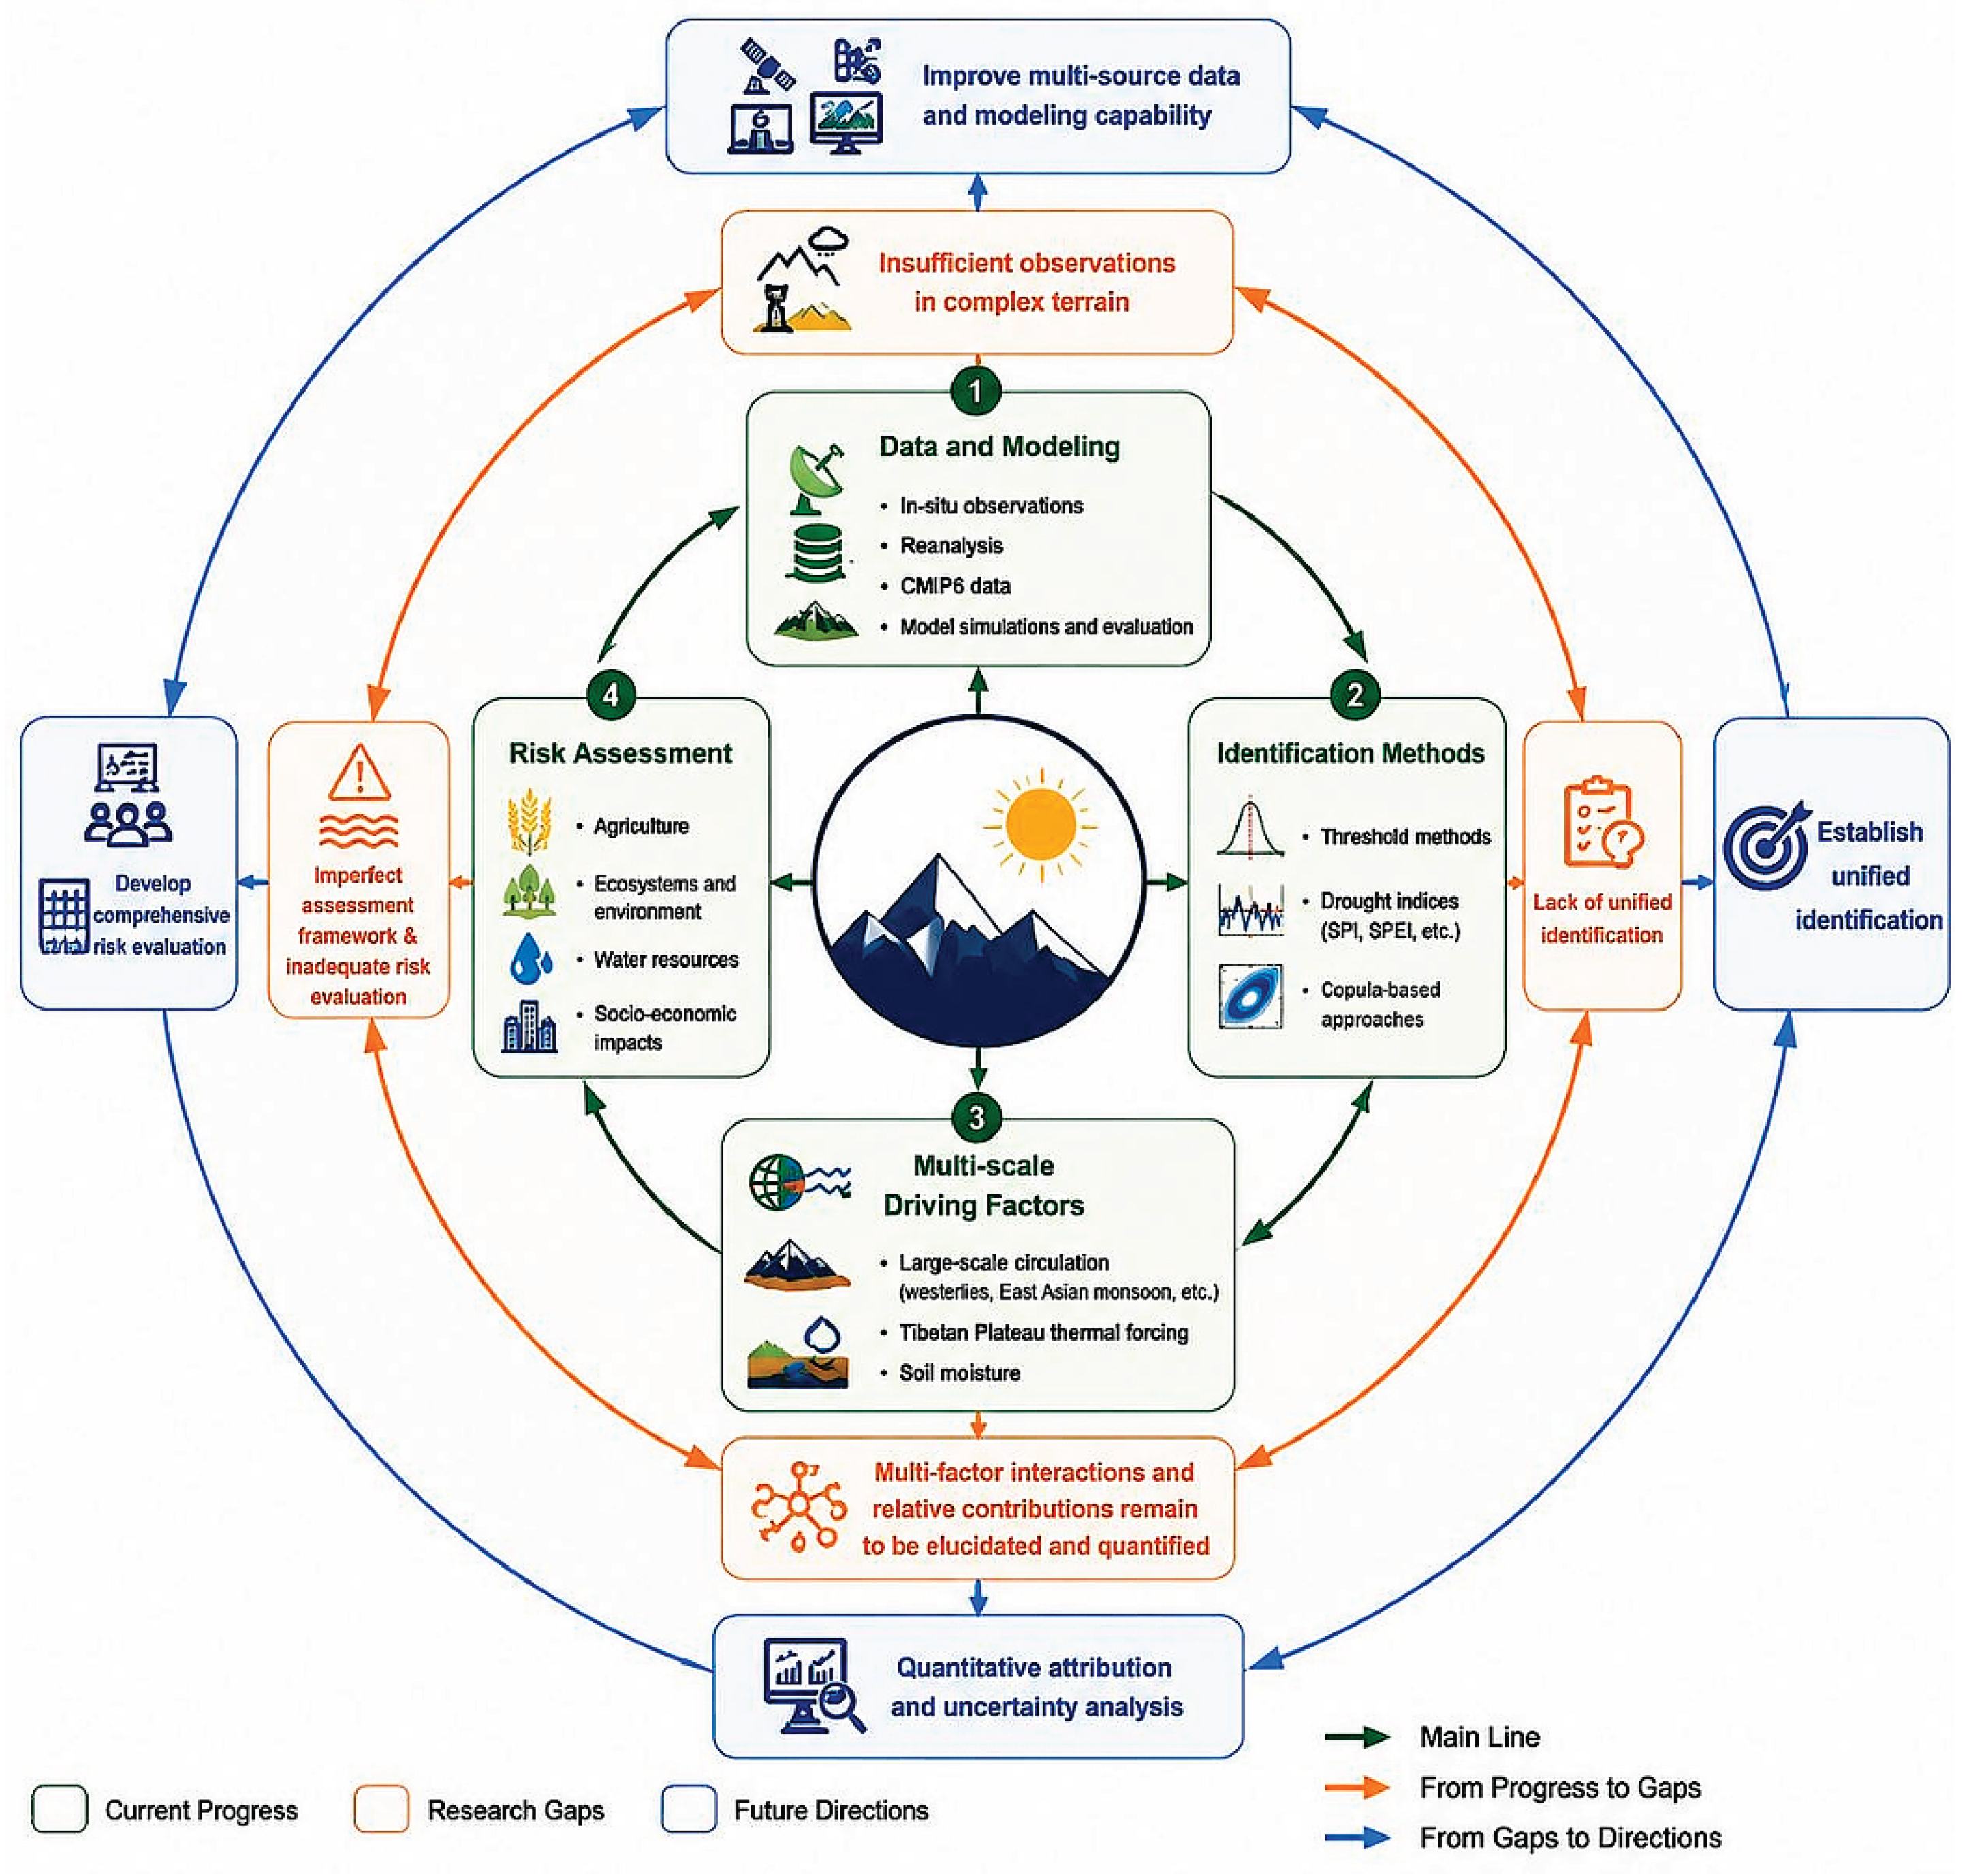

Table 1.
Cross-study synthesis of included studies: region, study period, dataset, index/threshold, time scale, and key findings.
Table 1.
Cross-study synthesis of included studies: region, study period, dataset, index/threshold, time scale, and key findings.
| Study | Study region | Study period | Dataset | Index/threshold | Time scale | Key findings |
|---|---|---|---|---|---|---|
| Zhang X. et al., 2024 [43] | Xinjiang | 1961–2018 | 102-station observations | Probability index PI (Gumbel Copula) | Monthly | Consistent significant increase across Xinjiang; North Atlantic tripole SST → jet northward shift → subsidence warming and drying (validated by CAM4 experiments) |
| Zhang Y. et al., 2025 [76] | Whole of Northwest China | 1962–2020 | ERA5 | Daily SPEI + heatwave intensity → CDHMI | Daily | Frequency/duration/intensity increased (significant in the east); soil moisture deficit → positive feedback converting net radiation into sensible heat |
| Feng Y. et al., 2023 [31] | Nationwide (strongest in the Northwest–Tibetan Plateau transition) | 1961–2014 | Stations/grids | Relative thresholds T85∩P15 / T75∩P25; SDHI | Daily | Heat extremes drive frequency (contribution 55–78%), dry extremes drive intensity (63–70%) |
| Zeng J. et al., 2024 [60] | Eight sub-regions nationwide (highest in eastern Northwest) | 1961–2022 | CN05 gridded | Monthly probability index PI | Monthly | Severe compound hot-drought events increased since the 1990s; highest frequency in southwest and eastern Northwest China |
| Yang Y. & Tang J., 2024 [77] | Nationwide | 1961–2022 | CN05.1 + ERA5 | Process-oriented long-duration SLDDH identification | Daily | Events accompany anomalous high pressure, enhanced subsidence and increased net radiation; precipitation deficits dominated by dynamical subsidence |
| Qian T. et al., 2024 [14] | Northwest China | 1961–2022 | Grids/stations | 3-month SPI + STI → SCEI/BDHI (Copula) | Monthly | BDHI outperforms SCEI; comprehensive risk increase after 1994; area proportions of mild/moderate/severe 35/25/10% |
| Sun Y. et al., 2020 [55] | Loess Plateau | 1960–2016 | Stations | T90 heatwave threshold + SPI1 < −0.8 | Daily | Concurrent events increased by 0.66 events/decade; northern Ningxia is a significant increase area |
| Zhao L. et al., 2023 [33] | Nationwide (parts of Northwest/Southwest as exceptions) | 1968–2019 | Stations | Daily SPI30 + STI(7d) ≥ 3 consecutive days | Daily | Half-century overall intensification; higher indicator values in warm periods but slower or even reversed growth |
| Xiang X. et al., 2024 [44] | Nine sub-regions nationwide (incl. inland river basins) | 1901–2022 | CRU 0.5° | Empirical Copula CDHI (SPEI + STI) | Monthly | Temperature rise dominates intensity enhancement over recent 60 years; affected-area increase rate doubled versus earlier period |
| Li W.-D. et al., 2026 [62] | Ningxia | 1981–2020 | ERA5-Land + CHIRPS | SCDHI; quantile regression | Daily | Stepwise increases concentrated in July–August; differentiated responses of land-use types to drought–soil moisture |
| Shi T.Y. et al., 2025 [70] | Northwest China | 2025–2100 | 9 CMIP6 models | Seasonal SPEI + Penman–Monteith | Seasonal | Future heat increases and drought decreases (polarization); stronger distribution under high-emission scenarios |
| Zhang X., 2025 [12] | Xinjiang | 1961–2020 | CN05.1 + ERA5 + CAM4 + CMIP6 | Compound event definition + optimal fingerprint attribution | Daily | Uniform increase + opposite dipole mode; North Atlantic SST atmospheric bridge; detectable external forcing attribution |
| Shi W. et al., 2025 [49] | Nationwide | 1982–2018 | CRU + NIRv-GPP | Copula + sliding window + ridge regression | Monthly | GPP lags by 1.6–1.8 months in >60% of vegetated areas; sensitivity declines for mild events (adaptation enhancement) |
| Geng G. et al., 2025 [78] | Wei River Basin | 1961–2022 | STI/SPI + GPP | Meta-Gaussian joint probability | Monthly | GPP decline probability 63–90% under compound conditions; grassland/cropland most vulnerable |
| Mayila et al., 2025 [52] | Xinjiang | 2023 (case) | Observations | Absolute threshold Tmax ≥ 35 °C + MCI ≥ moderate drought | Daily | 2023 record-breaking case; Iranian high + western Pacific subtropical high + South Asian high subsidence warming |
| Tang Z. et al., 2022 [74] | Nationwide (incl. Northwest) | Future projection | Two large-ensemble simulations | Compound dry-hot event definition | — | Return period of once-in-a-century events shortens to 4–5 years under 4 °C warming |
| Yu R. & Zhai P., 2020 [56] | Nationwide (persistent events in Northwest) | 1961–2016 | Observations | Daily-scale persistent event identification | Daily | ~5%/decade increase since the late 1990s; spatial extent expansion |
| Wu X. et al., 2020 [40] | Nationwide | 1961–2016 | Stations | Multivariate multi-index severity assessment | Monthly | Severity generally increased; index choice significantly affects results |
Note: this table is a synthesis compiled by the authors from the studies included via the PRISMA systematic search; representative studies are selected to illustrate methodological and result differences. The Index/threshold column reflects differences among studies in drought indices, heat thresholds and identification methods.
Disclaimer/Publisher’s Note: The statements, opinions and data contained in all publications are solely those of the individual author(s) and contributor(s) and not of MDPI and/or the editor(s). MDPI and/or the editor(s) disclaim responsibility for any injury to people or property resulting from any ideas, methods, instructions or products referred to in the content. |
© 2026 by the authors. Licensee MDPI, Basel, Switzerland. This article is an open access article distributed under the terms and conditions of the Creative Commons Attribution (CC BY) license (http://creativecommons.org/licenses/by/4.0/).
Copyright: This open access article is published under a Creative Commons CC BY 4.0 license, which permit the free download, distribution, and reuse, provided that the author and preprint are cited in any reuse.