
Submitted:
09 October 2026
Posted:
10 October 2026
You are already at the latest version
Abstract
The increasing use of connected devices in medical laboratories generates diverse Internet of Medical Things (IoMT) settings whose real network architecture is not yet well understood. Therefore, in this multicentric in situ evaluation of IoMT topologies in eight fertility and andrology laboratories in Morocco (n=5 for assisted reproductive technology (ART); n=3 for andrology), our main objective is to classify the topology for each laboratory based on the biosensitive sample (gametes and embryos) analysis site, with topology reconstruction. The topology classification and centrality analyses included degree, density, betweenness, and closeness. Networks consisted of 14–34 nodes and 13–33 edges with densities of 0.06–0.14. Despite the large disparities in network scale, technology, and architecture, all eight networks fulfilled (E=N-1), suggesting a common sparse tree-like backbone at the core of star-centric and hybrid star-cellular architectures. Centrality profiles revealed significant site-specific organization, with maximum degree centrality from 37% to 82% and maximum betweenness from 71% to 99%, indicating highly centralized networks and structural bottlenecks. These results provide an empirical baseline for future optimization scenarios in ART and andrology laboratories with IoMT, considering the risk of electromagnetic interference linked to sensitive biological samples and the maintenance of equipment.
Keywords:
Internet of Medical Things
; assisted reproductive technology
; andrology
; medical laboratory
; network topology
; betweenness centrality
; degree
; bottleneck
; hybrid topology
1. Introduction
The Internet of Things (IoT) has gradually revolutionized how physical items interact with their surroundings by detecting, communicating and exchanging data. This evolution is intrinsically heterogeneous, merging devices, protocols and communication technologies that were not necessarily designed to work as a single system [1]. In the healthcare sector, this notion is extended to the Internet of Medical Things (IoMT), where medical devices, monitoring systems, computing resources and communication infrastructures form part of the same connected environment. The network is therefore more than a communication support: the structural structure of the whole system can be defined by how the devices are connected, through which nodes and according to whose architecture. In this context, gateways and border routers have a key role as they may connect heterogeneous communication domains and aggregate connection among otherwise disconnected components [2].
This question is given a special slant in medical laboratories. These settings are smaller than hospital-scale infrastructures but are very specialized and can concentrate on medical equipment, computers, access points, gateways, monitoring devices and many wireless technologies in a confined space. IoT is already widely established in clinical laboratories. Munir et al. [3] in their systematic review on 18 studies showed that 77.8% of the methods evaluated were tried in real situations and communication-based applications accounted for 83.3% of the studies. However, most of this work focused on the IoT from the standpoint of what the linked system performs, e.g., sensing, communication, monitoring, or automation, and not how the entire network is physically organized.
This gap is especially important in assisted reproductive technology (ART) where networked systems operate around highly controlled laboratory processes and sensitive biological samples. For example, Sra et al. [4] showed the potential of continuous IoT-based environmental monitoring in an IVF embryology facility. Such investigations indicate the practical relevance of connected technologies in reproductive laboratories but provide little information on the topology generated by the whole set of devices and communication equipment. Simple structural characteristics such as the number of nodes and edges, network density, degree or node centrality are hardly examined. Thus, we know that IoT can be deployed in these laboratories, but we still know very little about the network architecture that develops when various technologies coexist in an operational context.
At the same time, the science of networks gives a quantitative framework to answer this subject. Hospitals, healthcare providers, departments and patient-transfer systems have been modelled as graphs with nodes representing interacting entities and edges representing relationships [5,6]. Metrics like degree, density, betweenness, closeness and the like can uncover structural features that are not obvious from a mere inventory of the network’s components. These criteria are also complementary: a node with numerous direct connections is not necessarily the node that occupies the most significant intermediary position in the network [7,8,9]. However, this graph-based perspective has primarily been utilized at the hospital, provider or patient-flow levels and far less to device-level IoMT infrastructures in medical laboratories.
Scale makes this comparison more difficult. A big healthcare network can have thousands of nodes but be sparse, while a laboratory may have only a few tens of connected components but organize them around a restricted number of key nodes. Thus, density should be viewed as a measure of complexity in conjunction with network size and connectivity rather than in isolation. In general, realistic physical topology and node-degree arrangement determine the pathways available through a network [10]. This is especially true in ART and andrology labs, where local wireless connectivity, access points, medical devices, computing systems, gateways and cellular infrastructure may all co-exist and form star-centric, distributed, or hybrid topologies.
Representative real-world network topologies, however, are difficult to obtain. This constraint has in turn encouraged the development of topology generators. For example, Alrumaih and Alenazi [11] proposed GENIND to construct realistic graph-based IIoT topologies and verify it against real industrial networks. More modern approaches take it one step further and regard the topology as a design variable that may be modified based on localization, energy, link selection, and communication-reliability constraints [12]. Such developments point out a crucial aspect: before questioning how an IoT topology should be simulated or optimized, one needs to know how it is organized in the field.
This is where the present study stands. The literature identified suggests that laboratory IoT research and healthcare network science have evolved along mostly complementary paths. The former illustrates the feasibility and utility of connected applications, and the latter offers quantitative tools to describe network structure. This has been insufficiently investigated at the level of specialized reproductive-health laboratories, especially through multicentric in situ observation. It is thus unclear if separately operated ART and andrology laboratories converge to a recurring IoMT organization or if their topology is essentially site-specific.
Therefore, we studied eight ART and andrology laboratories in three Moroccan towns including five ART facilities and three andrology laboratories within the same in-situ analytical framework. Each operational network was not based on a fixed design but was re-assembled as a standalone graph G = (V, E) using the observed devices, infrastructure and connectivity relationships. Comparison of global organization and the structural location of individual nodes across sites was then carried out based on network size, edges, degree, density, topological configuration, and degree, betweenness and closeness centralities.
Within this context, the study examines two closely connected questions: is there a recurrent topological organization across fertility and andrology laboratory IoMT networks, and how much does this organization differ across independently deployed sites? This multicentric approach aims at providing a structural baseline for future spatial, resilience, communication-performance, and optimization studies and at establishing an empirical basis for topology-informed IoMT deployment in specialized medical laboratories by shifting from assumed to observed topology.
2. Materials and Methods
2.1. Study Design
A multicentric observational study was conducted to characterize network topologies in real-world fertility and andrology laboratories. The study used an in-situ design, documenting the existing network organization at each site without modifying the infrastructure or introducing an experimental configuration.
Data were collected between February 2023 and April 2025 in 8 laboratories located in Rabat, Casablanca, and Marrakech, Morocco. The study included 5 assisted reproductive technology (ART) centers and 3 andrology laboratories. Each laboratory was first analyzed independently, followed by a cross-site comparison to identify recurrent and site-specific topological patterns. The analyzed topology of each laboratory was conducted indoor and outdoor taking in consideration the cellular links.
The analytical workflow consisted of 5 sequential steps: (i) identifying network devices and communication infrastructure; (ii) characterizing connectivity among the identified components; (iii) reconstructing each laboratory network as a graph; (iv) calculating structural and node-level graph metrics; and (v) classifying network topologies and comparing the laboratories (Figure 1). This protocol was standardized throughout the eight study sites.
2.2. Study Sites
This interdisciplinary multicentric study is a part of the convention project “IoT Fertility” led by the research team in Smart Communications-ERSC in Engineering at Mohammadia School in collaboration with the Laboratory of Physiology and Physiopathology, and Center of Experimental Reproductive Animal Model Management—CERAM at the Faculty of Sciences at Mohammed V University, Rabat, Morocco. It included eight medical laboratories as collaborators of the IoT Fertility Project with signed consent, specialized in fertility treatment, divided into five different ART centers (African Fertility Center, IRIFIV Fertility Center, IVF Center Al Boustane Clinic, Fertility Center Cheikh Zaid, and Marrakech Fertility Institute) and three andrology laboratories (Labomac, Medical Laboratory Benamar, and Center of Biology Souissi). Those eight fertility laboratories are localized in three different regions in Morocco, as the main ones with high technological use (Rabat, Casablanca, and Marrakech), representing diverse environmental and technological settings. This study was conducted over two years, from February 2023 to April 2025, combining detailed in situ network topology IoMT characterization for each fertility and andrology laboratory.
The eight sites were selected to represent two specialist reproductive health laboratory settings: ART and andrology. Five sites were classed as ART centers, and three as andrology laboratories. To allow for comparison study, each site was handled as an individual network rather than by grouping all devices into one multicentric graph. We used this site-level technique since the goal was to define the local topology of each of the laboratories and then assess whether comparable structural patterns were present across independent contexts. Figure 1 summarizes the geographic location and the laboratory category of the participating locations. Laboratories were categorized as L1–L8 identified by their institutional names to maintain site confidentiality in the comparative analysis.
2.3. Ethical Considerations
The data collection for the in-situ characterization of topological IoMT networks in eight fertility and andrology laboratories was carried out by means of measuring techniques, integrated with physical modelling. The data obtained consisted of infrastructure and inventory of IoMT devices, the network used, the metric space measures, location coordinates (at room/building level), and ambient factors. These data were entirely anonymized, and no private, personal, or institution-identifying information was disclosed or recorded. Indeed, data collection involved no human subjects, no clinical data, and posed no risk of identification or harm, respecting our alignment with international guidelines on non-invasive environmental research, which will require institutional ethical approval.
2.4. Network Identification, Topology Reconstruction and Connectivity Characterization
Based on the ideas in network science [13], each of the eight laboratories was treated as an individual IoMT network and plotted as a graph:
where V represents the set of identified nodes and E the set of observed connections between them.
G = (V,E)
Network identification was performed in situ, starting from the real spatial layout of the communication infrastructure and associated equipment in each fertility or andrology laboratory. Depending on the site, nodes comprised network-enabled medical or laboratory IoMT devices, laptops and workstations, wireless access points, routers, mobile devices, monopoles/antennas, and other communication components. Edges were constructed to show a direct communication or network association found between two components. Each unique pair of nodes is counted only once. Wi-Fi, Bluetooth, cell phone, RFID and cable communication were explored where available. The technology category was used to describe architectural heterogeneity regardless of signal intensity or electromagnetic exposure.
Network transcription and reconstruction of the topology were accomplished in the graph-drawing environment yEd/yEd Live (yWorks GmbH, Tübingen, Germany; https://www.yworks.com) that enables node-edge editing, annotation and some graph-layout techniques.
The reconstruction process was modified from approaches previously used to turn physical or geographical network maps into graph representations [14,15,16]. In fact, Knight et al. [14] have utilized yEd to directly draw network elements on source maps and stressed the visual comparison between the original map and transcribed graph to mitigate transcription problems. Here we followed a similar step-by-step procedure (Figure 2): communication elements and their links were identified on the laboratory floor plan (Figure 2a), separated from non-network spatial information (Figure 2b), and then transcribed as nodes and edges to produce an abstract representation of the network (Figure 2c). Node labels and technological categories were preserved in the transcription process, such that the rebuilt graph could be visually cross-checked with the original laboratory map prior to topology identification (Figure 2d). Graphical node positions after reconstruction were simply utilized to improve the visual readability of the structure and were not intended to convey any physical distance, signal strength or connection quality.
After network reconstruction, the topology of each laboratory was defined in terms of its graph-level organization and the underlying communication architecture. Star, tree and mesh are well-known network topologies commonly discussed in network science and IoT/WSN designs [13,17,18]. Star and tree designs usually are linked to centralized or hierarchical communications, whereas mesh architectures are built on various inter-node pathways and provide for increased connection redundancy [18,19]. The laboratories under investigation used a mix of local network structures and heterogeneous communication technologies. Extra operational categories were used to characterize cellular components and composite designs. Specifically, the hybrid star–cellular was characterized in the present study as a local network with star center coexisting with one or more cellular-dependent nodes or communication branches (Table 1).
Connectivity was measured in a uniform way throughout the eight rebuilt networks by number of nodes (N), number of edges (E), node degree (ki), mean degree = 2E/N, and network density D = 2E/[N(N − 1)].
Further, to characterize node-level organization, we computed degree, betweenness and closeness centralities to identify highly connected nodes and components in important intermediary or topologically proximal positions [7,8,20,21]. This distinction matters because connection in real networks is heterogeneously distributed and the node with the biggest number of direct links is not necessarily the one occupying the most crucial location for network-wide communication. Short pathways may favour effective information sharing and device-function interactions [22,23] and centrality analysis can help identify hubs and structurally essential intermediaries in healthcare networks [6]. Network density was thus understood in conjunction with network size, degree distribution and centrality, rather than as a metric of network complexity.
Communication technologies contributing to the reconstructed topology were recorded according to their presence within each laboratory, including Wi-Fi, Bluetooth, cellular communication, RFID, and/or wired connectivity when applicable. Technology type was used to characterize network heterogeneity but was not treated as a measure of signal strength or electromagnetic exposure.
Workflow for in-situ identification and reconstruction of laboratory IoMT network topology. (a) Spatial mapping of connected devices and communication infrastructure within the laboratory environment. (b) Extraction of identified connectivity relationships from the physical layout. (c) Abstraction of the observed infrastructure into a node–edge graph using yEd Live (yWorks GmbH, Tübingen, Germany), with communication components represented as nodes and identified network associations as edges. (d) Structural examination and classification of the reconstructed network according to its dominant topological organization. Graphical node positions in the reconstructed network were used for visualization and do not represent physical distance or signal strength.
2.5. Centrality Analysis
Centrality analysis was performed on the reconstructed networks to see if connectivity was concentrated around some components and to discover the structural functions played by nodes. Three complimentary variables were considered: degree, betweenness and closeness centrality. Degree centrality, which represents the number of direct links a node has, was consequently used to discover highly connected components or local hubs. Betweenness centrality counts the number of times a node lies on the shortest pathways between pairs of other nodes, and so it highlights components that are in an intermediary location in the network. Closeness centrality, in contrast, measures how topologically close a node is to all other reachable nodes. These measures were analysed jointly, not interchangeably, since the importance of a node depends on the structural property captured by a given metric and the type of network process being considered [7,8,20,24,25].
2.6. Graph Metrics and Inter-Laboratory Comparison
Each reconstructed laboratory network was quantitatively defined by a small number of graph metrics, selected to reflect network size, connectedness, density and distribution of structural relevance among the nodes. The size of the network was described as follow:
The number of nodes was defined as:
N = |V|
and the number of observed edges as:
avu represent the direct link between two nodes where:
These two parameters provided the basic structural size of each laboratory network.
Additionally, for each node vi, degree ki corresponded to the number of direct edges incident on that node whereas, Degree Connected (DC) to many other nodes [7] is defined as:
For an undirected graph, mean degree was calculated as:
The maximum observed degree kmax was also recorded to identify the most directly connected node within each laboratory.
Regarding the Network density, it was calculated as the proportion of observed edges relative to the maximum number of possible edges:
For an undirected simple graph, density ranges from 0 to 1, with higher values indicating that a larger proportion of theoretically possible node-to-node connections is present. Because density is dependent on network size, it was interpreted jointly with N, E, and mean degree rather than as an independent measure of network complexity.
Three complementary centrality measures were used to characterize the structural role of individual nodes. Degree centrality was chosen to identify highly connected nodes, and it quantified the proportion of network nodes directly connected to a given node:
For each node v, degree d(v) = kv corresponded to the number of direct edges incident on that node. Additionally, betweenness centrality quantified the extent to which a node occurred along shortest paths between other pairs of nodes [7]:
where guw is the number of shortest paths between nodes u and w, guw(v) is the number of the shortest paths between u and w passing through node v.
Concerning normalized betweenness centrality named also as Communicability betweenness (CBC) taking part in many walks between pairs of other nodes [26] are represented as:
Closeness centrality also called shortest-path closeness (Cc(v)) described the topological proximity of a node to all other reachable nodes in the network and was calculated from shortest-path distances [27]:
where d(v,u) represents the length of the shortest path between nodes v and u.
The three metrics were interpreted independently since the node with the biggest number of direct connections does not necessarily have the strongest position of intermediate or the greatest topological proximity to the remainder of the network. Therefore, degree, betweenness and closeness reflect complementary elements of nodal organization, and their rankings might converge or diverge depending on the underlying network topology [8,9]. Analogous distinctions between direct connections, intermediary positions and network proximity have been used in analyses of healthcare networks [6,28].
Node centrality measures and graph level metrics were also introduced to present a comparable structural profile for each laboratory. Some measures define a local connection while others represent the position of a node within the complete network [29,30,31]. Their contribution may be partly overlapping depending on the underlying topology [9]. Therefore, their concordance or discordance was investigated in the light of the rebuilt network architecture, especially when considering the question whether highly connected nodes also occupy major intermediary positions. Network density was considered in relation to network size and number of edges, such that higher density is not directly read as increased network complexity in smaller networks. As a further spatial parameter of the laboratory architecture, the number of network nodes in the proximity of the biological-sample sections was documented for descriptive purposes, but this was not regarded as a direct measure of electromagnetic interference or exposure. The full analytical workflow from in situ network identification to inter-laboratory comparison is outlined in Figure 1 and the successive procedures employed for network reconstruction and topology identification are illustrated in Figure 2.
The eight networks were initially evaluated independently and then compared using the same set of indicators: N, E, proximity nodes of biological-sample Ns, mean degree , maximum degree kmax, density D, and degree, betweenness and closeness centralities. Inter-laboratory comparison was performed at three levels: network scale and connectivity, architectural organization and node centrality profile. The topological patterns were examined between all sites and according to laboratory activity (ART or andrology) keeping each laboratory as an autonomous network. Given the small number of sites and the uneven distribution between ART (n = 5) and andrology (n = 3) laboratories, these comparisons were mostly descriptive and exploratory. The same definitions and calculation criteria were applied to all eight networks to ensure uniformity in the multicentric study.
2.7. Statistical Analysis
Given the limited number of independent laboratory networks (n = 8), the statistical analysis was mostly descriptive. Laboratory summary and inter-site comparisons of network parameters. We investigated for associations between selected network-level parameters namely network size and density, using Spearman’s rank correlation coefficient where appropriate. Relationships that were mathematically determined by the definition of the graph metrics were not subjected to inferential correlation testing. Comparisons between ART (n = 5) and andrology (n = 3) laboratories were considered exploratory given the small and unequal size of the groups. The statistical analyses were carried out using Statistica software (version 6.0, TIBCO Software Inc., Palo Alto, CA, USA) and the inferential tests were performed with statistical significance set at (p < 0.05). The study was exploratory; therefore, focus was placed on the magnitude and structural interpretation of differences discovered rather than on statistical significance alone.
3. Results
3.1. Network Composition and Topological Profiles
The eight laboratory networks differed considerably in scale and communication architecture. Network size ranged from 14 to 34 nodes and from 13 to 33 edges (Figure 3). L5-Andrology (N = 34), (E = 33) and L3-ART (N = 33), (E = 32) were the largest networks, whereas L8-ART was the smallest (N = 14), (E = 13). Despite this variation, a recurrent architectural pattern emerged. Five laboratories (L1, L2, L4, L7, and L8) showed predominantly star-centered hybrid configurations, while L3 combined a star-centered structure with a cellular component. L5 and L6 displayed more distributed cellular–star configurations, involving several communication centers rather than a single dominant local hub.
The upper panel represents five assisted reproductive technology (ART) laboratories (L3, L4, L6, L7 and L8) and the lower panel represents three andrology laboratories (L1, L2 and L5). For each network, a graph was created using yEd Live based on the observed devices, communication infrastructure and connectivity relationships and categorized according to its main architecture; hybrid star, hybrid star-cellular or hybrid cellular-star. Node symbols and colors denote the different types of infrastructure and devices, and edge colors denote the related communication protocols. The graph features comprise for each laboratory: number of nodes (N), edges (E), nodes near biological-sample areas (Ns), density (D), average degree (K), maximum degree (Km), and maximum centralities of degree (CDm), closeness (CCm) and betweenness (CBm)
The observed heterogeneity was also technological. Wi-Fi-connected devices represented an important peripheral component in most laboratories, while routers, cellular devices, antennas, Bluetooth, and RFID-related components contributed differently from one site to another. In this context, the term hybrid refers primarily to the communication architecture: different communication technologies and connectivity patterns coexist within the same laboratory, even when the underlying graph retains a simpler mathematical structure.
A second and rather striking feature appeared when the networks were considered at graph level. For all eight laboratories, E = N − 1. For a connected undirected graph, this relationship is characteristic of a tree. The networks therefore share a common sparse, tree-like backbone despite their differences in size, technologies, and architectural configuration. This does not conflict with their classification as star-centered or hybrid star–cellular architectures. The former describes the mathematical node–edge structure, whereas the latter describes the arrangement and the combination of different communication components in the actual IoMT environment. This common backbone is important because it changes the interpretation of the multicentric results. The eight networks are neither completely different nor instances of single standardized architecture. Instead, they share a sparse structural principle while differing in branch distribution, hub organization, and communication technology.
3.2. Network Size, Connectivity and Density
Network density ranged from 0.06 to 0.14 (Figure 4). The lowest values occurred in the two largest networks, L3-ART (N = 33), (D = 0.06) and L5-Andrology (N = 34), (D = 0.06), whereas L8-ART, the smallest network (N = 14), showed the highest density (D = 0.14). The remaining laboratories occupied intermediate positions, from 0.09 in L2-Andrology to 0.13 in L7-ART. Despite an approximately 2.4-fold difference in network size, mean degree remained within a narrow interval of 1.86–1.97. Maximum degree was far more variable, ranging from 6 in L6-ART to 18 in L2-Andrology.
An important structural relationship emerged from the data. Because:
E = N − 1
For every reconstructed network, the density of each connected undirected network can be expressed as:
The laboratories are divided into andrology (L1, L2, and L5) and assisted reproductive technology (ART; L3, L4, L6, L7, and L8) laboratories. The graph shows the number of vertices/nodes (V), edges (E), nodes near biological-sample areas (Ns) and graph density (D, right axis) for each laboratory. Network size ranged widely among laboratories. Density was inversely related to network size, with the largest networks having lower values and the smallest networks having higher values.
The apparently higher density of smaller laboratories is therefore mainly a scale effect, not evidence of greater network complexity. Similarly, the convergence of mean degree toward 2 is an expected consequence of the tree-like structure. In these networks, density and mean degree consequently have limited discriminatory value when considered alone. The distribution of edges among individual nodes becomes more informative.
More importantly, substantial variation was present within each category. L2- and L5-Andrology, for example, belong to the same laboratory group but show markedly different network architectures and centrality profiles. The observed topology therefore appears more site-dependent than activity-dependent.
3.3. Degree Distribution and Centrality Reveal Different Levels of Network Concentration
While mean degree changed little across laboratories, the distribution of connections around individual nodes differed markedly (Figure 5 and Figure 6). Maximum degree ranged from 6 to 18. L2-Andrology showed the strongest hub concentration, with kmax = 18 among 23 nodes and a maximum normalized degree centrality of 82%. L4-ART and L8-ART were also strongly hub-centered, reaching maximum degree centralities of 63% and 62%, respectively. By contrast, L3-ART and L5-Andrology presenting the two largest networks showed considerably lower maximum degree centralities of 37% and 39%.
The radar maps show the main infrastructure nodes discovered in the three andrology laboratories (L1, L2, and L5) and five assisted reproductive technology (ART) laboratories (L3, L4, L6, L7, and L8). The graphs compare the degree d(v), the shortest-path distance d(v,u) and guw(v), the number of shortest paths between nodes u and w passing through node v, for each node v. With these metrics, we can compare direct node connectivity, topological distance and the role of infrastructure nodes in the shortest-path organization of the laboratory networks.
Radar plots comparing the normalized betweenness centrality (CB(v)), degree centrality (CD(v)) and closeness centrality (CC(v)) of the main infrastructure nodes identified in the three andrology laboratories (L1, L2 and L5) and five assisted reproductive technology (ART) laboratories (L3, L4, L6, L7 and L8). The profiles show differences in direct connectivity, shortest-path intermediary position and topological proximity of nodes, distinguishing networks dominated by a single central node from configurations where centrality is shared by several infrastructure nodes.
Network size therefore did not predict hub dominance. A larger number of nodes can be accommodated through several branches or communication centers without concentrating most direct links on a single component. Conversely, a smaller network may remain highly dependent on one central router, access point, gateway, or equivalent infrastructure node.
This distinction became clearer with betweenness and closeness centrality. Maximum betweenness ranged from 71% to 99% and exceeded maximum degree centrality in every laboratory. L2-Andrology again presented the most concentrated profile, reaching 99% betweenness and 88% closeness, whereas L5-Andrology reached only 71% and 48%, respectively. L3-ART similarly showed relatively low maximum closeness (46%) despite its larger number of nodes.
Different patterns of centralization were detected between laboratory architectures on the node level. They presented centralized networks (L1 and L2 for Andrology; L3, L6, L7 and L8 for ART) in most of the laboratories analysed. In fact, there is one 2.4 GHz router that is shown the highest degree, betweenness and closeness centralities at the same time. Thus, this node was the primary connectivity hub and a structural bottleneck, since it was in an important position along the shortest paths of the reconstructed graph. Conversely, other laboratory topologies had two to four prominent infrastructure nodes, mainly routers and monopole antennae, with centrality shared between them. Depending on the arrangement, the router was the most central node in terms of degree with more direct connections, while a monopole antenna had a higher degree of betweenness and proximity with a lower degree of degree. The monopole thus constituted a more important bottleneck on shortest pathways between cellular nodes or branches and the rest of the network. These patterns differentiate highly centralized single-bottleneck designs from more dispersed settings where connectivity and shortest-path centrality are shared across several infrastructure nodes.
The contrast between L2 and L5 is particularly informative. L2 contains fewer nodes than L5 (23 versus 34), yet its maximum degree, closeness, and betweenness centralities reach 82%, 88%, and 99%, compared with 39%, 48%, and 71% in L5. The main difference between these networks is therefore not simply their scale but the distribution of structural control across the topology.
Taken together, degree, closeness and betweenness produced distinct centrality profiles across sites. The particularly high betweenness values indicate that some laboratory components occupy critical intermediary positions even where their direct degree is comparatively moderate. The topology of the laboratory networks therefore cannot be adequately described by node count or density alone.
4. Discussion
The multicentric assessment of 8 ART and andrology laboratories evidences a clear difference between idealized IoMT topology models and network architectures found in real healthcare contexts. IoT research often explores predefined or simulated architectures for topology design and optimization [11,13]. Our in-situ reconstruction consistently revealed sparse, tree-like backbones, overlaid by site-specific organizations ranging from strongly star-centered to hybrid star–cellular architectures. Existing laboratory IoT research has been mostly directed toward sensing, monitoring and automation, and not on the graph-theoretic structuring of the underlying infrastructure [3,4]. Thus, our study showed that real laboratory IoMT topology is not merely determined by theoretical connectivity options but rather by the real integration of devices, communication infrastructure and centralized gateways, providing an empirical basis for a more realistic modelling and subsequent optimization of healthcare IoMT networks, especially for ART and andrology laboratories. Indeed, the limited availability of representative real-world network topologies remains a major constraint for realistic IoT modelling and simulation [10,11].
The networks were technologically and architecturally heterogeneous, but they shared a tree-like structural backbone, suggesting that connectedness was maintained in a sparse fashion by branching rather than through redundant internode links. This result is particularly noteworthy as the topology was neither a priori defined nor computationally constructed but resulted from the restoration of existing infrastructures. The star-centered and hybrid star-cellular topologies therefore should not be seen as incompatible with the tree-like backbone: they represent various levels of network organization. This hub-dependent organization is consistent with IoT architectures in which gateways and border routers bridge heterogeneous networks and consequently occupy structurally critical positions [2].
The graph structure is described by the tree, while the star-centered and cellular parts explain the distribution of the connectivity and its implementation via routers, gateways, antennas and heterogeneous communication technologies. Thus, same graph-level limitations can accommodate significantly varied real-world IoMT topologies.
This common backbone also accounts for the behavior of the global graph metrics. Density was from 0.06 to 0.14 with the lowest network, L8-ART (N = 14), with the highest and the largest networks, L3-ART and L5-Andrology (N = 33 and 34), the lowest. This inverse relation should not be taken to mean that smaller laboratories have higher structural complexity, because density is severely bound by network size in these tree-like graphs. Similarly, their shared sparse arrangement is principally responsible for the narrow mean-degree range of 1.86–1.97. Comparing to larger healthcare networks requires scale-aware interpretation, Nekkab et al. [5] reported densities of 0.002–0.012 for networks with 1266–2063 hospitals, but their nodes, edge semantics and network scale are fundamentally different to device-level laboratory networks. Similarly, Zand et al. [32] have shown that density and other graph features are substantially dependent on the construction of healthcare-network edges.
Then the dominant node is a 2.4 GHz router, and it cannot be limited to a few connected nodes. Indeed, in most of the laboratory configurations, routers were connected directly to 4–18 nodes. The concentration of connections around a prominent infrastructure node can result in higher latency and power demand and influence the functional availability of the overall network structure [33]. This concentration may therefore contribute to instrument malfunction and increased density of EMI channels across the laboratory environment with possible thermal and electromagnetic effects on sensitive biological and gamete samples.
By comparison, the bigger L5-Andrology network (N = 34) reached 39%, 48% and 71%, respectively. L3-ART had a similar dispersed profile but was substantial in size. Therefore, network expansion was not systematically reinforcing hub dominance. Additional components were accommodated by centralized attachment or distributed branching, depending on the site. This difference is in line with network-science studies showing that degree, closeness and betweenness are measures of different structural roles [8,9] and with healthcare-network analysis that distinguishes highly connected hubs from structurally important intermediary nodes [6]. In fact, the prediction of communication reliability cannot be solely relied on network topology, but also depends on routing mechanisms, connection conditions and path selection as it is depicted in reliability-aware routing approaches for medical sensor network [34].
The comparison between ART and andrology laboratories further suggests that the topology was mostly site-dependent rather than activity-dependent. Descriptively, ART laboratories in this dataset were smaller (median N = 16 versus 23 for andrology) and had higher median density (0.125 versus 0.09), but these differences are heavily driven by network size and are not able to establish laboratory-type-specific architectures from 5 ART and 3 andrology sites. More critically, there was also significant variation within the same category, as L2- and L5-Andrology differed significantly in both architecture and centrality despite having the same functional classification.
The observed difference in network density across ART and andrology laboratories may be partly explained by differences in operational organization and quality control needs, but this link cannot be confirmed from the present cross-sectional analysis. ART laboratories have particularly strict requirements for the handling and culture of gametes and embryos, and there are recommendations covering environmental control, equipment management, risk prevention, troubleshooting and the ongoing evaluation of laboratory performance using key performance indicators (KPIs) [35]. ESHRE recommendations strengthen risk management, equipment maintenance, quality management systems and regular monitoring of performance indicators as part of IVF laboratory practice [36]. Although this notion must be investigated in dedicated studies, these limits may have indirect effects on the physical and functional organization of equipment and communication infrastructure in ART laboratories.
However, the comparison with andrology laboratories should be taken with care. Semen analysis is itself subject to defined techniques and quality-control requirements [37] and spermatozoa should not be seen as being biologically insensitive to environmental stressors. Experimental and systematic evidence indicates that exposure to RF-EMF might influence sperm-related outcomes, although the extent and certainty of these effects are variable [38,39]. Decreased progressive sperm motility following in vitro exposure to the fields generated by mobile phones and Wi-Fi access points has also been demonstrated in recent experimental work in an IVF laboratory [40]. Other study showed that even the female reproductive system can be impacted by a direct exposure of RF-EMF linked to 4G [41]. Therefore, the implementation of consistent IoMT architecture to all reproductive laboratories should be considered in the light of laboratory specialization, biological material, equipment distribution, communication technologies, spatial organization and key quality indicators, in a topology-informed manner. In addition, Bangash et al. [34] described that the composition of human tissues with saline water absorbs electromagnetic radiation during wireless communication. Also, the temperature of biomedical sensor nodes can be influenced by the electromagnetic energy absorbed from antenna radiation during data transmission and the power wasted by the sensor circuitry, and in continuous exposure, could influence nearby tissues.
Hence, the activity of a laboratory alone would seem insufficient to forecast its IoMT organization, equipment deployment, communication infrastructure and the distribution of connectivity among local hubs would appear to be more useful structural descriptors.
Collectively, these results reveal two complimentary properties of real laboratory IoMT networks: a repeating sparse structural backbone and a prominent site-specific architectural variation. This distinction has direct engineering implications. Rather than assuming a universal topology before deployment, IoMT integration in specialized healthcare laboratories should first characterize the current network scale, communication architecture and dependence on central or intermediary nodes. Highly centralized networks such as L2 and more decentralized designs such as L3 or L5 reflect differing structural preconditions for future integration, modeling, security evaluation or redundancy analysis. Therefore, the contribution of this multicentric in-situ approach is not to offer yet another ideal topology, but to establish an empirical topological baseline from operational laboratory contexts, upon which more realistic IoMT modeling and optimization can be constructed thereafter.
Such empirical topologies could subsequently provide realistic structural inputs for topology-control and optimization frameworks integrating reliability, energy, and communication constraints [12]. Indeed, as suggested by Hakim [42], the graph analytics of network topology can be used not just to evaluate the links but to develop an optimization for balanced higher performance. This can be applied especially for ART and andrology laboratories depending on their particularities of network topology.
Furthermore, the present analysis characterizes structural topology rather than network performance. Density or centrality should therefore not be interpreted as direct measures of communication quality, latency, reliability or signal coverage. Finally, the hybrid topology categories used here describe observed combinations of communication structures and technologies and should be regarded as operational classifications rather than universally standardized IoMT topology nomenclature.
5. Conclusions
This paradigm shift study is the first multicentric, in situ analysis of the topological architecture of IoMT networks in high-stakes contexts of ART and andrology laboratories. The actual mapping of these complicated ecosystems has shown that there is a ubiquitous hierarchical tree-like backbone, very different from the dense and idealized meshes assumed in theoretical frameworks. This initial characterization provides confirmation that, while these laboratories have naturally evolved structural principles for connectivity, the prevailing use of centralized hubs and hybrid star-cellular morphologies is inherently unoptimized for the exacting requirements of modern clinical care. We provide the first rigorous evidence that these infrastructures are now governed by pragmatic necessity rather than by deliberate engineering and thus place these critical environments at a crossroads between passive connectivity and the sophisticated, robust demands of true smart health integration.
The structural relationships we have uncovered in our evaluation suggest a latent but serious topological challenge: the vulnerability of these facilities to EMI and bottlenecking communication. For a successful transition to a high-performance smart health paradigm, a paradigm shift is required to transition the network architecture from a secondary utility to a core therapeutic asset. We suggest a forward-looking approach to structural improvement, focusing on the following imperatives: (1) Precision Spatial Mapping: Integrate topological data with physical site mapping to segregate sensitive, high-risk biological samples from key electromagnetic hubs and high-traffic gateways. (2) Hierarchical Device Classification: Develop a fine-grained classification scheme for IoMT devices based on their criticality, latency tolerance, and signal interference potential to separate sensitive instrumentation from ordinary auxiliary nodes. (3) Dynamic Resilience Modeling: Beyond static layout, our future research will address node-removal simulations to harden these networks against single-point failures, such that the “structural backbone” is resilient enough to support the life-critical data streams of reproductive practice.
We argue that this novel approach provides a foundation for the future of reproductive medicine by weaving the digital fabric stronger. By re-engineering these network topographies, laboratories can be transformed from heterogeneous assemblages of equipment into cohesive, high-efficiency, and EMI-resilient smart ecosystems capable of conserving the delicate complexity of human gametes and embryos.
Author Contributions
I.M. and A.M wrote the main manuscript text, prepared the design conception of the study, prepared the figures and tables with statistical analysis, and the experimental execution. J.EA reviewed the mathematical and physic calculations of topology design, the figures and the results, the design conception of the study and the final main manuscript text. A. M. reviewed the ethical part of the study. O.S., M.Z., H.EF., B.B., F.B. and H.B. conducted the part of Fertility laboratory with access to the parameters of IVF department and to identify the IoMT devices. N.L., B.B. and Ad.M. conducted the part of Fertility laboratory with the access to the parameters of andrology department and to identify IoMT devices. All authors have read and agreed to the published version of the manuscript.
Funding
The authors declare that no funds, grants or other support were received during the preparation of this manuscript.
Data Availability Statement
The raw data supporting the findings of the current study is part of the IoT Fertility Consortium agreement. Indeed, the data concerning the anonymized data of each laboratory with IoMT devices inventory and topology raw data of the eight laboratories preserving confidentiality are not publicly available due to ethical considerations respecting the anonymity of laboratory topological identities. Indeed, they will be used in subsequent publications related to IoT Fertility Project. This study is under current regulations governing minimal-risk, non-interventional research using anonymized biological waste, as is explained in the ethics section. Data access requests may be directed to the corresponding author and will be considered in accordance with institutional and consortium regulations.
Acknowledgments
The authors would like to thank Sid Ahmed Mansoura for his valuable contribution in reviewing and editing the final version of the manuscript, particularly for his expertise in English Language and grammar correction, and graphic design of figures as a specialist in scientific article editing.
Conflicts of Interest
The authors declare no conflicts of interest, or other interests that might be perceived to influence the results and/or discussion reported in this paper.
Abbreviations
The following abbreviations are used in this manuscript:
| ART | Assisted Reproductive Technology |
| EMI | Electromagnetic Interference |
| IIoT | Industrial Internet of Things |
| IoMT | Internet of Medical Things |
| IoT | Internet of Things |
| IVF | In Vitro Fertilization |
| KPI | Key Performance Indicator |
| RF-EMF | Radiofrequency Electromagnetic Field |
| RFID | Radio-Frequency Identification |
| Wi-Fi | Wireless networking technology (IEEE 802.11 family) |
| WSN | Wireless Sensor Network |
| G = (V, E) | Graph representing the reconstructed laboratory network |
| V | Set of vertices (nodes) |
| E | Set of edges (connections); also denotes the number of edges |
| N | Number of network nodes |
| Ns | Number of nodes near biological-sample areas |
| D | Network density |
| kᵢ | Degree of node i |
| Mean node degree | |
| kₘₐₓ | Maximum node degree |
| d(v) | Degree of node v |
| d(v,u) | Shortest-path distance between nodes v and u |
| gᵤw | Number of shortest paths between nodes u and w |
| gᵤw(v) | Number of shortest paths between nodes u and w passing through node v |
| CD(v) | Degree centrality of node v |
| CB(v) | Betweenness centrality of node v |
| CC(v) | Closeness centrality of node v |
| CDm | Maximum degree centrality |
| CBm | Maximum betweenness centrality |
| CCm | Maximum closeness centrality |
| Km | Maximum node degree |
References
- Picone, M. IoT: A new open access journal for Internet of Things. IoT 2020, 1, 145–146. [Google Scholar] [CrossRef]
- Cirani, S.; Ferrari, G.; Iotti, N.; Picone, M. The IoT Hub: A fog node for seamless management of heterogeneous connected smart objects. In Proceedings of the 2015 12th Annual IEEE International Conference on Sensing, Communication, and Networking—Workshops (SECON Workshops), Seattle, WA, USA, 22–25 June 2015; pp. 1–6. [Google Scholar] [CrossRef]
- Munir, T.; Akbar, M.S.; Ahmed, S.; Sarfraz, A.; Sarfraz, Z.; Sarfraz, M.; Chérrez-Ojeda, I. A systematic review of Internet of Things in clinical laboratories: Opportunities, advantages, and challenges. Sensors 2022, 22, 8051. [Google Scholar] [CrossRef]
- Sra, M. A web of IoT sensors to automate quality control in an IVF embryology lab. J. Int. Soc. Telemed. eHealth 2017, 5, e11. [Google Scholar]
- Nekkab, N.; Astagneau, P.; Temime, L.; Crépey, P. Spread of hospital-acquired infections: A comparison of healthcare networks. PLoS Comput. Biol. 2017, 13, e1005666. [Google Scholar] [CrossRef]
- Kohler, K.; Ercole, A. Can network science reveal structure in a complex healthcare system? A network analysis using data from emergency surgical services. BMJ Open 2020, 10, e034265. [Google Scholar] [CrossRef]
- Freeman, L.C. Centrality in social networks conceptual clarification. Soc. Netw. 1978, 1, 215–239. [Google Scholar] [CrossRef]
- Borgatti, S.P. Centrality and network flow. Soc. Netw. 2005, 27, 55–71. [Google Scholar] [CrossRef]
- Oldham, S.; Fulcher, B.; Parkes, L.; Arnatkevičiūtė, A.; Suo, C.; Fornito, A. Consistency and differences between centrality measures across distinct classes of networks. PLoS ONE 2019, 14, e0220061. [Google Scholar] [CrossRef]
- Jurkiewicz, P. TopoHub: A repository of reference Gabriel graph and real-world topologies for networking research. SoftwareX 2023, 24, 101540. [Google Scholar] [CrossRef]
- Alrumaih, T.N.I.; Alenazi, M.J.F. GENIND: An industrial network topology generator. Alex. Eng. J. 2023, 79, 56–71. [Google Scholar] [CrossRef]
- Dey, I.; Marchetti, N. Optimized topology control for large-scale IoT networks using graph-based localization. Sci. Rep. 2026, 16, 13810. [Google Scholar] [CrossRef]
- Barabási, A.-L.; Pósfai, M. Network Science; Cambridge University Press: Cambridge, UK, 2016; Volume 3. [Google Scholar]
- Knight, S.; Nguyen, H.X.; Falkner, N.; Bowden, R.; Roughan, M. The Internet Topology Zoo. IEEE J. Sel. Areas Commun. 2011, 29, 1765–1775. [Google Scholar] [CrossRef]
- Marai, G.E.; Pinaud, B.; Bühler, K.; Lex, A.; Morris, J.H. Ten simple rules to create biological network figures for communication. PLoS Comput. Biol. 2019, 15, e1007244. [Google Scholar] [CrossRef]
- Longla, T.T. Investigating the Robustness of Wireless Sensor Networks. 2023. Probability & Statistics Seminar. 12.
- Yadav, D.K.; Jayanthu, S.; Das, S.K.; Chinara, S.; Mishra, P. Critical review on slope monitoring systems with a vision of unifying WSN and IoT. IET Wirel. Sens. Syst. 2019, 9, 167–180. [Google Scholar] [CrossRef]
- Cilfone, A.; Davoli, L.; Belli, L.; Ferrari, G. Wireless mesh networking: An IoT-oriented perspective survey on relevant technologies. Future Internet 2019, 11, 99. [Google Scholar] [CrossRef]
- Rodenas-Herraiz, D.; Garcia-Sanchez, A.J.; Garcia-Sanchez, F.; Garcia-Haro, J. Current trends in wireless mesh sensor networks: A review of competing approaches. Sensors 2013, 13, 5958–5995. [Google Scholar] [CrossRef]
- Borgatti, S.P.; Everett, M.G. A graph-theoretic perspective on centrality. Soc. Netw. 2006, 28, 466–484. [Google Scholar] [CrossRef]
- Fornito, A.; Zalesky, A.; Bullmore, E.T. Fundamentals of Brain Network Analysis; Academic Press: Cambridge, MA, USA, 2016. [Google Scholar]
- Cowan, R.; Jonard, N. Network structure and the diffusion of knowledge. J. Econ. Dyn. Control 2004, 28, 1557–1575. [Google Scholar] [CrossRef]
- Ebadi, A.; Tighe, P.J.; Zhang, L.; Rashidi, P. A quest for the structure of intra- and postoperative surgical team networks: Does the small-world property evolve over time? Soc. Netw. Anal. Min. 2019, 9, 7. [Google Scholar] [CrossRef]
- Goñi, J.; Avena-Koenigsberger, A.; Velez de Mendizabal, N.; van den Heuvel, M.P.; Betzel, R.F.; Sporns, O. Exploring the morphospace of communication efficiency in complex networks. PLoS ONE 2013, 8, e58070. [Google Scholar] [CrossRef]
- Avena-Koenigsberger, A.; Misic, B.; Sporns, O. Communication dynamics in complex brain networks. Nat. Rev. Neurosci. 2018, 19, 17–33. [Google Scholar] [CrossRef]
- Estrada, E.; Higham, D.J.; Hatano, N. Communicability betweenness in complex networks. Physica A 2009, 388, 764–774. [Google Scholar] [CrossRef]
- Sabidussi, G. The centrality index of a graph. Psychometrika 1966, 31, 581–603. [Google Scholar] [CrossRef]
- Ostovari, M.; Yu, D. Impact of care provider network characteristics on patient outcomes: Usage of social network analysis and a multi-scale community detection. PLoS ONE 2019, 14, e0222016. [Google Scholar] [CrossRef]
- Estrada, E. Characterization of topological keystone species: Local, global and “meso-scale” centralities in food webs. Ecol. Complex. 2007, 4, 48–57. [Google Scholar] [CrossRef]
- Kim, P.J.; Jeong, H. Reliability of rank order in sampled networks. Eur. Phys. J. B 2007, 55, 109–114. [Google Scholar] [CrossRef]
- del Rio, G.; Koschützki, D.; Coello, G. How to identify essential genes from molecular networks? BMC Syst. Biol. 2009, 3, 102. [Google Scholar] [CrossRef]
- Zand, M.S.; Trayhan, M.; Farooq, S.A.; Fucile, C.; Ghoshal, G.; White, R.J.; Boudreau, T.; et al. Properties of healthcare teaming networks as a function of network construction algorithms. PLoS ONE 2017, 12, e0175876. [Google Scholar] [CrossRef]
- Tang, S.; Xie, Y. Availability modeling and performance improving of a healthcare Internet of Things (IoT) system. IoT 2021, 2, 310–325. [Google Scholar] [CrossRef]
- Bangash, J.I.; Abdullah, A.H.; Razzaque, M.A.; Khan, A.W. Reliability aware routing for intra-wireless body sensor networks. Int. J. Distrib. Sens. Netw. 2014, 10, 786537. [Google Scholar] [CrossRef]
- ESHRE Special Interest Group of Embryology; Alpha Scientists in Reproductive Medicine. The Vienna consensus: Report of an expert meeting on the development of ART laboratory performance indicators. Reprod. Biomed. Online 2017, 35, 494–510. [Google Scholar] [CrossRef]
- De los Santos, M.J.; Apter, S.; Coticchio, G.; Debrock, S.; Lundin, K.; Plancha, C.E.; Prados, F.; Rienzi, L.; Verheyen, G.; Woodward, B.; et al. Revised guidelines for good practice in IVF laboratories. Hum. Reprod. 2016, 31, 685–686. [Google Scholar] [CrossRef]
- World Health Organization. WHO Laboratory Manual for the Examination and Processing of Human Semen, 6th ed.; World Health Organization: Geneva, Switzerland, 2021; ISBN 978-92-4-003078-7. [Google Scholar]
- Cordelli, E.; Ardoino, L.; Benassi, B.; Consales, C.; Eleuteri, P.; Marino, C.; et al. Effects of radiofrequency electromagnetic field (RF-EMF) exposure on male fertility: A systematic review of experimental studies on non-human mammals and human sperm in vitro. Environ. Int. 2024, 185, 108509. [Google Scholar] [CrossRef]
- Naderi, N.; Tavalaee, M.; Heydarian Far, P.; Mokhtari, A.; Nasr-Esfahani, M.H. Influence of radiofrequency electromagnetic radiation on spermatogenesis and sperm function in rodent models: A systematic review. Reprod. Toxicol. 2026, 144, 109300. [Google Scholar] [CrossRef]
- Danho, S.; Escobar Huertas, J.F.; Schoellhorn, W.I. A systematic review of the impact of electromagnetic waves on living beings. Cureus 2025, 17, e90355. [Google Scholar] [CrossRef]
- Madkour, I.; Madkour, A.; Taghzouti, K.; El Abbadi, J. The impact of different modes of radiofrequency–electromagnetic field emitted by cell phones on uterine contractions of Wistar rat ex vivo. In Communication and Information Technologies Through the Lens of Innovation: Proceedings of the 5th International Conference on Advanced Technologies and Humanity (ICATH 2023); Springer: Cham, Switzerland, 2025; pp. 159–167. [Google Scholar] [CrossRef]
- Hakim, M.; Mathew, J. Graph analytics for network topology optimization. Int. J. Sci. Res. Eng. Trends 2019, 5. [Google Scholar] [CrossRef]
Figure 1.
Multicenter study design and analytical workflow for in situ IoMT topology characterization in ART and andrology laboratories. (A) Eight varied IoMT environments were studied in three cities in Morocco (Rabat, Casablanca and Marrakech), including five assisted reproductive technology (ART) institutions and three andrology laboratories. (B) The same analytical framework was applied to each laboratory: inventory of devices and infrastructure, characterization of communication links and technologies, graph-based reconstruction of the topology, centrality analysis and graph-density assessment, classification of the topology, and network metrics computation. (C) The rebuilt networks were compared amongst laboratories in terms of technology distribution, topological diversity, graph metrics, coverage patterns, and indoor-outdoor network architecture.
Figure 1.
Multicenter study design and analytical workflow for in situ IoMT topology characterization in ART and andrology laboratories. (A) Eight varied IoMT environments were studied in three cities in Morocco (Rabat, Casablanca and Marrakech), including five assisted reproductive technology (ART) institutions and three andrology laboratories. (B) The same analytical framework was applied to each laboratory: inventory of devices and infrastructure, characterization of communication links and technologies, graph-based reconstruction of the topology, centrality analysis and graph-density assessment, classification of the topology, and network metrics computation. (C) The rebuilt networks were compared amongst laboratories in terms of technology distribution, topological diversity, graph metrics, coverage patterns, and indoor-outdoor network architecture.
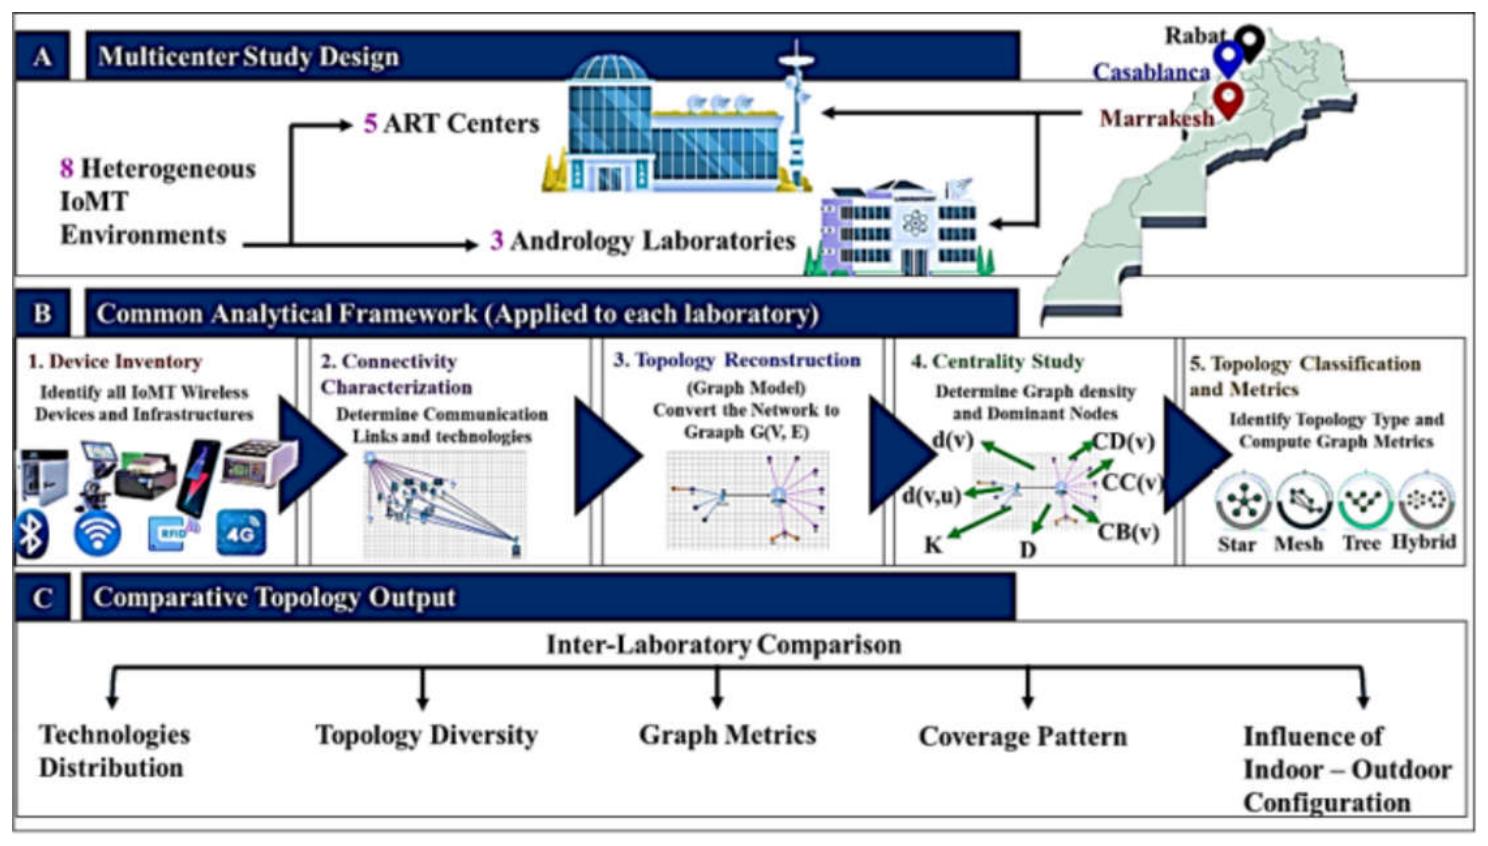
Figure 2.
Methodology of Network Topology IoMT construction (a) in-situ spatial identification; (b) extraction of network relationships; (c) abstraction into a graph; (d) topology identification.
Figure 2.
Methodology of Network Topology IoMT construction (a) in-situ spatial identification; (b) extraction of network relationships; (c) abstraction into a graph; (d) topology identification.
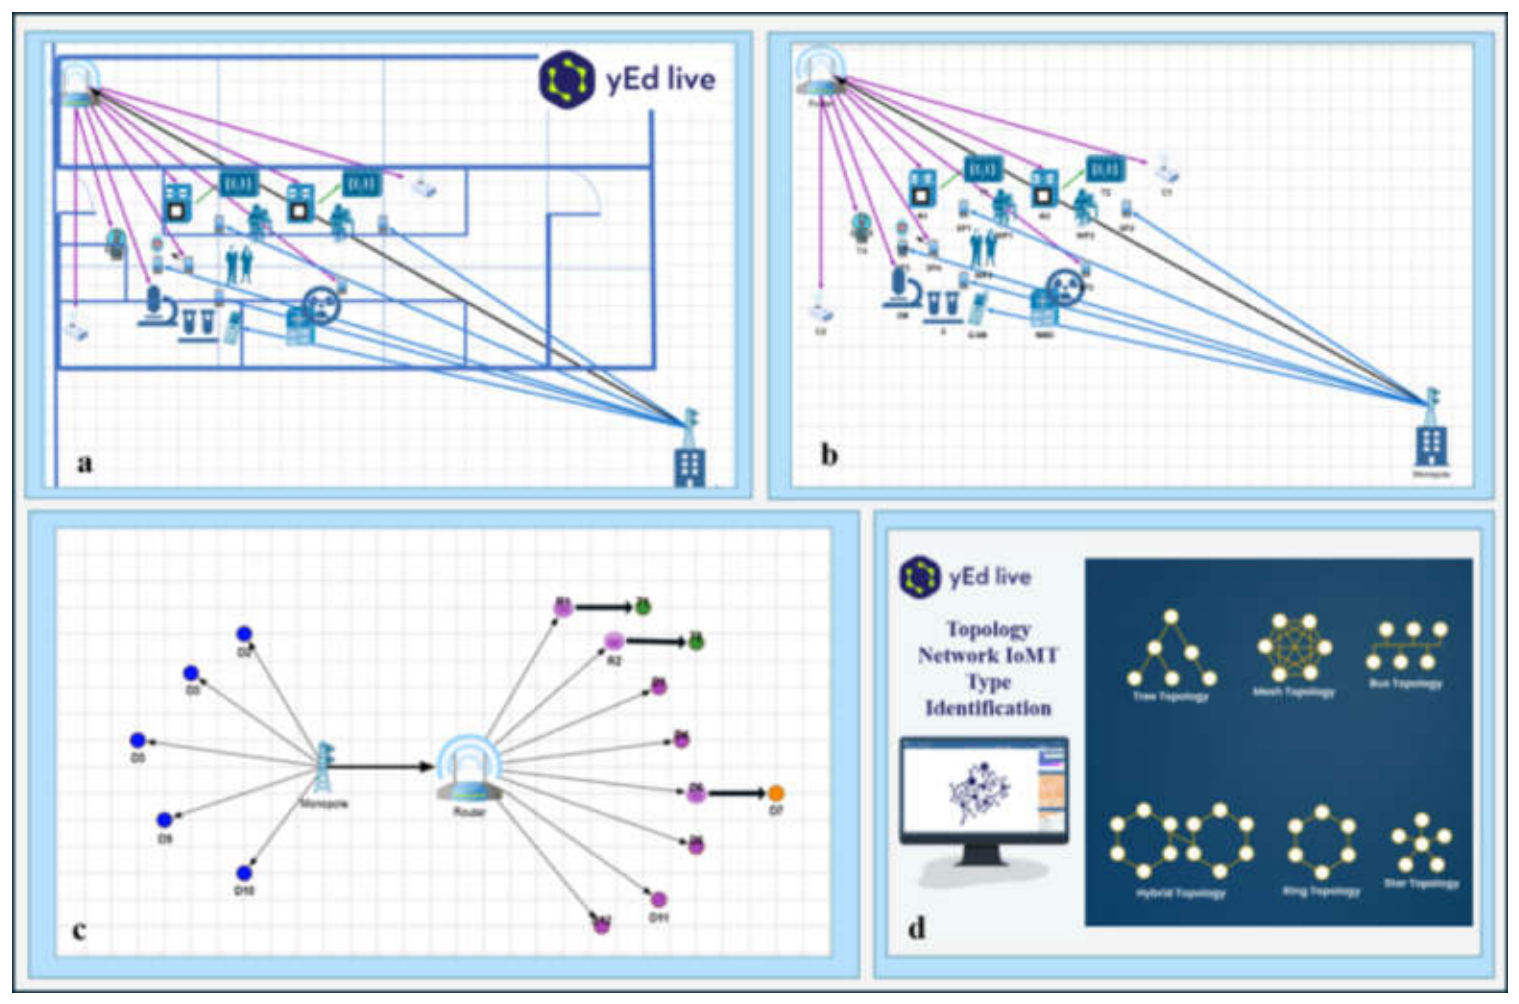
Figure 3.
Results of in situ reconstructed IoMT network topologies and graph characteristics of the eight ART and andrology laboratories.
Figure 3.
Results of in situ reconstructed IoMT network topologies and graph characteristics of the eight ART and andrology laboratories.
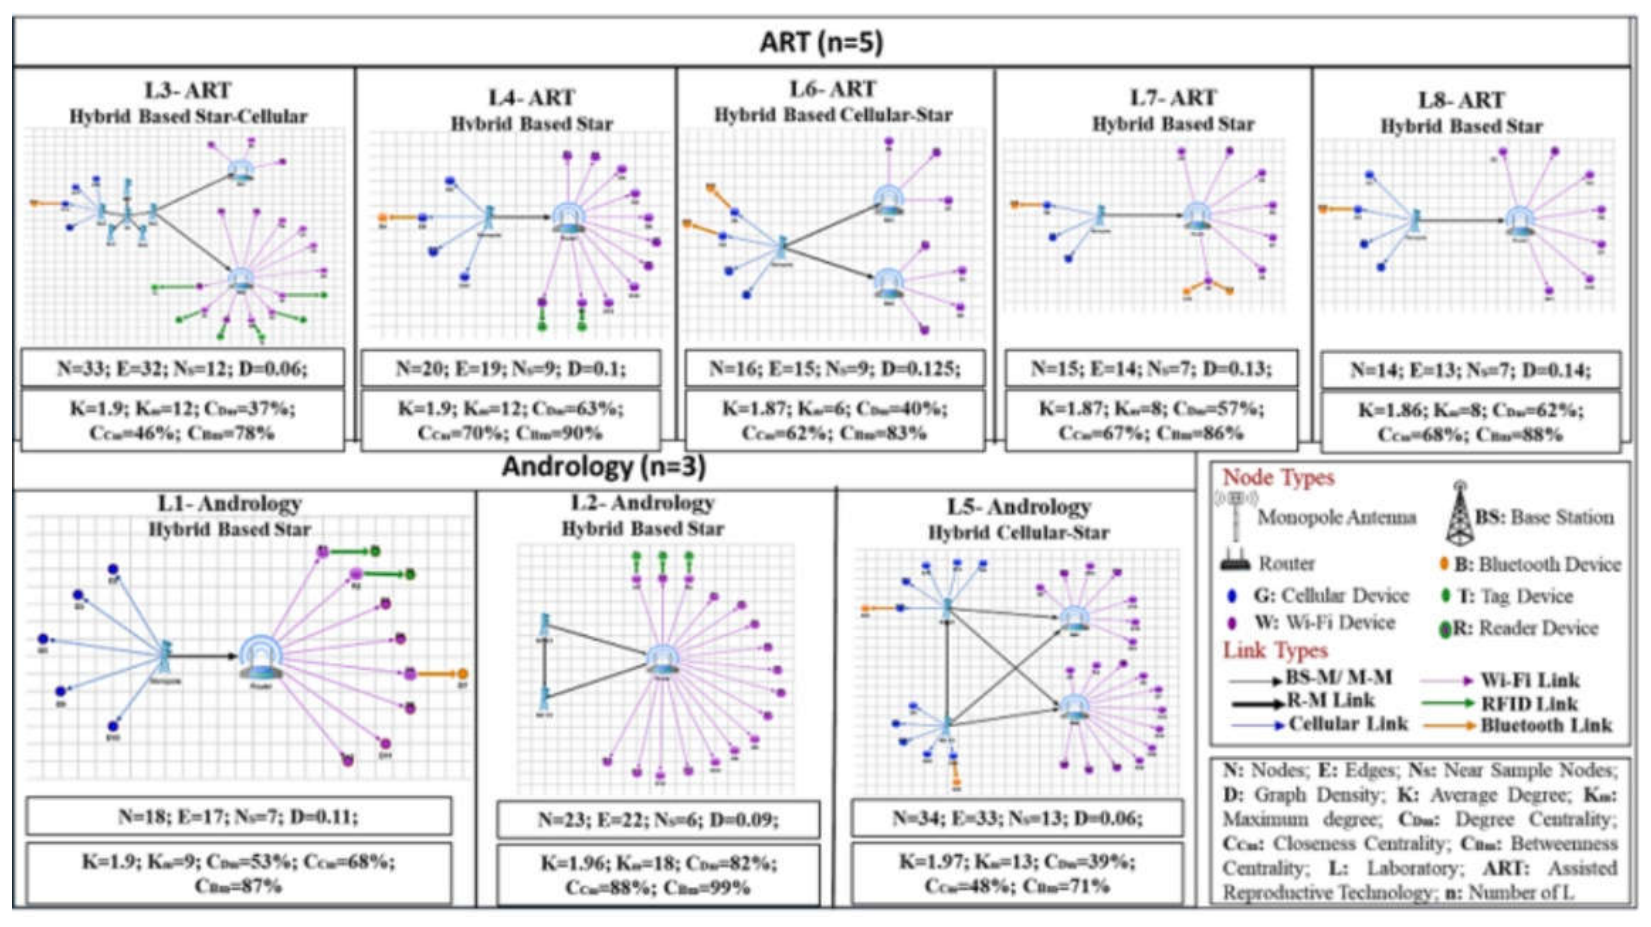
Figure 4.
Results of comparative graph characteristics of the reconstructed IoMT networks across the eight investigated laboratories.
Figure 4.
Results of comparative graph characteristics of the reconstructed IoMT networks across the eight investigated laboratories.
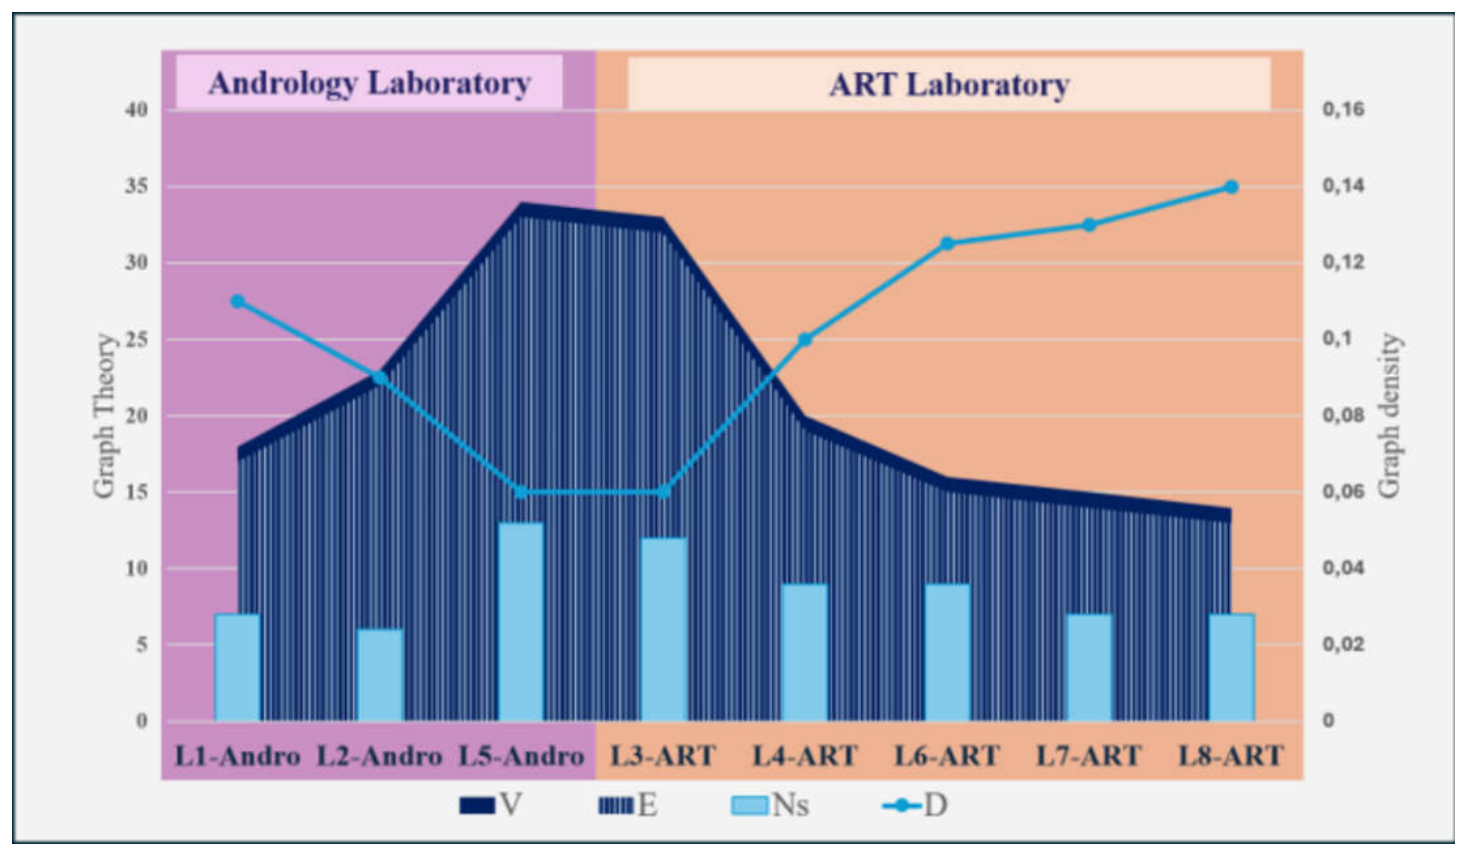
Figure 5.
Results of comparative node-level connectivity and shortest-path profiles of the eight reconstructed IoMT networks.
Figure 5.
Results of comparative node-level connectivity and shortest-path profiles of the eight reconstructed IoMT networks.
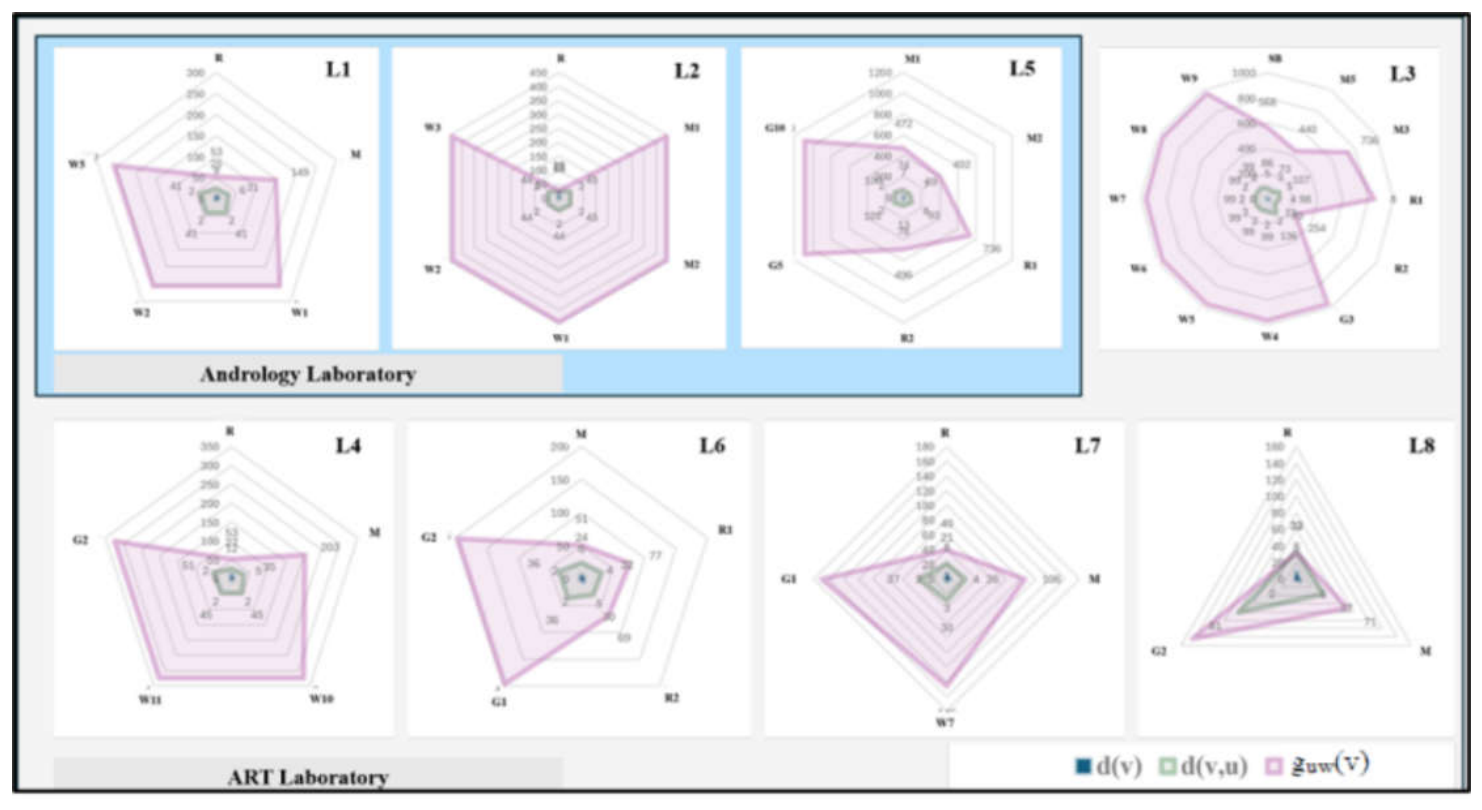
Figure 6.
Results of comparative Node-level centrality profiles of the eight reconstructed IoMT laboratory networks.
Figure 6.
Results of comparative Node-level centrality profiles of the eight reconstructed IoMT laboratory networks.
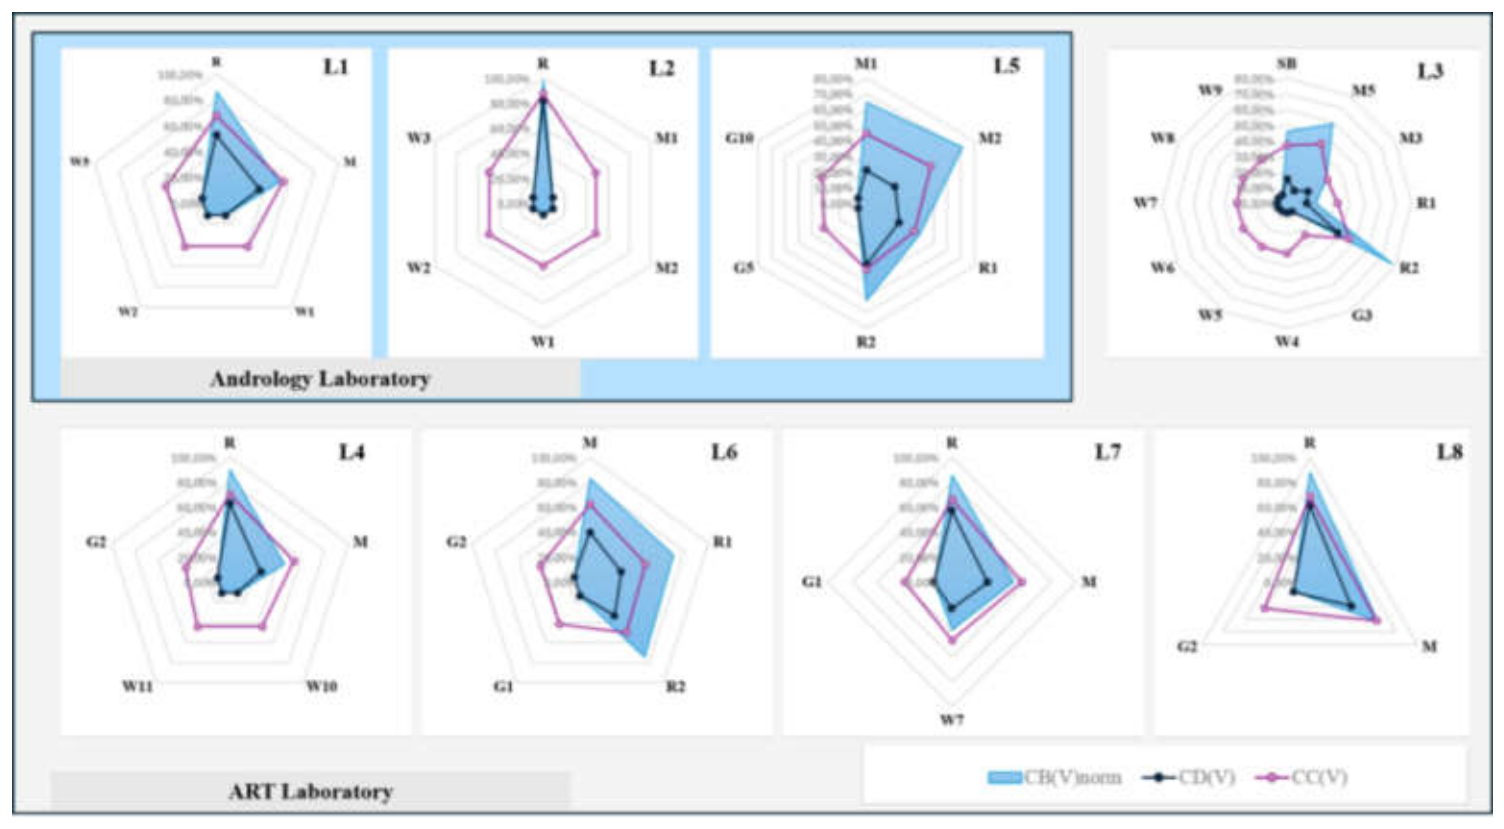

Table 1.
Characterization of different network topology types.
| Network Pattern | Operational Criterion Used in This Study | Structural Interpretation | Reference |
|---|---|---|---|
| Star-centered | One dominant infrastructure node directly connects most peripheral nodes | Connectivity is concentrated around a central node, such as a router, gateway, or access point | [13,17,18] |
| Tree-like | Connected branching structure without redundant paths or closed cycles | Hierarchical or branched organization; for a connected undirected graph, (E = N − 1), where E: Edges and N: Nodes | [13,17,18] |
| Mesh | Multiple redundant inter-node connections provide alternative paths between nodes | Distributed connectivity with network redundancy | [18,19] |
| Cellular component | One or more devices connect through cellular infrastructure rather than exclusively through the local network | Cellular connectivity forms a distinct communication branch/component of the reconstructed architecture | Operational criterion adapted to the communication technologies identified in this study |
| Hybrid architecture | At least two identifiable connectivity patterns or communication infrastructures coexist within the same laboratory network | Composite architecture combining local and/or external communication structures | [17,18]; operationalized in this study |
| Hybrid star–cellular | A predominantly star-centered local network coexists with cellular-dependent nodes or a cellular communication branch | Star-centered local connectivity supplemented by cellular infrastructure | Operational category defined in the present study |
Disclaimer/Publisher’s Note: The statements, opinions and data contained in all publications are solely those of the individual author(s) and contributor(s) and not of MDPI and/or the editor(s). MDPI and/or the editor(s) disclaim responsibility for any injury to people or property resulting from any ideas, methods, instructions or products referred to in the content. |
© 2026 by the authors. Licensee MDPI, Basel, Switzerland. This article is an open access article distributed under the terms and conditions of the Creative Commons Attribution (CC BY) license (http://creativecommons.org/licenses/by/4.0/).
Copyright: This open access article is published under a Creative Commons CC BY 4.0 license, which permit the free download, distribution, and reuse, provided that the author and preprint are cited in any reuse.