

Submitted:
08 October 2026
Posted:
10 October 2026
You are already at the latest version
Abstract
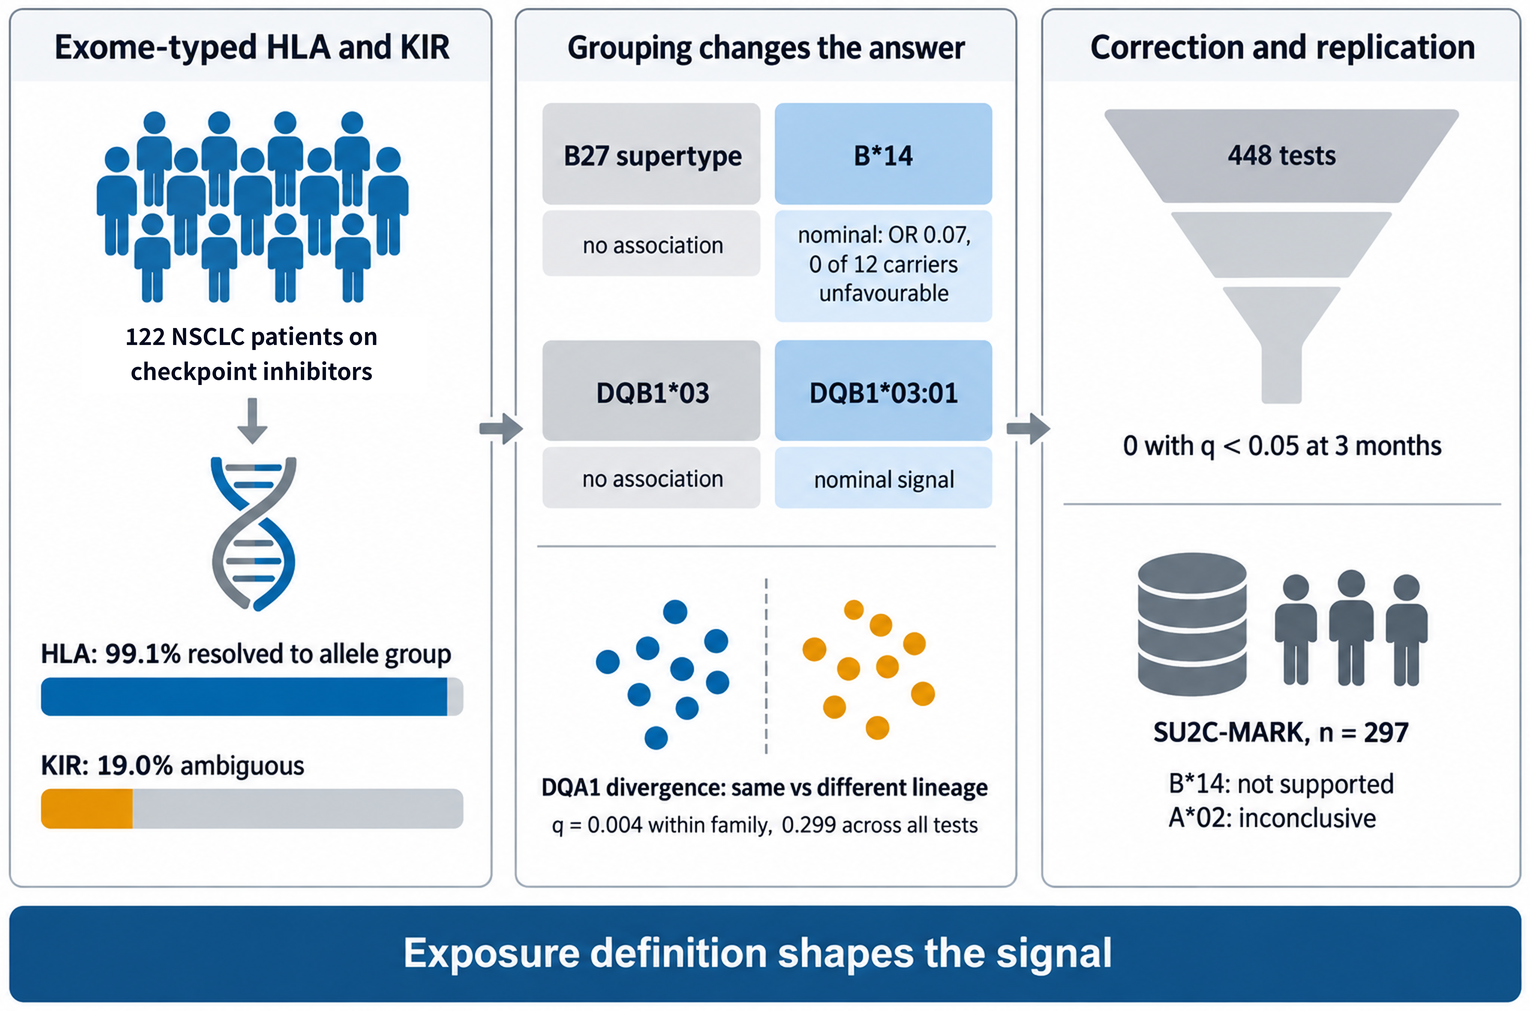
We examined germline HLA and KIR variation, typed from whole-exome sequencing, in 122 patients with advanced non-small cell lung cancer treated with checkpoint inhibitors. In a screen of 448 tests, no association with the primary endpoint, unfavourable disease status at 3 months, reached q < 0.05. Nominally and and without surviving correction, HLA-A*02 carriers had higher odds of unfavourable status (odds ratio 4.00, 95% CI 1.64 to 10.07) and no HLA-B*14 carrier did (0 of 12; odds ratio 0.07, 0.0006 to 0.58). In 297 in-dependent patients cohort , B*14 was not supported (Cochran Q p = 0.027) and A*02 was inconclusive (Q p = 0.139). The only test below q = 0.05 was HLA-DQA1 evolutionary divergence at 12 months (odds ratio 0.42 per standard deviation, 0.23 to 0.70; q = 0.004 within its family, 0.299 across all tests). Divergence was bimodal and matched whether the two DQA1 alleles shared a first-field lineage: a two-group contrast, not a gradient. Grouping alleles changed the answer: the B27 supertype showed no association although B*14 did, and DQB1*03 showed none although DQB1*03:01 did (both nominal). Exome typing resolved HLA to allele group (99.1% of calls) but not KIR (19.0% ambiguous), so germline HLA can be recovered from exomes that already exist without additional se-quencing; DQA1 lineage structure is the hypothesis these data put forward for inde-pendent testing.
Keywords:
non-small cell lung cancer
; immune checkpoint inhibitors
; HLA class I
; HLA class II
; killer cell immunoglobulin-like receptors
; HLA supertypes
; allele-group resolution
; exome-based HLA typing
; multiple testing
; HLA evolutionary divergence
1. Introduction
Anti-PD-1 and anti-PD-L1 antibodies are standard first-line treatment for advanced non-small cell lung cancer (NSCLC), but only a minority of patients achieve durable disease control [1,2,3]. PD-L1 expression is the established biomarker, yet its predictive performance is inconsistent across studies and assay platforms [2]. In one NSCLC cohort, PD-L1 expression, tumour mutational burden and cancer gene mutations predicted benefit better than HLA class I genotype, which was not associated with survival [4]. Germline HLA nevertheless remains a plausible determinant: class I molecules present peptides to CD8 T cells [5], and germline HLA class II heterozygosity is associated with lower lung cancer risk in smokers, implicating antigen presentation in the control of early lung neoplasia [6]. Whether germline HLA matters for checkpoint response in NSCLC is unsettled.
Germline HLA has been examined at three levels of aggregation. Genotype-level summaries include class I homozygosity [7,8], HLA evolutionary divergence, the mean physicochemical distance between the two alleles' peptide-binding domains [9,10], and composite scores of predicted neoantigen presentation across the genotype [11]; in checkpoint cohorts, divergence has been tested almost exclusively at class I [12,13,14]. Allele groups have been implicated in both directions, most prominently HLA-A*03 [15], and allele-level class I subtypes have also been reported to predict checkpoint response [16]. Supertypes, which pool alleles by shared peptide-binding motif [17], include a reported B27 association in advanced NSCLC treated with pembrolizumab plus chemotherapy [18] and an A*02/B*62 supertype associated with prognosis in stage I lung cancer [19]. KIR variation, which modulates natural killer cell licensing through HLA class I ligands [20,21], has been associated with resistance to PD-1 blockade in lung cancer [22] and with treatment response and survival in NSCLC [23].
Two gaps limit comparison between studies. Findings at different levels of aggregation are not interchangeable: a supertype pools alleles whose effects may differ, so an association reported for a supertype need not hold for its constituent alleles, nor an allele-group association for its supertype; and the same supertype can behave differently across settings, as B44 did when a melanoma association failed to reproduce in NSCLC except on stratification by somatic mutational landscape [24]. And studies tend to report the association found rather than the screen it came from, so readers cannot see how many exposures were tested or how reliably alleles were called.
Here we examined whether germline HLA and KIR variation is associated with disease control in a southern Spanish NSCLC cohort treated with immune checkpoint inhibitors, with unfavourable disease status at three months as the primary endpoint. The same patients were classified at each level of aggregation (allele group, supertype, evolutionary divergence, KIR). Genotypes came from whole-exome sequencing, with call resolution audited before any association test. We also benchmarked carrier frequencies against Spanish donor registries and compared the principal class I findings with an external cohort.
2. Materials and Methods
2.1. Study Design, Setting and Participants
This germline HLA and KIR study is a secondary, retrospective analysis of a prospective, multicentre institutional cohort of patients treated with immune checkpoint inhibitors (ICI) reported according to STROBE [25]. Adults with histologically confirmed stage IIIB/IV NSCLC who started anti-PD-1 or anti-PD-L1 therapy between January 2018 and June 2024 at two Málaga hospitals (Spain) were eligible; prior ICI exposure and another malignancy within five years were exclusions. All patients gave written informed consent.
Of 131 patients in the clinical database we excluded 6 with no retrievable clinical record, 2 with small cell histology and 1 screening failure, leaving 122 (Figure S1). Age and Eastern Cooperative Oncology Group (ECOG) performance status were recovered from archived records (Table S1). Germline DNA yielded HLA genotypes for 102 patients and KIR genotypes for 101; 114 had an evaluable time to progression (TTP). The primary analysis set, patients with both an HLA genotype and a recorded 3-month disease status, comprised 99 patients.
2.2. Endpoints
Disease status at 3, 6 and 12 months after the first ICI dose was classified as favourable (complete or partial response or stable disease) or unfavourable (progressive disease or death) using RECIST 1.1 [26] as recorded in routine clinical assessment; the 3-month timepoint corresponds to primary resistance in the SITC framework and the 6-month timepoint to loss of clinical benefit [27], and death before a timepoint counts as unfavourable. Unfavourable status at 3 months was fixed in advance as the single primary endpoint; the later timepoints, TTP and progression-free survival were secondary, and immune-related adverse events were the fourth endpoint of the association screen. Overall survival was not pre-specified: the clinical extract carried no vital status, so it was reconstructed afterwards from two further institutional sources and is reported as a secondary, exploratory endpoint (Supplementary Note 1).
2.3. Genotyping and Call Resolution
Exome data were generated for a previously reported study [28]. A germline IL7 polymorphism was separately tested against immune-related adverse events by TaqMan genotyping over the same recruitment period [29], without reference to HLA or KIR. Germline DNA was captured with the Twist Human Core Exome 2.0 kit and sequenced paired-end 2 × 150 to a mean depth of [AÑADIR valor real]×; reads were trimmed with fastp v0.23.4 [30] and aligned to GRCh38 with BWA-MEM [31], [ALT-aware / without ALT-aware handling]. HLA class I and II and KIR alleles were called from the resulting BAM files with T1K v1.0.5 [32]; call confidence was characterised from T1K quality and read-abundance scores. To validate the calls we retyped a random subset of 14 samples (12.6% of the 111 audited) with OptiType v1.5.0 [33] and arcasHLA v0.6.0 [34] from the MHC-region reads of the same BAM files. OptiType, built for exome reads, agreed at 91.7% of alleles and 83.3% of genotypes at the three class I genes it types; arcasHLA, applied outside its intended RNA-seq domain, agreed at 69.6% and 50.0% and bounds the validator rather than the typing (Table S3, Supplementary Note 2).
Call resolution was audited before any association analysis. It covers all 111 samples from which an HLA call could be produced, before the clinical exclusions that define the analysis cohort, so its denominators exceed the 102 patients carried into the association models, which are a strict subset of the 111. Of 1,155 patient-by-locus units across 12 genes, 94.0% returned a single candidate genotype and 99.1% resolved unambiguously at the first field, because competing candidates almost always belonged to the same allele group; 94.3% resolved at two fields, and 10 units (0.9%) could not be resolved at the first field. All HLA analyses were therefore conducted at first-field resolution, except DQB1*03:01, reported at two fields because the first-field group DQB1*03 aggregates alleles with different peptide-binding motifs; two-field resolution at HLA-DQB1 was 92.7% (101 of 109 audited units).
KIR calls did not meet the same standard: 195 of 1,025 gene-present patient-by-gene units (19.0%) were ambiguous and none resolved at the first field, so KIR analysis was restricted to gene presence and KIR-HLA ligand pairs (Table S2).
2.4. Derived Variables
An allele group was testable if at least 5 of the 102 genotyped patients carried it and at least 5 did not, giving 36 class I and 34 class II groups; the rule was applied once, fixing the exposure set and the permutation correction before any endpoint was analysed. Because the analysis set shrinks at each landmark as patients become unevaluable, 15 of the 448 tests fall below these thresholds in their own set (14 with fewer than 5 carriers and 1 with fewer than 5 non-carriers); all 15 were retained in the primary analysis and flagged, and a Benjamini-Hochberg refit on the remaining 433 is reported as a sensitivity analysis (Table S10b). Class I supertypes followed Sidney and colleagues [17]; HLA evolutionary divergence was the mean Grantham distance between the peptide-binding domains of the two alleles at a locus [9,10] (Supplementary Note 3, Table S4).
KIR-HLA ligand pairs combined KIR gene presence with the corresponding C1, C2 or Bw4 ligand group, using the gene content conventions established for southern European populations [35].
2.5. Statistical Analysis
Six hypothesis families were fixed in advance: class I allele groups, class II allele groups, class I supertypes, HLA evolutionary divergence, KIR gene presence and KIR-HLA ligand pairs, with zygosity examined alongside divergence. Binary outcomes were modelled by Firth penalised logistic regression [36,37], appropriate because two exposures show complete separation at the 3-month landmark, with profile penalised-likelihood intervals; time-to-event analysis used Kaplan-Meier estimation, log-rank tests and Cox regression, with restricted mean survival time as fallback [38,39].
False discovery rate was controlled by Benjamini-Hochberg [40] within each hypothesis family at each endpoint, with the effective number of independent tests estimated from the exposure correlation matrix [41]. A Westfall-Young permutation procedure [42] was then applied to the 46 class I exposures at the primary endpoint, with 10,000 permutations of the outcome label, and also to the six divergence exposures within each endpoint and pooled across the four endpoints, to the wider sets tested at the 12-month endpoint (40 class II and divergence exposures; all 112 exposures) and to all 448 exposure-by-endpoint combinations (2,000 to 10,000 permutations according to level). Family-wise error rates are reported at this ladder of nesting levels with Monte Carlo intervals (Table S11). Further permutation analyses calibrated the leading estimates against frequency-matched null maxima; E-values [43], leave-one-out and bootstrap analyses complete the sensitivity workup (Supplementary Note 4).
Analyses used R 4.4.3 with logistf, survival, metafor and ggplot2, with the random seed fixed; no clinical covariate was imputed.
Throughout, within-family q values control the expected fraction of false discoveries inside each hypothesis family, whereas the permutation family-wise error rates certify against even a single false positive across correlated families; the two scales answer different questions and are reported side by side.
2.6. Comparison with a Public Checkpoint-Treated Cohort
SU2C-MARK provides germline class I alleles called by POLYSOLVER [44] with clinical annotation for 309 patients with advanced NSCLC treated with checkpoint blockade, of whom 297 were evaluable for progression-free survival with 232 events [45]. We carried HLA-A*02 and HLA-B*14 carriage into this dataset under identical exposure definitions; the external endpoint is progression-free survival (PFS) as distributed, with no equivalent of the 3-month landmark, so the comparison is restricted to time-to-event estimates.
Compatibility was assessed by Cochran Q with DerSimonian-Laird pooled estimates in metafor [46]. The analysis protocol was written and hash-stamped after the external analytic set had been assembled and its marginal distributions inspected, and before any analysis of exposure against outcome in that cohort; it is deposited with the analysis code at Zenodo (doi:10.5281/zenodo.23180011).
3. Results
3.1. Cohort and Analysis Sets
Ninety-nine patients had both an HLA genotype and an assessable 3-month landmark, 68 with favourable and 31 with unfavourable status (Table 1); genotyped and non-genotyped patients did not differ in any baseline variable (all p ≥ 0.16, Table S5).
Each analysis uses the patients with the data it requires, so denominators differ between analyses; every figure and table states its own n, and Figure S1 traces the exclusions and the resulting analysis sets. Three sets are nested: the 99 patients with both an HLA genotype and an assessable 3-month landmark sit within the 102 with an HLA genotype, which sit within the 122-patient cohort. The remaining sets overlap rather than nest: 101 patients had an HLA-A call and 101 a KIR genotype, which are not the same 101; 98 had both an HLA genotype and an evaluable time to progression; and 100 had a computable HLA-DQA1 divergence value.
Median age was 65.9 years and, among the patients with each variable recorded, 77.9% were men, 63.2% had adenocarcinoma, 22.2% had PD-L1 at 50% or above, 74.2% received chemo-immunotherapy and 48.8% had immune-related adverse events (Table S6). Among the 114 patients with an evaluable time to progression, median TTP was 10.9 months (95% confidence interval [CI] 8.0 to 17.2) with 64 events; median follow-up was 15.4 months by reverse Kaplan-Meier and the longest observed follow-up was 51.2 months.
ECOG performance status was the only baseline variable that differed between outcome groups (grade 0, 22.1%; grade 1, 71.6%; grade 2 or above, 6.3%; n = 95; Fisher p = 0.040; Table 1). It was prognostic for time to progression (hazard ratio [HR] 1.81 per grade, 95% CI 1.00 to 3.26, p = 0.049; n = 94, 54 events), for the composite of progression or death (HR 2.82, 1.69 to 4.72, p < 0.001; 78 events) and for 3-month unfavourable status (odds ratio [OR] 3.12 per grade, 95% CI 1.26 to 9.05, p = 0.013; n = 95).
3.2. Genotyping Performance at Allele-Group Resolution
Call resolution constrains every association reported below, so the audit comes first. Of 1,155 patient-by-locus units, 99.1% resolved at the allele-group level and 94.3% at two fields, with near-complete per-gene coverage across the 12 typed genes (Table S2). The presence-dependent loci yielded lower counts, as expected: DRB3 (69), DRB4 (68) and DRB5 (27). These are call-coverage counts across the audited samples, not the denominators of Table S24, which is restricted to the 102-patient analysis cohort; within that cohort the numbers of gene-positive patients at DRB3, DRB4 and DRB5 are 64, 62 and 26.
KIR calls behaved differently: 195 of 1,025 gene-present units (19.0%) were ambiguous and none resolved at the first field, with ambiguity concentrated in the genes with the closest paralogues (KIR2DS3 52.0%, KIR2DS2 47.8%, KIR2DL1 47.6%), the expected behaviour of a short-read caller in a segmentally duplicated region (Table S2).
3.3. Carrier Frequencies and Comparison with Spanish Donor References
Table S24 gives carrier frequencies with 95% intervals for the 70 testable class I and class II allele groups. As a plausibility check, the three groups with the strongest primary-endpoint associations (A*02, B*14 and C*08; Table 2) were compared with two Spanish donor references: a 21,787-donor Catalan bone-marrow registry [47] and 278 bone-marrow donors from Seville, in the same region as this cohort [48]. Both report allele frequencies, so expected carrier frequencies were derived under Hardy-Weinberg equilibrium as 1 - (1 - p)², where p is the allele frequency; the Catalan A*02 frequency of 24.08%, for example, gives 42.4% expected carriers. The Catalan values are sums of the alleles listed among the registry's most frequent and may underestimate the whole group (Table S24), so the expected carrier frequencies from Catalonia are lower bounds. Donors are healthy and self-selected, neither panel is the source population of this cohort, and the comparisons are descriptive and outside the correction structure of the association screen.
Against the Catalan registry, B*14 and C*08 carriage was close to expectation (11.9% against 11.3% and 9.8% against 10.9%; exact binomial p = 0.87 for both). Because the two groups are in near-complete linkage (phi = 0.903), this is one observation, not two. The Seville panel reports higher frequencies: C*08 carriage was lower than expected (9.8% against 18.5%, p = 0.021) and B*14 carriage was lower but not significantly so (11.9% against 17.8%, p = 0.151). A*02 carriage was lower than expected against both references: 30.7% (31 of 101 patients with an HLA-A genotype; 95% CI 22.5 to 40.3) against 42.4% from Catalonia (p = 0.020) and 45.6% from Seville (p = 0.003). Because the Catalan expectations are lower bounds, the true A*02 deficit against Catalonia is, if anything, larger. Four explanations are possible: chance, departure from Hardy-Weinberg proportions, a real difference between patients with lung cancer and healthy donors, and undercalling by the typing algorithm. These data do not separate them. Only A*02 falls significantly below the Catalan expectations, whereas all three groups sit below the Seville ones; but the two panels also differ substantially from each other, by roughly 60% for B*14 and C*08, and the Seville estimates rest on 278 donors. Section 3.10 examines undercalling directly.
3.4. KIR Gene Content and KIR-HLA Ligand Pairs
No KIR association survived correction at any endpoint. The strongest nominal results were KIR2DS3 for lower odds of immune-related adverse events (OR 0.28, 0.09 to 0.78, q = 0.170) and KIR2DL2 with a C1 ligand for lower odds of unfavourable 6-month status (OR 0.39, 0.16 to 0.91, p = 0.029, q = 0.403; 39 carriers among 93 patients). Because C*08 is itself a C1 ligand, the second estimate was checked against C*08 carriage and was attenuated (Table S7 and Table S8, Supplementary Note 5). Gene frequencies and ligand-pair distributions are consistent with southern European references [35].
3.5. HLA-DQA1 Evolutionary Divergence, Bimodality and Lineage Identity
At 12 months, higher HLA evolutionary divergence at HLA-DQA1 was associated with lower odds of unfavourable status among the 75 labelled heterozygotes with an evaluable landmark (OR 0.42 per standard deviation, 0.23 to 0.70, p = 0.00067, q = 0.004). This was the only test in the screen to reach a false discovery rate below 0.05.
Support depends on the analysis set and on the scope of the multiplicity correction (Figure 1, Table S9, Supplementary Note 5). Retaining every typed patient with zero divergence gave OR 0.48, p = 0.0012, q = 0.007 (n = 89); restricting to genuinely divergent pairs gave OR 0.53 (0.30 to 0.88), p = 0.014, q = 0.084 (n = 66); covariate adjustment gave OR 0.50 (0.26 to 0.88), p = 0.016, q = 0.098 (n = 75). Pooling the four endpoints within the divergence family gave q = 0.016, and pooling all 448 tests into a single Benjamini-Hochberg family gave q = 0.299 (Figure 1B).
Divergence at DQA1 alone does not index the repertoire of the assembled HLA-DQ molecule: polymorphism in both chains shapes the peptide-binding groove, and the beta chain residues have been reported as the more influential of the two [49,50]. We therefore recomputed divergence at DQB1 as a post hoc completeness analysis. Each model requires computable divergence at every locus it includes, so the analysis sets differ and the estimates below are not directly comparable to the 0.42 of the screen. DQB1 divergence alone was null at 12 months (OR 0.71 per standard deviation, 0.42 to 1.15, p = 0.169, n = 77). Among the 65 patients with computable divergence at both chains, DQA1 alone gave OR 0.44 (0.24 to 0.76, p = 0.003) and was essentially unchanged when DQB1 was added (OR 0.45, 0.24 to 0.79, p = 0.005), while DQB1 itself was flat (OR 0.94, 0.53 to 1.62, p = 0.817) (Table S9c and S9d, Supplementary Note 5). The association therefore tracks the alpha chain in these data, which the structural literature on DQ would not predict; with 65 patients this bounds what can be resolved rather than arguing against a beta-chain contribution.
No other divergence test reached q < 0.05: the next smallest was DQA1 at 3 months (OR 0.56, 0.34 to 0.91, p = 0.018, q = 0.106), with 6 months at OR 0.64 (0.40 to 1.00, p = 0.051, q = 0.305), and the strongest result at another locus was HLA-A at 3 months (OR 1.51, 0.94 to 2.48, p = 0.088, q = 0.263; Table S10).
The DQA1 estimate behaves as a contrast between two groups rather than as a gradient. Recomputed divergence at DQA1 is bimodal, with an empty interval between 1.37 and 2.40 Grantham units, and the gap coincides exactly with first-field lineage identity: among the 79 of the 85 labelled DQA1 heterozygotes with both alleles resolved at two fields, the 19 with a same-lineage pair span 0 to 1.37 and the 60 with a between-lineage pair span 2.40 to 21.52 (Figure 1A; restricting to two-field resolution removes one same-lineage and five between-lineage patients from the 20 and 65 shown in the figure). Coded as a binary contrast the groups separate more sharply: a between-lineage pair gave OR 0.10 for unfavourable status (0.011 to 0.450, p = 0.0012). Single-call homozygosity cannot be distinguished from dropout, so the contrast is reported in terms of first-field lineage (Figure 1B, Table S9). In the strict two-field set evaluable at 12 months (n = 69), 16 of 17 patients with a same-lineage pair had unfavourable status against 28 of 52 with a between-lineage pair (same-lineage OR 9.46, 2.11 to 90.2, p = 0.0018, the reciprocal of the between-lineage coding used above; Table S9c and S9f). That restriction excludes dropout among the alleles that did resolve, but not for patients with a single DQA1 call, who cannot be assigned to either lineage group; the contrast therefore describes first-field lineage and not functional homozygosity. Within between-lineage pairs the continuous estimate was imprecise rather than absent (OR 0.65, 0.37 to 1.11, p = 0.114, n = 57), so these data do not separate a pure lineage dichotomy from a dichotomy with a gradient inside it.
3.6. The Pre-Specified Screen Across Six Hypothesis Families
The complete screen comprised 448 within-family tests, 112 at each of the four endpoints (Table S10): 36 class I allele groups, 34 class II allele groups, 14 KIR-HLA ligand pairs, 12 KIR gene presence terms, 10 class I supertypes and 6 divergence exposures, each tested at every endpoint. Refitting the correction on the 433 exposure-by-endpoint combinations that remained testable at their own endpoint leaves the same single result below 0.05 (Table S10b).
All 448 tests were carried in the primary analysis; refitting Benjamini-Hochberg on the 433 that met the testability thresholds in their own analysis set leaves the same single result below 0.05 (Table S10b).
Permutation agrees at the narrower levels but not at the widest: the family-wise error rate was 0.043 against the 112 exposures tested at 12 months and 0.165 across all 448 exposure-by-endpoint combinations (Table S11). The strongest primary-endpoint result, HLA-A*02, had q = 0.084 among the 36 class I allele groups.
3.7. The Class I Landscape: Two Opposing Allele Groups
Among the 46 class I exposures, four reached nominal significance at the 3-month landmark: HLA-A*02 (p = 0.0023), the A02 supertype containing it (p = 0.0070), HLA-B*14 (p = 0.0077) and HLA-C*08 (p = 0.019) (Figure 2). B*14 and C*08 were in near-perfect linkage (phi = 0.903), reproducing the historical B*14:02–Cw8 association of Spanish haplotypes [51]. The class I signal therefore reduces to two exposures acting in opposite directions (Supplementary Note 7).
HLA-A*02 carriage (30.3%, 30/99) was associated with unfavourable disease status at 3 months (unadjusted OR 4.00, 95% CI 1.64 to 10.07, p = 0.0023). The association was not attenuated by adjustment for clinical covariates (OR 5.00, 1.90 to 14.00, p = 0.001) and held after adding a binary ECOG term (OR 5.35, 1.90 to 16.82; Table 2, Figure 3B).
The association attenuated at 6 months (OR 2.64, 1.09 to 6.61, p = 0.031) and was no longer distinguishable from the null at 12 months (OR 1.39, 0.55 to 3.72). This early landmark risk did not translate into a time-to-event difference: median TTP was 6.8 months in carriers against 11.2 in non-carriers (HR 1.42, 0.81 to 2.49) and the composite gave 3.2 against 8.3 months (HR 1.29, 0.80 to 2.06), with estimates unchanged after adjustment and across the three progression event definitions (Table S13, Supplementary Note 7).
HLA-B*14 was present in 12.1% of patients (12/99). No B*14 carrier had unfavourable status at 3 months (0/12 against 31/87; Firth OR 0.07, 0.0006 to 0.58, p = 0.008; adjusted OR 0.08, 0.0006 to 0.67). The protective association was maintained at 6 and 12 months with attenuation (OR 0.14, 0.014 to 0.62, p = 0.007, q = 0.253, n = 94 at 6 months; OR 0.18, 0.04 to 0.63, p = 0.007, q = 0.078, n = 91 at 12 months; Table S10). No B*14 estimate reached q < 0.05 at any endpoint.
(median 28.9 against 8.4 months; HR 0.36, 0.14 to 0.90) and a stronger composite association (HR 0.37, 0.17 to 0.81; Table 2, Figure 4). Its linked partner C*08 gave consistent but attenuated estimates (Table 2).
The two markers were statistically unlinked (phi = −0.109, p = 0.337; only 2 patients carried both) and retained opposing associations under mutual adjustment (A*02 OR 3.77, 1.50 to 9.80; B*14 OR 0.079, 0.0006 to 0.67), but with 2 double carriers and complete outcome separation these estimates are arithmetic consequences of the penalisation rather than evidence of biological independence.
In a post hoc ordered three-level classification (B*14 carrier, neither, A*02 carrier), the two patients carrying both markers were assigned to the B*14 stratum. Unfavourable status at 3 months rose monotonically: 0.0%, 25.4% and 57.1% (trend OR 4.53, 2.02 to 11.07, p = 0.00014), and median TTP declined from 28.9 to 9.9 to 3.8 months (HR 1.67, 1.09 to 2.56); the gradient is descriptive, and robustness analyses left both estimates intact (Supplementary Notes 7 and 8, Table S23, Figure S2).
3.8. Supertypes and Allele Groups Are Different Exposures
Supertypes and allele groups were pre-specified as separate hypothesis families, and at two loci the two definitions gave discordant answers.
At HLA-B, the B27 supertype was null across all 29 carriers at 3 months (OR 0.80, 0.30 to 1.99) and for TTP (HR 0.75, 0.41 to 1.36), despite containing B*14. Restricted to its 12 B*14 carriers the association was pronounced (OR 0.07, 0.0006 to 0.58), whereas among the 17 remaining B27 carriers it reversed direction (OR 1.81, 0.62 to 5.21; Table S14). The three-strata decomposition is post hoc (Figure S3).
At HLA-A, the A02 supertype (35 carriers) gave a 3-month OR of 3.29 (1.38 to 8.05) against 4.00 for A*02 alone, and the five supertype carriers lacking A*02 gave an OR of 0.70 (0.07 to 4.03). The permutation family-wise p value was 0.018 for A*02 within HLA-A but 0.054 for the A02 supertype within the supertype family (Figure 2B).
3.9. Class II: Resolution Determines Visibility
No class II association survived correction (minimum q = 0.207). Three linked markers were nominally associated with worse 6-month status (DRB1*11, OR 3.27, 1.23 to 9.30; DQB1*03:01, OR 3.26, 1.34 to 8.32; and DQA1*05, OR 2.69, 1.18 to 6.28), and on time to progression DQB1*03:01 gave the strongest class II estimate (HR 2.21, 1.26 to 3.85, p = 0.005; Table S15, Figure S4).
On time to progression, DQB1*03:01 carriers had a median of 5.5 months against 14.7 in non-carriers. The hazard ratio was 1.91 (1.03 to 3.54, p = 0.041) after clinical adjustment and, with the three linked markers mutually adjusted, DQB1*03:01 retained an elevated hazard ratio of 2.15 (0.92 to 5.02, p = 0.078) while DRB1*11 collapsed to the null (HR 1.00, 0.38 to 2.62). This is the estimate most sensitive to the event definition: on the composite of progression or death the unadjusted hazard ratio attenuates to 1.63 (1.01 to 2.64, p = 0.045), clinical adjustment leaves 1.40 (0.82 to 2.39, p = 0.222) and the mutually adjusted estimate falls to 1.20 (0.55 to 2.62, p = 0.640), with DRB1*11 at 1.56 (0.65 to 3.76, p = 0.322). DQB1*03:01 therefore withstands clinical adjustment under documented progression but not under the composite, and under neither definition is it separated from its linked markers once they are mutually adjusted (Table S15).
The class II signal was confined to the two-field allele, the resolution at which DQB1*03:01 was pre-specified for analysis (Section 2.3): the first-field group DQB1*03 (46 carriers, including the 28 with DQB1*03:01) was null at 6 months (OR 1.17, 0.52 to 2.64, p = 0.700) and on both time-to-event definitions (time to progression HR 0.97, 0.58 to 1.64, p = 0.912; composite HR 0.84, 0.54 to 1.29, p = 0.421). The decomposition below uses patients carrying no DQB1*03 allele as the reference, which is not the reference used earlier in this section; the estimates for DQB1*03:01 are therefore not comparable with the OR 3.26 quoted above. Against that reference, the 18 carriers of DQB1*03 without DQB1*03:01 ran in the protective direction (6-month unfavourable status OR 0.31, 0.07 to 1.05, p = 0.060, n = 66; time to progression HR 0.43, 0.19 to 0.96, p = 0.039, n = 68; composite HR 0.46, 0.24 to 0.88, p = 0.019, n = 68), while DQB1*03:01 ran the other way (OR 2.45, 0.96 to 6.48, p = 0.060, n = 76; time to progression HR 1.70, 0.95 to 3.02, p = 0.072, n = 80; composite HR 1.31, 0.80 to 2.16, p = 0.281, n = 80). Only the two time-to-event estimates in the 18-carrier stratum reach nominal significance; all are post hoc, unadjusted and bounded by 18 carriers (Table S15b). Opposite effects within the first-field group would produce the null seen for the pooled DQB1*03 group. This is the resolution-level counterpart of the supertype dilution in Section 3.8: in both, pooling averages effects that point in opposite directions, so the level at which an exposure is defined determines whether an association is visible, not whether it exists.
3.10. Comparison of the Class I Signals with an Independent Public Cohort
All internal estimates in this section are fitted on the 95 patients with both a class I genotype and an evaluable time-to-progression record under the external protocol, and all external estimates on the 297 of 309 SU2C-MARK patients evaluable for progression-free survival. Estimates on the larger internal sets used elsewhere in this paper are given in Table S20. Table S20b gives the estimates on these 95 patients under both time-to-event definitions.
We examined our two strongest signals in SU2C-MARK, an independent public cohort of checkpoint-treated advanced NSCLC, using its published POLYSOLVER germline class I calls; the B*14 association was not supported and the A*02 comparison was inconclusive. B*14 and the B27 supertype were present at similar frequencies in the two cohorts, so prevalence does not limit the comparison; A*02 carriage was more frequent externally (42.4% against 30.3%), a gap of the same size as the deficit against the Spanish donor references (Supplementary Note 9).
The lower internal A*02 frequency does not account for the discrepancy (Table S16–S19), and two observations argue against a calling artefact: B*14 and C*08, which are in near-complete linkage and therefore count once, match the Catalan reference while only A*02 is deficient; and carriage did not track call quality, with the extreme reclassification recovering the registry frequency still leaving an odds ratio of 2.49 (1.06 to 5.97). Residual undercalling would in any case be non-differential and bias toward the null (Supplementary Note 8).
Among the 297 externally evaluable patients, B*14 showed no protective association. Against all other patients, the external progression-free survival HR was 1.14 (0.72 to 1.78) compared with an internal HR of 0.36 (0.14 to 0.89), formally rejecting a homogeneous effect (Cochran Q p = 0.027, I2 [ADD]). Restricting both cohorts to B27 carriers, the external HR was 1.17 (0.70 to 1.97) against an internal 0.26 (0.09 to 0.77) for time to progression (Q p = 0.015, I2 [ADD]) and against an internal 0.31 (0.12 to 0.77, p = 0.012) for the composite of progression or death (Q p = 0.013, I2 83.8%; Table S20b). The external estimate is identical in the last two comparisons, which differ only in the internal endpoint definition.
For A*02 the external HR was 0.90 (0.69 to 1.17) against 1.44 internally, and homogeneity was not rejected under either endpoint definition (time to progression Q p = 0.139, I2 54.3%; composite of progression or death Q p = 0.195, I2 40.6%), so the A*02 comparison is inconclusive rather than discordant. The A02 supertype, which contains A*02, did show heterogeneity (HR 1.61, 0.95 to 2.73 internally against 0.84, 0.65 to 1.09 externally; Q p = 0.031, I2 79.0%): a supertype can be less consistent across cohorts than the allele group it contains, because the frequencies of its remaining members need not match between populations. The nulls were consistent across cohorts for the whole B27 supertype (pooled HR 0.95, 0.74 to 1.24, I2 0.0%, Q p = 0.372) and for B27 carriers other than B*14 against non-carriers of B27 (Q p = 0.308, I2 4.0%; Figure 5, Table S20).
The two cohorts diverge in treatment context: in SU2C-MARK no patient received chemo-immunotherapy (against 74.2%, 69 of 93, internally), 60.2% received treatment beyond the first line and 20.7% received combinations including cytotoxic T-lymphocyte antigen 4 (CTLA-4) blockade. These data cannot resolve whether the B*14 discrepancy reflects these clinical differences or the absence of a true biological effect: the B*14 contrasts reject a single effect common to both settings, but they do not exclude effect modification by treatment line or regimen. Incorporating a previously reported first-line B27 supertype estimate [18] into a three-cohort meta-analysis likewise rejected a single underlying effect (Q p = 0.019, I² 75.7%), although heterogeneity statistics computed from three small studies are themselves imprecise; the external comparison is described in Supplementary Note 9 and its frozen protocol is deposited with the analysis code.
3.11. Reconstructed Overall Survival
Reconstructed overall survival was a secondary exploratory endpoint (Supplementary Note 1; Supplementary Note 10, Table S21): among 98 patients there were 76 deaths and median survival was 12.2 months. The median time to progression of 10.9 months in Section 3.1 was estimated in 114 patients and counts documented progression only, so the 25 of 76 deaths without documented progression are censored; in these 98 patients the medians were 11.2 months for time to progression, 7.9 months for the composite of progression or death and 12.2 months for overall survival (Table S13i). The 448-test screen was not repeated for survival. Four exposures were instead carried forward after the primary analyses (DQA1 lineage from the divergence family, and A*02, B*14 and C*08 as the strongest carrier signals at the primary endpoint), with Holm adjustment applied within them; because this family was selected once the main results were known, the adjustment is descriptive rather than a pre-specified correction. Same-lineage status at DQA1 was nominally associated with higher mortality (HR 1.92, 1.08 to 3.43; raw p = 0.027, adjusted p = 0.109; n = 82 with 61 deaths, the patients assignable to a lineage group) and B*14 carriage with longer survival (HR 0.42, 0.19 to 0.93; raw p = 0.033, adjusted p = 0.109; n = 98 with 76 deaths); A*02 and C*08 were not (Figure S5). These are exploratory analyses, not confirmation.
4. Discussion
We screened germline HLA and KIR variation against disease control in 122 checkpoint-treated patients with advanced NSCLC, testing 448 pre-specified exposurvive-by-endpoint combinations across six hypothesis families. No association at the primary endpoint met the declared within-family threshold. One test in the screen did, HLA-DQA1 divergence at 12 months, but its support depended on how the exposure was defined and on how widely multiplicity was corrected, and the exposure proved bimodal, so it contrasts two lineage groups rather than grading a repertoire. Of the two strongest class I estimates, the B*14 association was not supported in an independent cohort and the A*02 comparison was inconclusive. What this screen establishes is therefore methodological rather than clinical: the level at which an HLA exposure is defined determines whether a signal is visible at all.
The most transferable observation concerns exposure definition. Supertypes and allele groups are different molecular objects: alleles sharing a predicted binding motif still differ in the peptide repertoires they present [52]. In this cohort the B27 supertype was null while its B*14 carriers gave a large protective estimate, and DQB1*03 was null while DQB1*03:01 was not. A study reporting only supertypes will under-detect allele-specific effects; a study reporting only allele groups pays a heavier multiplicity price. Pre-specifying both families and correcting across their union is what makes cohorts comparable.
HLA-A*02 was the strongest class I result at the primary endpoint, with permutation family-wise error rates of 0.018 within HLA-A, 0.044 across the 36 class I allele groups and 0.057 across all 46 class I exposures; all three are correct answers to different questions, and together they make it the strongest class I signal rather than a validated one. Its carrier frequency was also lower than both Spanish donor references (30.7% against 42.4% and 45.6%), which bears on how the estimate should be read. Undercalling is the obvious explanation and the pattern does not fit it: B*14 and C*08 match the Catalan reference closely while only A*02 is deficient, carriage did not track call quality, and the reclassification extreme enough to recover the registry frequency still leaves an odds ratio of 2.49 (1.06 to 5.97). Chance and a genuine difference between Andalusian patients and Catalan donors remain open; the frequency reported here should not be taken as a population estimate.
The external comparison bounds how far either signal can be taken. In 297 independently genotyped patients the B*14 association was not supported and a homogeneous effect was formally rejected, while the A*02 time-to-event comparison was inconclusive (Section 3.10). Two readings remain. The internal effects could be specific to first-line chemo-immunotherapy, which no SU2C-MARK patient received; or they could reflect selecting the most extreme of 46 exposures in 99 patients. The second is more parsimonious, and A*02 and B*14 should be read as cohort-specific descriptive findings.
If either class I association is real, two mechanisms documented for these molecules in other settings would be candidates, and neither was measured here. B*14:02 restricts a CD8+ T cell response that is unusually effective in HIV control, and that effectiveness tracks the functional avidity of the response rather than the breadth of its repertoire [53]; in tumours, the avidity of CD8+ clones has likewise been linked to their efficacy [54], so the observation is not obviously confined to viral control. Separately, C*08:02 is a C1 ligand, so B*14~C*08 carriers are educated through the C1 axis [21,55], which is also the axis of the nominal KIR2DL2 with C1 ligand association reported in Section 3.4. Testing either mechanism would require tetramer-sorted receptor repertoires or NK functional assays, which this cohort does not provide.
The magnitude of the A*02 estimate is that of a selected maximum. Across 2,000 permutations of the outcome label, the largest odds ratio among the 17 class I exposures with carrier frequency comparable to A*02 had a median of 2.77 and a 95th percentile of 6.09 under a complete null; across all 46 exposures, where rare groups dominate the maximum, the median rose to 7.36 (Table S22). The observed 4.00 is 1.4 times the frequency-matched null median and falls below its 95th percentile, so it should be read as an estimate that selection has probably inflated. It is also discordant across endpoints: OR 4.00 at 3 months against hazard ratios of 1.29 to 1.42 with intervals crossing the null, and no association with overall survival (HR 1.36, 0.84 to 2.21; Table S21), an interval too wide to demonstrate an exclusively early effect. A genuine early effect that does not persist would produce this profile, and so would selection; these data do not separate them, and A*02 is reported here as a description of early failure in this cohort rather than as a measure of progression risk.
In restricted mean survival time at 24 months, treatment interruption (-8.9 months) and chemo-immunotherapy (+5.6 months) outranked every HLA or KIR estimate (Table S17). Treatment interruption partly reflects deterioration (reverse causation), and clinical variables and fixed germline exposures are not directly comparable, so this ordering gives context rather than a causal ranking (Supplementary Note 8).
Several limitations bound these conclusions. The cohort is modest and the screen exploratory: the B*14 estimate rests on 12 carriers with no unfavourable outcome at 3 months, and the DQA1 contrast on 19 same-lineage patients. The adjusted models are thin on the same count, about 4.5 events per variable, so they are sensitivity analyses rather than better-specified replacements, and the two-marker gradient was derived from the data it describes (Table S23). The external comparison sets exposures called by two different methods against each other, T1K on exome data internally and POLYSOLVER externally, so Cochran Q pools two typing approaches whose discordance was not quantified.
Call resolution is a molecular constraint on what can be analysed, not a reporting detail (Section 2.3 and Section 3.2). HLA resolved well at allele-group and two-field level; KIR did not, with ambiguity concentrated in the genes with the closest paralogues and no gain from collapsing to the first field. Both regions combine extreme polymorphism with paralogy, which is why alignment to a single reference followed by variant calling neither reconstructs HLA allele groups nor establishes KIR gene content. Exome reuse therefore costs no additional sequencing [28] but is interpretable only alongside an audit of what the calls will bear, which for KIR means gene presence and little more.
Three measurement constraints bound the exposures themselves. The class I exposure is a haplotype rather than an allele (A*33:01~C*08:02~B*14:02~DRB1*01:02~DQB1*05:01 is the fifth most frequent five-locus haplotype in the Catalan registry [47]), so any causal allele is inherited with the others and cannot be isolated here. At DQA1, 9 patients had a single call and 1 had none, so neither group could be assigned to a lineage, and a further 7 carried two identical calls and fall outside the heterozygote contrast; these 17 exclusions are what leave the 85 heterozygotes analysed in Section 3.5 (Table S9i). Finally, tumour mutational burden, HLA loss of heterozygosity, smoking history and TNM substage were not available, so none could enter the adjusted models.
Treatment was heterogeneous, although PD-L1 and regimen were balanced across A*02 carriage and entered the adjusted models. Finally, every patient was recruited in a single region of southern Spain and no genetic ancestry was estimated, so the carrier frequencies that determine power here will not transfer directly to other populations.
5. Conclusions
In this exploratory NSCLC cohort no primary-endpoint association met the declared correction threshold. HLA-DQA1 lineage-associated divergence generated a secondary hypothesis, but its support depended on how the exposure was defined and on how widely multiplicity was corrected; and in an independent cohort the B*14 association was not supported while the A*02 comparison was inconclusive.
The constraint behind all of it is molecular. Exome capture supports HLA analysis at allele-group resolution but not KIR allele assignment, and aggregation is not a neutral summary at either level: the B27 supertype concealed an opposing pair of allele-group effects, and the first-field group DQB1*03 concealed the signal carried by DQB1*03:01.
A report that fixes one level of aggregation without showing the others cannot tell a reader whether a null is a null. Pre-specifying both exposure families, correcting across their union and publishing the genotype landscape beside the association are what make a cohort of this size worth pooling. Independent validation is required before any claim of clinical utility.
Supplementary Materials
The following supporting information can be downloaded at the website of this paper posted on Preprints.org. Supplementary Notes 1–10 cover endpoint definitions and reconstruction, genotyping provenance and validation, divergence recomputation, statistical detail, the DQA1 decomposition, the association landscape and permutation levels, class I decomposition and sensitivity analyses, the external cohort protocol and reconstructed overall survival. Figure S1–S5 show participant flow (S1), the joint distribution of the two class I markers (S2), time-to-event analyses by three-level B27 grouping (S3), the class II decomposition (S4) and overall survival by DQA1 lineage in 82 patients with an assignable lineage (S5). Table S1–S24, with their sub-panels and the Supplementary Methods sheet, are in a single indexed workbook.
Author Contributions
Conceptualization, J.O., A.R. and I.B.; methodology, A.R., J.L.O. G.P.-L. and M.R.-A ; software, A.R., J.L.O. and G.P.-L.; data curation, E.P.-R., J.C.B. and A.C.; investigation, A.G.-H., M.G.-B. and B.M.-G.; formal analysis, A.G.-H., M.G.-B. and B.M.-G.; writing—original draft preparation, J.O. and A.R.; writing—review and editing, J.O., A.G.-H. and A.R.; supervision, J.O. and A.R.-D.; funding acquisition, J.O and AR ; All authors have read and agreed to the published version of the manuscript.
Funding
This research was funded by the Consejería de Conocimiento, Investigación y Universidad, Junta de Andalucía, grant number PAIDI P21-01002. J.O. and I.B. hold Nicolás Monardes research contracts from the Consejería de Salud y Consumo, Junta de Andalucía (J.O.: C1-0003-2023).
Institutional Review Board Statement
This study was conducted in accordance with the Declaration of Helsinki and approved by the Provincial Research Ethics Committee of Málaga (PEIBA), reference number 26-10-2017. Written informed consent was obtained from all participants included in the study.
Informed Consent Statement
Written informed consent was obtained from all the participants involved in the study.
Data Availability Statement
The data supporting the findings of this study are not publicly available. Individual-level germline genotype data and linked clinical data cannot be deposited in an open repository because the consent obtained from participants does not cover open publication of individual genetic data. Aggregate carrier frequencies for all testable HLA class I and class II allele groups and all KIR genes, together with the complete association output for all six hypothesis families, are provided in the Supplementary Materials. Individual-level data are available from the corresponding author on reasonable request, subject to approval by the regional research ethics committee and to a data transfer agreement. The external comparison cohort is public: only the already published POLYSOLVER germline class I calls (sheet Table_S9_Polysolver_HLA_Results of the supplementary tables of the open-access report [45]) and the clinical annotations distributed with them were used. The file was downloaded on 14 August 2026 and its checksum verified; the SU2C-MARK data repository is available under a CC-BY 4.0 licence at Zenodo (doi:10.5281/zenodo.7625517) [45]. No controlled-access resource (dbGaP) and no raw sequencing data were accessed. The analysis code, the dated internal analysis protocol, the frozen pre-specification documents for the external validation and the rules used to audit the manuscript's numbers are deposited at Zenodo (doi:10.5281/zenodo.23180011). The deposit contains no individual-level data.
Acknowledgments
We thank the patients and their families, and the clinical teams at both participating hospitals. We also thank the Picasso Supercomputer, University of Málaga (UMA), for providing the high-performance computing resources used for the genomic analyses presented in this study. During the preparation of this manuscript the authors used Anthropic Claude (Sonnet and Opus model families, 2025 and 2026 releases) for the purposes of language editing and of drafting and reviewing analysis code. The authors have reviewed and edited the output and take full responsibility for the content of this publication.
Conflicts of Interest
The authors declare no conflicts of interest. The funders had no role in the design of the study, in the collection, analyses or interpretation of data, in the writing of the manuscript or in the decision to publish the results.
References
- Zhou, L.; Uemura, T.; Abbar, B.; Deng, S. A narrative review of immunotherapy for non-small cell lung cancer: current progress, sensitization approaches, and synergistic strategies. Transl. Lung Cancer Res. 2025, 14, 3249–3269. [Google Scholar] [CrossRef] [PubMed]
- Russano, M.; La Cava, G.; Cortellini, A.; Citarella, F.; Galletti, A.; Di Fazio, G.R.; et al. Immunotherapy for Metastatic Non-Small Cell Lung Cancer: Therapeutic Advances and Biomarkers. Curr. Oncol. 2023, 30, 2366–2387. [Google Scholar] [CrossRef] [PubMed]
- Qin, A.; Street, L.; Cease, K.; Viglianti, B.L.; Warren, E.H.; Zhao, L.; et al. Clinical Determinants of Durable Clinical Benefit of Pembrolizumab in Veterans With Advanced Non-Small-Cell Lung Cancer. Clin. Lung Cancer 2017, 18, 559–564. [Google Scholar] [CrossRef] [PubMed]
- Negrao, M.V.; Lam, V.K.; Reuben, A.; Rubin, M.L.; Landry, L.L.; Roarty, E.B.; et al. PD-L1 Expression, Tumor Mutational Burden, and Cancer Gene Mutations Are Stronger Predictors of Benefit from Immune Checkpoint Blockade than HLA Class I Genotype in Non-Small Cell Lung Cancer. J. Thorac. Oncol. 2019, 14, 1021–1031. [Google Scholar] [CrossRef] [PubMed]
- Sabbatino, F.; Liguori, L.; Polcaro, G.; Salvato, I.; Caramori, G.; Salzano, F.A.; et al. Role of Human Leukocyte Antigen System as A Predictive Biomarker for Checkpoint-Based Immunotherapy in Cancer Patients. Int. J. Mol. Sci. 2020, 21, 7295. [Google Scholar] [CrossRef] [PubMed]
- Krishna, C.; Tervi, A.; Saffern, M.; Wilson, E.A.; Yoo, S.K.; Mars, N.; et al. An immunogenetic basis for lung cancer risk. Science 2024, 383, eadi3808. [Google Scholar] [CrossRef] [PubMed]
- Chowell, D.; Morris, L.G.T.; Grigg, C.M.; Weber, J.K.; Samstein, R.M.; Makarov, V.; et al. Patient HLA class I genotype influences cancer response to checkpoint blockade immunotherapy. Science 2018, 359, 582–587. [Google Scholar] [CrossRef] [PubMed]
- Abed, A.; Calapre, L.; Lo, J.; Correia, S.; Bowyer, S.; Chopra, A.; et al. Prognostic value of HLA-I homozygosity in patients with non-small cell lung cancer treated with single agent immunotherapy. J. Immunother. Cancer 2020, 8, e001620. [Google Scholar] [CrossRef] [PubMed]
- Pierini, F.; Lenz, T.L. Divergent Allele Advantage at Human MHC Genes: Signatures of Past and Ongoing Selection. Mol. Biol. Evol. 2018, 35, 2145–2158. [Google Scholar] [CrossRef] [PubMed]
- Grantham, R. Amino Acid Difference Formula to Help Explain Protein Evolution. Science 1974, 185, 862–864. [Google Scholar] [CrossRef] [PubMed]
- Han, J.; Dong, Y.; Zhu, X.; Reuben, A.; Zhang, J.; Xu, J.; et al. Assessment of human leukocyte antigen-based neoantigen presentation to determine pan-cancer response to immunotherapy. Nat. Commun. 2024, 15, 1199. [Google Scholar] [CrossRef] [PubMed]
- Chowell, D.; Krishna, C.; Pierini, F.; Makarov, V.; Rizvi, N.A.; Kuo, F.; et al. Evolutionary divergence of HLA class I genotype impacts efficacy of cancer immunotherapy. Nat. Med. 2019, 25, 1715–1720. [Google Scholar] [CrossRef] [PubMed]
- Jiang, T.; Jin, Q.; Wang, J.; Wu, F.; Chen, J.; Chen, G.; et al. HLA-I Evolutionary Divergence Confers Response to PD-1 Blockade plus Chemotherapy in Untreated Advanced Non-Small Cell Lung Cancer. Clin. Cancer Res. 2023, 29, 4830–4843. [Google Scholar] [CrossRef] [PubMed]
- Xu, J.; Wei, X.; Yao, J.; Mahajan, U.M.; Kahlert, U.D.; Shi, R.; et al. deltaHED predicts survival and immune evasion in PD-1 blockade therapy: A multi-cohort study across three cancer types. Clin. Transl. Med. 2026, 16, e70595. [Google Scholar] [CrossRef] [PubMed]
- Naranbhai, V.; Viard, M.; Dean, M.; Groha, S.; Braun, D.A.; Labaki, C.; et al. HLA-A*03 and response to immune checkpoint blockade in cancer: an epidemiological biomarker study. Lancet Oncol. 2022, 23, 172–184. [Google Scholar] [CrossRef] [PubMed]
- Shohdy, K.S.; Atherton, J.; Longland, J.; Alison, J.; Pillai, M.; Thistlethwaite, F. Patient-specific HLA-I subtypes predict response to immune checkpoint blockade. Oncoimmunology 2025, 14, 2462386. [Google Scholar] [CrossRef] [PubMed]
- Sidney, J.; Peters, B.; Frahm, N.; Brander, C.; Sette, A. HLA class I supertypes: a revised and updated classification. BMC Immunol. 2008, 9, 1. [Google Scholar] [CrossRef] [PubMed]
- Abed, A.; Reid, A.; Law, N.; Millward, M.; Gray, E.S. HLA-A01 and HLA-B27 supertypes, but not HLA homozygocity, correlate with clinical outcome among patients with non-small cell lung cancer treated with pembrolizumab in combination with chemotherapy. Cancers 2024, 16, 3102. [Google Scholar] [CrossRef] [PubMed]
- Lin, R.; Chen, X.; Su, F.; Wang, H.; Han, B.; Chen, Y.; et al. The germline HLA-A02B62 supertype is associated with a PD-L1-positive tumour immune microenvironment and poor prognosis in stage I lung cancer. Heliyon 2023, 9, e18948. [Google Scholar] [CrossRef] [PubMed]
- Pende, D.; Falco, M.; Vitale, M.; Cantoni, C.; Vitale, C.; Munari, E.; et al. Killer Ig-Like Receptors (KIRs): Their Role in NK Cell Modulation and Developments Leading to Their Clinical Exploitation. Front. Immunol. 2019, 10, 1179. [Google Scholar] [CrossRef] [PubMed]
- Parham, P. MHC class I molecules and KIRs in human history, health and survival. Nat. Rev. Immunol. 2005, 5, 201–214. [Google Scholar] [CrossRef] [PubMed]
- Trefny, M.P.; Rothschild, S.I.; Uhlenbrock, F.; Rieder, D.; Kasenda, B.; Stanczak, M.A.; et al. A Variant of a Killer Cell Immunoglobulin-like Receptor Is Associated with Resistance to PD-1 Blockade in Lung Cancer. Clin. Cancer Res. 2019, 25, 3026–3034. [Google Scholar] [CrossRef] [PubMed]
- Wiśniewski, A.; Jankowska, R.; Passowicz-Muszyńska, E.; Wiśniewska, E.; Majorczyk, E.; Nowak, I.; et al. KIR2DL2/S2 and HLA-C C1C1 genotype is associated with better response to treatment and prolonged survival of patients with non-small cell lung cancer in a Polish Caucasian population. Hum. Immunol. 2012, 73, 927–931. [Google Scholar] [CrossRef] [PubMed]
- Cummings, A.L.; Gukasyan, J.; Lu, H.Y.; Grogan, T.; Sunga, G.; Fares, C.M.; et al. Mutational landscape influences immunotherapy outcomes among patients with non-small-cell lung cancer with human leukocyte antigen supertype B44. Nat. Cancer 2020, 1, 1167–1175. [Google Scholar] [CrossRef] [PubMed]
- von Elm, E.; Altman, D.G.; Egger, M.; Pocock, S.J.; Gøtzsche, P.C.; Vandenbroucke, J.P. The Strengthening the Reporting of Observational Studies in Epidemiology (STROBE) statement: guidelines for reporting observational studies. Lancet 2007, 370, 1453–1457. [Google Scholar] [CrossRef] [PubMed]
- Eisenhauer, E.; Therasse, P.; Bogaerts, J.; Schwartz, L.; Sargent, D.; Ford, R.; et al. New response evaluation criteria in solid tumours: Revised RECIST guideline (version 1.1). Eur. J. Cancer 2009, 45, 228–247. [Google Scholar] [CrossRef] [PubMed]
- Tawbi, H.A.; Sullivan, R.J.; Feltquate, D.; LaVallee, T.; Rizvi, N.A.; Sharon, E.; et al. Society for Immunotherapy of Cancer (SITC) checkpoint inhibitor resistance definitions: efforts to harmonize terminology and accelerate immuno-oncology drug development. J. Immunother. Cancer 2023, 11, e007309. [Google Scholar] [CrossRef] [PubMed]
- González-Hernández, A.; Ríos, A.; Onieva, J.L.; Cantero, A.; Rivero-Aguilar, M.; Paz-López, G.; et al. Prospective germline exome and machine learning-based risk score identify predictive and prognostic biomarkers of immunotherapy outcomes in advanced non-small cell lung cancer. J. Transl. Med. 2026, 24, 1006. [Google Scholar] [CrossRef] [PubMed]
- González-Hernández, A.; Paz-López, G.; Martínez-Gálvez, B.; Paniagua, F.V.; Barragán, I.; Pérez-Ruiz, E.; et al. Association of IL7 rs16906115 Polymorphism with Immune-Related Adverse Events in Patients with Advanced Lung Cancer Undergoing Immunotherapy. J. Clin. Med. 2026, 15, 1486. [Google Scholar] [CrossRef] [PubMed]
- Chen, S.; Zhou, Y.; Chen, Y.; Gu, J. fastp: an ultra-fast all-in-one FASTQ preprocessor. Bioinformatics 2018, 34, i884–i890. [Google Scholar] [CrossRef] [PubMed]
- Li, H. Aligning sequence reads, clone sequences and assembly contigs with BWA-MEM. arXiv 2013, arXiv:1303.3997. [Google Scholar] [CrossRef]
- Song, L.; Bai, G.; Liu, X.S.; Li, B.; Li, H. Efficient and accurate KIR and HLA genotyping with massively parallel sequencing data. Genome Res. 2023, 33, 923–931. [Google Scholar] [CrossRef] [PubMed]
- Szolek, A.; Schubert, B.; Mohr, C.; Sturm, M.; Feldhahn, M.; Kohlbacher, O. OptiType: precision HLA typing from next-generation sequencing data. Bioinformatics 2014, 30, 3310–3316. [Google Scholar] [CrossRef] [PubMed]
- Orenbuch, R.; Filip, I.; Comito, D.; Shaman, J.; Pe'er, I.; Rabadan, R. arcasHLA: high-resolution HLA typing from RNAseq. Bioinformatics 2020, 36, 33–40. [Google Scholar] [CrossRef] [PubMed]
- Cisneros, E.; Moraru, M.; Gómez-Lozano, N.; Muntasell, A.; López-Botet, M.; Vilches, C. Haplotype-Based Analysis of KIR-Gene Profiles in a South European Population,Distribution of Standard and Variant Haplotypes, and Identification of Novel Recombinant Structures. Front. Immunol. 2020, 11, 440. [Google Scholar] [CrossRef] [PubMed]
- Firth, D. Bias reduction of maximum likelihood estimates. Biometrika 1993, 80, 27–38. [Google Scholar] [CrossRef]
- Heinze, G.; Schemper, M. A solution to the problem of separation in logistic regression. Stat. Med. 2002, 21, 2409–2419. [Google Scholar] [CrossRef] [PubMed]
- Grambsch, P.M.; Therneau, T.M. Proportional hazards tests and diagnostics based on weighted residuals. Biometrika 1994, 81, 515–526. [Google Scholar] [CrossRef]
- Royston, P.; Parmar, M.K. Restricted mean survival time: an alternative to the hazard ratio for the design and analysis of randomized trials with a time-to-event outcome. BMC Med. Res. Methodol. 2013, 13, 152. [Google Scholar] [CrossRef] [PubMed]
- Benjamini, Y.; Hochberg, Y. Controlling the False Discovery Rate: A Practical and Powerful Approach to Multiple Testing. J. R. Stat. Soc. Ser. B 1995, 57, 289–300. [Google Scholar] [CrossRef]
- Li, J.; Ji, L. Adjusting multiple testing in multilocus analyses using the eigenvalues of a correlation matrix. Heredity 2005, 95, 221–227. [Google Scholar] [CrossRef] [PubMed]
- Meinshausen, N.; Maathuis, M.H.; Bühlmann, P. Asymptotic optimality of the Westfall-Young permutation procedure for multiple testing under dependence. Ann. Stat. 2011, 39, 3369–3391. [Google Scholar] [CrossRef]
- VanderWeele, T.J.; Ding, P. Sensitivity Analysis in Observational Research: Introducing the E-Value. Ann. Intern. Med. 2017, 167, 268–274. [Google Scholar] [CrossRef] [PubMed]
- Shukla, S.A.; Rooney, M.S.; Rajasagi, M.; Tiao, G.; Dixon, P.M.; Lawrence, M.S.; et al. Comprehensive analysis of cancer-associated somatic mutations in class I HLA genes. Nat. Biotechnol. 2015, 33, 1152–1158. [Google Scholar] [CrossRef] [PubMed]
- Ravi, A.; Hellmann, M.D.; Arniella, M.B.; Holton, M.; Freeman, S.S.; Naranbhai, V.; et al. Genomic and transcriptomic analysis of checkpoint blockade response in advanced non-small cell lung cancer. Nat. Genet. 2023, 55, 807–819. [Google Scholar] [CrossRef] [PubMed]
- Viechtbauer, W. Conducting Meta-Analyses in R with the metafor Package. J. Stat. Softw. 2010, 36, 1–48. [Google Scholar] [CrossRef]
- Gomez-Massa, E.; Enrich, E.; Nunes, J.M.; Herrero Mata, M.J.; Rudilla, F. Analysis of HLA allelic and haplotypic frequencies in a cohort of bone marrow donors in Catalonia: impact of next-generation sequencing on donor registry quality. HLA 2025, 106, e70441. [Google Scholar] [CrossRef] [PubMed]
- Gonzalez-Galarza, F.F.; McCabe, A.; Santos, E.J.M.; Jones, J.; Takeshita, L.; Ortega-Rivera, N.D.; et al. Allele frequency net database (AFND) 2020 update: gold-standard data classification, open access genotype data and new query tools. Nucleic Acids Res. 2020, 48, D783–D788. [Google Scholar] [CrossRef] [PubMed]
- Khalil-Daher, I.; Boisgérault, F.; Feugeas, J.P.; Tieng, V.; Toubert, A.; Charron, D. Naturally processed peptides from HLA-DQ7 (α1*0501-β1*0301): influence of both α and β chain polymorphism in the HLA-DQ peptide binding specificity. Eur. J. Immunol. 1998, 28, 3840–3849. [Google Scholar]
- Johansen, B.H.; Jensen, T.; Thorpe, C.J.; Vartdal, F.; Thorsby, E.; Sollid, L.M. Both α and β chain polymorphisms determine the specificity of the disease-associated HLA-DQ2 molecules, with β chain residues being most influential. Immunogenetics 1996, 45, 142–150. [Google Scholar] [CrossRef] [PubMed]
- Santos, S.; Balas, A.; Lillo, R.; Garcia-Sanchez, F.; Merino, J.L.; Vicario, J.L. HLA-B14 subtyping by semi-nested PCR-SSP and haplotype distribution in a Spanish population. Tissue Antigens 1997, 50, 671–674. [Google Scholar] [CrossRef] [PubMed]
- Paul, S.; Weiskopf, D.; Angelo, M.A.; Sidney, J.; Peters, B.; Sette, A. HLA Class I Alleles Are Associated with Peptide-Binding Repertoires of Different Size, Affinity, and Immunogenicity. J. Immunol. 2013, 191, 5831–5839. [Google Scholar] [CrossRef] [PubMed]
- Leitman, E.M.; Willberg, C.B.; Tsai, M.H.; Chen, H.; Buus, S.; Chen, F.; et al. HLA-B*14:02-Restricted Env-Specific CD8+ T-Cell Activity Has Highly Potent Antiviral Efficacy Associated with Immune Control of HIV Infection. J. Virol. 2017, 91, e00544-17. [Google Scholar] [CrossRef] [PubMed]
- Schmidt, J.; Chiffelle, J.; Perez, M.A.S.; Magnin, M.; Bobisse, S.; Arnaud, M.; et al. Neoantigen-specific CD8 T cells with high structural avidity preferentially reside in and eliminate tumors. Nat. Commun. 2023, 14, 3188. [Google Scholar] [CrossRef] [PubMed]
- Boudreau, J.E.; Hsu, K.C. Natural Killer Cell Education and the Response to Infection and Cancer Therapy: Stay Tuned. Trends Immunol. 2018, 39, 222–239. [Google Scholar] [CrossRef] [PubMed]
Figure 1.
HLA-DQA1 evolutionary divergence is bimodal and tracks first-field lineage identity. (A) Recomputed divergence at HLA-DQA1 for 100 of the 102 genotyped patients (two had no computable value), plotted against whether the two alleles belong to the same first-field lineage (n = 20) or to different lineages (n = 65); the 15 patients labelled homozygous or reported with a single call are shown as a separate stratum. The shaded band marks the interval between 1.37 and 2.40 Grantham units, which contains no patient. (B) Odds ratios for no disease control at 12 months from Firth penalised logistic regression under five specifications of the DQA1 exposure (top to bottom, n = 75, 89, 66, 75 and 57): continuous divergence in the labelled heterozygote set, in all typed patients with zero divergence retained and in genuinely divergent pairs only; the binary same-lineage against between-lineage contrast; and continuous divergence within between-lineage pairs only. Continuous estimates are per standard deviation. Bars are 95% profile penalised-likelihood intervals on a logarithmic scale.
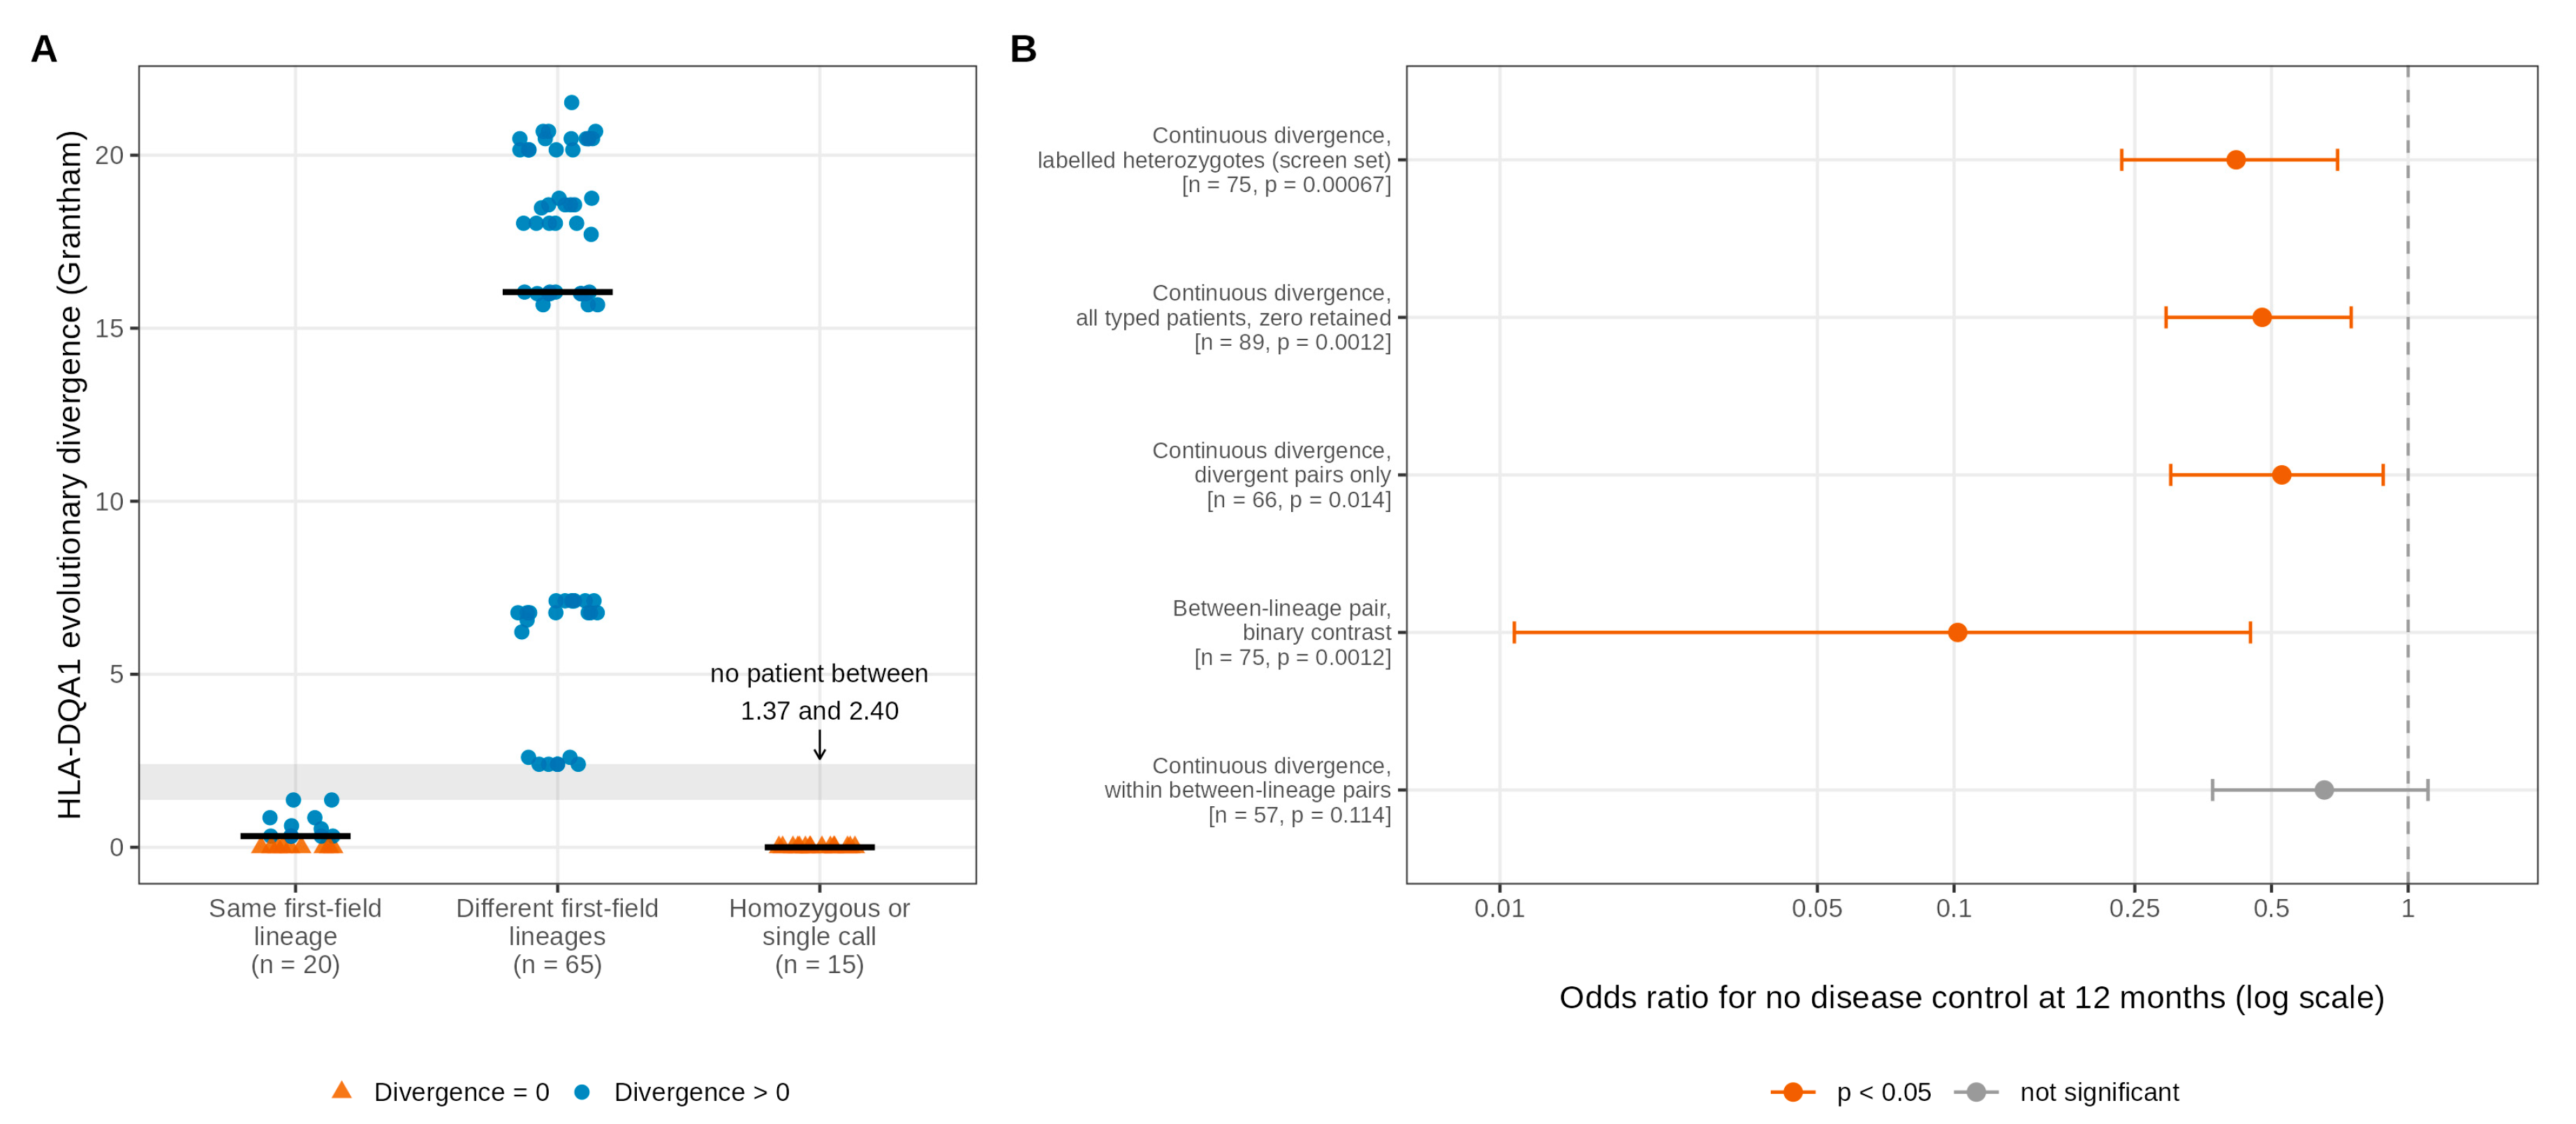
Figure 2.
Class I exposure landscape at the primary endpoint. (A) Nominal p-values for all 46 class I exposures (36 allele groups and 10 supertypes) at the 3-month landmark in the 99 patients with an assessable landmark, ordered by significance, with the four nominally significant exposures labelled. (B) Permutation family-wise error rates (10,000 permutations) for these four exposures at three nesting levels: within the locus or family, across the 36 allele groups and across all 46 class I exposures.
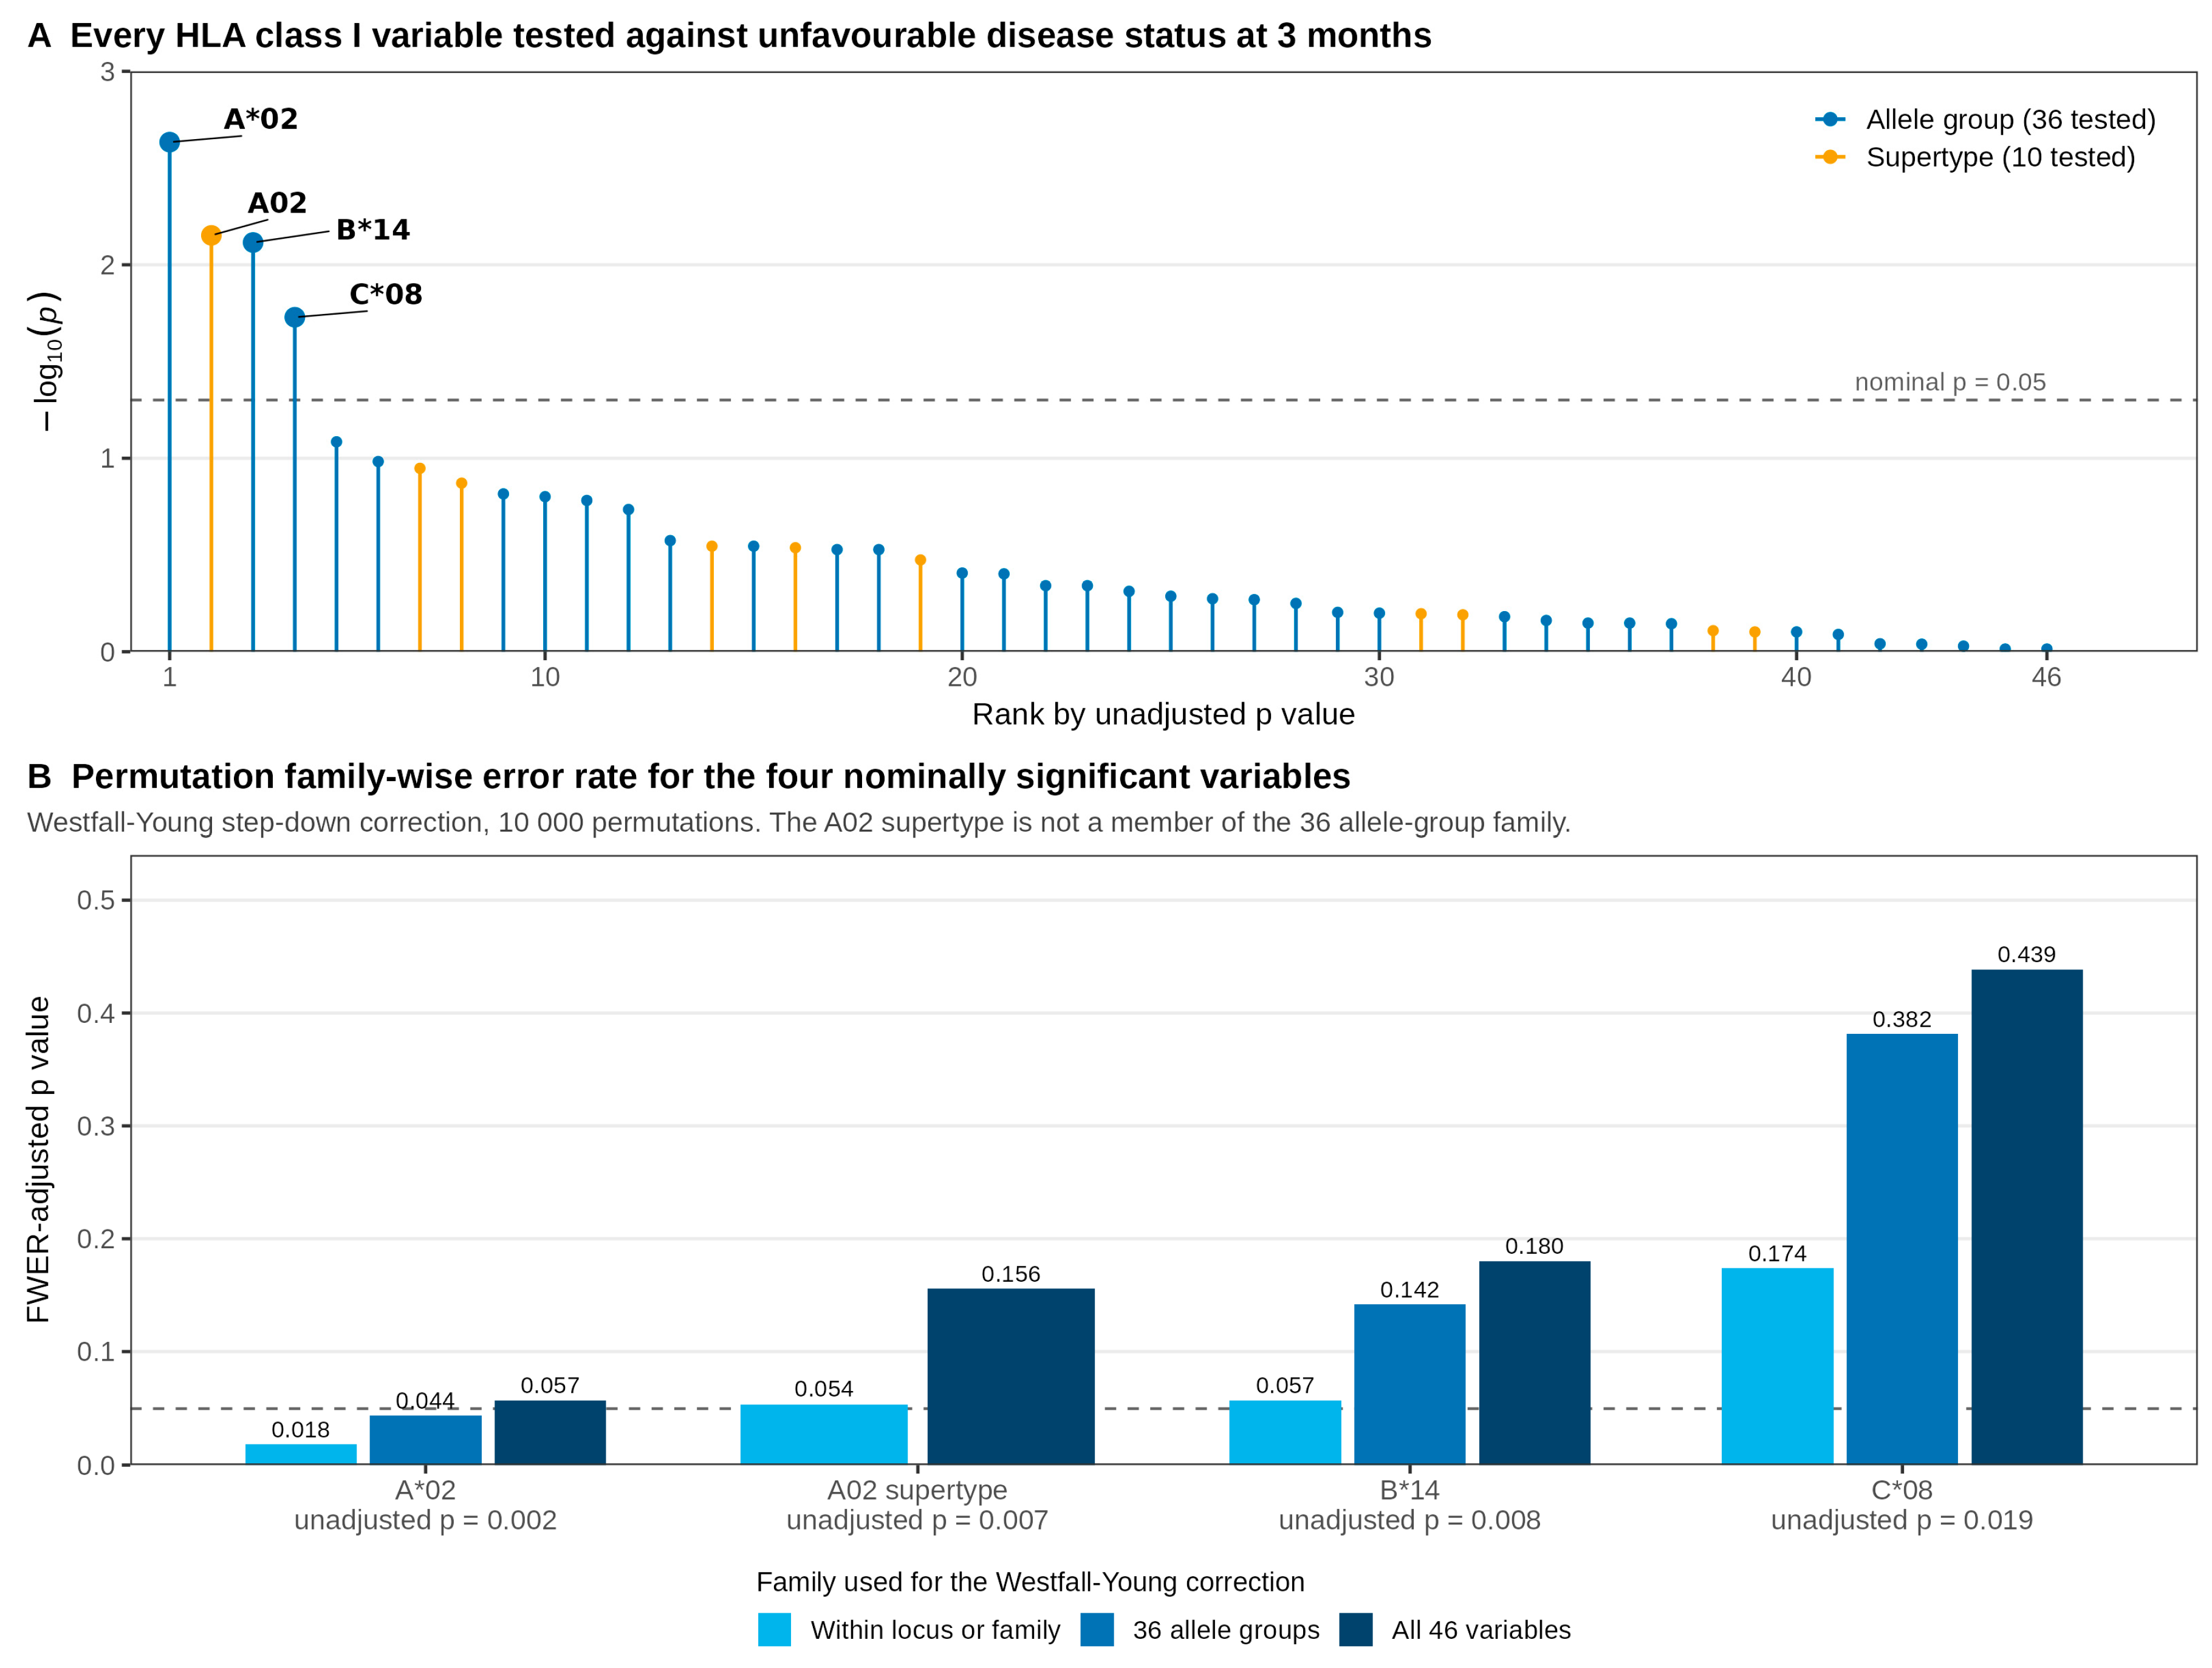
Figure 3.
HLA-A*02 carriage and early treatment failure. (A) Proportion of patients with unfavourable disease status at 3, 6 and 12 months by A*02 carrier status, with sample counts and Fisher's exact p-values. (B) Firth odds ratios at the 3-month landmark for the unadjusted model and four adjusted models (n = 99, 88, 84, 84 and 84). (C) Kaplan-Meier time to progression curves by A*02 carrier status in 98 patients, with numbers at risk.
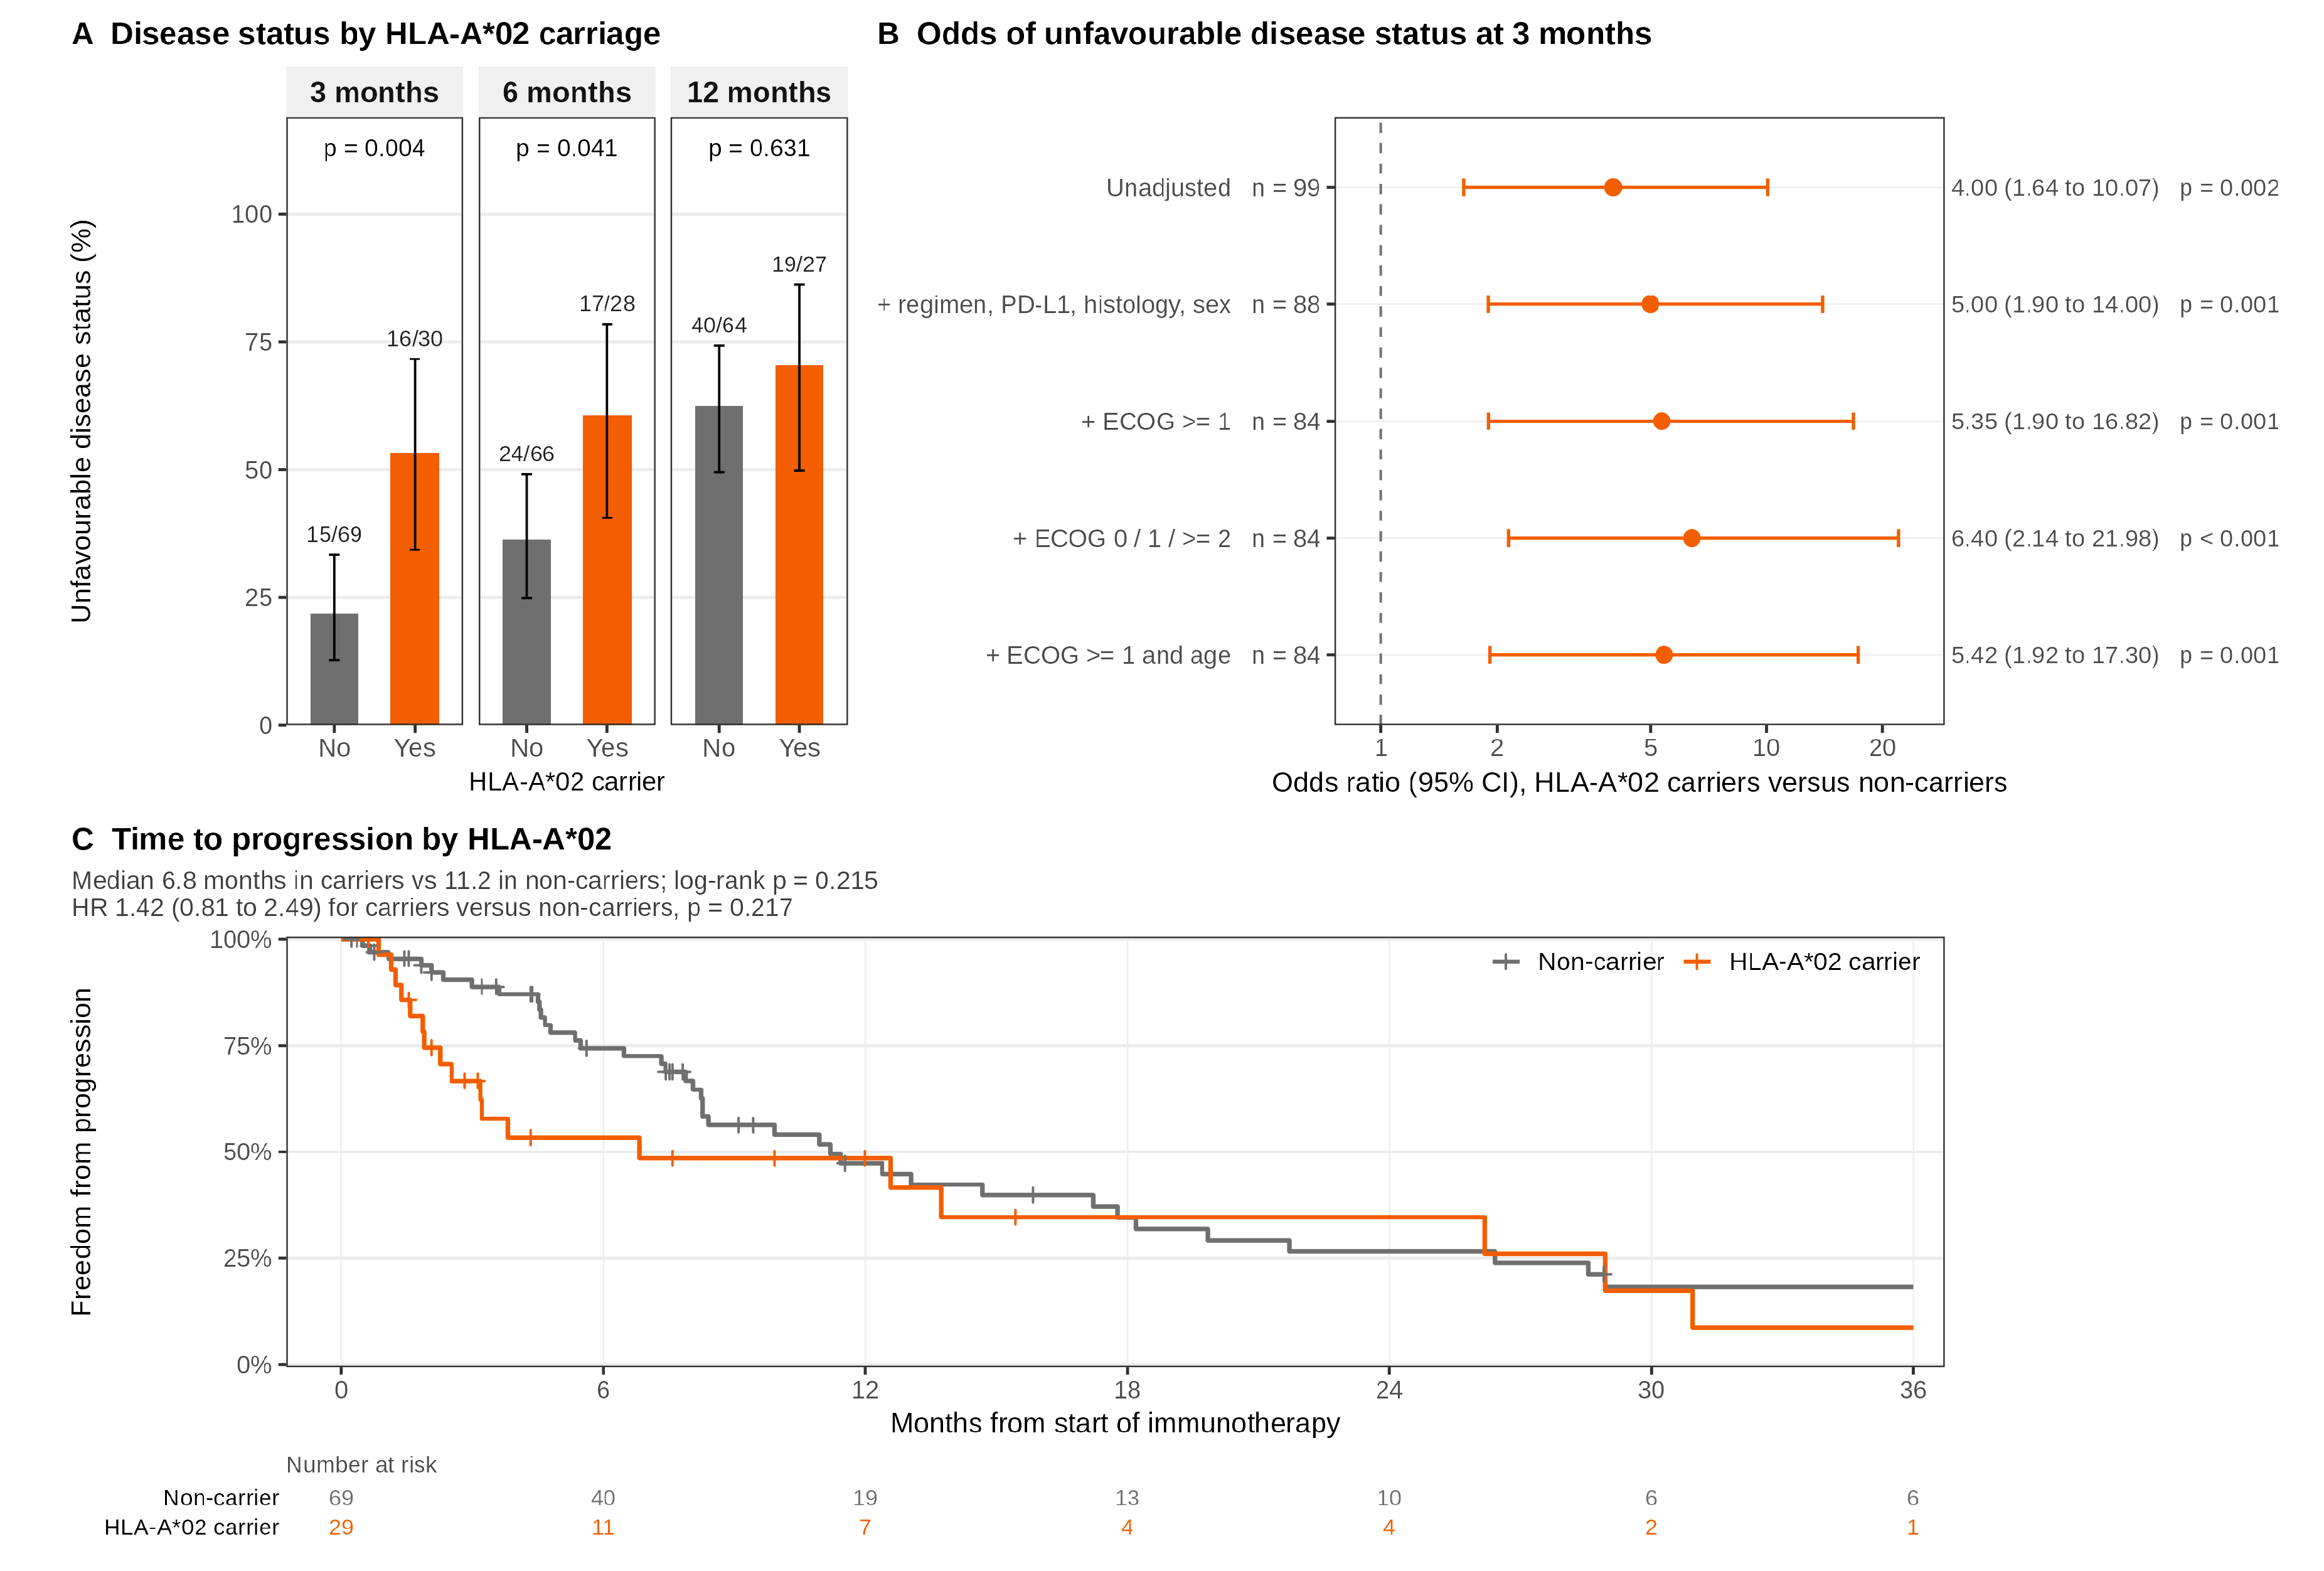
Figure 4.
HLA-B*14 carriage and treatment response. (A) Cross-tabulation of B*14 and C*08 carriage in the 102 genotyped patients (phi = 0.903, Fisher p = 3.1 × 10⁻¹²). (B) Proportion of patients with unfavourable disease status at 3, 6 and 12 months by B*14 carrier status (0.0% in carriers at 3 months), with sample counts and Fisher's exact p-values. (C) Kaplan-Meier time to progression curves by B*14 carrier status in 98 patients, with numbers at risk. (D) Hazard ratios for B*14 carriage under the three progression event definitions: documented progression, extended follow-up and archived coding (Table S13).
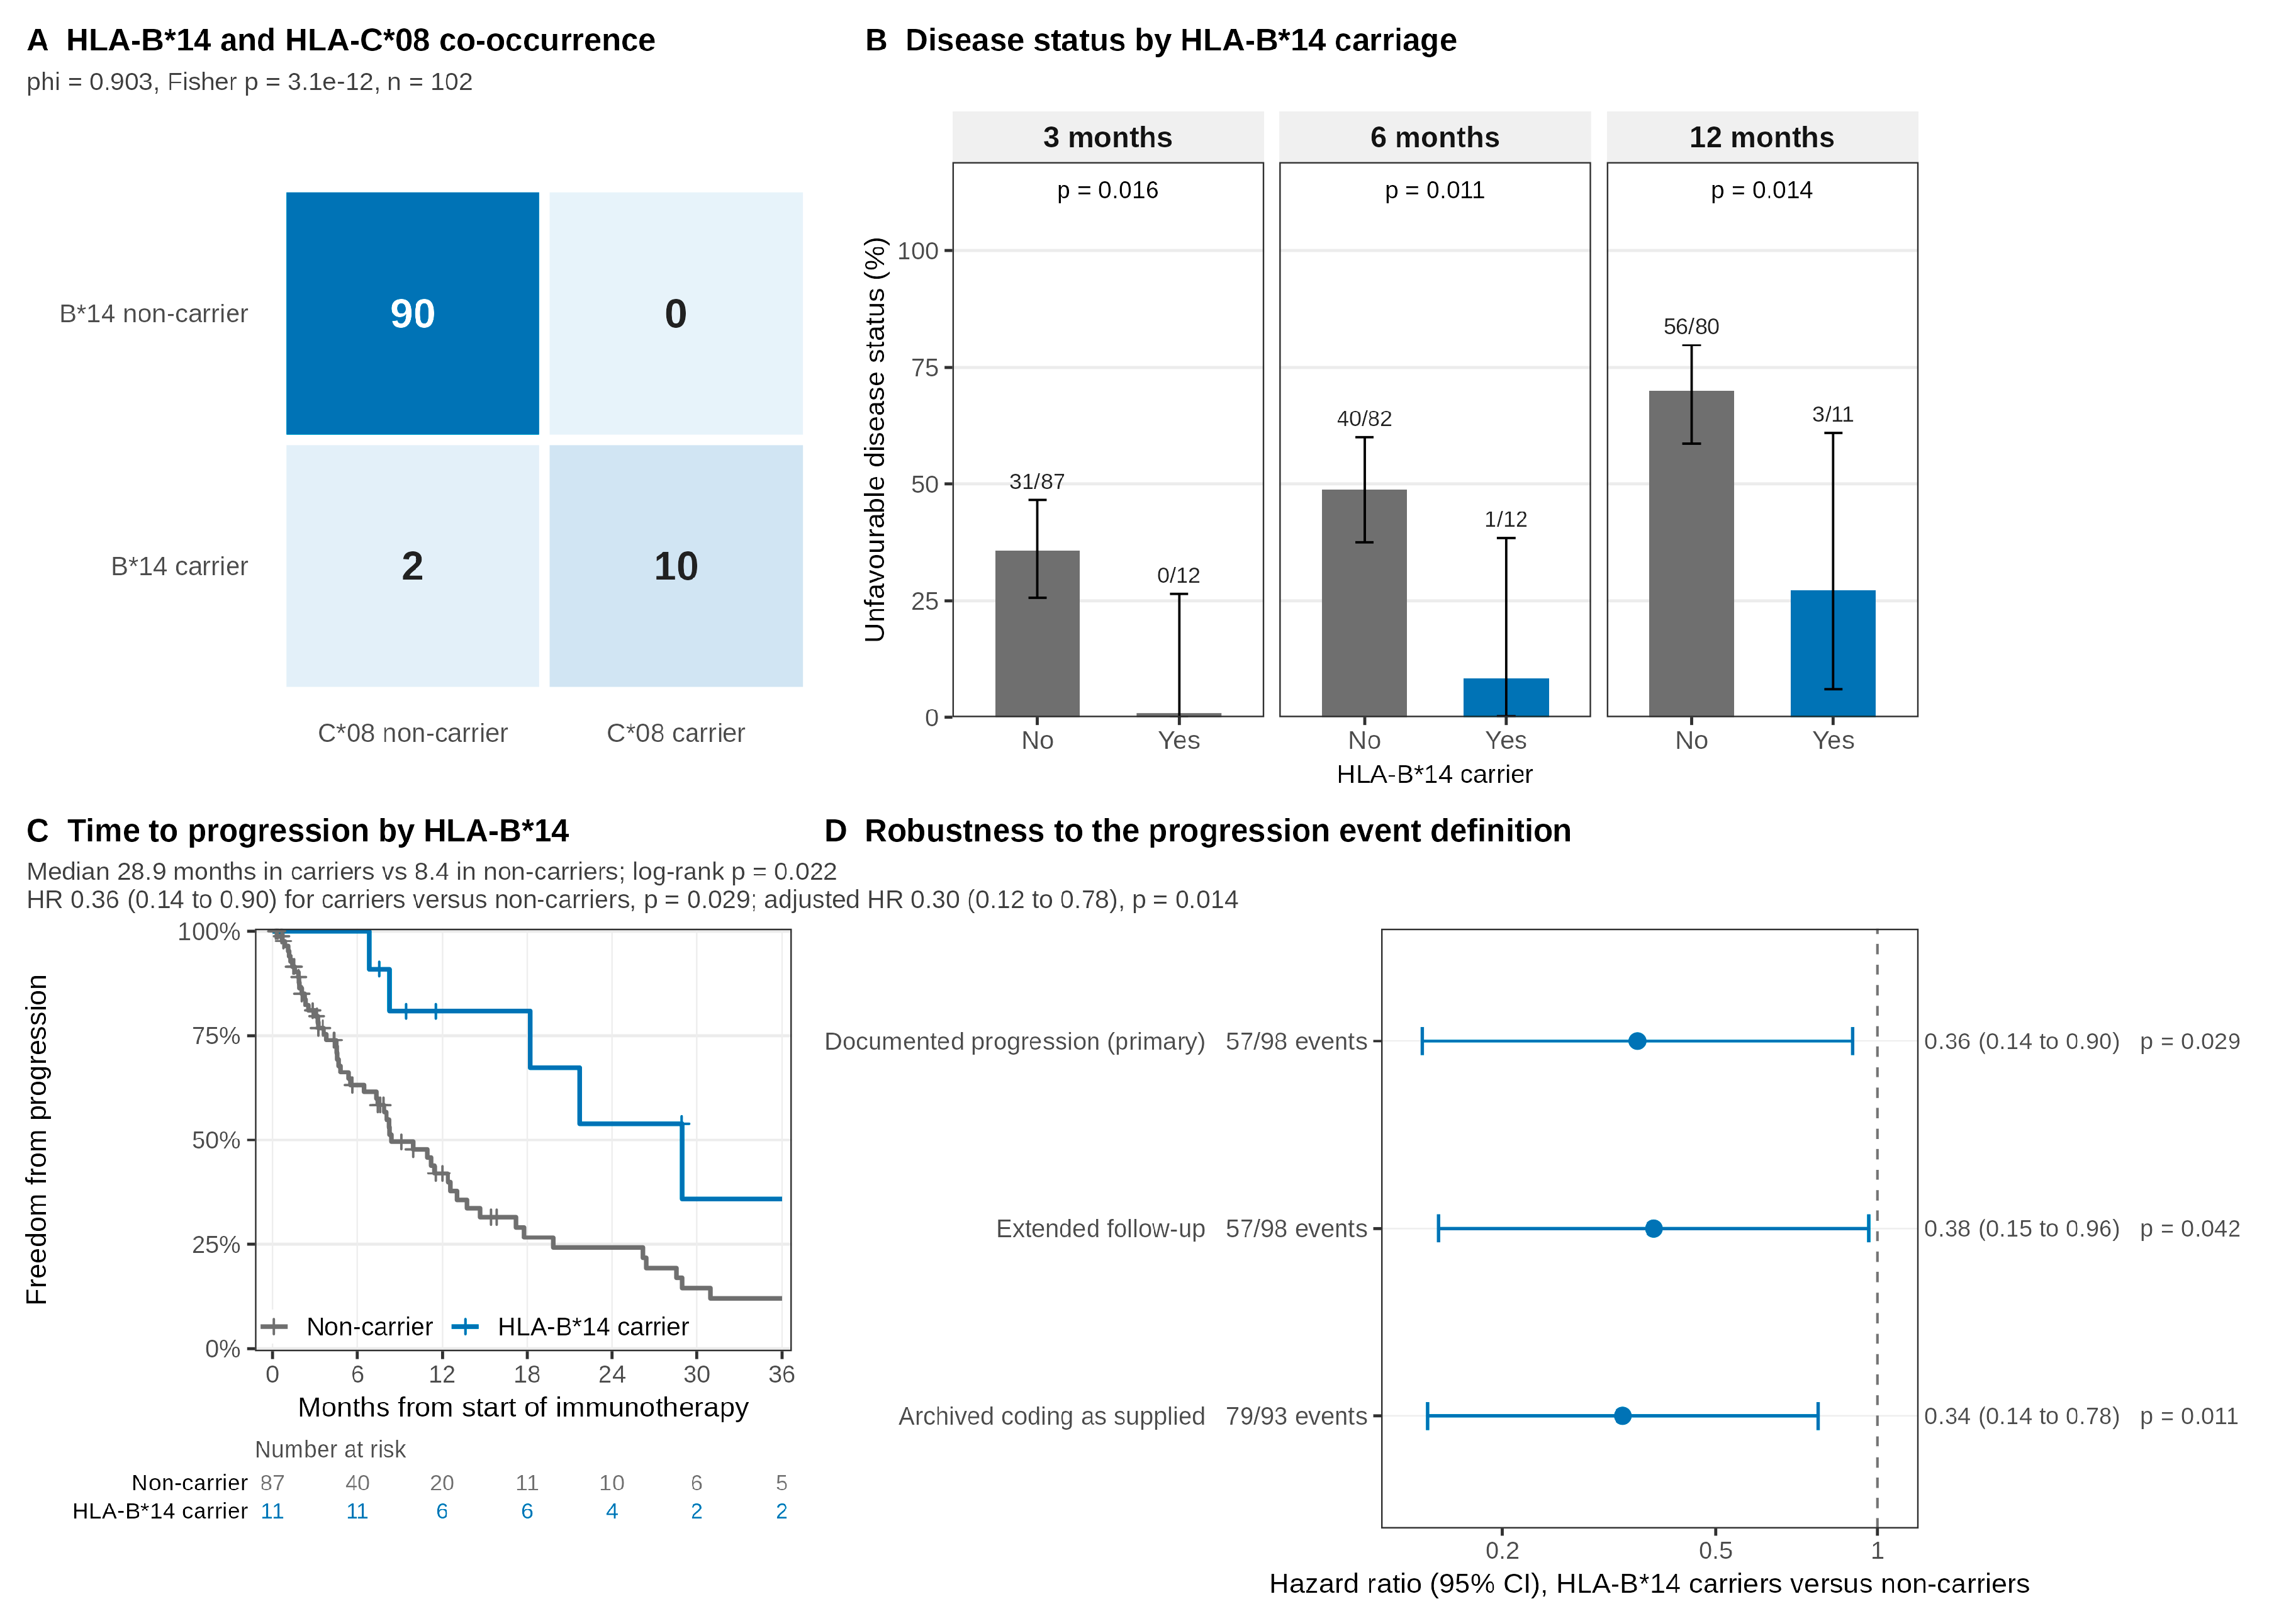
Figure 5.
Compatibility of the two class I signals with an independent public cohort. Forest plot of unadjusted Cox hazard ratios for the pre-specified contrasts in this cohort and in SU2C-MARK, with DerSimonian-Laird pooled estimates, Cochran Q p values and I²; the x axis is logarithmic and the dashed line marks the null. Internal estimates are fitted on the 95 patients with both a genotype and an evaluable time-to-progression record under the external protocol (Table S20).
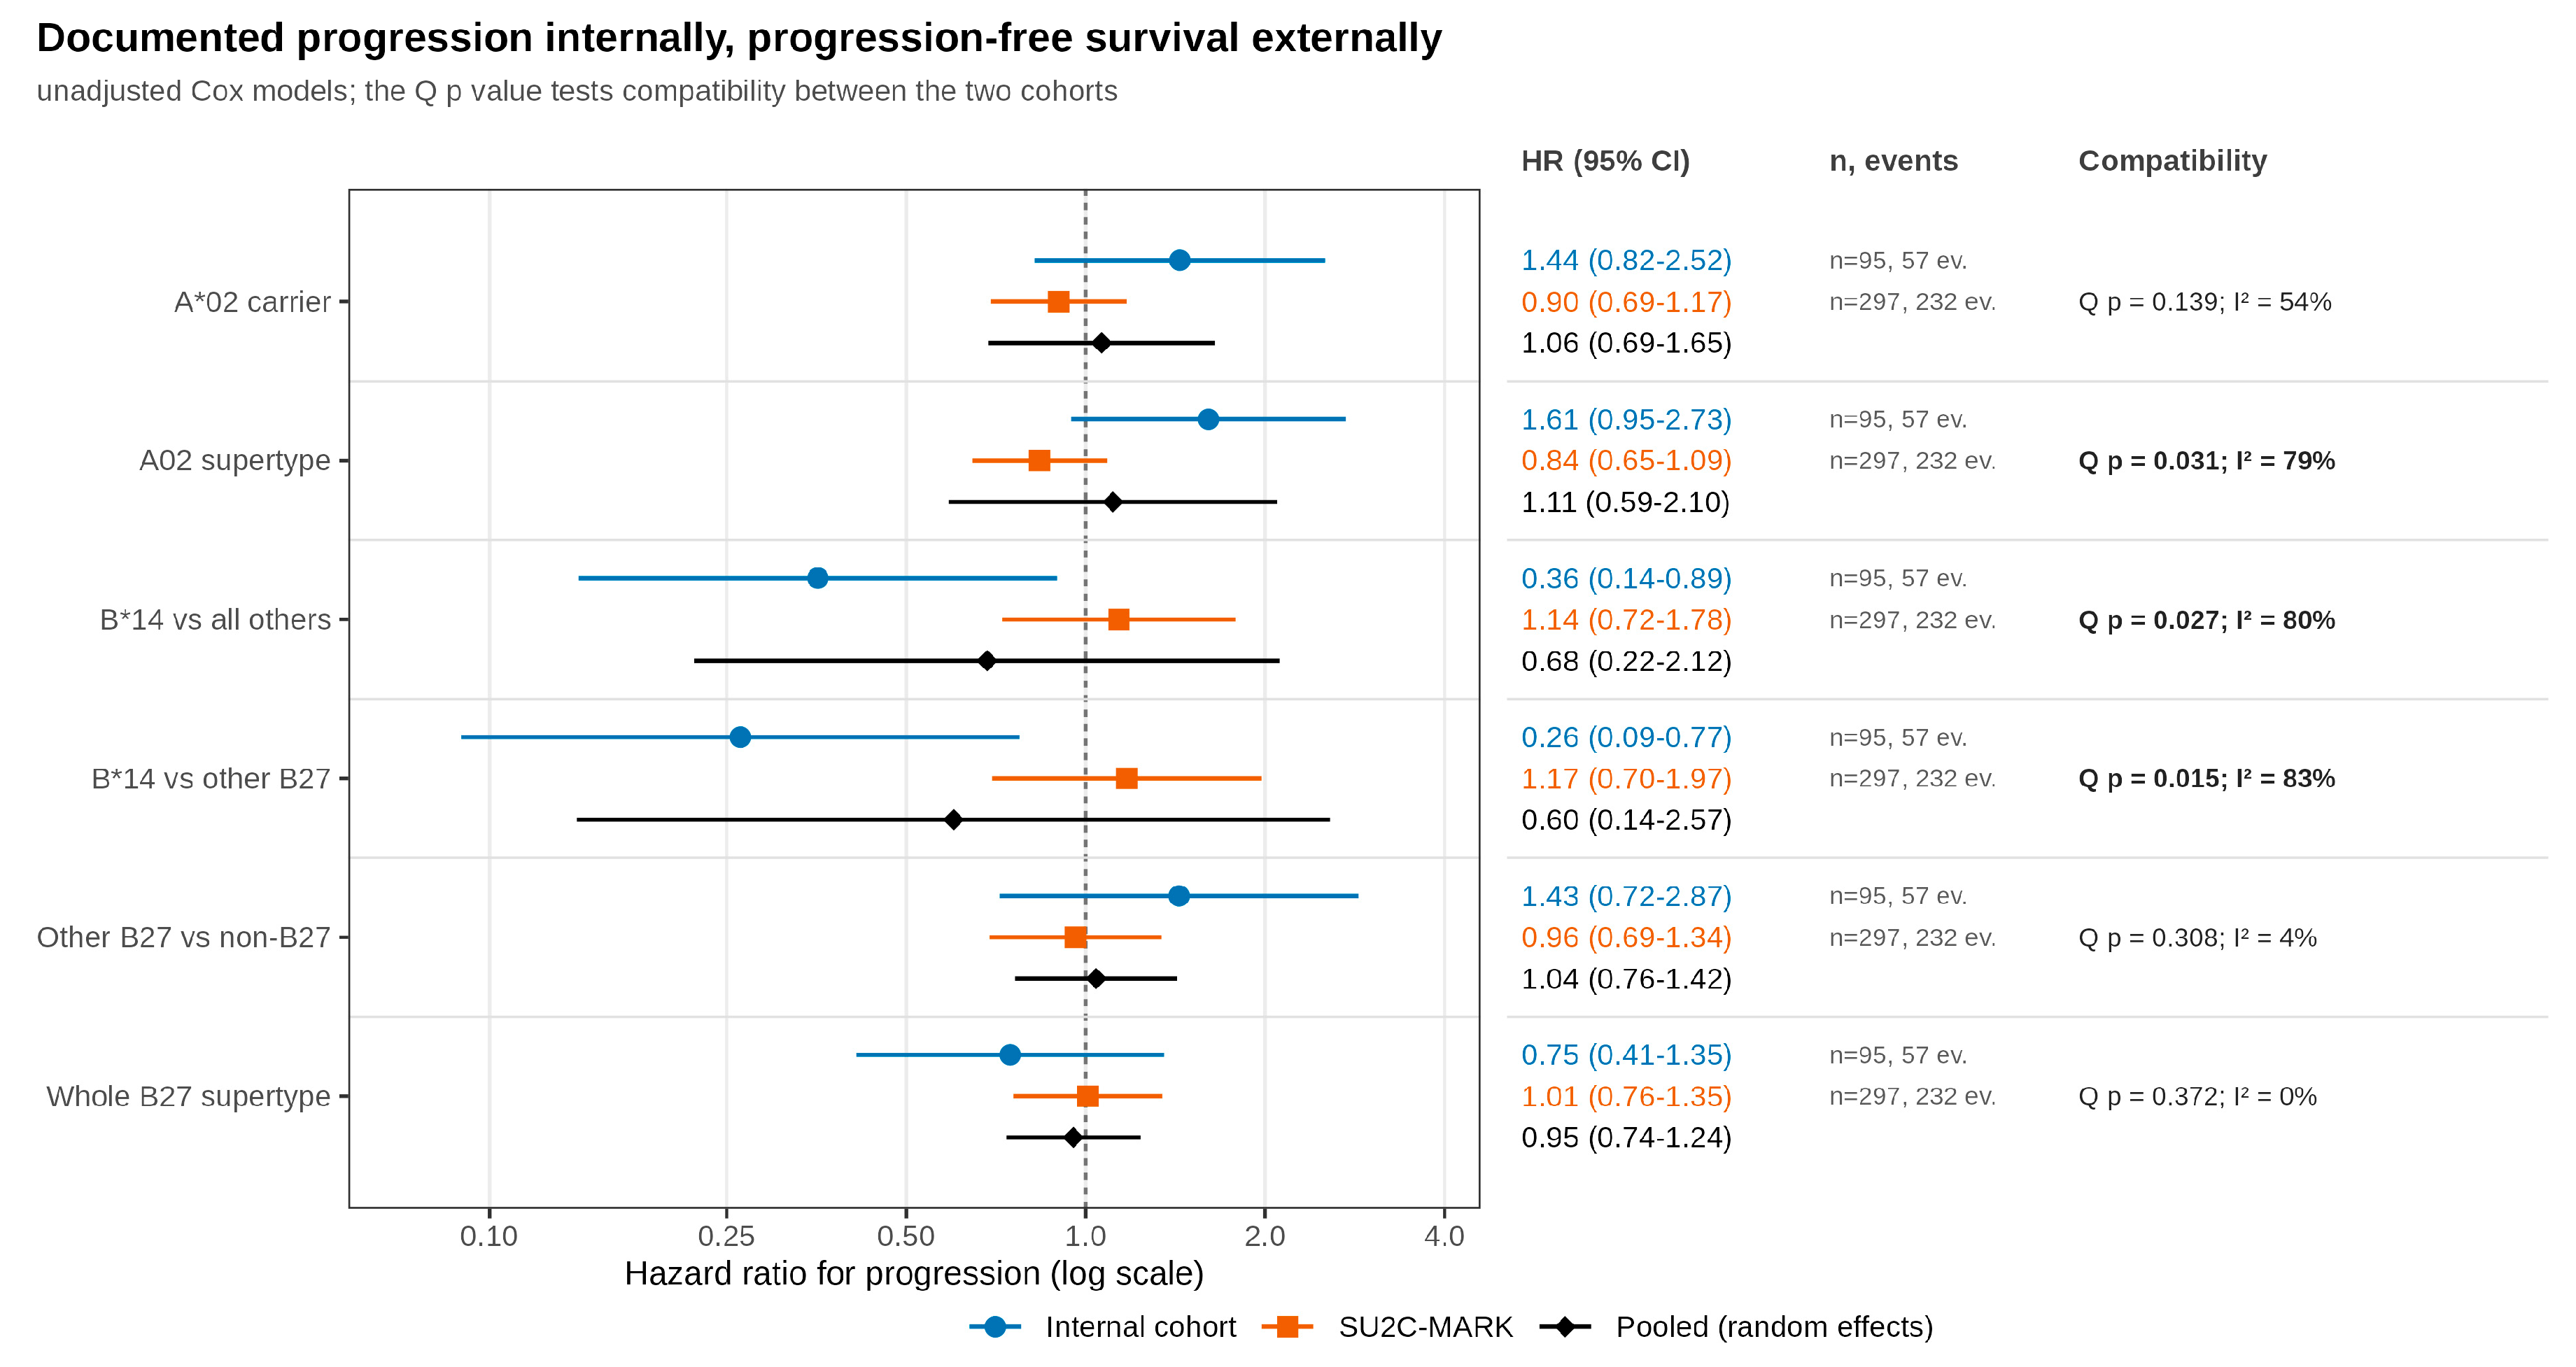

Table 1.
Baseline characteristics of the 99 genotyped patients with an assessable 3-month landmark. Values are n (%) unless otherwise stated; percentages use available data. P-values from Fisher's exact test (categorical variables) and the Wilcoxon rank-sum test (age).
Table 1.
Baseline characteristics of the 99 genotyped patients with an assessable 3-month landmark. Values are n (%) unless otherwise stated; percentages use available data. P-values from Fisher's exact test (categorical variables) and the Wilcoxon rank-sum test (age).
| Characteristic | Favourable (n = 68) | Unfavourable (n = 31) | Total (n = 99) | p | Missing |
|---|---|---|---|---|---|
| Patients, n | 68 | 31 | 99 | 0 | |
| Age, years, median (IQR) | 66.4 (59.4 to 71.5) | 64.7 (61.1 to 70.0) | 65.9 (59.8 to 71.0) | 0.818 | 0 |
| ECOG performance status: 0 | 18 (27.7) | 3 (10.0) | 21 (22.1) | 0.040 | 4 |
| 1 | 45 (69.2) | 23 (76.7) | 68 (71.6) | ||
| 2 or more | 2 (3.1) | 4 (13.3) | 6 (6.3) | ||
| Sex: Female | 14 (21.9) | 7 (22.6) | 21 (22.1) | 1.000 | 4 |
| Male | 50 (78.1) | 24 (77.4) | 74 (77.9) | ||
| Histology: Adenocarcinoma | 38 (59.4) | 22 (71.0) | 60 (63.2) | 0.365 | 4 |
| Non-adenocarcinoma | 26 (40.6) | 9 (29.0) | 35 (36.8) | ||
| PD-L1 tumour proportion score: High (50% or above) | 15 (24.6) | 5 (17.2) | 20 (22.2) | 0.654 | 9 |
| Low (1 to 49%) | 24 (39.3) | 11 (37.9) | 35 (38.9) | ||
| Negative (below 1%) | 22 (36.1) | 13 (44.8) | 35 (38.9) | ||
| Treatment: Chemo-immunotherapy | 50 (79.4) | 19 (63.3) | 69 (74.2) | 0.129 | 6 |
| ICI monotherapy | 13 (20.6) | 11 (36.7) | 24 (25.8) | ||
| Any immune-related adverse event: No | 30 (50.0) | 14 (53.8) | 44 (51.2) | 0.816 | 13 |
| Yes | 30 (50.0) | 12 (46.2) | 42 (48.8) | ||
| HLA-A*02 carrier: No | 54 (79.4) | 15 (48.4) | 69 (69.7) | 0.004 | 0 |
| Yes | 14 (20.6) | 16 (51.6) | 30 (30.3) | ||
| HLA-B*14 carrier: No | 56 (82.4) | 31 (100.0) | 87 (87.9) | 0.016 | 0 |
| Yes | 12 (17.6) | 0 (0.0) | 12 (12.1) | ||
| HLA-C*08 carrier: No | 58 (85.3) | 31 (100.0) | 89 (89.9) | 0.028 | 0 |
| Yes | 10 (14.7) | 0 (0.0) | 10 (10.1) |
Table 2.
The three class I allele groups with the strongest associations at the primary endpoint. Odds ratios from Firth penalised logistic regression with profile penalised-likelihood intervals; the adjusted model includes treatment type, PD-L1, histology and sex. Hazard ratios from Cox regression (98 patients). B*14 and C*08 are in near-complete linkage disequilibrium (phi 0.903); the lower limits near zero are profile penalised-likelihood limits, as no carrier of either had an unfavourable 3-month status.
| HLA-A*02 | HLA-B*14 | HLA-C*08 | |
|---|---|---|---|
| Carriers, n (%) | 30/99 (30.3%) | 12/99 (12.1%) | 10/99 (10.1%) |
| Unfavourable status at 3 months, OR (95% CI) | 4.00 (1.64 to 10.07), p = 0.002 | 0.07 (0.0006 to 0.58), p = 0.008 | 0.09 (0.0007 to 0.73), p = 0.019 |
| Adjusted for treatment, PD-L1, histology, sex, OR (95% CI) | 5.00 (1.90 to 14.00), p = 0.001 | 0.08 (0.0006 to 0.62), p = 0.011 | 0.10 (0.0007 to 0.83), p = 0.029 |
| Additionally adjusted for ECOG, OR (95% CI) | 5.35 (1.90 to 16.82), p = 0.001 | 0.08 (0.0006 to 0.67), p = 0.014 | 0.10 (0.0007 to 0.86), p = 0.033 |
| n for the ECOG-adjusted model | 84 | 84 | 84 |
| Unfavourable status at 6 months, OR (95% CI) | 2.64 (1.09 to 6.61), p = 0.031 | 0.14 (0.01 to 0.62), p = 0.007 | 0.17 (0.02 to 0.80), p = 0.023 |
| Unfavourable status at 12 months, OR (95% CI) | 1.39 (0.55 to 3.72), p = 0.495 | 0.18 (0.04 to 0.63), p = 0.007 | 0.25 (0.06 to 0.96), p = 0.044 |
| Median TTP, carriers vs non-carriers, months | 6.8 vs 11.2 | 28.9 vs 8.4 | 21.7 vs 9.9 |
| TTP hazard ratio (95% CI) | 1.42 (0.81 to 2.49), p = 0.217 | 0.36 (0.14 to 0.90), p = 0.029 | 0.54 (0.21 to 1.35), p = 0.185 |
| TTP hazard ratio adjusted (95% CI) | 1.29 (0.68 to 2.46), p = 0.432 | 0.30 (0.12 to 0.78), p = 0.014 | 0.41 (0.16 to 1.07), p = 0.067 |
| Schoenfeld residual p, TTP | 0.129 | 0.158 | 0.068 |
| Median PFS, carriers vs non-carriers, months | 3.2 vs 8.3 | 21.7 vs 6.5 | 20.8 vs 7.3 |
| PFS hazard ratio (95% CI) | 1.29 (0.80 to 2.06), p = 0.297 | 0.37 (0.17 to 0.81), p = 0.013 | 0.48 (0.21 to 1.10), p = 0.081 |
| PFS hazard ratio adjusted (95% CI) | 1.28 (0.76 to 2.17), p = 0.354 | 0.30 (0.13 to 0.68), p = 0.004 | 0.35 (0.14 to 0.83), p = 0.017 |
| Schoenfeld residual p, PFS | 0.172 | 0.036 | 0.030 |
| Permutation FWER within locus | 0.018 | 0.057 | 0.174 |
| Permutation FWER across the 36 class I allele groups | 0.044 | 0.142 | 0.382 |
Disclaimer/Publisher’s Note: The statements, opinions and data contained in all publications are solely those of the individual author(s) and contributor(s) and not of MDPI and/or the editor(s). MDPI and/or the editor(s) disclaim responsibility for any injury to people or property resulting from any ideas, methods, instructions or products referred to in the content. |
© 2026 by the authors. Licensee MDPI, Basel, Switzerland. This article is an open access article distributed under the terms and conditions of the Creative Commons Attribution (CC BY) license (http://creativecommons.org/licenses/by/4.0/).
Copyright: This open access article is published under a Creative Commons CC BY 4.0 license, which permit the free download, distribution, and reuse, provided that the author and preprint are cited in any reuse.