

Submitted:
08 October 2026
Posted:
09 October 2026
You are already at the latest version
Abstract
Calcareous desert deposits present significant challenges for geotechnical site characterisation because of their heterogeneous composition, variable carbonate cementation, and complex mechanical behaviour. This study investigates the practical engineering value of electrical resistivity as a supplementary site-characterisation tool within an integrated geotechnical investigation framework at the Shagaya Renewable Energy Project, Kuwait. The investigation combined an extensive field database comprising 50 boreholes, 10 Cone Penetration Tests (CPTs), 19 Plate Load Tests (PLTs), laboratory testing, and six electrical resistivity survey locations. The results indicate that the site is predominantly underlain by medium-dense to very dense calcareous sandy deposits exhibiting substantial variability in density, fines content, carbonate cementation, penetration resistance, and foundation stiffness. Standard Penetration Test (SPT) N-values ranged from 10 to 84, CPT cone resistance values ranged from 15 to 27.5 MPa, and PLT-derived modulus of subgrade reaction (Ks) values ranged from 24.3 to 210.3 MN/m³, demonstrating considerable spatial variability in engineering behaviour. Electrical resistivity values ranged from 57.2 to 271.9 Ω·m and provided additional insight into subsurface heterogeneity. Higher resistivity values generally corresponded to denser, more strongly cemented deposits, whereas lower values were associated with finer-grained or less cemented materials. Unlike previous studies that focused on developing empirical resistivity-based correlations, this research evaluates electrical resistivity as a complementary investigation tool integrated with conventional geotechnical methods. Because direct spatial matching between geophysical and geotechnical observations was unavailable, the study does not seek to establish site-specific predictive relationships. Instead, resistivity measurements are interpreted alongside borehole, laboratory, SPT, CPT, and PLT data to improve understanding of subsurface variability and support engineering judgement. The proposed integrated geotechnical-geophysical framework enhances site characterisation, reduces uncertainty, and provides practical guidance for foundation investigations in heterogeneous calcareous deposits and large-scale renewable-energy developments in arid environments.
Keywords:
electrical resistivity
; integrated geotechnical-geophysical investigation
; calcareous desert deposits
; foundation stiffness
; modulus of subgrade reaction (Ks)
; Plate Load Test (PLT)
; Cone Penetration Test (CPT)
; carbonate cementation
; spatial variability
; renewable-energy infrastructure
; arid-region geotechnics
; Kuwait
1. Introduction
The rapid expansion of large-scale mega projects in arid regions has increased demand for reliable geotechnical site characterisation methods that support the design of access roads, equipment foundations, electrical substations, and associated infrastructure. In desert environments, foundation performance is strongly influenced by the spatial variability of subsurface conditions, particularly in calcareous soil deposits that commonly exhibit heterogeneous composition, variable cementation, and complex mechanical behaviour.
Accurate characterisation of these deposits is therefore essential for evaluating bearing capacity, settlement behaviour, and foundation stiffness during the design and construction of renewable energy developments. Calcareous desert deposits are widespread throughout the Arabian Gulf region and consist primarily of carbonate-rich sands, sandy silts, and weakly to strongly cemented soil horizons [1].
Unlike conventional quartz-dominated sands, calcareous soils exhibit unique engineering characteristics resulting from their carbonate mineralogy, susceptibility to particle crushing, cementation effects, and high variability in density and structure [2,3]. Consequently, directly applying empirical geotechnical correlations developed for siliceous soils may introduce significant uncertainty when assessing the engineering properties of calcareous deposits [4,5]. This challenge has prompted increasing interest in developing site-specific characterisation methodologies that integrate multiple investigation techniques and datasets [6,7].
Traditional geotechnical investigations typically rely on borehole drilling, laboratory testing, Standard Penetration Tests (SPT), Cone Penetration Tests (CPT), and Plate Load Tests (PLT) to evaluate subsurface conditions and derive design parameters [8,9]. Among available field-testing methods, Plate Load Tests provide one of the most direct assessments of foundation response and modulus of subgrade reaction and are therefore particularly valuable for evaluating the stiffness characteristics of calcareous deposits supporting shallow foundations. These methods provide valuable information regarding soil stratigraphy, density, shear strength, compressibility, and stiffness [10]. However, because boreholes and in-situ tests represent discrete sampling locations, they may not fully capture lateral variations in subsurface conditions across large project sites [11,12]. For large-scale developments spanning several square kilometres, integrating supplementary characterisation techniques may improve confidence in geological and geotechnical interpretations [11,13]. Among available geophysical techniques, electrical resistivity surveys have gained increasing attention because of their rapid deployment, non-destructive nature, and ability to provide continuous spatial information [14,15].
Several factors influence electrical resistivity, including soil type, moisture content, density, degree of saturation, pore-water chemistry, and cementation. Variations in resistivity can therefore reflect changes in subsurface materials and may provide useful insights into geological heterogeneity [16,17]. Electrical resistivity methods have been widely applied in groundwater investigations, environmental studies, engineering geology, and subsurface characterisation [11,17]. Recent studies have demonstrated the growing value of electrical resistivity and electrical resistivity tomography (ERT) as non-destructive tools for geotechnical site assessment, soil classification, groundwater identification, slope investigation, and infrastructure characterisation [18,19,20]. Integrated geotechnical-geophysical approaches have shown considerable potential to improve subsurface interpretation by combining resistivity measurements with conventional site investigation data, enhancing spatial understanding of subsurface variability and reducing uncertainty associated with discrete sampling locations. However, their application to calcareous desert deposits remains relatively limited, particularly in arid environments where natural cementation and geological heterogeneity significantly influence engineering behaviour.
Previous studies have often attempted to establish direct correlations between electrical resistivity and geotechnical parameters such as SPT-N values, cone resistance, density, or shear strength [21]. However, many published correlations are highly site-specific and strongly dependent on local geology, moisture conditions, soil composition, and testing methodology [14,17]. Consequently, the transferability of such empirical relationships between different sites is often limited [11]. Furthermore, reliable statistical correlations generally require large datasets containing numerous paired geophysical and geotechnical observations [22]. In practice, many engineering investigations include only a limited number of resistivity measurements, which may restrict the development of robust predictive models [11,17]. Although electrical resistivity methods have become increasingly popular for geotechnical site characterisation, significant research gaps remain in their practical application to calcareous desert deposits. Most published studies have primarily focused on developing direct empirical correlations between resistivity and isolated geotechnical parameters such as SPT-N values, cone resistance, density, or soil strength [21]. Recent review studies have highlighted that, although resistivity-based correlations can provide useful preliminary estimates of geotechnical properties, their performance remains strongly dependent on soil type, moisture conditions, geological setting, density, and environmental factors, thereby limiting their transferability between different sites and soil deposits [22,23]. Consequently, relatively few studies have examined the practical role of electrical resistivity as a supplementary site-characterisation tool within an integrated investigation framework combining boreholes, laboratory testing, SPT, CPT, and Plate Load Tests. This limitation is particularly evident for calcareous desert deposits, where subsurface heterogeneity, variable cementation, and site-specific geological conditions often reduce the reliability and transferability of empirical predictive relationships. Furthermore, published studies integrating electrical resistivity measurements with field-derived foundation stiffness indicators, such as the modulus of subgrade reaction obtained from Plate Load Tests, remain scarce. For this reason, electrical resistivity should not always be viewed as a substitute for conventional geotechnical investigations. Instead, resistivity surveys can complement and enhance interpretations from boreholes, CPTs, laboratory testing, and plate load testing. Within an integrated investigation framework, geophysical data can help identify zones of differing density, cementation, or material composition and improve understanding of subsurface variability over large areas.
This study examines the role of electrical resistivity as a supplementary site characterisation tool within a comprehensive geotechnical investigation for the Shagaya Renewable Energy Project, Kuwait. The project site was investigated using an extensive database comprising approximately fifty boreholes, laboratory testing, plate load tests, multiple cone penetration tests, and six electrical resistivity survey locations. The available geotechnical data indicate the presence of predominantly calcareous desert deposits characterised by varying density, carbonate content, and engineering behaviour.
Unlike previous studies that primarily focused on developing empirical correlations between electrical resistivity and individual geotechnical parameters, this research investigates the practical integration of electrical resistivity within a large-scale, foundation-oriented site investigation programme for calcareous desert deposits. The study is based on one of the most extensive integrated geotechnical-geophysical datasets reported for calcareous desert deposits in Kuwait, comprising 50 boreholes, 10 CPT soundings, 19 Plate Load Tests, laboratory testing, and six electrical resistivity survey locations. A key contribution of the research is incorporating Plate Load Test-derived foundation stiffness information (Ks) into the geotechnical-geophysical interpretation process, an aspect rarely addressed in previous investigations of calcareous soils. Rather than proposing site-specific predictive equations with limited transferability, the study develops a practical interpretation framework linking electrical resistivity observations with density, carbonate cementation, and foundation stiffness. The proposed framework demonstrates how geophysical and geotechnical datasets can be integrated to improve site characterisation and reduce uncertainty in large-scale renewable-energy developments founded on heterogeneous calcareous desert deposits in arid regions. Although numerous studies have investigated relationships between electrical resistivity and soil properties, most have concentrated on predicting isolated parameters such as density, moisture content, shear strength, or penetration resistance. Comparatively little attention has been given to integrating resistivity data with foundation-performance indicators derived from Plate Load Tests, particularly in calcareous desert deposits characterised by highly variable cementation and heterogeneous subsurface conditions. Furthermore, published case studies based on extensive field datasets from large-scale renewable-energy developments remain scarce. This study addresses these gaps by combining geotechnical, geophysical, and foundation-response datasets within a unified interpretation framework specifically developed for calcareous desert environments. Table 1 compares representative published studies with the present research and highlights the distinctive integration of geotechnical and geophysical data adopted in this study.
Figure 1 presents the integrated geotechnical-geophysical framework adopted in this study to characterise calcareous desert deposits and support foundation assessment. Accordingly, the objectives of this study are to: (i) characterise the engineering behaviour and spatial variability of calcareous desert deposits using integrated geotechnical investigations; (ii) evaluate the usefulness of electrical resistivity measurements as a supplementary site-characterisation tool; (iii) investigate the relationship between geophysical observations and geotechnical indicators of soil stiffness and density; and (iv) develop an integrated geotechnical–geophysical framework applicable to large-scale renewable-energy developments in arid environments. The findings are expected to provide useful guidance for future renewable-energy projects in arid regions, where efficient site characterisation is essential to minimise geotechnical uncertainty while optimising site investigation programmes. Furthermore, the study contributes to the growing body of knowledge on the engineering behaviour of calcareous desert soils and highlights the benefits of combining geotechnical and geophysical techniques within a unified site characterisation framework.
2. Methodology
2.1. Site Description and Geological Setting
The study site is in the Shagaya area in southwestern Kuwait, about 60 km from Kuwait City, as shown in Figure 2. The Shagaya region is part of Kuwait’s western desert and has been selected for several large-scale renewable energy developments because of its favourable climate and geography. The area is characterised by predominantly desert terrain consisting of sandy deposits with varying degrees of carbonate content and natural cementation [24,25,26,27,28,29,30,31,32,33]. Subsurface investigations revealed that the site is predominantly underlain by calcareous desert deposits comprising poorly graded sands, silty sands, sandy silts, and locally cemented carbonate-rich horizons. The investigated soils are generally classified as SW-SM, SM, and SC according to the Unified Soil Classification System (USCS). These deposits represent the widespread calcareous soils found throughout Kuwait and the Arabian Gulf region [24,25,26,27,30]. Carbonate mineralogy, particle-crushing susceptibility, and natural cementation strongly influence their engineering behaviour [1,2,3,4,5]. Consequently, the geotechnical response of calcareous soils may differ substantially from that of conventional quartz-dominated sands, particularly in terms of stiffness, strength, compressibility, and settlement behaviour [2,3,4,5].
2.2. Laboratory Testing Program
Laboratory testing was conducted on representative disturbed and undisturbed samples collected from the boreholes to determine the physical and engineering characteristics of the calcareous deposits investigated. The testing programme included grain-size distribution analysis, natural moisture content determination, Atterberg limits, soil classification, carbonate content determination, Modified Proctor compaction testing, California Bearing Ratio (CBR) testing, and direct shear testing. These laboratory investigations evaluated soil composition, moisture condition, compaction behaviour, bearing characteristics, carbonate content, and shear-strength parameters.
The laboratory results were used to characterise the engineering behaviour of the calcareous deposits and to support the interpretation of borehole logs, Standard Penetration Test (SPT) data, Cone Penetration Test (CPT) results, Plate Load Test (PLT) measurements, and electrical resistivity observations. Variations in particle-size distribution, fines content, carbonate accumulation, moisture condition, and shear-strength characteristics were evaluated to assess their influence on soil stiffness, natural cementation, bearing performance, and overall engineering behaviour. Previous investigations of calcareous desert deposits and renewable-energy infrastructure projects in Kuwait adopted similar approaches, integrating laboratory-derived engineering properties with field investigations to improve site characterisation and foundation assessments [24,26,27,30,31,32,33].
2.3. Integrated Site Investigation Program
The site investigation programme comprised 50 boreholes, 10 CPT soundings, 19 Plate Load Tests (PLTs), laboratory testing, and six electrical resistivity survey locations distributed throughout the project area. The programme was designed to characterise subsurface stratigraphy, evaluate engineering properties, and assess spatial variability within the calcareous desert deposits. Similar integrated investigation approaches have been adopted for renewable-energy developments and desert soil characterisation in Kuwait [30,31,32,33].
Boreholes were advanced using conventional rotary drilling techniques, and Standard Penetration Tests (SPTs) were performed at regular depth intervals to evaluate in-situ density and penetration resistance. Representative disturbed and undisturbed samples obtained from the boreholes were transported to the laboratory for index and engineering property determination. The borehole locations were distributed across the study area to capture lateral variability in subsurface conditions.
Cone Penetration Tests (CPTs) were conducted to provide continuous profiles of cone resistance and stratigraphic variability. Compared with borehole investigations, CPTs provided high-resolution measurements of subsurface conditions and helped identify local variations that discrete sampling may miss. The CPT results were interpreted together with borehole logs and laboratory data to establish a consistent geotechnical model of the site.
Plate Load Tests were performed at selected locations to evaluate the deformation behaviour of the near-surface deposits and to derive the modulus of subgrade reaction for foundation design. Incremental static loads were applied to a rigid steel plate positioned at the test surface, and corresponding settlements were recorded at each loading stage until the maximum test load was reached. Load-settlement curves were developed for each test location and subsequently used to evaluate foundation stiffness characteristics. The PLT results were considered the primary field-based indicator of foundation response and formed the basis for comparison with SPT, CPT, laboratory, and geophysical observations.
Electrical resistivity measurements were conducted at six locations (ER-01 to ER-06) distributed across the Shagaya Renewable Energy Project site to provide supplementary information on near-surface subsurface variability. The surveys used the four-electrode Wenner array, widely used in geotechnical and engineering geophysical investigations because of its simplicity, good signal-to-noise ratio, and sensitivity to changes in soil composition and stratigraphy.
For each survey location, resistivity measurements were obtained along two orthogonal directions (North-South and East-West) to account for potential lateral variability and anisotropy within the calcareous desert deposits. Apparent resistivity values were measured using electrode spacings of 1, 3, 5, and 10 m. Increasing electrode spacing increases the effective depth of investigation, allowing assessment of resistivity variations within progressively larger volumes of soil. Consequently, the adopted electrode spacings provided information on both shallow and relatively deeper subsurface conditions.
Prior to testing, the ground surface was prepared to ensure adequate electrode contact and stable measurements. Where possible, metallic objects and potential sources of electrical interference were avoided. At each measurement location, current was introduced into the ground through the outer electrodes, while the resulting electrical potential difference was measured between the inner electrodes. Apparent resistivity values were subsequently calculated using the geometric factor associated with the Wenner configuration.
The resistivity survey was designed primarily as a site-characterisation tool rather than a geophysical imaging programme. Therefore, the measurements were interpreted qualitatively alongside borehole logs, laboratory testing, Standard Penetration Test (SPT) results, Cone Penetration Test (CPT) soundings, and Plate Load Test (PLT) data. Particular attention was given to identifying variations in apparent resistivity that could indicate changes in soil density, fines content, moisture condition, and carbonate cementation. Because direct spatial matching between geophysical and geotechnical investigation points was unavailable, the resistivity results supported interpretation of subsurface heterogeneity rather than establishing quantitative predictive correlations.
2.4. Data Integration and Interpretation
The integrated interpretation framework combined borehole, laboratory, SPT, CPT, PLT, and electrical resistivity datasets to achieve a comprehensive geotechnical and geophysical characterisation of the study area. Initially, borehole logs, laboratory testing, Standard Penetration Test (SPT) data, Cone Penetration Test (CPT) soundings, and Plate Load Test (PLT) results were evaluated independently to establish the subsurface stratigraphy and assess the engineering properties of the calcareous deposits. Subsequently, electrical resistivity measurements were interpreted to identify spatial variations in near-surface electrical properties and to provide supplementary information on subsurface heterogeneity.
The integration process involved comparing resistivity measurements with geotechnical indicators of density, stiffness, and soil composition derived from the borehole, laboratory, SPT, CPT, and PLT datasets. Particular attention focused on the relationship between resistivity variations and observed changes in fines content, carbonate content, penetration resistance, and foundation stiffness. Because direct spatial matching between individual resistivity stations and specific boreholes, CPTs, or PLTs was unavailable, the interpretation focused on identifying consistent qualitative trends rather than developing site-specific predictive correlations.
The objective of this study was not to develop statistical predictive relationships between electrical resistivity and geotechnical parameters. Rather, the study aimed to evaluate the practical engineering value of electrical resistivity as a supplementary site-characterisation tool within an integrated investigation framework incorporating borehole, laboratory, SPT, CPT, and Plate Load Test data. Consequently, the interpretation focused on identifying consistent geotechnical-geophysical trends and improving understanding of subsurface variability rather than establishing site-specific predictive models.
The integrated interpretation enabled assessment of the spatial variability of the calcareous desert deposits and improved confidence in geological and geotechnical characterisation across the project area. Furthermore, combining geotechnical and geophysical observations provided a more comprehensive understanding of subsurface conditions than individual investigation methods alone, supporting more reliable engineering assessments and foundation design decisions for large-scale renewable-energy developments.
3. Results and Discussion
3.1. General Characteristics of the Calcareous Desert Deposits
Table 2 summarises the laboratory testing programme and the principal engineering characteristics of the investigated calcareous deposits, while Table 3 presents the statistical summary of the key physical and engineering properties. The results indicate that the Shagaya site is predominantly underlain by calcareous sandy deposits exhibiting considerable variability in composition and engineering behaviour. The soils were primarily classified as SP-SM, SM, SC-SM, SW-SM, and SC, with sand contents ranging from 56.1% to 86.9% (mean 73.8%) and fines contents ranging from 13.5% to 43.9% (mean 25.5%). Carbonate (CaCO₃) contents ranged from 2.0% to 13.0% (mean 6.4%), confirming the deposits' calcareous nature and indicating varying degrees of natural cementation.
Moisture contents ranged from 1.7% to 10.0%, reflecting the study area's arid environmental conditions. Maximum dry density and optimum moisture content ranged from 1785 to 1995 kg/m³ and 8.5% to 13.8%, respectively, indicating favourable compaction characteristics. The direct shear test results in Figure 3 show friction angles from 38.7° to 49.5° and cohesion from 7.8 to 19.1 kPa, reflecting generally favourable shear-strength characteristics for shallow foundation support.
Overall, the investigated deposits comprise medium-dense to very dense calcareous sands with variable fines content and degrees of carbonate cementation. The observed variability highlights the heterogeneous nature of the subsurface conditions and is expected to influence density, stiffness, and foundation performance across the site. These laboratory findings provide the basis for interpreting the SPT, CPT, PLT, and electrical resistivity results presented in the subsequent sections.
3.2. Standard Penetration Test (SPT) Results
Table 4 summarises the Standard Penetration Test (SPT) results obtained from the 50 boreholes distributed across the study area. The recorded SPT-N values ranged from 10 to 84, with a representative value of approximately 45, indicating predominantly dense to very dense calcareous deposits. Many boreholes showed increasing penetration resistance with depth and reached refusal or near-refusal conditions (N ≥ 50) below approximately 2 to 3 m, suggesting dense to very dense sandy deposits and locally cemented horizons.
The wide range of SPT-N values reflects significant spatial variability in subsurface conditions, consistent with the variations in fines content, carbonate accumulation, and cementation identified in the laboratory testing programme. Elevated penetration resistance values are attributed to the combined effects of soil densification and natural carbonate cementation, both of which increase the stiffness and strength of the calcareous deposits. Overall, the SPT results confirm that the site is predominantly underlain by competent calcareous sandy deposits with favourable engineering characteristics for shallow foundation support. The observed variability highlights the heterogeneous nature of the deposits and provides evidence of local changes in density and cementation across the project area. These findings are consistent with the CPT, PLT, and laboratory results presented in the subsequent sections and support the integrated interpretation of site conditions.
3.3. Cone Penetration Test (CPT) Results
Table 5 summarises the CPT programme, and Table 6 presents the measured cone resistance values obtained from the ten CPT soundings. The CPT results indicate that the study area is predominantly underlain by dense to very dense calcareous sandy deposits. Measured cone resistance (qc) values ranged from 15 to 27.5 MPa, with an average value of approximately 22 MPa, confirming the generally competent nature of the subsurface materials.
Variations in cone resistance reflect differences in soil density, fines content, and carbonate cementation across the site. Higher qc values are associated with denser and locally cemented horizons, whereas lower values indicate comparatively less cemented deposits. These observations are consistent with the variability identified from the laboratory testing programme and SPT investigations.
Overall, the CPT results confirm favourable subsurface conditions and provide continuous profiling of the calcareous deposits, complementing the borehole and SPT data. The CPT soundings also highlight local variations in soil behaviour and contribute to the integrated geotechnical characterisation of the study area.
3.4. Plate Load Test Results
Table 7 summarises the results of the 19 Plate Load Tests (PLTs) conducted across the study area, and Figure 4, Figure 5, Figure 6, Figure 7 and Figure 8 present the corresponding load-settlement curves. The calculated modulus of subgrade reaction (Ks) values ranged from 24.3 to 210.3 MN/m³, with mean and median values of 107.4 and 114.1 MN/m³, respectively, indicating considerable variability in foundation stiffness across the site.
The variability in Ks values reflects differences in soil density, fines content, and carbonate cementation within the calcareous deposits. Higher stiffness values are associated with dense and locally cemented horizons, whereas lower values indicate comparatively less competent materials. The load-settlement responses shown in Figure 4, Figure 5, Figure 6, Figure 7 and Figure 8 further demonstrate the variation in deformation behaviour under applied loading.
Overall, the PLT results confirm favourable conditions for shallow foundations while highlighting significant spatial variations in stiffness. As the only field test that directly measures foundation response, the PLT programme provides a key dataset for evaluating settlement behaviour and supporting the integrated characterisation of the calcareous deposits.
3.5. Compaction and Bearing Characteristics
Figure 9 presents the Modified Proctor compaction curves, while Table 8 summarises the compaction and bearing characteristics of the investigated deposits. Maximum dry density (MDD) ranged from 1785 to 1995 kg/m³, with a mean of 1887.8 kg/m³, while optimum moisture content (OMC) ranged from 8.5% to 13.8%, with a mean of 11.3%. California Bearing Ratio (CBR) values ranged from 17.3% to 32.1%, with a mean value of 25.9%.
The test results indicate generally favourable compaction and bearing characteristics, consistent with the predominantly dense calcareous deposits. Variations in MDD, OMC, and CBR reflect differences in fines content and carbonate cementation across the site.
Overall, the compaction and bearing results confirm the deposits' suitability for supporting shallow foundations and associated infrastructure and provide further evidence of the spatial variability identified by the laboratory, SPT, CPT, and PLT investigations.
3.6. Electrical Resistivity Results
Table 9 summarises the electrical resistivity measurements from the six survey locations, while Figure 10, Figure 11, Figure 12, Figure 13, Figure 14 and Figure 15 present the corresponding resistivity profiles. Apparent resistivity values ranged from 57.2 to 271.9 Ω·m, with a mean value of 201.6 Ω·m, indicating notable spatial variability within the near-surface calcareous deposits.
The observed resistivity variation reflects differences in soil density, fines content, moisture conditions, and carbonate cementation across the site. Based on the site-specific interpretation in Table 10, lower resistivity values generally indicate deposits with higher fines content and weaker cementation, whereas higher resistivity values correspond to denser, more strongly cemented calcareous materials. The thresholds in Table 10 are site-specific qualitative interpretations based on an integrated assessment of the available geotechnical and geophysical datasets and should not be treated as transferable classification limits.
Overall, the resistivity results confirm the heterogeneous nature of the subsurface conditions and provide supplementary information that enhances the characterisation of the calcareous deposits between discrete geotechnical investigation points.
3.7. Integrated Interpretation of Geotechnical and Geophysical Results
The combined borehole, laboratory, SPT, CPT, PLT, and electrical resistivity datasets provide a comprehensive understanding of the engineering behaviour of the Shagaya calcareous desert deposits. Despite generally similar soil classifications, the investigated deposits exhibit substantial variability in density, fines content, carbonate cementation, penetration resistance, and foundation stiffness, confirming the heterogeneous nature of the subsurface conditions.
The SPT and CPT results indicate predominantly dense to very dense sandy deposits, with SPT-N values ranging from 10 to 84 and CPT cone resistance values ranging from 15 to 27.5 MPa. These results are consistent with the laboratory findings, which reveal variations in fines content and carbonate accumulation that influence soil density and mechanical behaviour. The PLT programme further shows the significant influence of these factors on foundation response, with Ks values ranging from 24.3 to 210.3 MN/m³. This wide range highlights the importance of direct stiffness measurements for foundation assessment in calcareous deposits.
Electrical resistivity measurements ranged from 57.2 to 271.9 Ω·m and provided supplementary evidence of subsurface variability. Based on the site-specific interpretation in Table 10, lower resistivity values generally indicate finer grained, less cemented materials, whereas higher resistivity values correspond to denser, more strongly cemented calcareous deposits. Although direct predictive correlations were not established, the observed geophysical trends were generally consistent with the geotechnical observations.
The integrated interpretation demonstrates that density, fines content, and carbonate cementation are the principal controls on the engineering behaviour of the investigated deposits. The key geotechnical and geophysical indicators summarised in Table 11 collectively confirm substantial spatial variability across the site. Integrating resistivity measurements with borehole, laboratory, SPT, CPT, and PLT data therefore provides a more reliable basis for site characterisation and foundation assessment than any single investigation technique. Table 11 summarises the principal geotechnical and geophysical indicators from the integrated investigation programme.
4. Discussion
4.1. Engineering Behaviour of the Calcareous Desert Deposits
The results demonstrate that the engineering behaviour of the Shagaya calcareous deposits is governed primarily by variations in density, fines content, and carbonate cementation. Although the deposits are predominantly sandy and exhibit similar soil classifications, penetration resistance, stiffness, bearing characteristics, and electrical resistivity varied significantly, indicating that soil classification alone does not adequately represent their engineering performance.
Laboratory testing revealed considerable variations in fines content and carbonate concentration, reflecting differences in depositional conditions and natural cementation across the site. These variations are consistent with the spatial changes observed in the SPT, CPT, PLT, and resistivity datasets and demonstrate the heterogeneous nature of the deposits.
The influence of carbonate cementation is evident from the generally high penetration resistance values, favourable bearing characteristics, and wide range of foundation stiffness values measured during the Plate Load Tests. The results indicate that local cementation enhances soil structure and stiffness, resulting in deposits with similar grain-size characteristics exhibiting different mechanical responses and settlement behaviour.
Overall, the investigated deposits provide generally favourable conditions for shallow foundations and renewable-energy infrastructure. However, the significant variability across the site highlights the importance of integrated site investigation programmes that capture local variations in density and cementation to improve foundation design and reduce geotechnical uncertainty.
4.2. Relationship Between SPT, CPT, and Soil Stiffness
The SPT, CPT, and PLT results exhibit consistent trends, indicating that penetration resistance is closely related to foundation stiffness in the investigated calcareous deposits. Higher SPT-N values and cone resistance measurements generally corresponded to higher Ks values, reflecting the influence of soil density and carbonate cementation on mechanical behaviour.
SPT-N values ranged from 10 to 84, CPT cone resistance values from 15 to 27.5 MPa, and PLT-derived Ks values from 24.3 to 210.3 MN/m³, demonstrating substantial spatial variability across the site. The broader range of Ks values suggests that foundation stiffness is influenced not only by density but also by differences in cementation and soil structure.
Overall, the results indicate that SPT and CPT measurements provide useful indicators of relative stiffness variations, whereas PLT testing remains the most direct method for assessing foundation response and settlement behaviour in calcareous deposits.
4.3. Variability of Modulus of Subgrade Reaction
The Plate Load Test results revealed significant spatial variability in the modulus of subgrade reaction (Ks), with values ranging from 24.3 to 210.3 MN/m³. This nearly nine-fold variation indicates that foundation stiffness depends strongly on local subsurface conditions, despite generally similar soil classifications across the site. The variability in Ks is attributed primarily to differences in soil density, fines content, and carbonate cementation. Deposits with higher stiffness are interpreted as dense, partially cemented calcareous horizons, whereas lower Ks values reflect comparatively less competent materials. These trends are consistent with the variations observed in the laboratory, SPT, and CPT datasets. The results also highlight that penetration resistance alone may not fully represent foundation stiffness, as deposits with similar SPT or CPT characteristics can exhibit different settlement responses due to variations in soil structure and cementation. Consequently, direct field measurements remain essential for reliably assessing foundation performance in calcareous deposits.
Overall, the wide range of Ks values demonstrates the site's heterogeneity and emphasises the importance of incorporating stiffness measurements into foundation design and settlement evaluation.
4.4. Bearing Capacity and Compaction Characteristics
The compaction and bearing test results indicate that the investigated calcareous deposits possess generally favourable engineering properties for foundation and infrastructure applications. Maximum dry density values ranged from 1785 to 1995 kg/m³, while CBR values ranged from 17.3% to 32.1%, reflecting moderate to good bearing performance.
The observed variability is attributed to differences in soil density, fines content, and carbonate cementation, which influence soil structure and resistance to deformation. These trends are consistent with the spatial variability identified from the SPT, CPT, and PLT investigations.
Overall, the compaction and bearing characteristics confirm the deposits' suitability for shallow foundations and provide further evidence that density and cementation are the principal factors controlling the engineering behaviour of the calcareous deposits.
4.5. Role of Electrical Resistivity as a Supplementary Site Characterisation Tool
The electrical resistivity survey provided valuable supplementary information regarding the spatial variability of the calcareous desert deposits and enhanced the interpretation of the conventional geotechnical investigation programme. Apparent resistivity values ranged from 57.2 to 271.9 Ω·m, confirming the heterogeneous subsurface conditions identified from laboratory testing, SPT, CPT, and Plate Load Test (PLT) results. These variations are consistent with the observed differences in fines content, density, carbonate cementation, and foundation stiffness across the study area.
Based on the site-specific interpretation framework in Table 10, higher resistivity values generally correspond to denser, more strongly cemented calcareous deposits, whereas lower resistivity values typically indicate finer grained, less dense, or less cemented materials. The resistivity classifications in Table 10 were developed specifically for the investigated site and are based on qualitative interpretation of the available integrated dataset. Because electrical resistivity is strongly influenced by geological setting, moisture conditions, soil composition, pore-fluid chemistry, density, and cementation, do not extrapolate the proposed resistivity ranges to other sites without appropriate local calibration and supporting geotechnical investigations.
Although direct quantitative correlations between resistivity measurements and geotechnical parameters were not developed because of the absence of spatially matched geophysical and geotechnical investigation points, the resistivity data provided valuable qualitative insight into subsurface variability and helped support engineering interpretation.
The resistivity survey did not aim to perform detailed site-wide geophysical mapping or develop predictive resistivity-based models. Instead, the investigation evaluated the practical role of electrical resistivity within a conventional, foundation-oriented site investigation framework. The results show that resistivity measurements can complement borehole, laboratory, SPT, CPT, and PLT data by providing additional information on lateral subsurface variability that discrete investigation points alone may not fully capture.
A key outcome of this study is the integration of electrical resistivity observations with a comprehensive geotechnical database comprising 50 boreholes, 10 CPT soundings, 19 Plate Load Tests, and laboratory investigations. Within this framework, resistivity measurements were interpreted in relation to variations in density, carbonate cementation, and foundation stiffness rather than as a standalone predictive tool. This integrated approach increases confidence in interpreting heterogeneous calcareous deposits and supports more informed engineering judgement during foundation assessment.
4.6. Implications for Renewable Energy Infrastructure
The results indicate that the investigated calcareous deposits generally provide favourable conditions for renewable-energy infrastructure; however, the site shows significant spatial variability in density, stiffness, and carbonate cementation. This variability may affect foundation performance and settlement behaviour, particularly for large-scale developments spanning extensive areas.
The substantial variation in PLT-derived stiffness values highlights the importance of direct field measurements for foundation assessment in calcareous deposits. While SPT and CPT data provide useful indicators of ground conditions, local cementation effects strongly influence stiffness and settlement behaviour.
Overall, integrating laboratory testing, SPTs, CPTs, PLTs, and electrical resistivity surveys improves confidence in site characterisation and provides a more reliable basis for foundation design, reducing geotechnical uncertainty in renewable-energy developments on heterogeneous calcareous soils.
4.7. Study Limitations and Future Research
Interpret the findings of this study in light of the limitations of the available dataset. The principal limitation is the absence of direct spatial correlation between boreholes, CPT soundings, Plate Load Tests, and electrical resistivity survey locations, which restricted the development of quantitative relationships between geotechnical and geophysical parameters. Consequently, the interpretation focused on identifying consistent trends rather than establishing predictive correlations.
A second limitation is the relatively limited number of electrical resistivity survey locations compared with the extensive geotechnical database. Although the resistivity data successfully identified subsurface variability, the available dataset was insufficient to support rigorous statistical analysis or site-specific predictive modelling.
Future research should focus on acquiring spatially matched geotechnical and geophysical datasets to enable direct comparison between resistivity, penetration resistance, and foundation stiffness. Applying advanced geophysical techniques, such as electrical resistivity tomography (ERT), together with larger datasets from calcareous deposits, would further improve understanding of subsurface variability and enhance site-characterisation methodologies for renewable-energy infrastructure in arid environments.
5. Conclusions
This study evaluated the practical engineering value of electrical resistivity as a supplementary site-characterisation tool within an integrated geotechnical investigation framework for the Shagaya Renewable Energy Project, Kuwait. The investigation combined borehole, laboratory, Standard Penetration Test (SPT), Cone Penetration Test (CPT), Plate Load Test (PLT), and electrical resistivity data to assess the engineering behaviour and spatial variability of calcareous desert deposits. The following conclusions can be drawn:
The investigated deposits consist predominantly of medium-dense to very dense calcareous sands exhibiting considerable variability in fines content, carbonate cementation, penetration resistance, and foundation stiffness. This variability demonstrates the heterogeneous nature of calcareous desert deposits and highlights the need for comprehensive site-characterisation programmes.
SPT-N values ranged from 10 to 84, CPT cone resistance values ranged from 15 to 27.5 MPa, and PLT-derived modulus of subgrade reaction (Ks) values ranged from 24.3 to 210.3 MN/m³, indicating substantial spatial variability in engineering behaviour. The observed variations are primarily associated with differences in density, fines content, and carbonate cementation.
Electrical resistivity measurements ranged from 57.2 to 271.9 Ω·m and provided useful supplementary information regarding subsurface heterogeneity. In general, higher resistivity values were associated with denser and more strongly cemented deposits, whereas lower values corresponded to relatively finer-grained or less cemented materials.
Unlike many previous studies, the objective of this research was not to develop empirical resistivity-based correlations. Because the study lacked direct spatial overlap between geophysical and geotechnical investigation points, it instead focused on how resistivity data can contribute to integrated engineering interpretation and improve understanding of subsurface variability.
The findings demonstrate that electrical resistivity is most effective as a complementary investigation technique that enhances, rather than replaces, conventional geotechnical investigations. When interpreted alongside borehole, laboratory, SPT, CPT, and PLT results, resistivity data can improve confidence in site characterisation and support engineering judgement in heterogeneous ground conditions.
The proposed integrated geotechnical-geophysical framework provides a practical approach for reducing site-characterisation uncertainty and supporting foundation investigations in calcareous desert deposits. The framework is particularly relevant to large-scale renewable-energy and infrastructure developments in arid environments where understanding spatial variability is essential for reliable engineering decision-making.
Funding
This research received no external funding.
Institutional Review Board Statement
Not applicable.
Informed Consent Statement
Not applicable.
Conflicts of Interest
The author declares no conflicts of interest.
Abbreviations
The following abbreviations are used in this manuscript:
| BH | Borehole |
| CBR | California Bearing Ratio |
| CPT | Cone Penetration Test |
| ERT | Electrical Resistivity Tomography |
| Ks | Modulus of Subgrade Reaction |
| LL | Liquid Limit |
| MDD | Maximum Dry Density |
| OMC | Optimum Moisture Content |
| PI | Plasticity Index |
| PLT | Plate Load Test |
| qc | Cone Resistance |
| SPT | Standard Penetration Test |
| SPT-N | Standard Penetration Test Blow Count |
| SW | Well-Graded Sand (USCS) |
| SC | Clayey Sand (USCS) |
| SM | Silty Sand (USCS) |
| SP | Poorly Graded Sand (USCS) |
| USCS | Unified Soil Classification System |
| Ω·m | Ohm-Meter (Electrical Resistivity Unit) |
References
- Aiban, S. A. A study of sand stabilization in Eastern Saudi Arabia. Eng. Geol. 1994, vol. 38(no. 1–2), 65–79. [Google Scholar] [CrossRef]
- Airey, M.; Fahey, D.W. An experimental study of the crushing of carbonate and quartz sands. Géotechnique 1991, vol. 41(no. 4), 613–627. [Google Scholar]
- Coop, M. R. The mechanics of uncemented carbonate sands. Géotechnique 1990, vol. 40(no. 4), 607–626. [Google Scholar] [CrossRef]
- Jewell, M. S.; Khorshid, R.J. Cyclic loading of calcareous sand. J. Geotech. Eng. 1988, vol. 114(no. 4), 462–476. [Google Scholar] [CrossRef]
- Hyodo, Y.; Hyde, M.; Aramaki, A.F.L.; Nakata, N. Undrained triaxial compression and extension behavior of crushable carbonate sand. Soils Found. 1998, vol. 38(no. 4), 19–29. [Google Scholar]
- Al-Shayea, N. A. The combined effect of clay and moisture content on the behavior of remolded unsaturated soils. Eng. Geol. 2001, vol. 62(no. 4), 319–342. [Google Scholar] [CrossRef]
- Ajalloeian, G. R.; Lashkaripour, R. Engineering geological characteristics of calcareous deposits and their influence on foundation behaviour. Eng. Geol. 2000, vol. 58(no. 3–4), 311–320. [Google Scholar]
- Das, K.; Sobhan, B.M. Principles of Geotechnical Engineering, 9th edn; Cengage Learning: Boston, MA, 2018. [Google Scholar]
- Lunne, J. J.; Robertson, T.; Powell, P.K. Cone Penetration Testing in Geotechnical Practice; Blackie Academic & Professional: London, 1997. [Google Scholar]
- J. E. Bowles, Foundation Analysis and Design, 5th edn; McGraw-Hill: New York, 1996.
- J. M. Reynolds, An Introduction to Applied and Environmental Geophysics, 2nd edn; John Wiley & Sons: Chichester, 2011.
- Kearey, P.; Brooks, M. Hill, An Introduction to Geophysical Exploration, 3rd edn; Blackwell Science: Oxford, 2002. [Google Scholar]
- McDowell, H. J.; Culshaw, P.W.; Northmore, M.G.; Reeves, K.J. Engineering Geological Mapping, London; Geological Society Special Publication 15.: London, 2002. [Google Scholar]
- G. Samouëlian, A.; Cousin, I.; Tabbagh, A.; Bruand, A.; Richard. Electrical resistivity survey in soil science: a review. Soil Tillage Res. 2005, vol. 83(no. 2), 173–193. [Google Scholar] [CrossRef]
- L. Binley, A. Slater, Resistivity and Induced Polarization: Theory and Applications to the Near-Surface Earth; Cambridge University Press: Cambridge, 2020. [Google Scholar]
- Loke, M. H. Electrical Imaging Surveys for Environmental and Engineering Studies: A Practical Guide to 2-D and 3-D Surveys; Geotomo Software: Penang, Malaysia, 2000. [Google Scholar]
- Binley, A.; Kemna. Electrical methods for imaging the subsurface. In Hydrogeophysics, Hydrogeophysics; Rubin, Y., Hubbard, S.S., Eds.; Dordr. Springer, 2005; pp. 129–156. [Google Scholar]
- Farias, G.; Machado, E. S.; Giacheti, S. L.; Cerqueira, H. L. Integrated use of georadar, electrical resistivity, and SPT for site characterization and water content estimative. Soils Rocks 2023, vol. 46(no. 3). [Google Scholar] [CrossRef]
- Kherrouba, R.; Lamara, H.; Benzaid, M. Use of Electrical Resistivity Tomography for Joint Geophysical and Geotechnical Landslide Characterization: A Case Study. Sel. Sci. Pap. J. Civ. Eng. 2023, vol. 18(no. 1). [Google Scholar] [CrossRef]
- Zamanian, M.; Asfaw, M.; Chavda, N.; Shahandashti, P. Deep learning for exploring the relationship between geotechnical properties and electrical resistivities. Transp. Res. Rec. 2024, vol. 2678(no. 10), 659–672. [Google Scholar] [CrossRef]
- Bery, R.; Saad, A.A. Tropical clayey sand soil’s behaviour analysis and its empirical correlations via geophysics electrical resistivity method and engineering soil characterizations. Int. J. Geosci. 2012, vol. 3(no. 1), 111–116. [Google Scholar]
- K. L. Robertson, P.K. Cabal, Guide to Cone Penetration Testing for Geo-Environmental Engineering, 2nd edn; Gregg Drilling & Testing, Inc.: Signal Hill, CA, 2010. [Google Scholar]
- Sangprasat, S.; Puttiwongrak, K.; Inazumi, A. Review of Correlations Between Soil Electrical Resistivity and Geotechnical Properties. Geosciences 2025, vol. 15(no. 5), 166. [Google Scholar] [CrossRef]
- Al-Sanad, H. A.; Shaqour, F. M. Geotechnical implications of subsurface water rise in Kuwait. Eng. Geol. 1991, vol. 31(no. 1), 59–69. [Google Scholar] [CrossRef]
- Al-Sanad, J.; Ismael, H.A.; Nayfeh, N.F. Geotechnical properties of dune sands in Kuwait. Eng. Geol. 1993, vol. 34(no. 1–2), 45–52. [Google Scholar] [CrossRef]
- Ismael, N. F.; Jeragh, A. M. Static Cone Tests and Settlement of Calcareous Desert Sands. Can. Geotech. 1986, vol. 23, 297–303. [Google Scholar] [CrossRef]
- Ismael, N. F.; Jeragh, A. M.; Mollah, M. A.; Al-Khaldi, O. A Study of the Properties of Surface Soils in Kuwait. Geotech. Eng. 1986, vol. 17, 67–87. [Google Scholar]
- AL-Rashidi; Almutairi, S.; Almutairi, T. Numerical modelling study of the effect of artificial cementation on the mechanical behaviour of sandy soil. Am. J. Civ. Eng. Archit. 2022, vol. 10(no. 1), 8–15. [Google Scholar]
- AL-Rashidi. STRUCTURAL STABILITY AND FATIGUE ASSESSMENTS OF DUAL-AXIS SOLAR TRACKERS USING FINITE ELEMENTS ANALYSIS. Int. J. GEOMATE 2020, vol. 19(no. 73), 8–13. [Google Scholar] [CrossRef]
- Al-Rashidi. Investigating the Feasibility of Solar Photovoltaic Systems in Kuwait; Loughborough University, 2017. [Google Scholar]
- Al-rashidi. The Role of Geotechnical Engineering in Photovoltaic Solar Photovoltaic Energy in Arid Climate Regions. Front. Res. Archit. Eng. 2022, vol. 05(no. 01), 1–9. [Google Scholar]
- AL-Rashidi. Geotechnical Investigation of Arid Climate Soils for Implementing Solar Trackers. Int. J. GEOMATE 2022, vol. 23(no. 96), 32–39. [Google Scholar] [CrossRef]
- Al-Rashidi. Analytical and Numerical Investigation Study of Pile Capacity in Desert Sand in Kuwait. Int. Rev. Civ. Eng. 2024, vol. 15(no. 5), 414–421. [Google Scholar] [CrossRef]
Figure 1.
Integrated geotechnical-geophysical framework for site characterisation and foundation assessment.
Figure 1.
Integrated geotechnical-geophysical framework for site characterisation and foundation assessment.
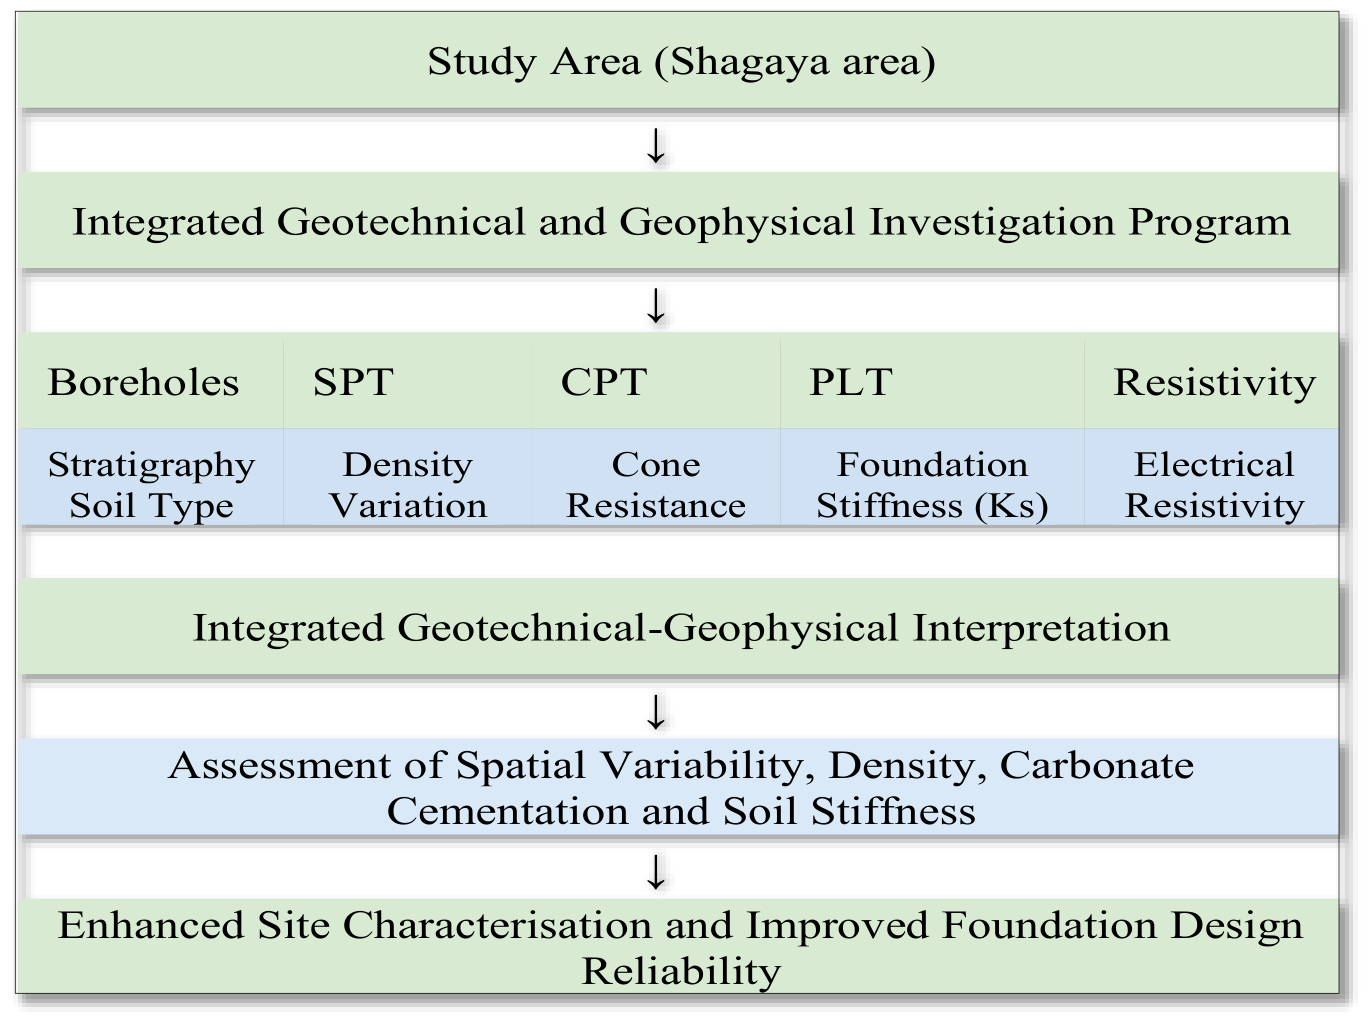
Figure 2.
Shagaya area in Kuwait map.
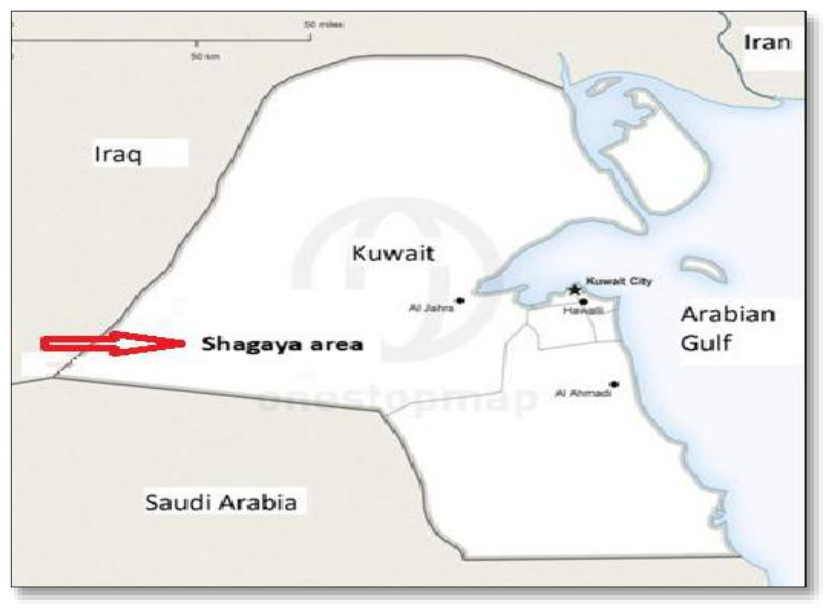
Figure 3.
Direct shear test results obtained from representative samples of the Shagaya deposits.
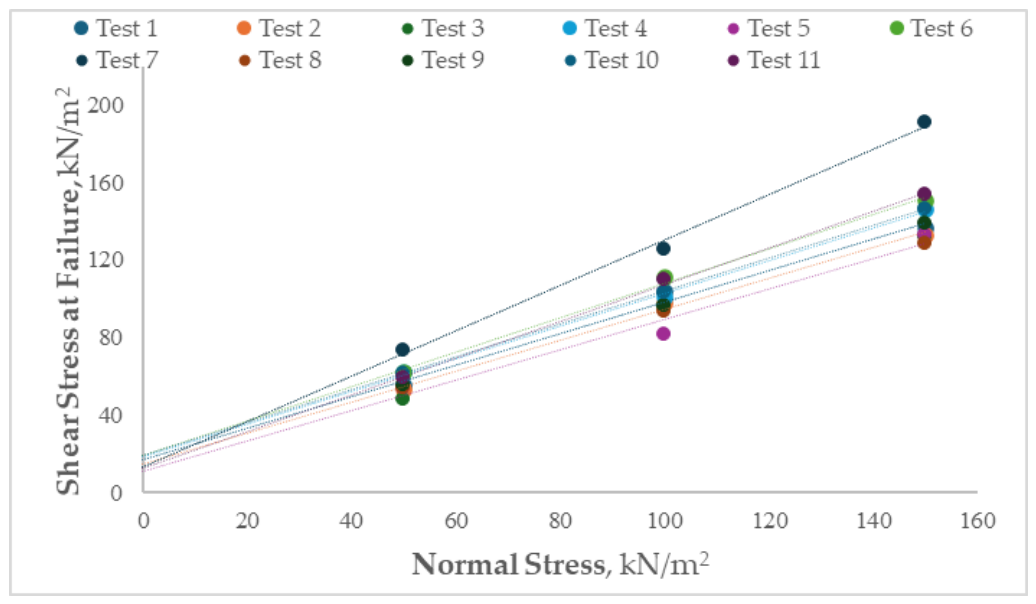
Figure 4.
The Plate Load Tests conducted at the Shagaya site (1-4).
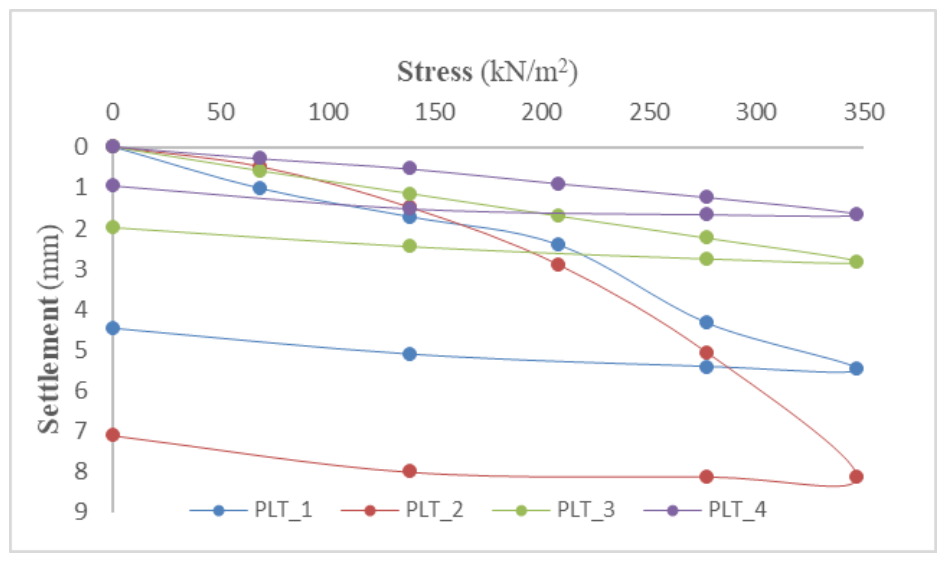
Figure 5.
The plate load tests conducted at the Shagaya site (5-8).
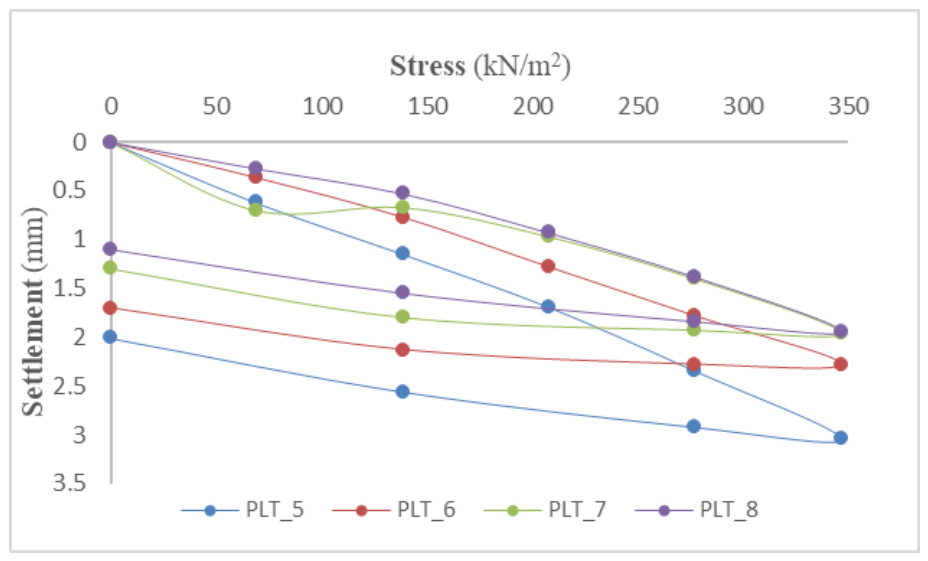
Figure 6.
The Plate Load Tests conducted at the Shagaya site (9-12).
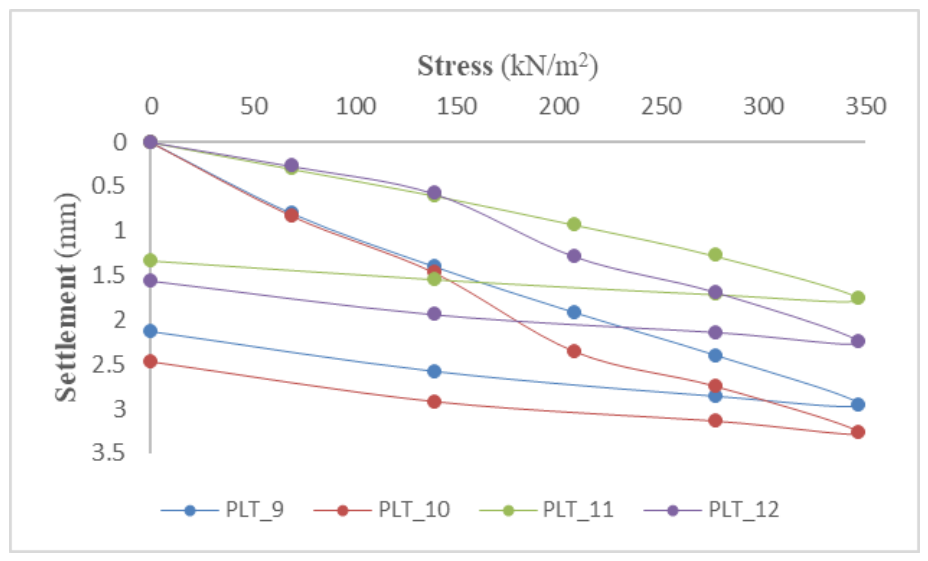
Figure 7.
The plate load tests conducted at the Shagaya site (13-16).
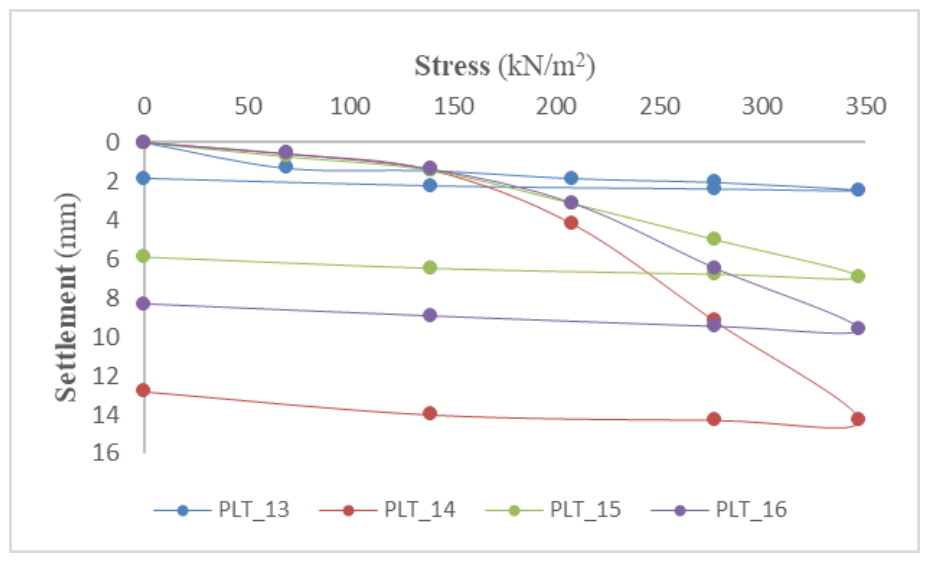
Figure 8.
The plate load tests conducted at the Shagaya site (17-19).
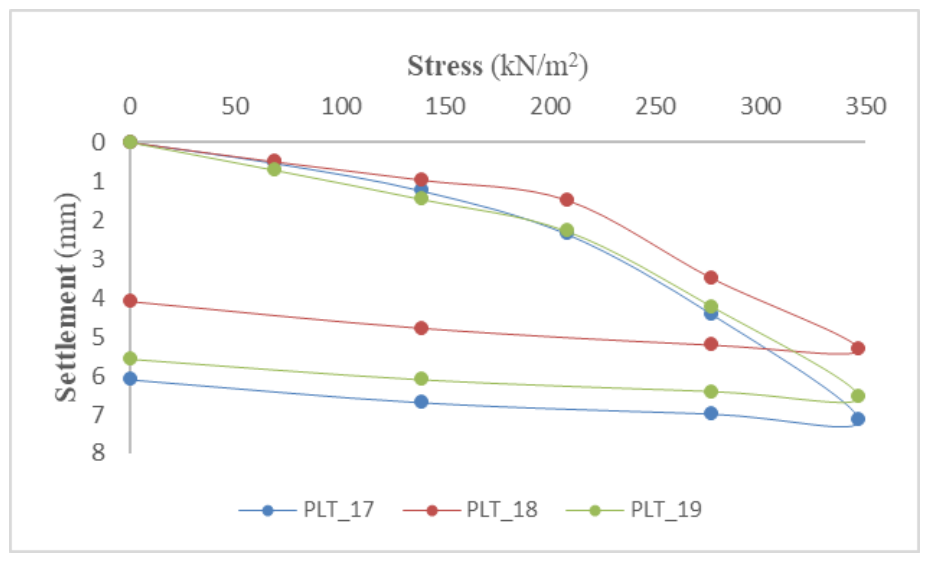
Figure 9.
Modified Proctor Compaction Curves for Representative Calcareous Desert Soil Samples.
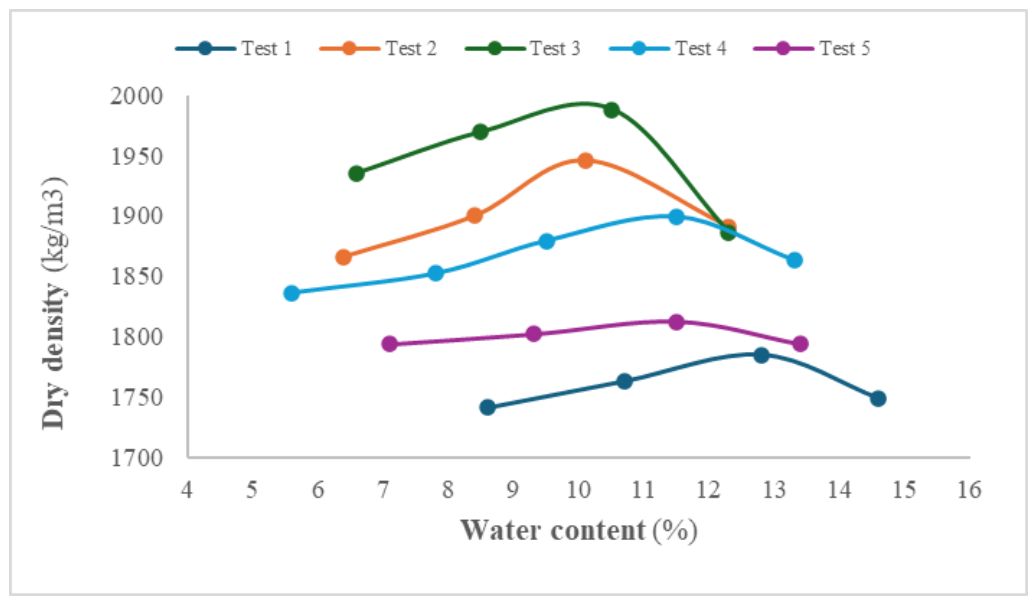
Figure 10.
Electrical Resistivity Profiles in the North-South and East-West Directions at ER-01.
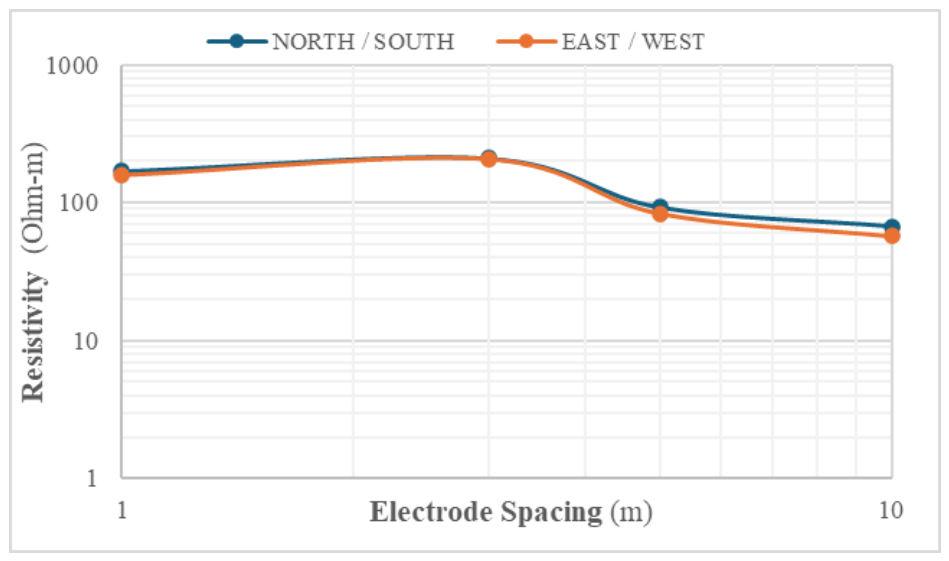
Figure 11.
Electrical Resistivity Profiles in the North-South and East-West Directions at ER-02.
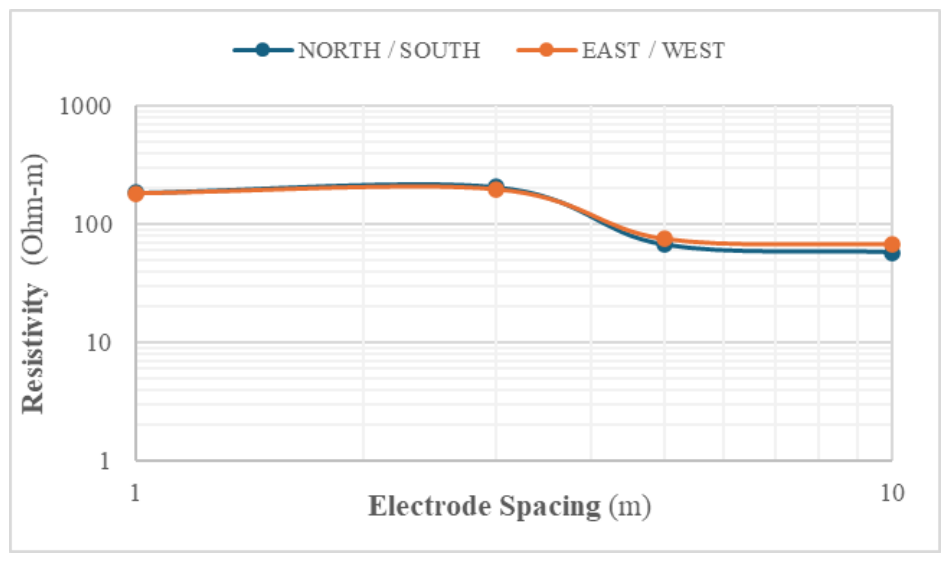
Figure 12.
Electrical Resistivity Profiles in the North-South and East-West Directions at ER-03.
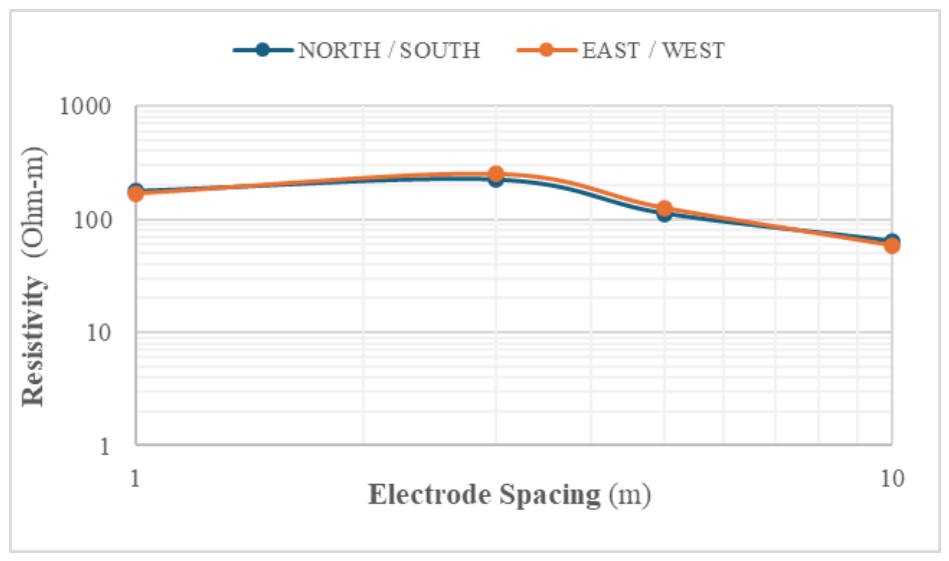
Figure 13.
Electrical Resistivity Profiles in the North-South and East-West Directions at ER-04.
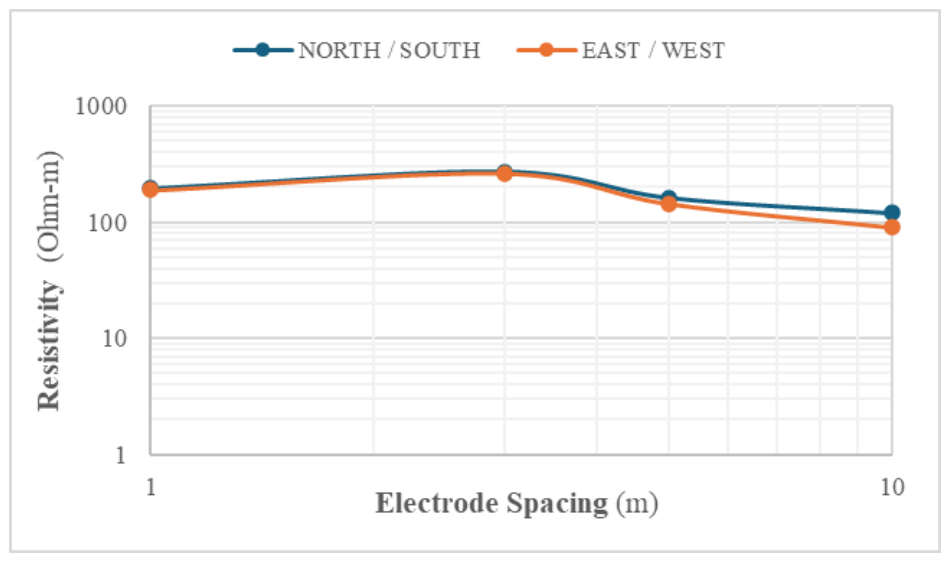
Figure 14.
Electrical Resistivity Profiles in the North-South and East-West Directions at ER-05.
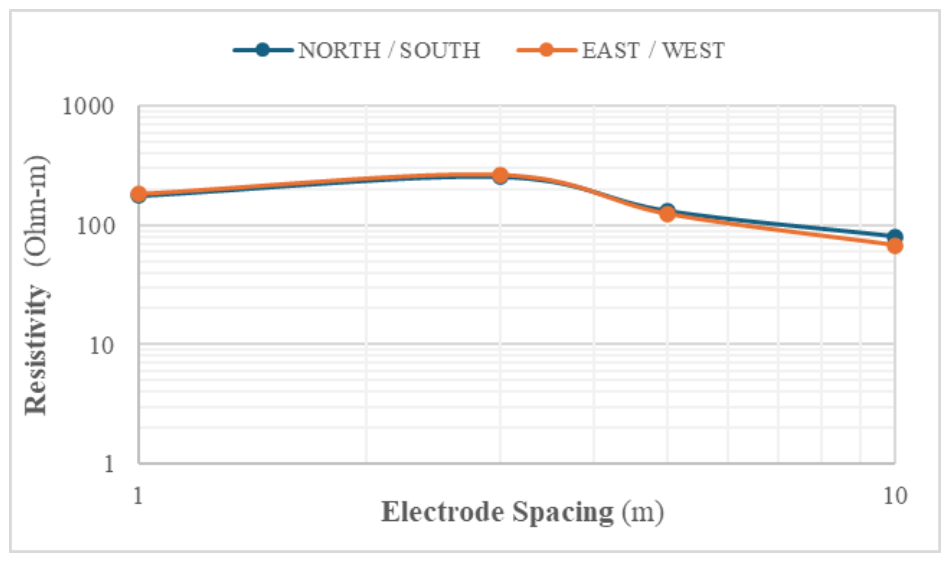
Figure 15.
Electrical Resistivity Profiles in the North-South and East-West Directions at ER-06.
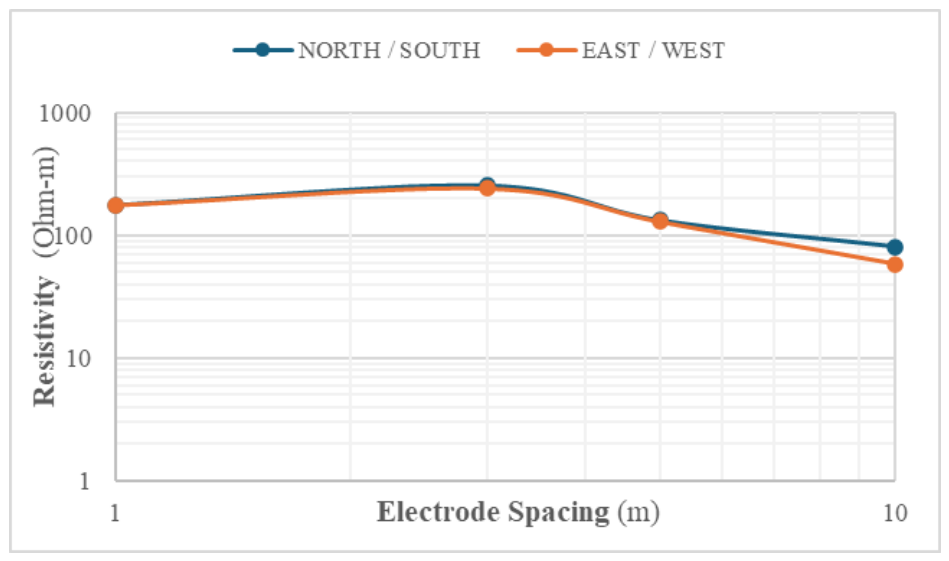

Table 1.
Comparison of previous studies and the present research on the application of electrical resistivity in geotechnical site characterisation.
Table 1.
Comparison of previous studies and the present research on the application of electrical resistivity in geotechnical site characterisation.
| Reference | Soil Type |
Geotechnical Data | Resistivity Application |
Main Objective |
Novel Contribution |
|---|---|---|---|---|---|
| Bery and Saad (2012) | Tropical clayey sand | Laboratory tests | Resistivity correlation | Empirical correlations | Correlations between soil properties and resistivity |
| Farias et al. (2023) | Residual soils | SPT + GPR + Resistivity | Site characterization | Water content estimation | Integrated geophysical approach |
| Zamanian et al. (2024) | Various soils | Geotechnical database | Machine learning | Property prediction | AI-based resistivity prediction |
| Sangprasat et al. (2025) | Review study | Literature data | Correlation review | Evaluation of published correlations | State-of-the-art review |
| Present study | Calcareous desert deposits (Kuwait) | 50 BH, 10 CPT, 19 PLT, laboratory tests | Electrical resistivity as a supplementary investigation tool | Integrated site characterisation | Integration of borehole, SPT, CPT, PLT and electrical resistivity data within a unified framework for assessing foundation stiffness |
Table 2.
Summary of Laboratory Testing Program and Engineering Parameters Evaluated.
| Parameter | Detailed Value |
|---|---|
| Soil Classifications | SP-SM, SM, SC-SM, SW-SM, SC |
| Relative Density | Medium dense to very dense |
| Sand Content | 56%–88% |
| Fines Content | 8%–44% |
| Gravel Content | 0%–20% |
| Liquid Limit (LL) | 29%–39% |
| Plasticity Index (PI) | 7%–31% |
| Hydraulic Conductivity | 1.7×10⁻⁵ - 15.2×10⁻⁵ cm/sec |
| Sulfate Content | 77–2750 ppm |
| Chloride Content | 65–650 ppm |
| pH Level | 7.5–7.8 |
| Friction Angle | 36.9° - 49.5° |
| Cohesion | 7.81 to 19.14 kPa |
Table 3.
Statistical Summary of Key Physical and Engineering Properties of the Calcareous Desert Deposits.
Table 3.
Statistical Summary of Key Physical and Engineering Properties of the Calcareous Desert Deposits.
| Parameter | Minimum | Maximum | Mean |
|---|---|---|---|
| Water Content (%) | 1.7 | 10 | 6 |
| Sand Content (%) | 56.1 | 86.9 | 73.8 |
| Fines Content (%) | 13.5 | 43.9 | 25.5 |
| Cohesion, c (kPa) | 7.8 | 19.1 | 14.8 |
| Friction Angle, φ (°) | 38.7 | 49.5 | 41.7 |
| CaCO₃ Content (%) | 2 | 13 | 6.4 |
| Maximum dry density (kg/m³) | 1785 | 1995 | 1887.8 |
| Optimum water content (%) | 8.5 | 13.8 | 11.3 |
Table 4.
Summary of SPT Results.
| Parameter | Value |
|---|---|
| Number of Boreholes | 50 |
| Minimum SPT-N | 10 |
| Maximum SPT-N | 84 |
| Representative SPT-N | ~45 |
| Predominant Soil Condition | Dense to Very Dense |
Table 5.
Summary of CPT Results.
| Parameter | Value |
|---|---|
| Number of CPTs | 10 |
| Approximate qc Range (MPa) | 15–27.5 |
| Average qc (MPa) | 22 |
| Soil Behavior | Dense to Very Dense Sand |
Table 6.
Cone penetration resistance values obtained from the CPT programme at the Shagaya site.
| Test No. | qc (MN/m2) |
|---|---|
| CPT1 | 27.5 |
| CPT2 | 26 |
| CPT3 | 23 |
| CPT4 | 20 |
| CPT5 | 25 |
| CPT6 | 17 |
| CPT7 | 15 |
| CPT8 | 25 |
| CPT9 | 16 |
| CPT10 | 24 |
| CPT_average | 22 |
Table 7.
Statistical Summary of PLT Results.
| Parameter | Value |
|---|---|
| Number of PLTs | 19 |
| Minimum Ks (MN/m³) | 24.3 |
| Maximum Ks (MN/m³) | 210.3 |
| Mean Ks (MN/m³) | 107.4 |
| Median Ks (MN/m³) | 114.1 |
Table 8.
Summary of Compaction and Bearing Characteristics.
| Parameter | Minimum | Maximum | Mean |
|---|---|---|---|
| Maximum dry density (kg/m³) | 1785 | 1995 | 1887.8 |
| Optimum moisture content (%) | 8.5 | 13.8 | 11.3 |
| CBR (%) | 17.3 | 32.1 | 25.9 |
Table 9.
Summary of Electrical Resistivity Results
| Parameter | Value |
|---|---|
| Number of Locations | 6 |
| Minimum Resistivity (Ω·m) | 57.2 |
| Maximum Resistivity (Ω·m) | 271.9 |
| Mean Resistivity (Ω·m) | 201.6 |
Table 10.
Site-Specific Qualitative Interpretation of Electrical Resistivity Measurements for the Shagaya Calcareous Desert Deposits.
Table 10.
Site-Specific Qualitative Interpretation of Electrical Resistivity Measurements for the Shagaya Calcareous Desert Deposits.
| Apparent Resistivity (Ω·m) | Qualitative Interpretation | Likely Geotechnical Characteristics |
|---|---|---|
| < 100 | Low resistivity | Relatively higher fines content, lower density, weaker cementation, potentially lower stiffness |
| 100 - 200 | Moderate resistivity | Moderately dense calcareous deposits with moderate cementation and intermediate stiffness |
| > 200 | High resistivity | Dense to very dense calcareous deposits, stronger carbonate cementation, and relatively higher stiffness |
| > 250 | Very high resistivity | Strongly cemented carbonate-rich horizons and potentially enhanced foundation performance |
Table 11.
Summary of key geotechnical and geophysical indicators for the investigated calcareous deposits.
Table 11.
Summary of key geotechnical and geophysical indicators for the investigated calcareous deposits.
| Parameter | Minimum | Maximum | Mean | Interpretation |
|---|---|---|---|---|
| SPT-N | 10 | 84 | 45 | Dense to very dense |
| CPT qc (MPa) | 15 | 27.5 | 22 | Dense sand |
| Ks (MN/m³) | 24.3 | 210.3 | 107.4 | High variability |
| Resistivity (Ω·m) | 57.2 | 271.9 | 201.6 | Variable cementation |
Disclaimer/Publisher’s Note: The statements, opinions and data contained in all publications are solely those of the individual author(s) and contributor(s) and not of MDPI and/or the editor(s). MDPI and/or the editor(s) disclaim responsibility for any injury to people or property resulting from any ideas, methods, instructions or products referred to in the content. |
© 2026 by the authors. Licensee MDPI, Basel, Switzerland. This article is an open access article distributed under the terms and conditions of the Creative Commons Attribution (CC BY) license (http://creativecommons.org/licenses/by/4.0/).
Copyright: This open access article is published under a Creative Commons CC BY 4.0 license, which permit the free download, distribution, and reuse, provided that the author and preprint are cited in any reuse.