

Submitted:
07 October 2026
Posted:
09 October 2026
You are already at the latest version
Abstract
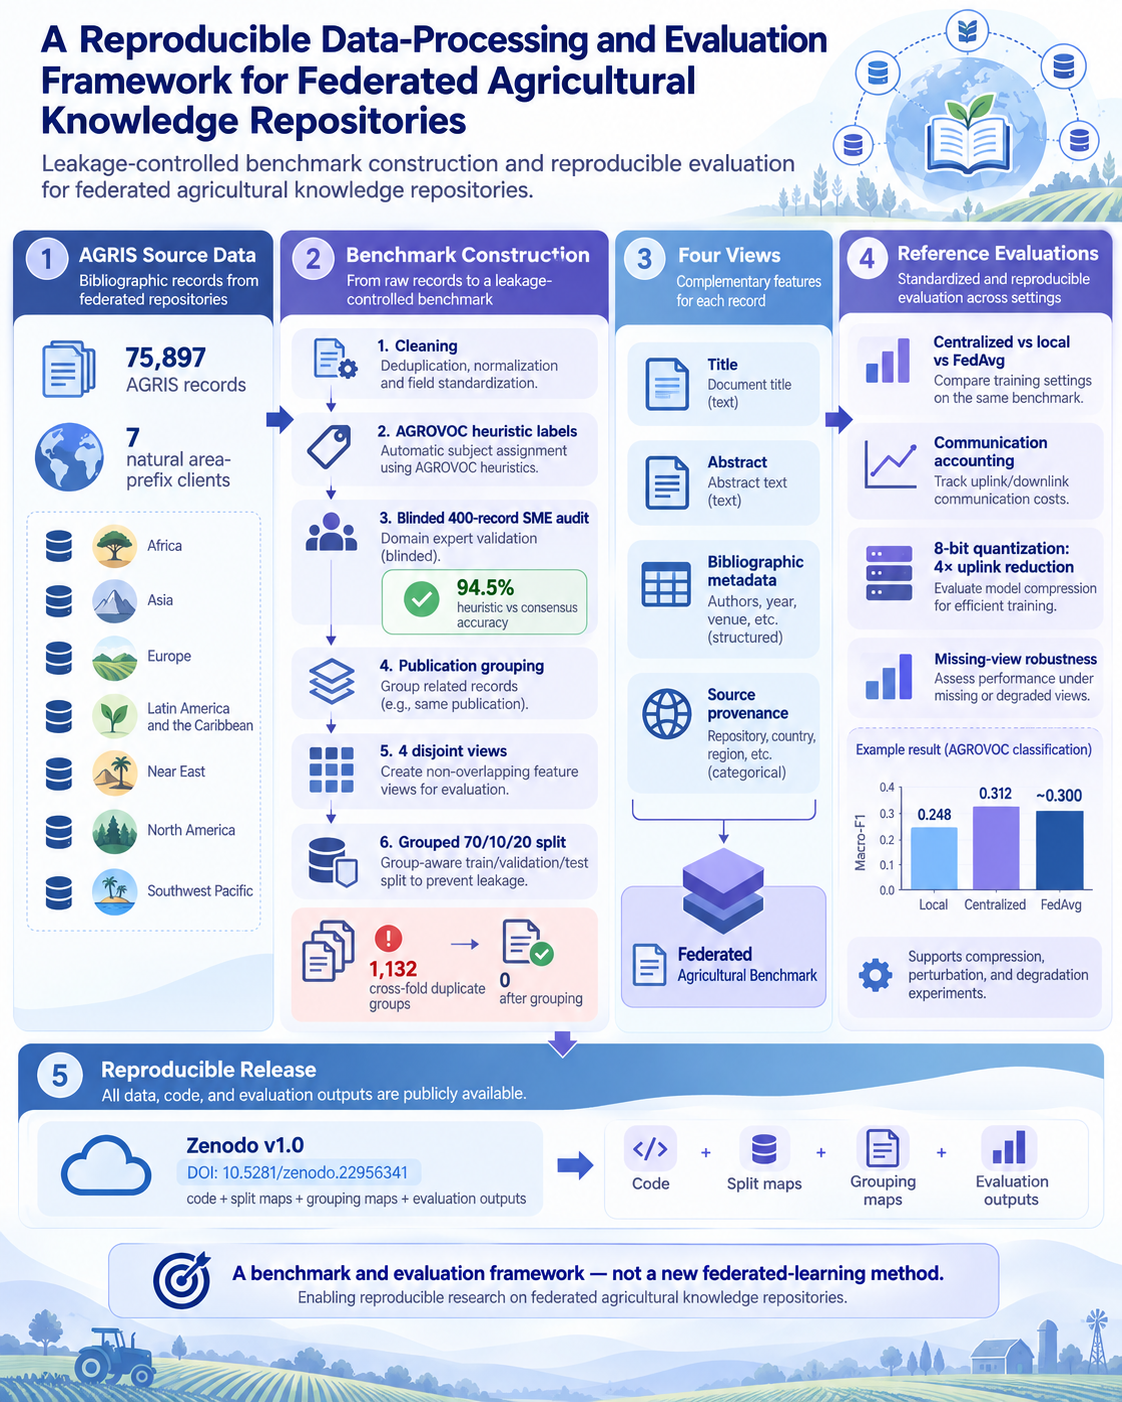
Agricultural catalogues are awkward to benchmark once the records stay at the centres that produced them. We turn 75,897 bibliographic records from the International System for Agricultural Science and Technology (AGRIS), already held by 7 area-prefix clients, into a federated multi-view benchmark. Each record has four disjoint views (1,096 features), a ten
class AGROVOCheuristic, publication-level grouping, a client- and class-aware 70/10/20 cut, and ablinded400-record subject-matter expert (SME) audit. Against the consensus gold the heuristic reached 94.50% accuracy and macro-F1 = 0.945 (sampling-weighted 94.91%).
Grouping removes 1,132 duplicate-document groups that would otherwise cross folds. Compute-matched Federated Averaging (FedAvg) is 0.2998 ± 0.0151 macro-F1, against 0.3041 ± 0.0021 when the data are pooled and 0.2884 ± 0.0037 when they are not. Eight-bit uplink quantization keeps 0.3001 ± 0.0147 at a 4× uplink cut (1.6× on total traffic). The full pipeline is archived on Zenodo as release v1.0 (DOI: 10.5281/zenodo.22956341). This is a benchmark and evaluation framework, not a new federated-learning method.
Keywords:
federated learning
; AGRIS
; multi-view bibliographic data
; reproducible benchmark
; missing views
; communication accounting
1. Introduction
Agricultural catalogues already live at national centres. Nobody first builds a shared store and then carves it up for an experiment [1,2]. Before models are discussed, the data have to be built so that a split is safe and a label is honest.
Duplicates come first: the same work can show up under another identifier, a tweaked title, or a second submitting centre. An ungrouped client×class cut on this corpus put 1,132 publication groups across train/validation/test, 677 of them in both train and test.
Catalogue labels still need a human check: AGROVOC subject strings [3] can yield a coarse theme, but those strings must not go back into the feature matrix, and the heuristic they induce has to be read by people who never see them.
Title, abstract, bibliographic metadata and source provenance come apart: any of them can be missing or noisy on their own [4,5,6]. If a benchmark concatenates them and never says how to delete one block, nobody else can reuse the protocol.
The clients are already in the catalogue: AGRIS area prefixes name submitting centres, not countries. Inventing the primary clients would hide the size imbalance and the mild label shift the catalogue actually has.
This work is positioned as a methods and data-processing study. The underlying records are provided by FAO AGRIS; the contribution developed here is the reproducible benchmark-construction and evaluation procedure.
The pipeline is:
AGRIS source → cleaning → labels → duplicate grouping
→ clients → views → split → benchmark tasks.
Figure 1 shows that pipeline. FedAvg [7], communication accounting, Dirichlet and FedProx checks [8,9], compression [10,11,12], clipping [13,14] and missing-view fusion [15,16,17] are tasks the benchmark supports. They are not a new architecture. Section 3 presents the materials and methods; Section 4 defines the protocols; Section 5 reports the scores.
1.1. Contributions
A leakage-controlled construction and an evaluation framework are released, archived as Zenodo release v1.0 (https://doi.org/10.5281/zenodo.22956341). A new fusion operator or aggregator is not proposed.
- 1.
- 2.
- A leakage-controlled data-processing pipeline: AGROVOC label-generating subject strings are removed from model features, and publication-level duplicate grouping eliminates the 1,132 groups that would otherwise cross evaluation folds.
- 3.
- Independent human validation of the label-generation procedure: a blinded 400-record SME audit with 87.25% independent annotator agreement (0.858) and 94.50% heuristic-versus-consensus accuracy [19].
- 4.
- A documented four-view representation (1,096 features) and a 12-condition missing-view evaluation protocol, supporting controlled deletion and corruption of title, abstract, bibliographic and source views [4].
- 5.
- A reproducible reference evaluation suite covering centralized, isolated and federated learning, controlled client heterogeneity, communication accounting, update compression, perturbation and degradation experiments.
- 6.
- Archived benchmark assets and an executable reproducibility pipeline: preprocessing, duplicate grouping, splits, seeds, SME audit outputs and sampling metadata, configurations, measured outputs, and scripts that regenerate the tables and figures.
2. Related Work and Benchmark Positioning
Federated averaging showed that a shared model can be trained from decentralized updates without moving raw data [7]. Client sampling, local SGD and sample-count-weighted aggregation are the protocol this paper inherits. Non-IID client data is the standard obstacle [2,18]. FedProx adds a proximal term so that clients with heterogeneous data cannot drift too far during local optimisation [9]. Whether that term helps is then an empirical question about the heterogeneity that is actually present. Hsu et al. control label-distribution shift with Dirichlet() [8]; the natural seven-client split is kept and that construction is added so FedProx is tested off the mild operating point, not only on it.
Federation then raises a second question: how little of each update can actually be sent. Konečný et al. sketched structured and sketched updates [10]. Quantization of stochastic gradients, including QSGD, reduces bits per coordinate [11]. Sparse communication sends only the largest coordinates, at the cost of transmitting indices [12]. Periodic averaging with quantization (FedPAQ) combines the two [20]. Sparsification and a deterministic uniform min/max compressor are evaluated on one model and one partition—not QSGD stochastic rounding—and uplink and downlink are kept as separate accounts because those downlink deliveries are uncompressed.
Bounding an update by clipping, then adding Gaussian noise to the clipped update, is the core of DP-SGD [13] and of its federated language-model descendants [14]. The same two operators are used as an operating curve of utility against perturbation strength. A privacy budget is not composed and differential privacy is not claimed.
When to fuse views—early at the feature level, late at the decision level, or in hybrid arrangements—is a long-standing question in multisensor fusion [15,16,17,21] and in the broader multimodal taxonomy [4]. Reliability weighting of sources whose quality varies is part of that literature [15,17]. Sequential tracking of a changing class mix is the Kalman filter [22]. Incomplete or missing views are a recognised multimodal failure mode [4,5,6]. Recent work considers missing modalities during training, inference, or both, with approaches aimed at retaining useful predictions when one or more information sources are unavailable [5,6]. The column-block blackouts and record-level corruptions are a bibliographic instance of that problem, not a new fusion operator.
A benchmark that cannot be rebuilt is not reusable. Datasheets [23], data statements [24] and accountability write-ups [25] treat provenance, intended use, labelling and known gaps as part of the resource. FAIR asks for the same artefacts plus a persistent identifier [26]. The identifier maps, checksums and reconstruction script in the Zenodo v1.0 release are that layer here. The persistent release is available at https://doi.org/10.5281/zenodo.22956341.
Duplicate records are an old database problem [27]. In learned systems the same problem appears as train/test leakage: standard splits can put near-duplicate documents on both sides of an evaluation cut [28], and leakage is a recurring cause of irreproducible scientific claims [29]. Agricultural catalogues inherit the same failure mode: one work can appear under more than one identifier, title variant or submitting centre. Publication grouping before the split is the catalogue analogue of a leakage audit, not a modelling trick.
AGRIS was built for reuse of agricultural bibliographic metadata [1,30]. The Open Data Set is published under an open Creative Commons licence so that third parties can run machine processes over the catalogue [31]. Providers may withdraw, so a live harvest is not a frozen corpus. A benchmark built on AGRIS therefore has to version the retrieval (date, filenames, URLs, SHA-256) rather than assume the XML will be the same next year.
Reproducibility checklists in machine learning [32] ask for the exact data, split and environment that produced a number. The benchmark is versioned as release v1.0: the identifier set, group and split maps, view offsets, SME audit labels and client/stratum sampling metadata, run configurations and measured JSON live in one checksummed tree. A later FAO harvest that fails those checksums is a different corpus.
The records are drawn from AGRIS [1] and used here as a federated multi-view resource, not as a substitute for physical sensing. Related work on federated optimisation, compression and fusion supplies the reference methods that are scored; it does not define the benchmark.
No new aggregator, compressor or fusion rule is proposed. The work is the construction: how to turn one heterogeneous catalogue into a leakage-controlled, multi-view, naturally partitioned benchmark, and how to score distributed-learning methods on it without changing the data, the split or the accountant. This is a methods/data-processing article, not a data descriptor of a raw collection.
3. Materials and Methods: Benchmark Construction and Data-Processing Pipeline
This section builds the resource. Quality scores, client heterogeneity and the reference-task numbers wait until Section 5.
3.1. AGRIS Source and Acquisition
Bibliographic records were taken from FAO AGRIS ODS (https://agris.fao.org/ods/; file list in data/manifest.txt and the archival source_manifest.csv). The XML files used here were retrieved on 7 September 2026. Inclusion is restricted to the 7 area prefixes that become the federated clients. The AGRIS Open Data Set is published by FAO under the Creative Commons Attribution 3.0 IGO licence (CC BY 3.0 IGO) [31,33]. That licence permits redistribution of the XML with attribution. The multi-gigabyte source files are nevertheless not bundled, for two reasons: size, and FAO’s notice that joining ODS is not binding and that a data provider can ask to be removed at any time [31]. A later harvest can therefore silently diverge from this study. The v1.0 archive records, for every retrieved file, the FAO filename, ODS URL, byte size and SHA-256 digest, plus the exact AGRIS record identifiers of the 75,897 cleaned rows and the SHA-256 digest of the reconstructed labelled cache. Some FAO pages describe a CC BY 4.0 ODS release; the download and services pages current at writing specify CC BY 3.0 IGO, which is the restriction cited here. The legal split is simple. Raw XML and the title/abstract text it contains remain FAO/AGRIS assets under CC BY 3.0 IGO and are not shipped. Derived benchmark metadata—record identifiers, publication-group maps, split maps, heuristic labels, view offsets, completed SME audit labels and client/stratum sampling metadata, run configurations and measured JSON—are released under CC BY 4.0. Construction code is released under the MIT License. A user reconstructs title and abstract by retrieving the hashed XML and running scripts/reconstruct_benchmark.py.
3.2. Cleaning and Label Construction
Cleaning (cropfuse/cleaning.py) rejects a row for a missing required field, an unmapped theme, a repeated record identifier, a missing or non-integer year, a year outside 1900–2026, or empty title and abstract. Each record’s AGROVOC subject terms [3] are scored against the fixed lexicon THEME_KEYWORDS for ten coarse FAO themes. The record is assigned the unique theme with the strictly highest score. Ties, zero scores and records with no usable subjects are discarded. After that pipeline, 75,897 records remain. The subject strings that generate y are then dropped. vectorize_records raises if a subjects field is reattached. All of those checks pass. Table 1 records the exclusion of those subject strings from X.
3.3. SME Label Validation
Two subject-matter experts independently labelled a balanced blinded sample of 400 AGRIS records (40 from each heuristic class) using the same ten-theme codebook. The annotation protocol presented title and abstract under shuffled Blind_IDs. The heuristic/system label and the AGROVOC subject strings used to construct that label were withheld. Sampling-weighted accuracy uses on client × heuristic-class strata, normalized over the audit sample. Section 5.1 reports the scores. The exact record-level source identifiers of the completed human audit could not be recovered. A later search of the returned annotator books, the PI master workbook, dictionary.xlsx and the dictionary-mapping QC file found only unresolved keys of the form BLIND-001@848 and placeholder links Filename SME_file_001; the evidence files themselves are not in the archive, and title/abstract cells were never cached as values. The archived consensus labels and sampling metadata reproduce the reported statistical analysis (87.25% independent agreement; 94.50% heuristic accuracy; ), but the original 400 documents cannot be independently re-annotated from the archive. A fully reconnectable, independently sampled 400-record audit set (sampler seed 20260921) is therefore additionally provided for future replication. That set is not a substitute for the original audit sample.
3.4. Duplicate Detection and Publication Grouping
Publication groups are identified before any split, by DOI when present, else exact normalized title, alphanumeric title, or token-Jaccard . That search found 2,452 multi-record groups (92 spanned clients; 137 spanned classes). An ungrouped client×class cut put 1,132 of those groups across folds (677 train/test; 2,420 records). Section 3.7 reduces that leakage to 0 groups.
3.5. Natural Federated Client Partition
The seven clients are AGRIS area prefixes. Prefixes name submitting centres, not countries; they already existed in the catalogue. Size is uneven (18.4-fold). Label mix and hashed-content shift are characterized in Section 5.2. These records are text and metadata, not physical sensors. Priority classes in later fusion protocols are bibliographic retrieval categories, not operational alerts.
3.6. Four-View Representation
Title (512), abstract (512), bibliographic metadata (40) and source provenance (32) are encoded by feature hashing [34] except for eight numeric bibliographic fields. AGROVOC subject strings never enter those hashes. A view blackout is a column-range zeroing. The source block is a hashed provider/centre code (86 distinct strings); every source code begins with its client’s area prefix (100.0% of 75,897 records). Table 2 lists the four views and their hashed dimensions.
3.7. Reproducible Train/Validation/Test Splits
Whole publication groups are assigned to splits. The first client×class cell to encounter an unassigned group assigns the entire group; later cells inherit that assignment. Remaining unassigned groups are packed test → validation → train (). Headline seeds are 0, 1 and 2; the design suite uses split seed 0. That procedure leaves groups crossing splits (70% train 53,122, 10% validation 7,593, 20% test 15,182). The test partition is not used for training or selection. Section 4.1 states how validation and test are used. Table 3 reports class counts under that grouped 70/10/20 cut.
Table 4 gives the same records by class and area-prefix client.
3.8. Benchmark Assets
The archival benchmark package is release v1.0 (archive/v1.0), permanently archived on Zenodo at https://doi.org/10.5281/zenodo.22956341 [35]. It contains the exact source_manifest.csv (FAO filename, URL, bytes, SHA-256, retrieval date), the 75,897 AGRIS record identifiers required to reconstruct this benchmark, publication-group maps, train/validation/test maps for seeds 0, 1 and 2, the four-view offset specification, the completed SME audit labels and client/stratum sampling metadata, a separately generated reconnectable 400-record replication audit set (seed 20260921), complete run configurations, measured JSON, requirements.txt/environment.json, build and reconstruction scripts, SHA-256 checksums for every file in the v1.0 tree, and explicit licences (MIT for code; CC BY 4.0 for derived metadata). Raw XML and title/abstract text are not in the tree; they are retrieved from FAO AGRIS ODS under CC BY 3.0 IGO and checked against the archived hashes (scripts/reconstruct_benchmark.py). Table 5 lists those assets.
Reconstruction procedure: download the hashed ODS files listed in source_manifest.csv (or the FAO zip at https://agris.fao.org/agris_ods/) into data/data/; run python scripts/reconstruct_benchmark.py; the script verifies source SHA-256 values, rebuilds the labelled cache, exports the seven-prefix theme CSVs, and checks the cleaned identifier set against identifiers/agris_record_ids.txt. A harvest that fails those checksums is a different corpus. Environment versions used to generate this paper are Python 3.13.14, NumPy 2.4.0, SciPy 1.17.1 and scikit-learn 1.8.0 on Windows 11.
4. Benchmark Tasks and Evaluation Protocols
4.1. Centralized, Local and Federated Reference Models
All experiments use a linear softmax head over the concatenated view vector, trained with mini-batch stochastic gradient descent and regularisation. The choice is deliberate. A linear head makes the federated mechanics exact rather than approximate: parameter averaging [7], update clipping [13], sparsification [12] and quantization [11] all act on a parameter vector whose relationship to the decision function is transparent. The head has 10,9601,096 weights (1,096×10) plus 10 biases, so 10970 parameters. The transmitted vector is this concatenation, including the bias.
The federated protocol is as follows. Each round, the server sends the current parameters to each selected client. A subset of clients then runs local epochs of SGD, and the updates are averaged with weights proportional to sample count (FedAvg) [7]. FedProx [9] pulls each client’s parameters back toward that downlink model with a proximal penalty. Server-side learning-rate decay steadies the late rounds. All federated runs use rounds and three local epochs per round, for 120 local passes over each client’s training set.
Centralized and local-only training are reported at two budgets. The unmatched runs use 12 epochs, the budget first assigned before the confound was noticed. The compute-matched runs use 120 epochs, so a comparison against FedAvg is about communication pattern and data access, not about how long the optimiser was allowed to run. Headline claims use the matched numbers. The unmatched numbers stay in the table so the artefact is visible.
Two multi-seed protocols are also kept distinct. The headline table redraws the publication-grouped 70/10/20 cut with the seed (repeated-split; three seeds). The exploratory 15-seed bit-width comparison, and the compute-matched centralized/local-only trio on that same cut, hold the seed-0 partition fixed and vary only the optimiser seed (fixed-split). Seed 0 agrees under both protocols. A mean from one protocol is not a substitute for the other.
Under local-only training, each client trains its own model on its own records. Nothing is shared. Each model is scored only on that client’s test records; the predictions are concatenated and one global macro-F1 is computed. That is the headline local-only number. The unweighted mean of the seven per-client macro-F1 scores is reported separately as 0.1371 (single-seed unmatched).
The candidate grids and evaluation protocol were specified in advance; operating points and the fusion stack were frozen using the validation partition before any final test evaluation. The grids include the round budget, three local epochs, learning rate 0.5 with server-side decay 0.03, clip-norm and noise ladders, bit-widths, participation, the override threshold 0.40, and the U0–U7 fusion stages. Validation is where those choices are confirmed and frozen. Figure 5 is FedAvg convergence on validation, scored as a diagnostic of the pre-specified round budget. Design sweeps, including clipping, perturbation, bits and participation, are validation operating curves. Fusion-stage decisions and the U0–U7 ladder used to freeze the stack are also scored on validation. The test partition is not used to choose among those grids. The 15-seed 2-bit comparison is an exploratory sensitivity analysis initiated after 2-bit outperformed float32 on the validation bit-width curve; it is not treated as a pre-specified operating point.
The test partition is not used for model, hyperparameter, or architecture selection. Pre-specified configurations are evaluated on it only after validation choices are frozen. Compute-matched FedAvg, centralized and local-only (including the three-seed headline table), the frozen 8-bit and clip-then-perturb operating points in that table, the frozen adaptive and late-fusion stacks under the degradation battery, U1/U6/U7 on test, the data-volume sweep, the Dirichlet and source-view checks, and the lexicon-recovery sanity check are then scored. U7 is the last pre-specified ladder rung, not a hold-out winner. The exploratory 15-seed 2-bit sensitivity analysis is also reported on the frozen test partition, but it is clearly identified as post hoc and is not used to select the reported 8-bit operating point. Model parameters are never updated from validation or test records.
4.2. Communication Accounting
Bytes are decimal megabytes ( bytes), not mebibytes. The accountant records only the parameter payload: there is no TCP/IP, RPC, or serialisation header. Float32 uses bits bytes per coordinate. Biases are included.
For a dense model with R rounds, M participating clients per round, P parameters and b bits per parameter, the uplink payload in bytes is
The downlink term is the aggregate of server-to-client deliveries to the selected clients in each round, always at full float32 (), independent of uplink compression:
It is not a single network multicast: if M clients are selected, the same float32 vector is counted M times. For dense float32 updates the two directions coincide, . With 40, 7 and 10970 (weights plus bias),
which rounds to the 12.3 MB reported in the tables. The matching dense uplink is identical, so total traffic is 24.6 MB.
If only a fraction k of coordinates is sent (top-k) [12], each surviving coordinate carries an int32 index (4 bytes) in addition to its value:
where b is bits per transmitted value ( if uncompressed; under quantization). The compressor is deterministic uniform min–max affine quantization of the whole client update (endpoint-inclusive: integer codes 0 through Q reconstruct the closed interval ), not QSGD stochastic rounding [11]. For a client update , let and . is the maximum integer code, not the number of reconstruction levels. With ,
The codebook has reconstruction levels (two at 1 bit, four at 2 bits). Rounding is IEEE round-to-nearest-even. When the update is sent uncompressed. The payload is the integers q together with the two float32 endpoints : 8 extra bytes per client update, or 2,240 bytes (0.00224 MB) over the FedAvg schedule (). That term is charged. The communication accountant assumes the b-bit integer codes are densely bit-packed: n coordinates at b bits cost bytes, plus those two float32 endpoints. A 2-bit code is therefore charged as two bits, not as a wider stored integer. It does not move any tabulated uplink figure at the one-decimal-MB precision that is reported. The simulation reconstructs before the server average so the arithmetic matches sending that codebook. Alistarh et al. and Reisizadeh et al. are cited as related compressors [11,20]; their stochastic or periodic-averaging variants are not implemented.
4.3. Compression, Clipping and Perturbation
Two mechanisms act on the client update before compression [13,14]. Norm clipping rescales any update whose norm exceeds a threshold C, bounding any one client’s influence on the average. Gaussian update perturbation then adds i.i.d. noise of standard deviation to the clipped vector. The resulting accuracy–perturbation curve is reported. Noise is not composed across rounds and is not treated as a privacy budget.
4.4. Edge–Cloud Fusion
Inference is split. The edge layer runs the available models over a record’s local features, produces per-source decision logits and a per-record reliability estimate from field completeness, and flags anomalies by predictive entropy. Only this evidence crosses the boundary; the raw feature vector never leaves. The cloud layer fuses the evidence.
The cloud keeps one scalar Kalman filter per class on the arriving label prior [22]. Evaluation records are walked in publication-year order within each client (stable argsort of the year field); the filter state is reset at the start of each client. That is the only temporal index the sequence has. The state x is the estimated class distribution. Dynamics are a random walk: predict with . The measurement is the mean fused posterior in the current batch; the measurement variance is with and the mean record reliability in the batch. The update is the standard scalar gain , , , after which x is clipped and renormalised onto the simplex. A log-prior correction of strength then shifts the fused posterior toward the tracked prior relative to the static training prior. This is sequential tracking of the theme mix along publication year, not fusion of the view logits themselves. Section 5.5 reports how that mix actually moves.
If the fused decision is unconfident (max probability ) and a priority class is the runner-up, the cloud promotes that runner-up. The rule fires only for pests and disease, climate and environment. A false negative is a wrong topic label on a bibliographic record, not a missed pest outbreak.
4.5. Missing-View and Corruption Degradation
Robustness is measured under two deliberately separated families.
View blackouts and partial record-level corruptions are applied before feature extraction [5,6]. Full-view blackouts remain the cleanest test: each of the four views is deleted as a column block, plus a joint title-and-abstract blackout. The system is told the view is gone and can deactivate its expert. Token dropout removes 20% or 50% of title and abstract tokens that the hashing tokenizer would have emitted, then re-hashes; a 20% token drop is therefore a 20% drop in source tokens, not a 20% drop in hashed coordinates. Bibliographic field masking independently blanks catalog fields (year, creator/subject/identifier counts, DOI flag, publisher, document type) at the same rates, then rebuilds the bibliographic block. These are the corruptions a bibliographic record can actually suffer.
A numerical check keeps random element-wise missingness at 20% and 50% of hashed coordinates, and additive Gaussian noise at per coordinate. A hashed n-gram vector is sparse: randomly zeroing 20% of coordinates often hits bins that are already zero, so “20% missingness” does not mean 20% of the document disappeared. Gaussian perturbation of hashed n-grams, catalog hashes and source codes has no natural analogue in how AGRIS records become corrupted. Those three conditions are reported as a sensitivity check, not as a model of catalog failure. Occupancy is measured on the validation matrix: hashed occupancy is 0.2325; element-wise 20% coordinate dropout retains of the nonzero hashed bins, while 20% token dropout retains because token removal does not map one-to-one to occupied hashed coordinates owing to repeated n-grams and hashing collisions [34]. Occupancy is therefore a poor proxy for information loss: the two operations do not remove the same mass, and they do not remove the same coordinates.
The primary metric is macro-F1, which weights all 10 classes equally. Balanced accuracy and priority-class recall are also reported: recall restricted to pests and disease, climate and environment. Headline federation, communication and perturbation comparisons are repeated over 3 seeds and reported as mean ± standard deviation; a paired difference against FedAvg is marked consistent when it has the same sign on every seed. Those 3 seeds are the repeated-split estimand: each seed redraws the grouped 70/10/20 cut. A second, fixed-split estimand holds the seed-0 cut and varies only the optimiser seed over 15 draws; it is the protocol of the exploratory 2-bit sensitivity analysis and of the compute-matched trio in Table 18. The two are not averaged. The ablation ladder and the degradation battery are reported as single-seed architectural analyses unless otherwise stated. Fusion-stage decisions and the U0–U7 ladder that freeze the stack are scored on validation. The frozen adaptive stack, U1/U6/U7, and the headline federated configurations are then scored once on the untouched test partition.
4.6. Latency, Throughput and Energy
Reported inference latency is wall time on a single CPU, with no GPU. The machine used for the numbers in this manuscript is ARMv8 (64-bit) Family 8 Model 1 Revision 201, Qualcomm Technologies Inc, 16.8 GB RAM, Windows 11. The inference batch size is 512. Each timed configuration is warmed up with full pass over the evaluation records, then timed for 5 further passes; the median end-to-end time per record is reported. Throughput is the reciprocal of that median. Training, CSV I/O, and hashing of already-vectorised clean features are not included. Native token-drop and bibliographic masking re-hash the corrupted record once, before the timed loop.
Energy is modelled, not metered. Edge time is multiplied by a 10.0 W envelope (a Jetson-class module under load) and cloud time by a 65.0 W envelope (a server CPU socket share): , reported in mJ per record. These are not wall-plug readings and they do not include DRAM, NIC, or idle power.
4.7. Controlled Heterogeneity and the Source View
The natural clients are left as they occur. To test FedProx off that operating point the training records of the 70/10/20 split are re-assigned to seven synthetic clients by drawing, for each class, a Dirichlet() distribution over clients and sampling assignments [8]. Validation and test are not reassigned. Results are reported for and FedProx , compute-matched with FedAvg, over three seeds, scored once on the untouched test set. The source-view check zeros the 32-dimensional provider-code block in every split, then retrains FedAvg and a compute-matched centralized head.
5. Results: Benchmark Characterization and Evaluation
5.1. Data Quality and SME Validation
Independent A/B agreement on the blinded 400-record audit was 349/400 (87.25%), Cohen’s 0.858 [19]. The 51 disagreements were resolved by SME consensus. Against consensus gold the heuristic scored 94.50% accuracy (378/400), macro- 0.945, 0.939. Sampling-weighted accuracy was 94.91%. Table 6 summarises that blinded audit.
Table 7 reports per-class precision, recall and against the consensus gold.
Table 8 is the heuristic-versus-gold confusion matrix on all 400 records.
Table 9 is the independent A-versus-B matrix before consensus.
Label-generating AGROVOC strings are absent from X. An ungrouped cut put 1,132 publication groups across folds (677 train/test); after grouping, 0 groups cross splits. Clients differ 18.4-fold in size; mean JS is 0.0184.
5.2. Client and Feature Heterogeneity
Table 10 reports size, Jensen–Shannon label shift and the dominant class of each area-prefix client.
Mean cosine distance from the pool is 0.0114 with all views and 0.0083 without source (MMD2 2.2183). Table 11 reports cosine and MMD2 from the pooled hashed centroid, with and without the source block.
A linear probe on the source block recovers client identity at 77.0% in-sample against a 33.9% majority baseline.
5.3. Reference Benchmark 1: Distributed Learning
Table 12 is the compute-matched repeated-split comparison on the publication-grouped 70/10/20 cut.
Those three seeds are the repeated-split estimand. A second, fixed-split 15-seed exploratory bit-width study is reported below; the two means are not interchangeable.
Unless the training budget is matched, the comparison is about the budget. An unmatched centralized model, given 12 epochs against FedAvg’s 120 local passes, scores 0.2142 ± 0.0215 and appears to lose to federation by −0.0856 macro-F1. Give it the same 120 epochs and it scores 0.3041 ± 0.0021, a paired difference of against FedAvg (inconsistent in sign across seeds). Local-only moves the same way: 0.2116 unmatched, 0.2884 ± 0.0037 matched, a −0.0114 gap to FedAvg that is inconsistent in sign across seeds. That local-only figure is pooled global macro-F1: each client model is scored only on its own test records, and those predictions are concatenated before the metric is computed. For a national centre choosing between federation and training alone, the fair comparison is the matched budget. Across the repeated-split 70/10/20 headline protocol, compute-matched FedAvg differs from isolation by +0.0114 macro-F1 (inconsistent in sign across seeds). Federation enables collaborative learning when raw-data pooling is prohibited; against pooling the mean difference is −0.0042 (inconsistent in sign across seeds). The unmatched comparison remains in the table so the artefact can be checked from the displayed means: FedAvg 0.2998 against unmatched local-only 0.2116 is a 41.7% relative gain. That number is not used in any claim.
How much data each client holds does not fix the sign of the federated gain. Thinning every client’s training set and scoring on the same full test partitions, federation beats matched local-only at 2 of 7 fractions. At a mean of 3,795+0.0299 training records per client the FedAvg-minus-local gap is +0.0299; on the full training partition (a mean of 7,589 training records per client) it is +0.0114. The sign is not monotone in volume. A crossover threshold is therefore not claimed. Table 13 reports that volume sweep.
Figure 2 plots the same compute-matched means against mean training records per client.
Table 14 sweeps FedProx proximal strength on the natural split.
On the natural split every tested costs accuracy. Table 15 and Figure 3 put FedAvg and FedProx under Dirichlet() label-distribution shift; the test partition is never reassigned.
FedProx [9] is included as a reference aggregator, not as a claimed improvement. It shows no consistent benefit across the tested heterogeneity conditions on this linear head. The Dirichlet sweep drives mean JS from at to 0.3258 at ; FedAvg falls with it, and remains within run variability of FedAvg (at the mean is slightly higher, +0.7%).
Table 16 removes the hashed source block and retrains FedAvg and a compute-matched centralized head.
Every provider code begins with its client’s prefix (100.0% of records). A linear probe on the hashed source block recovers client identity at 77.0% in-sample. The all-views cell is the headline FedAvg (0.2998±0.0151), not a second all-views retrain. Retraining without the source block, FedAvg moves from 0.2998±0.0151 to 0.3010±0.0079 (+0.4%). The matched centralized head on the same features falls from 0.3041±0.0021 to 0.2600±0.0027 (−14.5%). The source block therefore contributes more to the pooled head than to FedAvg. On the remaining three views, no-source FedAvg is 0.3010±0.0079 against centralized 0.2600±0.0027, so the federated result is not an artefact of the prefix-identifying source view.
Table 17 varies how many of the seven clients join each round.
One design seed reached 0.3007 macro-F1 with two clients per round, but the three-seed estimate was 0.2723±0.0294, so aggressive partial participation is not reliably accuracy-preserving in this seven-client setting [7]. Relative to 0.2998 for full-participation FedAvg, that is a substantial deterioration, and which two clients are sampled dominates the count of how many.
Clipping alone, before any noise is added [13,14], takes macro-F1 from 0.3172 to 0.2662 at . Within the tested operating range, performance is substantially more sensitive to the clipping threshold C than to perturbation levels up to . The full clipping, perturbation, sparsification, quantization and combined operating-point tables, and Figure S2, are in Supplementary Section S4.
5.4. Reference Benchmark 2: Communication-Efficient Federated Processing
The reusable communication result is the 8-bit operating point and the directional accountant. The 15-seed 2-bit comparison is an exploratory sensitivity analysis and is reported in Supplementary Section S1.
After 8-bit quantization the uncompressed downlink dominates total parameter traffic. Uniform quantization [11,20] is close to free at 8 bits: 0.3001±0.0147 against 0.2998±0.0151 for float32, a +0.0003 gap that is inconsistent in sign across seeds, at 3.1 MB of uplink against 12.3 MB, a 4× reduction on the part of the channel being compressed. Eight-bit remains the main compression result. On the same seed-0 cut, compute-matched centralized and local-only were retrained over 15 optimiser seeds (Table 18): FedAvg 0.3236±0.0128 against centralized 0.3047±0.0038 and local-only 0.2885±0.0022. That does not replace the three-seed headline, which averages across three test partitions. Table 18 reports those 15-seed compute-matched solvers on the same seed-0 cut.
The split between directions is what changes how these numbers should be read. Equations (1)–(3) make the 12.3 MB downlink figure independently verifiable. Total traffic for FedAvg is 24.6 MB, of which 12.3 MB is aggregate downlink deliveries—full precision, every round, to every selected client, and untouched by any uplink mechanism. Counted as one figure, 8-bit quantization is a modest 1.6× saving. Counted on the compressed channel it is a 4× saving, and the next engineering target is a compressed downlink, not a better sparsifier.
Figure 4 plots that uplink–accuracy frontier.
Figure 5 is FedAvg convergence on the validation partition used to freeze the round budget.
5.5. Reference Benchmarks 3 and 4: Missing-View Robustness and Edge–Cloud Fusion
These two tasks share the same degradation battery and the same frozen stacks. Benchmark 3 is the 12-condition missing-view protocol (Section 4). Benchmark 4 is the edge–cloud ladder scored on that protocol. The numbers show that the resource can host both comparisons. They are not a new architecture. Table 19 reports the cumulative contribution of each cloud fusion stage on the validation partition used to freeze the stack.
Reliability-aware stages raise exact-class priority recall within the late/hybrid architecture, from 0.0108 to 0.1808 (16.8×). The jointly trained federated model still has the higher overall macro-F1. Entropy weighting, year-ordered Kalman prior tracking [22] and priority overrides then move overall macro-F1 from 0.1095 to 0.2280. These stages should be read as late-fusion repairs, not as a claim that the hybrid stack is safer than joint early fusion [15,17]. The binary priority P/R/ cost of the override, and the yearly theme-mix table, are in Supplementary Section S5.
Publication-year order is the temporal index for that Kalman walk. Across 123 years (1900–2026), the mean Jensen–Shannon divergence of a year’s theme mix from the pooled mix is is 0.1617. Among years with at least 200 records, priority-class share moves from 0.1732 in the earliest five such years to 0.2609 in the latest five. Figure 6 plots that yearly mix and the priority-class share.
Sending decision evidence instead of features cuts the inference-time uplink from 3.33 MB to 1.58 MB, a 21× reduction, while end-to-end latency stays at 0.010 ms per record (104,789 records/s) and modelled energy at 0.3059 mJ per record.
Once frozen on validation, the adaptive stack beats plain late fusion on the untouched test partition on 12 of 12 conditions, including every data-native semantic condition and the synthetic numerical checks (Table 20, Figure 7). The worst adaptive case is missing 50 at 0,1360 macro-F1, a 36.7% drop from clean. Token dropout and bibliographic field masking, which corrupt the record before hashing, are milder than element-wise coordinate dropout of the hashed matrix for both the adaptive stack and the jointly trained head. That comparison, however, is against the wrong reference if the question is whether to fuse at the decision level at all. Section 5.6 shows that a plain jointly-trained federated head is the most accurate configuration under all 12 of 12 degradation conditions. Late fusion of unimodal experts is a robustness upgrade over late fusion of those same experts; it is not a robustness upgrade over early fusion of the concatenated features [4,16]. Table 20 and Figure 7 give the full battery.
On the untouched test partition, bibliographic-metadata blackout scores 0.2117 adaptive macro-F1 against clean 0.2148(−0.0032). The biblio expert can compete with better evidence, and entropy weighting does not fully silence it. That is a defect of the weighting rule, not a virtue of the view.
If the cloud is unreachable, the edge layer decides locally by unweighted pooling and retains 75.1% of full performance (0.1614 macro-F1) at 0.006 ms per record. The drop is gradual rather than abrupt.
5.6. Ablation and Unified Evaluation
Each rung was specified in advance (Table 21). Frozen U1, U6 and U7 score 0.3172, 0.2148 and 0.1445 on the untouched test partition. U1 retains the highest clean-data macro-F1; U6 trades clean accuracy for priority-class recall relative to late fusion of the same experts; U7 is the last pre-specified perturbation-and-compression rung, not a recommended operating point. Table 21 is that pre-specified rung-by-rung ladder, scored on the same validation partition.
The rung-by-rung isolation study, the per-condition degradation pivot and Figure S1 are in Supplementary Section S2.
5.7. Lexicon-Recovery Sanity Check
The crop-growth lexicon experiment recovers a keyword rule already written into the title and abstract views. It is not an independent second task. Numbers and the warning against reading it as cross-task validation are in Supplementary Section S3.
6. Discussion and Usage Notes
The reference experiments show what changes if a construction choice is left out. They are not a recommended architecture.
A naive client×class cut produced 1,132 cross-fold publication groups (677 train/test). Publication grouping brings that to . Anyone reconstructing the resource should assign groups first, then splits.
AGROVOC-based labels need an external human audit, and the strings that generate y must not re-enter X. The blinded audit reached 87.25% independent agreement and 94.50% heuristic-versus-gold accuracy. That is a quality bound on the resource, not a replacement of the 75,897 training labels.
The seven area-prefix clients differ mainly in volume (18.4×) rather than in label mix (JS 0.0184). A Dirichlet re-partition can make the label shift larger; it does not make that the default resource.
The same 8-bit run is a 4× saving on uplink or a 1.6× saving on total traffic, depending on how the accountant is defined. The accountant and the bit-packing assumption have to travel with the number.
Token dropout and bibliographic masking are the data-native conditions; coordinate dropout and Gaussian feature noise are numerical checks. They do not remove the same information.
The unmatched 12-epoch baselines made federation look like a 41.7% upgrade. The matched 120-epoch baselines make it +0.0114 against isolation and −0.0042 against pooling. A paper that reports only the first number is reporting a training schedule.
Late fusion of independently trained experts is more stable and much less accurate. Reliability-aware repairs help priority-class recall inside the late/hybrid stack; they do not outperform the jointly trained head, so concatenated early fusion remains the stronger reference on this resource.
7. Limitations
The views are text and metadata, not soil probes or weather stations. Zeroing a column block is a clean model of “this input is gone”, which is what the robustness runs test. It does not reproduce the correlated, drifting failures of real field instruments. Element-wise coordinate dropout and Gaussian feature noise on the hashed matrix are retained only as a synthetic numerical check; token dropout and bibliographic field masking are the data-native analogues.
The client partition is a naturally sized AGRIS area-prefix split, mild in both label mix (mean JS 0.0184) and hashed content (mean cosine 0.0083 without the source block). The Dirichlet sweep in Section 5.3 is the check against stronger label-distribution shift; it does not induce the correlated feature drift of a true domain shift.
The corpus labels remain the AGROVOC heuristic. A blinded 400-record SME audit estimates how often that heuristic matches human consensus: independent A/B agreement was 349/400 (87.25%, 0.858); the 51 disagreements were resolved by SME consensus, not treated as independent agreement; against those gold labels the heuristic scored 94.50% accuracy (sampling-weighted 94.91%; macro- 0.945; 0.939). Sampling-weighted accuracy used inverse sampling-probability weights for the client × heuristic-class strata, , normalized over the audit sample. The annotation protocol presented title and abstract under shuffled Blind_IDs; the heuristic class and the AGROVOC subject strings used to construct it were withheld. This is an audit of the label generator, not a replacement of the 75,897 training labels. The original evidence files are no longer recoverable, so those 400 documents cannot be independently re-annotated from the archive.
The ungrouped client×class split leaked 1,132 duplicate-document groups across folds. Headline, ladder and sweep numbers use the rebuilt publication-grouped 70/10/20 cut (0 groups crossing splits).
U0 on the ablation ladder is compute-matched centralized joint training (120 epochs), not the unmatched 12-epoch central run.
The 15-seed float32 mean and the three-seed headline FedAvg are different estimands: the former holds the seed-0 grouped cut fixed and varies the optimiser seed; the latter redraws the 70/10/20 cut with the seed. Seed 0 agrees under both protocols.
The local solver is linear. That is what makes the federated mechanics attributable, but it caps absolute accuracy and may understate what compression and perturbation cost a model with a more sensitive optimisation landscape. One reading of the 2-bit gain is that a linear head is insensitive to this coarse deterministic quantizer; a causal regularisation mechanism is not established. The 15-seed 2-bit comparison is an exploratory sensitivity analysis, not a pre-specified operating point.
Clipping and Gaussian update perturbation are reported as an operating curve. is not treated as a composed privacy budget.
Priority-class recall is bibliographic: a missed detection is a wrong theme assignment, not a missed outbreak.
The data-volume sweep does not yield a stable crossover. The per-fraction means are reported; a threshold the points do not support is not fitted.
Design sweeps are single-seed and are scored on validation. Their fine structure should be read alongside the multi-seed table, which is the frozen-configuration test confirmation treated as the headline result. Three seeds bound the spread; they do not substitute for a larger study. Sweep scores were not used to inspect the test partition.
8. Conclusions
A benchmark and evaluation framework is released for agricultural catalogues that already live at national centres. The package keeps the natural clients, a human audit of the labels, publication grouping so duplicates do not cross folds, four disjoint views, a directional communication accountant, and a missing-view protocol. It is Zenodo release v1.0 (https://doi.org/10.5281/zenodo.22956341). The reference runs show that a conclusion can flip if the training budget is unmatched, if the split is redrawn, if uplink is counted without downlink, or if degradation is defined only numerically. The point of the resource is to make those comparisons repeatable. It is not a recommended architecture.
Supplementary Materials
The following supporting information can be downloaded at the website of this paper posted on Preprints.org. Section S1: fifteen-seed 2-bit sensitivity analysis. Table S1: quantization-only 15-seed bit-width sweep on the fixed seed-0 split. Section S2: detailed U0–U7 ablation ladder. Table S2: unified-framework ablation ladder. Figure S1: ablation ladder, clean macro-F1 and mean F1 loss under degradation. Table S3: macro-F1 under each degradation condition for selected ablation rungs. Section S3: lexicon-recovery sanity check. Section S4: clipping, perturbation, sparsification, quantization and combined operating points. Table S4: update-norm clipping on the validation partition. Table S5: clipping and Gaussian update perturbation at clip norm . Figure S2: clipping and Gaussian update perturbation at clip norm . Table S6: top-k sparsification of the uplink update. Table S7: deterministic uniform min–max quantization of the uplink update. Table S8: sparsification and quantization applied together. Section S5: priority-override cost and yearly theme mix. Table S9: cost of the priority override on the validation partition. Table S10: publication-year theme mix.
Author Contributions
Conceptualization, M.G.B.; methodology, M.G.B.; software, M.G.B.; validation, M.G.B.; formal analysis, M.G.B.; investigation, M.G.B.; data curation, M.G.B.; writing—original draft preparation, M.G.B.; writing—review and editing, M.G.B. and Y.B.S.; visualization, M.G.B.; supervision, Y.B.S. All authors have read and agreed to the published version of the manuscript.
Funding
This research received no external funding.
Institutional Review Board Statement
Not applicable. The study uses publicly available bibliographic metadata and a completed expert label audit; it does not involve human or animal experimental subjects.
Informed Consent Statement
Not applicable.
Data Availability Statement
The benchmark construction code, publication-group mappings, train/validation/test split mappings, four-view specification, SME audit outputs and client/stratum sampling metadata, together with the independently sampled reconnectable audit set, experiment configurations, measured outputs, and scripts used to regenerate all tables and figures are permanently archived on Zenodo as release v1.0 at https://doi.org/10.5281/zenodo.22956341 [35]. The archive contains SHA-256 checksums for all artefacts in the v1.0 tree and source-manifest entries (archive/v1.0; prefix). Although CC BY 3.0 IGO permits redistribution with attribution [31,33], raw AGRIS XML is not bundled because of archive size and the dynamic nature of provider participation. Instead, the exact source files are identified by filename, URL, byte size and SHA-256 digest and reconstructed from FAO AGRIS ODS using the archived manifest and scripts/reconstruct_benchmark.py. The manifest records the source identifiers, retrieval date (7 September 2026) and checksums required to verify reconstruction of the corpus used in this study. The SHA-256 prefix of the reconstructed labelled cache is recorded as . Code is released under the MIT License; authors’ benchmark metadata and derived audit/split files are released under CC BY 4.0. Title and abstract text remain in the FAO XML. Rebuild tables and figures with pip install -r requirements.txt then python paper/build_paper.py. The builder was run with Python 3.13.14, NumPy 2.4.0, SciPy 1.17.1 and scikit-learn 1.8.0 on Windows 11 (ARMv8 (64-bit) Family
8 Model 1 Revision 201, Qualcomm Technologies Inc, 16.8 GB RAM, device). SHA-256 prefixes: SME audit , fedfuse_results.json , multiseed_results.json , labelled cache . Headline split seeds are 0, 1 and 2; the design suite uses split seed 0.
Acknowledgments
The authors thank the subject-matter experts who completed the blinded label audit.
Conflicts of Interest
The authors declare no conflicts of interest.
Abbreviations
The following abbreviations are used in this manuscript:
| AGRIS | International System for Agricultural Science and Technology |
| AGROVOC | FAO agricultural vocabulary |
| FedAvg | Federated averaging |
| FedProx | Federated proximal optimization |
| JS | Jensen–Shannon divergence |
| SME | Subject-matter expert |
References
- Food and Agriculture Organization of the United Nations. AGRIS: International System for Agricultural Science and Technology [Data set]; FAO: Rome, Italy; Available online: https://www.fao.org/agris/ (accessed on 7 September 2026).
- Kairouz, P.; McMahan, H.B.; Avent, B.; Bellet, A.; Bennis, M.; Bhagoji, A.N.; Bonawitz, K.; Charles, Z.; Cormode, G.; Cummings, R.; et al. Advances and open problems in federated learning. Found. Trends Mach. Learn. 2021, 14(1–2), 1–210. [Google Scholar] [CrossRef]
- Caracciolo, C.; Stellato, A.; Morshed, A.; Johannsen, G.; Rajbhandari, S.; Jaques, Y.; Keizer, J. The AGROVOC Linked Dataset. Semant. Web 2013, 4(3), 341–348. [Google Scholar] [CrossRef]
- Baltrušaitis, T.; Ahuja, C.; Morency, L.-P. Multimodal machine learning: A survey and taxonomy. IEEE Trans. Pattern Anal. Mach. Intell. 2019, 41(2), 423–443. [Google Scholar] [CrossRef] [PubMed]
- Wu, R.; Wang, H.; Chen, H.-T.; Carneiro, G. Deep multimodal learning with missing modality: A survey. In Transactions on Machine Learning Research; ISSN 2835-8856, 2026; Available online: https://openreview.net/forum?id=tc7RFcx4hT. [CrossRef]
- Ma, M.; Ren, J.; Zhao, L.; Tulyakov, S.; Wu, C.; Peng, X. SMIL: Multimodal learning with severely missing modality. Proc. AAAI Conf. Artif. Intell. 2021, vol. 35(no. 3), 2302–2310. [Google Scholar] [CrossRef]
- McMahan, H.B.; Moore, E.; Ramage, D.; Hampson, S.; Agüera y Arcas, B. Communication-efficient learning of deep networks from decentralized data. In Proceedings of the 20th International Conference on Artificial Intelligence and Statistics, 2017; pp. 1273–1282. Available online: https://proceedings.mlr.press/v54/mcmahan17a.html.
- Hsu, T.-M.H.; Qi, H.; Brown, M. Measuring the effects of non-identical data distribution for federated visual classification. arXiv 2019, arXiv:1909.06335. [Google Scholar] [CrossRef]
- Li, T.; Sahu, A.K.; Zaheer, M.; Sanjabi, M.; Talwalkar, A.; Smith, V. Federated optimization in heterogeneous networks. Proceedings of Machine Learning and Systems 2, 2020; pp. 429–450. Available online: https://proceedings.mlsys.org/paper_files/paper/2020/hash/1f5fe83998a09396ebe6477d9475ba0c-Abstract.html.
- Konečný, J.; McMahan, H.B.; Yu, F.X.; Richtárik, P.; Suresh, A.T.; Bacon, D. Federated learning: Strategies for improving communication efficiency. arXiv 2016, arXiv:1610.05492. [Google Scholar] [CrossRef]
- Alistarh, D.; Grubic, D.; Li, J.; Tomioka, R.; Vojnovic, M. QSGD: Communication-efficient SGD via gradient quantization and encoding. Advances in Neural Information Processing Systems 30. 2017. Available online: https://papers.nips.cc/paper_files/paper/2017/hash/6c340f25839e6acdc73414517203f5f0-Abstract.html.
- Aji, A.F.; Heafield, K. Sparse communication for distributed gradient descent. In Proceedings of the 2017 Conference on Empirical Methods in Natural Language Processing, 2017; pp. 440–445. [Google Scholar] [CrossRef]
- Abadi, M.; Chu, A.; Goodfellow, I.; McMahan, H.B.; Mironov, I.; Talwar, K.; Zhang, L. Deep learning with differential privacy. In Proceedings of the 2016 ACM SIGSAC Conference on Computer and Communications Security, 2016; pp. 308–318. [Google Scholar] [CrossRef]
- McMahan, H.B.; Ramage, D.; Talwar, K.; Zhang, L. Learning differentially private recurrent language models. International Conference on Learning Representations, 2018; Available online: https://openreview.net/forum?id=BJ0hF1Z0b.
- Hall, D.L.; Llinas, J. An introduction to multisensor data fusion. Proc. IEEE 1997, 85(1), 6–23. [Google Scholar] [CrossRef]
- Snoek, C.G.M.; Worring, M.; Smeulders, A.W.M. Early versus late fusion in semantic video analysis. In Proceedings of the 13th ACM International Conference on Multimedia, 2005; pp. 399–402. [Google Scholar] [CrossRef]
- Castanedo, F. A review of data fusion techniques. Sci. World J. 2013, 2013, 704504. [Google Scholar] [CrossRef] [PubMed]
- Zhao, Y.; Li, M.; Lai, L.; Suda, N.; Civin, D.; Chandra, V. Federated learning with non-IID data. arXiv 2018, arXiv:1806.00582. [Google Scholar] [CrossRef]
- Cohen, J. A coefficient of agreement for nominal scales. Educ. Psychol. Meas. 1960, 20(1), 37–46. [Google Scholar] [CrossRef]
- Reisizadeh, A.; Mokhtari, A.; Hassani, H.; Jadbabaie, A.; Pedarsani, R. FedPAQ: A communication-efficient federated learning method with periodic averaging and quantization. In Proceedings of the 23rd International Conference on Artificial Intelligence and Statistics, 2020; pp. 2021–2031. Available online: https://proceedings.mlr.press/v108/reisizadeh20a.html.
- Atrey, P.K.; Hossain, M.A.; El Saddik, A.; Kankanhalli, M.S. Multimodal fusion for multimedia analysis: A survey. Multimed. Syst. 2010, 16(6), 345–379. [Google Scholar] [CrossRef]
- Kalman, R.E. A new approach to linear filtering and prediction problems. J. Basic Eng. 1960, 82(1), 35–45. [Google Scholar] [CrossRef]
- Gebru, T.; Morgenstern, J.; Vecchione, B.; Vaughan, J.W.; Wallach, H.; Daumé, H., III; Crawford, K. Datasheets for datasets. Commun. ACM 2021, 64(12), 86–92. [Google Scholar] [CrossRef]
- Bender, E.M.; Friedman, B. Data statements for natural language processing: Toward mitigating system bias and enabling better science. Trans. Assoc. Comput. Linguist. 2018, 6, 587–604. [Google Scholar] [CrossRef]
- Hutchinson, B.; Smart, A.; Hanna, A.; Denton, E.; Greer, C.; Kjartansson, O.; Barnes, P.; Mitchell, M. Towards accountability for machine learning datasets: Practices from software engineering and infrastructure. In Proceedings of the 2021 ACM Conference on Fairness, Accountability, and Transparency, 2021; pp. 560–575. [Google Scholar] [CrossRef]
- Wilkinson, M.D.; Dumontier, M.; Aalbersberg, I.J.; Appleton, G.; Axton, M.; Baak, A.; Blomberg, N.; Boiten, J.-W.; da Silva Santos, L.B.; Bourne, P.E.; et al. The FAIR Guiding Principles for scientific data management and stewardship. Sci. Data 2016, 3, 160018. [Google Scholar] [CrossRef] [PubMed]
- Elmagarmid, A.K.; Ipeirotis, P.G.; Verykios, V.S. Duplicate record detection: A survey. IEEE Trans. Knowl. Data Eng. 2007, 19(1), 1–16. [Google Scholar] [CrossRef]
- Gorman, K.; Bedrick, S. We need to talk about standard splits. In Proceedings of the 57th Annual Meeting of the Association for Computational Linguistics, 2019; pp. 2786–2791. [Google Scholar] [CrossRef] [PubMed]
- Kapoor, S.; Narayanan, A. Leakage and the reproducibility crisis in machine-learning-based science. Patterns 2023, 4(9), 100804. [Google Scholar] [CrossRef] [PubMed]
- Celli, F.; Malapela, T.; Wegner, K.; Subirats, I.; Kokoliou, E.; Keizer, J. AGRIS: Providing access to agricultural research data exploiting open data on the web. F1000Research 2015, 4, 110. [Google Scholar] [CrossRef] [PubMed]
- Food and Agriculture Organization of the United Nations. AGRIS Open Data Set [Data set]. FAO, Rome, Italy, CC BY 3.0 IGO. Available online: https://www.fao.org/agris/download (accessed on 7 September 2026).
- Pineau, J.; Vincent-Lamarre, P.; Sinha, K.; Larivière, V.; Beygelzimer, A.; d’Alché-Buc, F.; Fox, E.; Larochelle, H. Improving reproducibility in machine learning research (a report from the NeurIPS 2019 reproducibility program). J. Mach. Learn. Res. 2021, 22(164), 1–20. Available online: https://jmlr.org/papers/v22/20-303.html.
- Creative Commons. Attribution 3.0 IGO (CC BY 3.0 IGO). 2013. Available online: https://creativecommons.org/licenses/by/3.0/igo/.
- Weinberger, K.Q.; Dasgupta, A.; Langford, J.; Smola, A.J.; Attenberg, J. Feature hashing for large scale multitask learning. In Proceedings of the 26th Annual International Conference on Machine Learning, 2009; pp. 1113–1120. [Google Scholar] [CrossRef]
- Bakir, M.G. A Reproducible Data-Processing and Evaluation Framework for Federated Agricultural Knowledge Repositories (v1.0) [Data set]. Zenodo 2026. [Google Scholar] [CrossRef]
- Lin, J. Divergence measures based on the Shannon entropy. IEEE Trans. Inf. Theory 1991, 37(1), 145–151. [Google Scholar] [CrossRef]
Figure 1.
Benchmark construction: AGRIS XML is parsed and cleaned, labelled from AGROVOC, audited, grouped by publication, partitioned into seven area-prefix clients and four views, split without cross-fold duplicates, and archived as release v1.0 with the reference-task pipeline.
Figure 1.
Benchmark construction: AGRIS XML is parsed and cleaned, labelled from AGROVOC, audited, grouped by publication, partitioned into seven area-prefix clients and four views, split without cross-fold duplicates, and archived as release v1.0 with the reference-task pipeline.
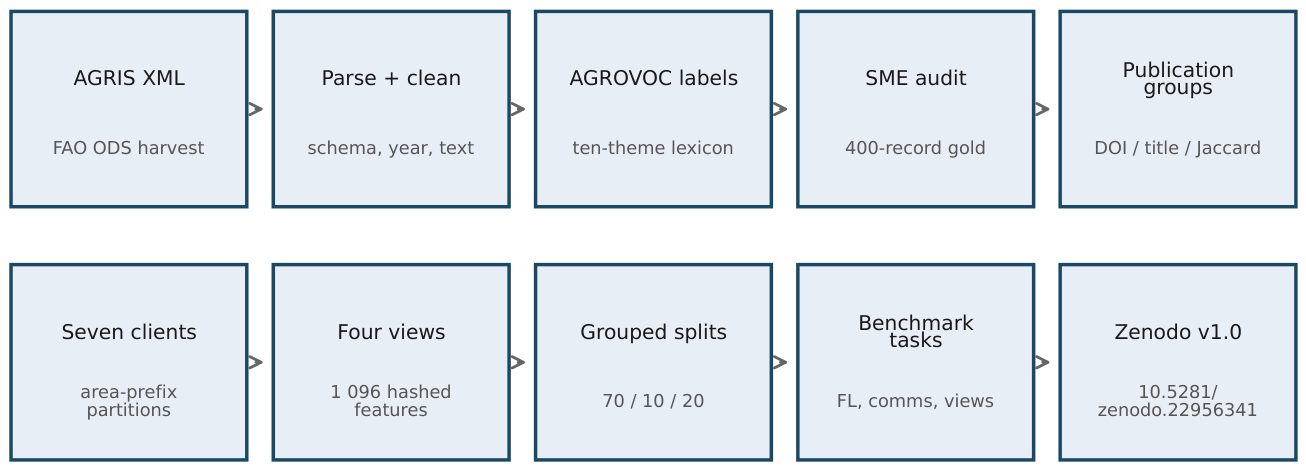
Figure 2.
Macro-F1 against mean training records per client, compute-matched, scored on the same full test sets. Clients still differ in size; the x-axis is the mean, not a per-client constant. Shaded bands are one standard deviation over three seeds.
Figure 2.
Macro-F1 against mean training records per client, compute-matched, scored on the same full test sets. Clients still differ in size; the x-axis is the mean, not a per-client constant. Shaded bands are one standard deviation over three seeds.
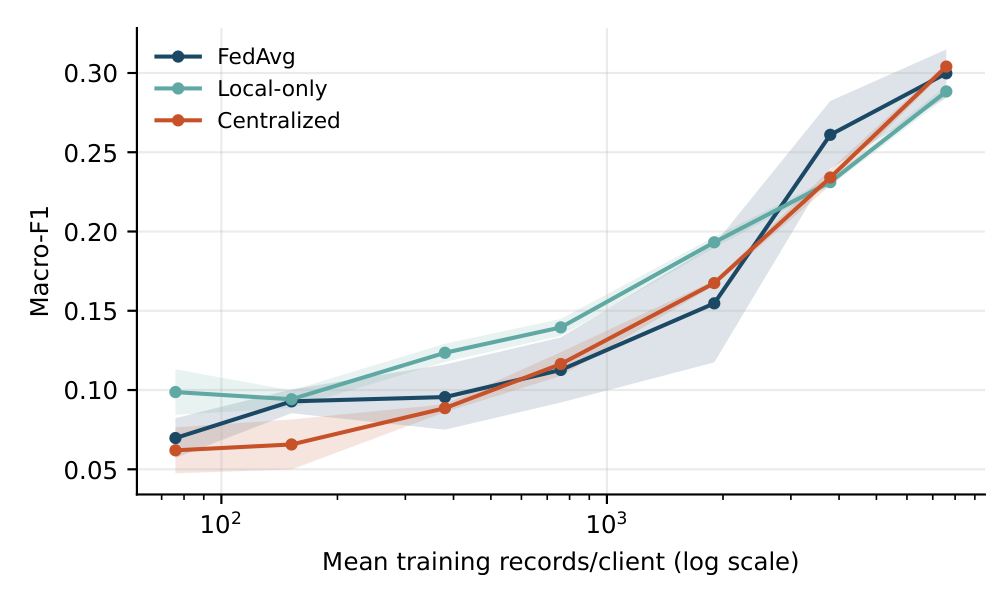
Figure 3.
FedAvg and FedProx under Dirichlet label-distribution shift. The x-axis is (log scale); smaller is more heterogeneous. Error bars are one standard deviation over three seeds. The test partition is never reassigned.
Figure 3.
FedAvg and FedProx under Dirichlet label-distribution shift. The x-axis is (log scale); smaller is more heterogeneous. Error bars are one standard deviation over three seeds. The test partition is never reassigned.
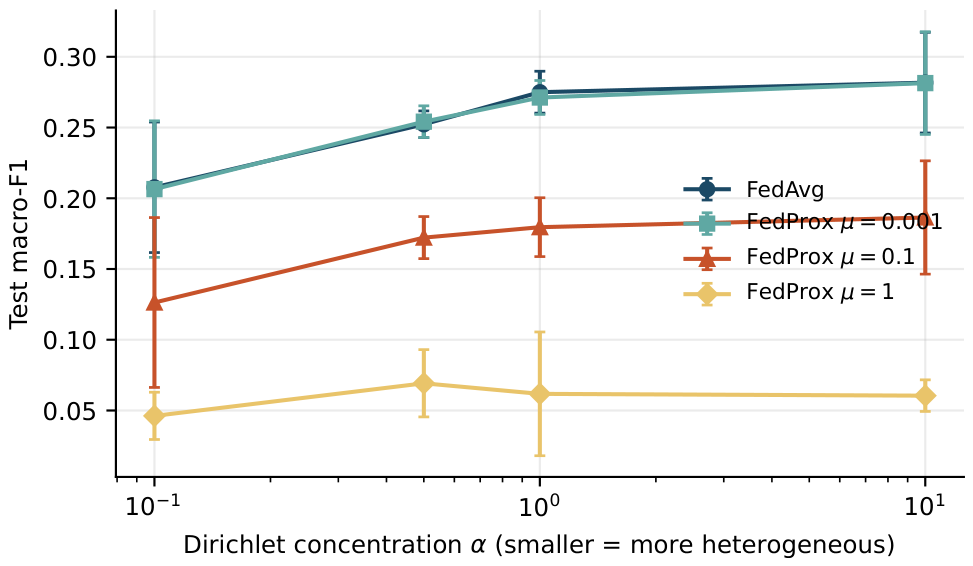
Figure 4.
Communication–accuracy frontier. The x-axis is uplink only; including the uncompressed downlink would compress all points toward the right. The 2-bit point is shown for completeness as an exploratory sensitivity result; it is not a selected operating point (Supplementary Section S1).
Figure 4.
Communication–accuracy frontier. The x-axis is uplink only; including the uncompressed downlink would compress all points toward the right. The 2-bit point is shown for completeness as an exploratory sensitivity result; it is not a selected operating point (Supplementary Section S1).
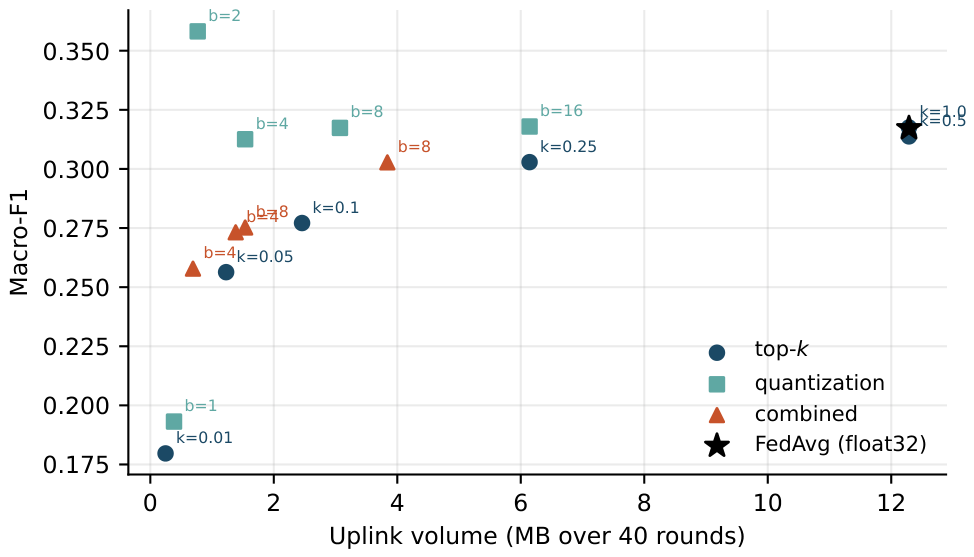
Figure 5.
FedAvg convergence on the validation partition used to freeze the round budget. Solid horizontal lines are compute-matched 120-epoch centralized and local-only validation scores. Faint dashed and dotted lines are the unmatched 12-epoch baselines, shown so the budget artefact is visible rather than used as the comparison.
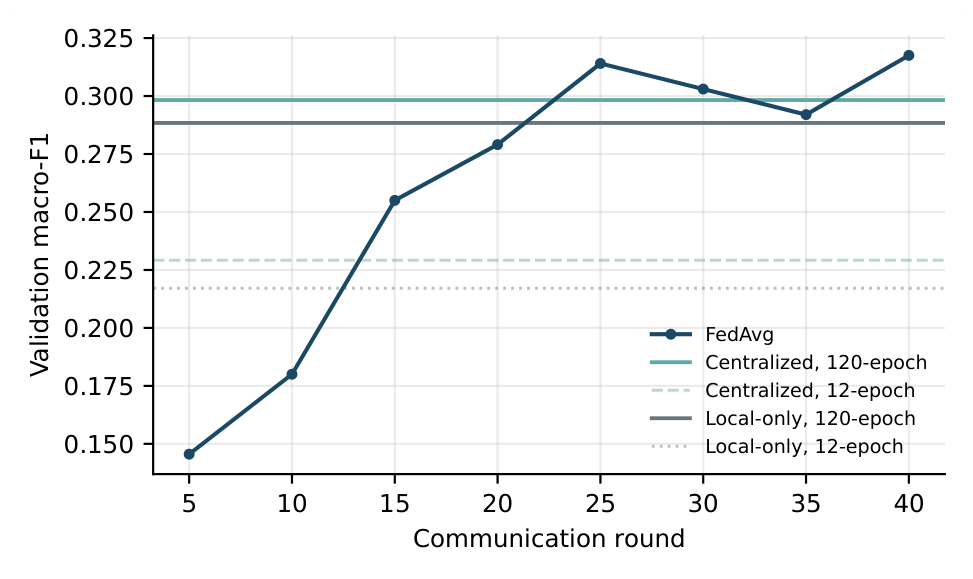
Figure 6.
Theme-mix shift and priority-class share by publication year. The Kalman walk uses this chronological order within each client. Early-year variation is based on very small yearly counts ( in 1900); years with are drawn dotted. The catalogue only becomes dense after about 1985.
Figure 6.
Theme-mix shift and priority-class share by publication year. The Kalman walk uses this chronological order within each client. Early-year variation is based on very small yearly counts ( in 1900); years with are drawn dotted. The catalogue only becomes dense after about 1985.
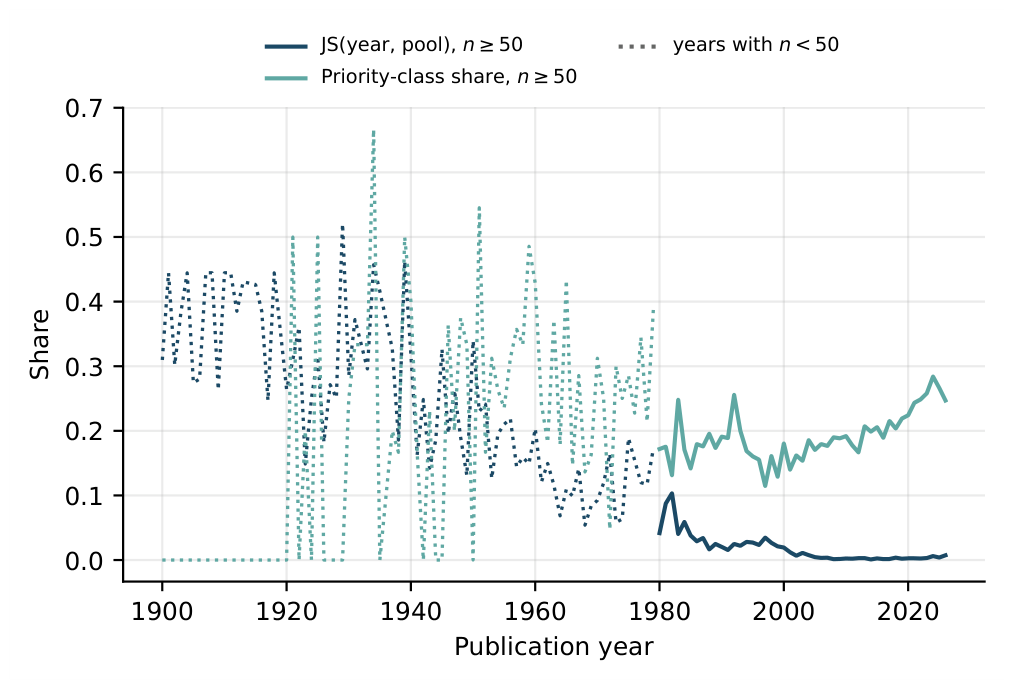
Figure 7.
Degradation battery. Adaptive hybrid fusion versus plain late fusion.
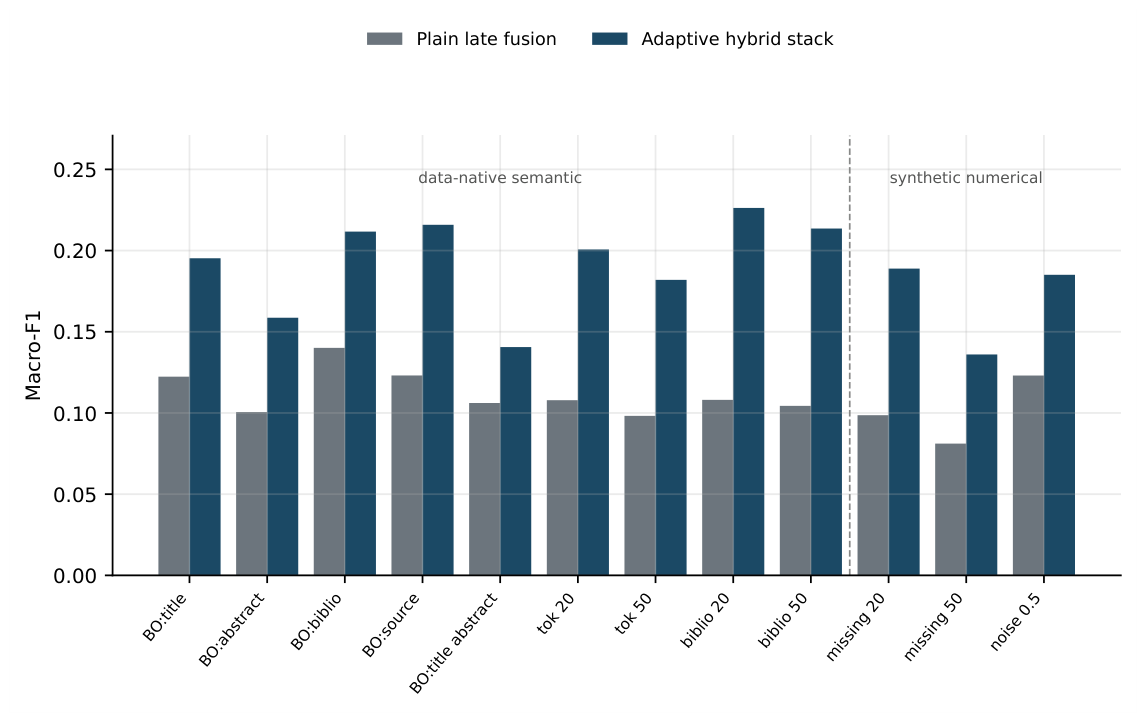

Table 1.
Label-generating AGROVOC subject strings are excluded from the feature matrix. y is assigned from those strings and the list is then dropped. Title and abstract may share words with the cataloguing terms; that is document text, not the subject field.
Table 1.
Label-generating AGROVOC subject strings are excluded from the feature matrix. y is assigned from those strings and the list is then dropped. Title and abstract may share words with the cataloguing terms; that is document text, not the subject field.
| Check | Result |
|---|---|
| Theme CSV “subjects“ column | absent |
| Labeled JSONL “subjects“ field | absent |
| parse_agris exports subject strings | no |
| HashingVectorizer inputs | title; abstract; doc-type + publisher; source code |
| n_subjects in X | count only |
| Guard rejects a reattached subjects field | yes |
Table 2.
View decomposition of the record representation. Title, abstract, catalog strings and the provider/centre code all use feature hashing [34]; the source block is 32 hashed bins, not a one-hot encoding of provider codes. AGROVOC subject strings that generate y are not a view; the bibliographic block includes only the subject-term count. Each view occupies a contiguous, disjoint slice, so a view blackout is exactly a column-block deletion.
| View | Representation | Dimensions |
|---|---|---|
| Title | hashed character/word n-grams [34] | 512 |
| Abstract | hashed word n-grams [34] | 512 |
| Bibliographic | numeric + hashed catalog fields | 40 |
| Source | feature-hashed provider/centre code | 32 |
| Total | concatenated feature vector | 1,096 |
Table 3.
Label construction and split. Each AGRIS record is assigned the unique coarse theme that scores strictly highest against its AGROVOC subject terms [3]; ties and unmatched records are discarded. Counts follow the client- and class-stratified 70/10/20 train/validation/test split. The test partition is cut first and then left untouched. Priority marks the two bibliographic themes used by the override rule (a missed assignment of a document, not an operational alert).
| Class | AGROVOC Mapping | Train | Val | Test | Share (%) | Priority |
|---|---|---|---|---|---|---|
| Crop production | Crop production, agronomy and horticulture | 12,977 | 1,855 | 3,707 | 24.4 | no |
| Livestock | Livestock production, husbandry and animal health | 9,369 | 1,338 | 2,677 | 17.6 | no |
| Pests and disease | Pests, pathogens, weeds and plant-protection chemicals | 6,061 | 866 | 1,732 | 11.4 | yes |
| Genetics and biotechnology | Genetics, genomics, breeding and biotechnology | 5,543 | 791 | 1,585 | 10.4 | no |
| Climate and environment | Climate, weather, environment and land cover | 4,964 | 710 | 1,420 | 9.3 | yes |
| Soil and water | Soils, hydrology, nutrients and land degradation | 3,871 | 553 | 1,105 | 7.3 | no |
| Food and nutrition | Food security, nutrition, safety and postharvest handling | 3,526 | 505 | 1,007 | 6.6 | no |
| Forestry | Forests, timber, silviculture and agroforestry | 2,622 | 375 | 751 | 4.9 | no |
| Economics and policy | Markets, trade, rural livelihoods and agricultural policy | 2,180 | 312 | 623 | 4.1 | no |
| Fisheries and aquaculture | Capture fisheries and aquaculture | 2,011 | 288 | 573 | 3.8 | no |
Table 4.
Records per class and client prefix (all partitions combined). The prefix-level size imbalance in Table 10 is also visible here: B1 holds the largest count in every class.
Table 4.
Records per class and client prefix (all partitions combined). The prefix-level size imbalance in Table 10 is also visible here: B1 holds the largest count in every class.
| Class | B1 | AR | AU | BL | BD | BR | BG | Total |
|---|---|---|---|---|---|---|---|---|
| Crop production | 6,046 | 3,264 | 3,155 | 2,635 | 1,717 | 1,240 | 482 | 18,539 |
| Livestock | 5,236 | 2,439 | 3,085 | 1,399 | 564 | 399 | 262 | 13,384 |
| Pests and disease | 2,402 | 2,218 | 2,434 | 697 | 598 | 190 | 120 | 8,659 |
| Genetics and biotechnology | 2,405 | 2,709 | 1,474 | 564 | 499 | 208 | 60 | 7,919 |
| Climate and environment | 2,323 | 2,197 | 390 | 1,438 | 428 | 203 | 115 | 7,094 |
| Soil and water | 2,097 | 1,220 | 540 | 710 | 643 | 152 | 167 | 5,529 |
| Food and nutrition | 2,155 | 992 | 587 | 941 | 238 | 58 | 67 | 5,038 |
| Forestry | 1,419 | 1,113 | 664 | 200 | 236 | 108 | 8 | 3,748 |
| Economics and policy | 848 | 707 | 689 | 263 | 439 | 62 | 107 | 3,115 |
| Fisheries and aquaculture | 822 | 786 | 750 | 191 | 286 | 27 | 10 | 2,872 |
Table 5.
Benchmark assets in the archived Zenodo release v1.0 (https://doi.org/10.5281/zenodo.22956341); paths are relative to archive/v1.0. Raw AGRIS XML is not bundled; it is retrieved from FAO under CC BY 3.0 IGO and checked against the archived SHA-256 digests.
Table 5.
Benchmark assets in the archived Zenodo release v1.0 (https://doi.org/10.5281/zenodo.22956341); paths are relative to archive/v1.0. Raw AGRIS XML is not bundled; it is retrieved from FAO under CC BY 3.0 IGO and checked against the archived SHA-256 digests.
| Asset | Contents |
|---|---|
| source_manifest.csv | FAO filename, ODS URL, bytes, SHA-256, retrieval date (7 September 2026) for every harvested XML file |
| identifiers/agris_record_ids.csv | Exact AGRIS record IDs for the cleaned benchmark rows, with client, year, heuristic label and source code |
| identifiers/publication_groups.csv | DOI/normalized-title/Jaccard publication-group membership |
| identifiers/splits_seed0.csv (also 1, 2) | Publication-grouped 70/10/20 membership for headline seeds |
| identifiers/views.json | Title 512, abstract 512, bibliographic 40, source 32 |
| sme/AGRIS_SME_FINAL_LABELS.csv | Blinded 400-record audit, independent A/B labels, consensus gold, weights (SHA-256 prefix 0ea6bc208745) |
| sme/sme_rerun_seed20260921_ids.csv | Independently sampled reconnectable 400-record audit set (seed 20260921; not the completed-audit sample) |
| sme/SME_TRACEABILITY.md | Recovery attempt and the irrecoverability of the original 400-document source map |
| cache_checksums.csv | SHA-256 of the reconstructed labelled cache and publication-DOI mapping |
| configs/ | Benchmark and federated run configurations |
| results/ | Measured JSON/CSV used by the paper builder |
| LICENSE-CODE | MIT licence for construction and paper-build code |
| LICENSE-DATA | CC BY 4.0 licence for derived benchmark metadata |
| scripts/reconstruct_benchmark.py | Verifies source hashes and rebuilds the labelled cache |
| environment.json/requirements.txt | Python, NumPy, SciPy and scikit-learn versions used to build this paper |
Table 6.
Blinded 400-record SME validation. Independent A/B agreement is reported before consensus. The 51 disagreements were resolved by SME consensus; that is not independent agreement. Heuristic metrics use the consensus gold labels. Sampling-weighted accuracy used inverse sampling-probability weights for the client × heuristic-class strata, , normalized over the audit sample. The annotation protocol presented title and abstract under shuffled Blind IDs; the heuristic/system label and the AGROVOC subject strings used to construct it were withheld. The original evidence files are no longer recoverable.
| Quantity | Value |
|---|---|
| Blinded records | 400 |
| Independent SME A/B agreement | 349/400 (87.25%) |
| Independent Cohen’s | 0.858 |
| Disagreements resolved by SME consensus | 51 |
| Heuristic vs consensus gold | 378/400 (94.50%) |
| Sampling-weighted accuracy | 94.91% |
| Heuristic vs gold macro-F1 | 0.945 |
| Heuristic vs gold Cohen’s | 0.939 |
Table 7.
Per-class heuristic performance against consensus gold labels. Gold n is the consensus class count, so it need not equal 40 when consensus moved a record off the heuristic class.
Table 7.
Per-class heuristic performance against consensus gold labels. Gold n is the consensus class count, so it need not equal 40 when consensus moved a record off the heuristic class.
| Theme | Gold n | Precision | Recall | |
|---|---|---|---|---|
| Crop production | 44 | 0.975 | 0.886 | 0.929 |
| Livestock | 38 | 0.925 | 0.974 | 0.949 |
| Pests and disease | 41 | 0.925 | 0.902 | 0.914 |
| Genetics and biotechnology | 41 | 0.950 | 0.927 | 0.938 |
| Climate and environment | 41 | 0.975 | 0.951 | 0.963 |
| Soil and water | 38 | 0.925 | 0.974 | 0.949 |
| Food and nutrition | 39 | 0.950 | 0.974 | 0.962 |
| Forestry | 41 | 0.975 | 0.951 | 0.963 |
| Economics and policy | 40 | 0.975 | 0.975 | 0.975 |
| Fisheries and aquaculture | 37 | 0.875 | 0.946 | 0.909 |
Table 8.
Heuristic (rows) versus consensus gold (columns). Counts on all 400 blinded records.
| Crop | Liv. | Pest | Gen. | Clim. | Soil | Food | For. | Econ. | Fish. | |
|---|---|---|---|---|---|---|---|---|---|---|
| Crop | 39 | 1 | 0 | 0 | 0 | 0 | 0 | 0 | 0 | 0 |
| Liv. | 2 | 37 | 0 | 0 | 0 | 0 | 0 | 0 | 0 | 1 |
| Pest | 1 | 0 | 37 | 1 | 1 | 0 | 0 | 0 | 0 | 0 |
| Gen. | 0 | 0 | 2 | 38 | 0 | 0 | 0 | 0 | 0 | 0 |
| Clim. | 0 | 0 | 0 | 0 | 39 | 0 | 0 | 0 | 0 | 1 |
| Soil | 0 | 0 | 1 | 0 | 0 | 37 | 1 | 0 | 1 | 0 |
| Food | 1 | 0 | 0 | 0 | 0 | 1 | 38 | 0 | 0 | 0 |
| For. | 0 | 0 | 0 | 1 | 0 | 0 | 0 | 39 | 0 | 0 |
| Econ. | 0 | 0 | 0 | 0 | 0 | 0 | 0 | 1 | 39 | 0 |
| Fish. | 1 | 0 | 1 | 1 | 1 | 0 | 0 | 1 | 0 | 35 |
Table 9.
Independent annotator A (rows) versus annotator B (columns), before consensus. Counts on all 400 blinded records.
Table 9.
Independent annotator A (rows) versus annotator B (columns), before consensus. Counts on all 400 blinded records.
| Crop | Liv. | Pest | Gen. | Clim. | Soil | Food | For. | Econ. | Fish. | |
|---|---|---|---|---|---|---|---|---|---|---|
| Crop | 35 | 3 | 2 | 0 | 0 | 0 | 0 | 0 | 0 | 1 |
| Liv. | 2 | 35 | 1 | 0 | 0 | 1 | 0 | 0 | 0 | 0 |
| Pest | 0 | 0 | 35 | 3 | 1 | 1 | 0 | 1 | 1 | 0 |
| Gen. | 0 | 0 | 2 | 34 | 0 | 0 | 0 | 1 | 0 | 3 |
| Clim. | 2 | 0 | 0 | 1 | 36 | 0 | 0 | 0 | 0 | 1 |
| Soil | 0 | 1 | 0 | 0 | 0 | 34 | 3 | 1 | 0 | 0 |
| Food | 1 | 0 | 1 | 0 | 0 | 2 | 36 | 0 | 0 | 0 |
| For. | 0 | 1 | 1 | 0 | 0 | 1 | 0 | 34 | 1 | 1 |
| Econ. | 1 | 0 | 0 | 1 | 1 | 0 | 1 | 0 | 36 | 0 |
| Fish. | 0 | 3 | 1 | 1 | 1 | 0 | 0 | 0 | 0 | 34 |
Table 10.
Federated partition into seven AGRIS area-prefix clients as they occur in the catalogue. Prefixes name submitting centres, not countries. Jensen–Shannon divergence [36] is each client’s label mix against the pooled mix. Effective classes is exp of the label entropy.
Table 10.
Federated partition into seven AGRIS area-prefix clients as they occur in the catalogue. Prefixes name submitting centres, not countries. Jensen–Shannon divergence [36] is each client’s label mix against the pooled mix. Effective classes is exp of the label entropy.
| Prefix | Records | Share (%) | JS Div. | Dominant Class | Dom. Share (%) | Eff. Classes |
|---|---|---|---|---|---|---|
| B1 | 25,753 | 33.9 | 0.0023 | crops plants | 23.5 | 8.31 |
| AR | 17,645 | 23.2 | 0.0076 | crops plants | 18.5 | 8.86 |
| AU | 13,768 | 18.1 | 0.0190 | crops plants | 22.9 | 7.66 |
| BL | 9,038 | 11.9 | 0.0167 | crops plants | 29.2 | 7.50 |
| BD | 5,648 | 7.4 | 0.0150 | crops plants | 30.4 | 8.19 |
| BR | 2,647 | 3.5 | 0.0342 | crops plants | 46.8 | 5.69 |
| BG | 1,398 | 1.8 | 0.0342 | crops plants | 34.5 | 6.64 |
Table 11.
Feature-space shift of each natural client from the pooled hashed centroid. Cosine distance is . Linear-kernel MMD2 is . The no-source columns zero the 32-dimensional provider-code block so client identity is not counted as content shift.
Table 11.
Feature-space shift of each natural client from the pooled hashed centroid. Cosine distance is . Linear-kernel MMD2 is . The no-source columns zero the 32-dimensional provider-code block so client identity is not counted as content shift.
| Prefix | Records | Cosine (All Views) | Cosine (No Source) | Linear MMD2 (No Source) |
|---|---|---|---|---|
| B1 | 25,753 | 0.0019 | 0.0014 | 0.65612 |
| AR | 17,645 | 0.0019 | 0.0015 | 0.67404 |
| AU | 13,768 | 0.0252 | 0.0213 | 5.87852 |
| BL | 9,038 | 0.0036 | 0.0022 | 0.94054 |
| BD | 5,648 | 0.0038 | 0.0022 | 0.56710 |
| BR | 2,647 | 0.0341 | 0.0246 | 5.80242 |
| BG | 1,398 | 0.0093 | 0.0047 | 1.00955 |
Table 12.
Headline comparison over 3 seeds at 40 rounds. Each seed redraws the publication-grouped 70/10/20 cut (split seed = model seed). Uplink excludes the uncompressed aggregate downlink deliveries to selected clients, which are identical across federated rows. The exploratory 2-bit quantization result is reported in Supplementary Section S1 and is not a selected operating point.
| Configuration | Macro-F1 (Mean ± sd) | Bal. Acc. | Uplink (MB) |
|---|---|---|---|
| Centralized, 12 epochs (unmatched) | 0.2142 ± 0.0215 | 0.2227 | – |
| Local-only, 12 epochs (unmatched) | 0.2116 ± 0.0073 | 0.2148 | – |
| Centralized, compute-matched | 0.3041 ± 0.0021 | 0.2891 | – |
| Local-only, compute-matched | 0.2884 ± 0.0037 | 0.2762 | – |
| FedAvg | 0.2998 ± 0.0151 | 0.2840 | 12.3 |
| FedProx () | 0.2984 ± 0.0142 | 0.2828 | 12.3 |
| FedAvg, 2/7 clients per round | 0.2723 ± 0.0294 | 0.2713 | 3.5 |
| FedAvg + clipping () | 0.2525 ± 0.0153 | 0.2477 | 12.3 |
| + Gaussian perturbation () | 0.2499 ± 0.0171 | 0.2468 | 12.3 |
| + Gaussian perturbation () | 0.1792 ± 0.0344 | 0.1964 | 12.3 |
| FedAvg + top-10% sparsification | 0.2726 ± 0.0115 | 0.2625 | 2.5 |
| FedAvg + 8-bit quantization | 0.3001 ± 0.0147 | 0.2843 | 3.1 |
| FedAvg + top-10% + 8-bit | 0.2720 ± 0.0115 | 0.2621 | 1.5 |
Table 13.
Accuracy against the mean volume of training data per client (clients still differ in size; the full-data column is 7,589 only as a mean). All three methods are compute-matched and scored on the same full test sets. The sign of the last column is not stable.
Table 13.
Accuracy against the mean volume of training data per client (clients still differ in size; the full-data column is 7,589 only as a mean). All three methods are compute-matched and scored on the same full test sets. The sign of the last column is not stable.
| Train Data | Mean Train Records/Client | FedAvg | Local-Only | Centralized | FedAvg − Local |
|---|---|---|---|---|---|
| 1% | 76 | 0.0697 ± 0.0126 | 0.0987 ± 0.0144 | 0.0620 ± 0.0145 | -0.0290 |
| 2% | 152 | 0.0929 ± 0.0075 | 0.0942 ± 0.0056 | 0.0657 ± 0.0158 | -0.0013 |
| 5% | 380 | 0.0956 ± 0.0206 | 0.1235 ± 0.0057 | 0.0886 ± 0.0025 | -0.0279 |
| 10% | 759 | 0.1127 ± 0.0205 | 0.1395 ± 0.0053 | 0.1164 ± 0.0075 | -0.0268 |
| 25% | 1,898 | 0.1547 ± 0.0373 | 0.1932 ± 0.0034 | 0.1675 ± 0.0016 | -0.0385 |
| 50% | 3,795 | 0.2610 ± 0.0213 | 0.2311 ± 0.0025 | 0.2341 ± 0.0051 | +0.0299 |
| 100% | 7,589 | 0.2998 ± 0.0151 | 0.2884 ± 0.0037 | 0.3041 ± 0.0021 | +0.0114 |
Table 14.
FedProx proximal strength, scored on the validation partition. The partition is only mildly non-IID. On this validation sweep the proximal term does not improve macro-F1.
Table 14.
FedProx proximal strength, scored on the validation partition. The partition is only mildly non-IID. On this validation sweep the proximal term does not improve macro-F1.
| Macro-F1 | Bal. Acc. | Uplink (MB) | Total (MB) | |
|---|---|---|---|---|
| 0.001 | 0.3155 | 0.2925 | 12.3 | 24.6 |
| 0.01 | 0.2927 | 0.2741 | 12.3 | 24.6 |
| 0.1 | 0.1513 | 0.1728 | 12.3 | 24.6 |
| 0.5 | 0.0748 | 0.1225 | 12.3 | 24.6 |
Table 15.
Controlled label-distribution shift. Training records are reassigned to seven synthetic clients by Dirichlet() over classes; the untouched test partition is held fixed. Smaller is more heterogeneous. FedProx is the proximal strength. Mean ± sd over three seeds.
Table 15.
Controlled label-distribution shift. Training records are reassigned to seven synthetic clients by Dirichlet() over classes; the untouched test partition is held fixed. Smaller is more heterogeneous. FedProx is the proximal strength. Mean ± sd over three seeds.
| Mean JS | FedAvg | ||||
|---|---|---|---|---|---|
| 10 | 0.0099 | 0.2817 ± 0.0356 | 0.2814 ± 0.0363 | 0.1864 ± 0.0400 | 0.0605 ± 0.0112 |
| 1 | 0.0816 | 0.2750 ± 0.0148 | 0.2712 ± 0.0120 | 0.1796 ± 0.0208 | 0.0618 ± 0.0438 |
| 0.5 | 0.1407 | 0.2523 ± 0.0095 | 0.2541 ± 0.0112 | 0.1722 ± 0.0149 | 0.0692 ± 0.0238 |
| 0.1 | 0.3258 | 0.2077 ± 0.0461 | 0.2065 ± 0.0482 | 0.1263 ± 0.0600 | 0.0462 ± 0.0167 |
Table 16.
Source-view ablation on the untouched test partition. The all-views FedAvg and centralized numbers are the headline three-seed repeated-split means, not an independent retrain. Only the source-zeroed condition is newly trained under the corresponding three-seed repeated-split protocol. The source block is the hashed provider/centre code. Both models are compute-matched (40 rounds × 3 local epochs). The drop when the block is removed is the contribution of that view; a drop is not assumed. Federation on the remaining three views is the check against identity leakage.
| Feature Set | FedAvg Macro-F1 | Centralized Macro-F1 |
|---|---|---|
| All four views | 0.2998 ± 0.0151 | 0.3041 ± 0.0021 |
| Source view zeroed | 0.3010 ± 0.0079 | 0.2600 ± 0.0027 |
Table 17.
Client participation per round, scored on the validation partition. The three-seed estimate at two of seven clients in Table 12 is a frozen-configuration test score.
Table 17.
Client participation per round, scored on the validation partition. The three-seed estimate at two of seven clients in Table 12 is a frozen-configuration test score.
| Participation | Macro-F1 | Bal. Acc. | Uplink (MB) | Total (MB) |
|---|---|---|---|---|
| 0.29 | 0.3007 | 0.3004 | 3.5 | 7.0 |
| 0.43 | 0.2335 | 0.2332 | 5.3 | 10.5 |
| 0.57 | 0.1955 | 0.2007 | 7.0 | 14.0 |
| 0.71 | 0.2807 | 0.2675 | 8.8 | 17.6 |
| 1.0 | 0.3176 | 0.2941 | 12.3 | 24.6 |
Table 18.
Compute-matched solvers on the same publication-grouped cut as Supplementary Table S1 (15-seed bit-width study; split seed 0) and the same 15 optimiser seeds. FedAvg float32 is the bit-sweep 32-bit series. is FedAvg minus the row. This is not the three-seed headline estimand.
Table 18.
Compute-matched solvers on the same publication-grouped cut as Supplementary Table S1 (15-seed bit-width study; split seed 0) and the same 15 optimiser seeds. FedAvg float32 is the bit-sweep 32-bit series. is FedAvg minus the row. This is not the three-seed headline estimand.
| Solver | Test Macro-F1 | 95% CI | FedAvg Minus Row | 95% CI |
|---|---|---|---|---|
| FedAvg float32 | 0.3236 ± 0.0128 | 0.3165–0.3307 | — | — |
| Centralized, 120-epoch | 0.3047 ± 0.0038 | 0.3026–0.3068 | +0.0189 | +0.0109–+0.0269 |
| Local-only, 120-epoch | 0.2885 ± 0.0022 | 0.2873–0.2897 | +0.0351 | +0.0282–+0.0420 |
Table 19.
Cumulative contribution of each cognitive-fusion stage in the cloud layer. Every row uses the same edge stage and the same trained models, and is scored on the validation partition used to freeze the fusion stages. Latency for the full stack is the median of 5 timed CPU inference passes after warm-up; energy is with nominal 10.0 W edge and 65.0 W cloud envelopes, not a wall-plug reading. Training, CSV I/O and hashing of clean features are not included.
| Cloud Fusion Configuration | F1 | Bal. | Priority | Lat. (ms) | Thr. (rec/s) | Energy (mJ) |
|---|---|---|---|---|---|---|
| Late fusion, unimodal experts only | 0.1095 | 0.1549 | 0.0108 | 0.005 | 183,764 | 0.1172 |
| + joint head (hybrid evidence pool) | 0.1761 | 0.1953 | 0.1053 | 0.008 | 127,192 | 0.1775 |
| + entropy-weighted fusion | 0.1929 | 0.2053 | 0.1168 | 0.008 | 128,779 | 0.1936 |
| + Kalman prior tracking (year-ordered) | 0.2294 | 0.2285 | 0.1656 | 0.009 | 106,421 | 0.2737 |
| + priority-class overrides | 0.2280 | 0.2286 | 0.1808 | 0.010 | 104,789 | 0.3059 |
Table 20.
Degradation battery at inference. Data-native semantic conditions act on the record before hashing (view blackout, token dropout, bibliographic field masking). Synthetic numerical conditions act on the hashed matrix (element-wise coordinate dropout, Gaussian feature noise) and are a sensitivity check, not a model of catalog corruption. Scores are a single pass of the frozen adaptive and late-fusion stacks on the untouched test partition.
| Condition | Family | Adaptive F1 | vs. Clean (%) | Late Fusion F1 | Priority Recall |
|---|---|---|---|---|---|
| blackout title | data-native semantic | 0.1953 | -9.1 | 0.1223 | 0.1875 |
| blackout abstract | data-native semantic | 0.1586 | -26.2 | 0.1006 | 0.1110 |
| blackout biblio | data-native semantic | 0.2117 | -1.5 | 0.1401 | 0.0857 |
| blackout source | data-native semantic | 0.2159 | +0.5 | 0.1231 | 0.2195 |
| blackout title abstract | data-native semantic | 0.1406 | -34.6 | 0.1061 | 0.1069 |
| token drop 20 | data-native semantic | 0.2007 | -6.6 | 0.1079 | 0.1396 |
| token drop 50 | data-native semantic | 0.1820 | -15.3 | 0.0982 | 0.1069 |
| biblio mask 20 | data-native semantic | 0.2262 | +5.3 | 0.1081 | 0.1773 |
| biblio mask 50 | data-native semantic | 0.2136 | -0.6 | 0.1044 | 0.1482 |
| missing 20 | synthetic numerical | 0.1889 | -12.1 | 0.0986 | 0.1050 |
| missing 50 | synthetic numerical | 0.1360 | -36.7 | 0.0811 | 0.0368 |
| noise 0.5 | synthetic numerical | 0.1851 | -13.9 | 0.1231 | 0.1609 |
Table 21.
Unified-framework ablation ladder. Each rung enables exactly one additional architectural capability. F1 is the loss relative to that rung’s own clean score. Mean F1 averages data-native semantic and synthetic numerical conditions together; family-wise means are in the text. This table is scored on the validation partition used to freeze fusion stages. U1, U6 and U7 are then confirmed once on the untouched test partition. Latency is the median end-to-end milliseconds per record over 5 timed CPU inference passes after warm-up; energy in the JSON uses the same envelopes as Table 19 of the main manuscript. Comms is training traffic in decimal MB.
| Rung | F1 | Bal. | Priority | Mean F1 | Worst F1 | Lat. (ms) | Comms (MB) |
|---|---|---|---|---|---|---|---|
| U0 centralized joint | 0.2983 | 0.2832 | 0.2481 | 0.0586 | 0.1486 | 0.003 | – |
| U1 federated joint | 0.3176 | 0.2941 | 0.2671 | 0.0713 | 0.1781 | 0.004 | 24.6 |
| U2 single-view experts | 0.1095 | 0.1549 | 0.0108 | 0.0018 | 0.0299 | 0.005 | 24.6 |
| U3 hybrid pool | 0.1761 | 0.1953 | 0.1053 | 0.0198 | 0.0730 | 0.007 | 24.6 |
| U4 + entropy weighting | 0.1929 | 0.2053 | 0.1168 | 0.0270 | 0.0795 | 0.009 | 24.6 |
| U5 + Kalman prior | 0.2294 | 0.2285 | 0.1656 | 0.0360 | 0.0887 | 0.009 | 24.6 |
| U6 + priority override | 0.2280 | 0.2286 | 0.1808 | 0.0353 | 0.0860 | 0.009 | 24.6 |
| U7 clipping + perturbation + compression | 0.1521 | 0.1777 | 0.0971 | 0.0087 | 0.0238 | 0.009 | 13.8 |
Disclaimer/Publisher’s Note: The statements, opinions and data contained in all publications are solely those of the individual author(s) and contributor(s) and not of MDPI and/or the editor(s). MDPI and/or the editor(s) disclaim responsibility for any injury to people or property resulting from any ideas, methods, instructions or products referred to in the content. |
© 2026 by the authors. Licensee MDPI, Basel, Switzerland. This article is an open access article distributed under the terms and conditions of the Creative Commons Attribution (CC BY) license.
Copyright: This open access article is published under a Creative Commons CC BY 4.0 license, which permit the free download, distribution, and reuse, provided that the author and preprint are cited in any reuse.