

Submitted:
08 October 2026
Posted:
09 October 2026
You are already at the latest version
Abstract
Background: The scarcity of psychometrically robust instruments limits the assessment of academic stressors among Spanish university students. This study aimed to adapt the University Student Stressors Questionnaire (USSQ) to the Spanish context and evaluate its psychometric properties in a sample of undergraduate and postgraduate students. Methods: A total of 4,925 students from a Spanish public university participated. Exploratory and confirmatory factor analyses, measurement invariance analyses (by sex, gender, and study level), and convergent validity analyses with measures of depression, anxiety, and stress (DASS-21) and psychological well-being (Ryff’s PWB) were conducted. Results: The final 27-item, seven-factor model demonstrated optimal fit and adequate reliability (McDonald's omega: .73-.89). Partial measurement invariance was achieved for sex and gender, and full invariance for study level. Convergent validity was supported through positive correlations with psychological distress and negative correlations with well-being. Conclusions: The University Student Stressors Questionnaire (USSQ) is a valid and reliable instrument for assessing academic stressors in the Spanish university population. "Fear of failure" emerges as the most prominent factor associated with psychological distress.
Keywords:
stressors questionnaire
; academic stressors
; psychological distress
; stress
; anxiety
; depression
; university students
1. Introduction
Academic stress is a salient issue during emerging adulthood, a developmental stage marked by increasing demands and a transition toward autonomy (Matud et al., 2020). Consequently, university students exhibit elevated mental health problems compared to the general population (American Psychological Association, 2020; Ibrahim et al., 2013), as they navigate rigorous academic requirements and critical decision-making (Ruiz-Camacho & Gozalo, 2025). The prevalence and intensity of this stress are becoming increasingly prominent (Beiter et al., 2015).
Defined as the perception that university demands exceed available coping resources (Cohen et al., 2007), academic stress aligns with the Transactional Model of Stress and Coping (Lazarus & Folkman, 1984). Stress levels vary significantly by sex, with females reporting higher intensity (Asensio-Martínez et al., 2023; Ruiz-Camacho & Gozalo, 2025); by academic year, particularly affecting postgraduate students facing work-life and financial challenges (Stojadinović et al., 2025); and by field of study, peaking in health sciences (Ruiz-Robledillo et al., 2022). Furthermore, the COVID-19 pandemic exacerbated these stressors (Ruiz-Robledillo et al., 2022).
Chronically elevated academic stress severely impairs student functioning (Saleem, 2022). It is linked to poorer academic performance (Zając et al., 2024), particularly alongside ineffective coping strategies (Kamtsios & Karagiannopoulou, 2015). Psychologically, it strongly predicts anxiety and depression (Koppenborg et al., 2024; Rastogi et al., 2025). Physically, it correlates with headaches, insomnia, fatigue, and unhealthy lifestyle habits (Monserrat-Hernández et al., 2023).
Despite its impact, assessing academic stress lacks consensus. Existing instruments show significant limitations: the E-CEA is excessively long (Cabanach et al., 2016), the SISCO inventory conflates stressors with symptoms and coping mechanisms (Barraza, 2007), and the CEAU is restricted to first-year students (García-Ros et al., 2012). Other scales, like the PAS (Bedewy & Gabriel, 2015) or recent Spanish tools (Asensio-Martínez et al., 2023; Castillo-Navarrete et al., 2024; Ruiz-Camacho & Gozalo, 2025; Ruiz-Robledillo et al., 2022), do not fully address these specific assessment gaps.
Consequently, the Undergraduate Stressors Questionnaire (USQ; Kamtsios & Karagiannopoulou, 2015) emerges as a comprehensive alternative, assessing core stressors like academic overload and fear of failure. Given the need for culturally attuned, psychometrically robust tools (Dagli et al., 2024), this study aims to: (a) adapt the USQ for the broader Spanish university population, encompassing undergraduate and postgraduate students, and (b) evaluate its psychometric properties (construct validity, convergent validity, reliability, and measurement invariance). Validating the instrument across educational levels will empirically justify renaming it the University Student Stressors Questionnaire (USSQ).
As far as convergent validity is concerned, following hypotheses were established:
Hypothesis 1.
The university stressors scores and the psychological distress scores will show a positive association.
Hypothesis 2.
The university stressors scores will show the strongest correlations with the overall psychological distress scores, followed by, in this order, the correlations with stress scores, with anxiety scores, and with depression scores.
Hypothesis 3.
The university stressors scores will show a negative correlation with the psychological wellbeing scores.
2. Materials and Methods
2.1. Participants
Of 5,083 initial participants from the Public University of Navarre (UPNA), 4,928 completed the questionnaire (~44% of the institution's population). Excluding three invalid demographic entries yielded a final sample of N = 4,925. The mean age was 20.5 years (SD = 3.51; median = 20; range: 16-65). Most participants reported female biological sex (n = 2,951; 59.9%) and identified as women (n = 2,946; 59.8%); 1,964 participants (39.9%) reported male biological sex and 1,955 (39.7%) identified as men. A small proportion selected “other” for sex (n = 10; 0.2%) or gender identity (n = 24; 0.5%). The sample comprised undergraduate (n = 4,374; 88.8%) and postgraduate students (n = 551; 11.2%). Faculty enrollment was distributed as follows: Human, Social, and Education Sciences (n = 1,244; 25.3%); Industrial, Computer, and Telecommunications Engineering (n = 1,174; 23.8%); Health Sciences (n = 785; 15.9%); Economics and Business Sciences (n = 696; 14.1%); Agronomic Engineering and Biosciences (n = 649; 13.2%); Legal Sciences (n = 348; 7.1%); and Doctoral School (n = 29; 0.6%).
2.2. Instruments
Undergraduates Stressors Questionnaire (USQ). Developed by Kamtsios and Karagiannopoulou (2015), the USQ assesses academic stressors in university students. It comprises 29 items across seven factors rated on a 4-point Likert scale. Original internal consistency was high (overall α = .90; subscales α = .61–.86).
Depression, Anxiety and Stress Scale (DASS-21). The DASS-21 (Lovibond & Lovibond, 1995a, 1995b; Spanish adaptation by Bados et al., 2005) measures past-week symptoms via 21 items across three subscales. Responses are scored on a 4-point Likert scale. The Spanish version demonstrates adequate internal consistency (α = .70–.84).
Ryff Scales of Psychological Well-Being (PWB). The PWB (Ryff, 1989; Spanish adaptation by Díaz et al., 2006) evaluates well-being through 29 items across six subscales. Items are rated on a 6-point Likert scale, with the Spanish adaptation showing adequate reliability (α = .70–.84).
2.3. Procedure
Data were collected between September 5 and October 28, 2025, as part of a broader mental health census. Undergraduate and postgraduate students accessed the 15–20 minute assessment battery (up to 12 questionnaires) via classroom-projected QR codes, while doctoral and international mobility students received email links. Hosted on Office365®, the survey was completed by 4,928 participants. All participants provided digital informed consent ensuring confidentiality. The study was approved by the Clinical Research Ethics Committee of Navarra (Protocol v.2_3sep2024; PIS and IC v.4_5sep2024) and is part of the research project “EVAPSI: Study and Assessment of University Psychological Health”.
With author permission, the USQ (Kamtsios & Karagiannopoulou, 2015) was adapted following the International Test Commission (2017) and Hernández et al. (2020) guidelines. Because the scale was developed in Greek but published in English, parallel forward translations into Spanish were conducted from English (two independent sources) and Greek (one native translator and one AI system; OpenAI, 2025). An expert panel (two psychology specialists and the English translators) synthesized a unified Spanish version using the Greek source to resolve discrepancies. Back-translations into Greek (one independent bilingual translator) and English (two blind bilingual translators) confirmed semantic equivalence with the original meaning and international literature. Finally, a pilot test (n = 20 students) verified item clarity and comprehensibility.
2.4. Data analysis
The original 29-item, seven-factor USQ model (Kamtsios & Karagiannopoulou, 2015) was initially evaluated via Confirmatory Factor Analysis (CFA). Goodness-of-fit was assessed using standard cutoffs: χ2/df ratio (χ2/df ≤ 2; Schermelleh-Engel et al., 2003) comparative fit index (CFI > .95), Tucker-Lewis index (TLI > .95), root-mean square error of approximation with its 90% confidence interval (RMSEA, excellent fit ≤ 0.05 and moderate fit ≤ 0.10; Hu & Bentler, 1999), standardized root-mean-square residual (SRMR < 0.08; Schreiber et al., 2006).
Measurement invariance was assessed by comparing the original Greek subsample (n = 473) with a size-matched subsample of Spanish participants (n = 473) recruited from the corresponding faculty. Although configural invariance was supported, threshold invariance was not achieved (p < .001). Item-level analyses revealed non-invariant thresholds for 14 of the 29 items—Items 1, 2, 5, 6, 8, 9, 15, 18, 19, 20, 22, 26, 27, and 28—indicating that participants in the Greek and Spanish samples did not use the response categories equivalently for a substantial proportion of the scale. Given the extent of the observed non-invariance, we proceeded to examine and develop an alternative factor structure for the Spanish version of the scale (Greiff & Iliescu, 2017).
The dataset was randomly halved. Subsample 1 (n = 2,464) was used for data-driven structure identification: an Exploratory Graph Analysis (EGA; Christensen & Golino, 2021) was conducted using the graphical LASSO with the walktrap community detection algorithm to estimate the optimal dimensionality of the USQ. In parallel, an exploratory factor analysis (EFA) was performed using principal axis factoring with Promax rotation. Subsample 2 (n = 2,464) was reserved for cross-validation, where a CFA was estimated for the EGA/EFA-derived structure and its fit was compared with that of the original seven-factor model.
Reliability was estimated using CFA-based ordinal alpha and categorical McDonald’s omega (Flora, 2020). Convergent validity was assessed via Spearman correlations, which were computed between the latent factor scores (η ̂_F1,η ̂_F2,⋯,η ̂_F7, estimated via Empirical Bayes Model and derived from the final CFA model) and the dimensions and total score from DASS-21 and PWB. These Spearman correlations were considered strong when higher than .70 and significant if their p-values were smaller than .01 (Evans, 1996).
Measurement invariance was evaluated across biological sex, gender identity, and study level. A conventional sequential invariance-testing framework was applied, whereby increasingly restrictive equality constraints were imposed across groups (Millsap & Yun-Tein, 2004). Configural invariance was examined first, followed by tests of threshold invariance and loading invariance, consistent with recommendations for ordered-categorical indicators (Liu et al., 2017; Wu & Estabrook, 2016). When full invariance was not supported, partial measurement invariance was explored by identifying non-invariant parameters and selectively relaxing equality constraints to obtain a substantively interpretable and statistically adequate model (Tse et al., 2024). For any comparison between fits, the previously mentioned fit indices were used, with the addition of the likelihood ratio test (LRT’s p-value >.05; Arango-Lasprilla et al., 2025). Analyses were conducted in R 4.1.3 (R Core Team, 2024).
3. Results
The CFA of the original 29-item, seven-factor model yielded mixed evidence of fit. Although the RMSEA indicated moderate fit (0.071; CI90%, 0.069-.072) and incremental and residual-based indices were within acceptable ranges (CFI=.974; TLI =.970; SRMR= 0.050), the χ² test was statistically significant (χ² = 9,082.07; df = 356; p < .001) and the χ²/df ratio was elevated (25.54). Given the magnitude of the χ² inflation, and the moderate RMSEA, alternative model specifications were subsequently examined.
To identify an improved-fitting specification, an EGA was conducted in subsample 1 to determine the most appropriate number of dimensions. The EGA consistently supported a 7-community solution (see Figure 1), with community stability indices in the acceptable range (≥.70-.76), indicating sufficient structural stability (Christensen & Golino, 2021). In parallel, an EFA specifying 7 factors showed that these factors accounted for 61% of the total variance. Additionally, the multiple R2 of scores with factors range from .83 to .95, showing that all seven factors are important due to the variance they explain. The new model moves item 9 from factor 2 (academic performance) to factor 3 (fear of failure), and has the benefit of simplifying the test by removing two items (21 and 25), which were included in the analysis but turned out to not be relevant in the model itself (did not have loadings >.4 on any of the factors).
Based on the EFA-derived solution, a CFA was fitted in subsample 2 to evaluate the revised measurement model. Overall fit was optimum, with fit indicated by the RMSEA (0.064; CI90%, 0.061-.067) and favorable incremental and residual-based indices (CFI= .981; TLI= .978; SRMR= 0.044). The χ² test remained statistically significant (χ² = 3,360.81; df = 303; p < .001), although the χ²/df ratio was substantially lower than for the original specification (11.09 vs 25.54). Standardized loadings 〖(λ〗_j) varied from .61 to .96, all p-values were < .001, and omega 〖(ω〗_u) values showed adequate reliability for all factors, ranging from .73 (factor 2) to .89 (factor 6).
Given that the correlations between our factors were generally low, ranging from .17 to .59, no higher order model was tested. Collectively, these results supported the adequacy of the revised model. In addition, model comparison indicated that the revised and original specifications differed significantly in fit (LRT’s p < 2.2 × 10⁻¹⁶), favoring the revised model (see Table 1).
Correlations between the USSQ latent factors 〖(η ̂〗_F1,η ̂_F2,⋯,η ̂_F7) and the DASS-21 scores were uniformly positive and small-to-moderate. Coefficients ranged from ρ= .204–.440 across the DASS-21 subscales and ρ = .239–.460 for the DASS-21 Total. The strongest and most consistent associations were observed for F3 (D = .395, A = .428, S = .440; Total = .460), followed by F1 (notably S = .403; Total = .401). The remaining factors (F2, F4–F7) showed weaker but still positive correlations (ρ ≈ .20–.31). With the PWB, these correlations are negative and small-to-moderate, ranging in strength from -.31 (between our second factor and environmental mastery) to -.03 (between the sixth factor of our scale and purpose in life) (see Table 2).
Relative to USSQ measure invariance, the results with the biological sex and gender identity variables were fairly similar. In both cases, the “Other” category was excluded, as its sample size was too small and would skew the results. Both configural levels were achieved, with adequate fit indices (see Table 3). The full threshold levels were not achieved, as they was significantly different (LRT’s p-value of .006 for biological sex and of .004 for gender identity), so two thresholds were freed in order to reach partial threshold invariance in both variables. The partial threshold and full loading levels were also not achieved (LRT’s p-value of .0002 for biological sex and of 4.39 x 10⁻⁶ for gender identity), so three loadings were freed in order to reach partial loading invariance in both cases.
In the measurement invariance analysis across study levels (undergraduate versus graduate students), configural invariance was established, yielding adequate fit indices. Full metric (loadings) and full scalar (thresholds) invariance were also supported, as the constrained models did not significantly degrade model fit compared to the baseline models (LRT’s p = .910 for loading and p= .764 for threshold invariance) and maintained adequate fit values (see Table 3). Based on this comprehensive structural support, this adapted version will hereafter be designated as the University Student Stressors Questionnaire (USSQ).
This study’s objective was to adapt the USQ into Spanish, and evaluate its psychometric properties, including its convergent validity, in a Spanish university student population. An optimized factorial model demonstrated robust construct validity, reliability, and convergent validity with the DASS-21 and PWB scales. Measurement invariance was established, reaching partial threshold and loading invariance for sex and gender, and full invariance across study levels (undergraduates and postgraduates).
Factor analyses (EFA, CFA) led to the removal of items 21 and 25 due to negligible loadings (< .40). Conceptually, it can be hypothesized that item 21 (“I work during the period of my studies”) diverges from Factor 5 (“finances”) because it describes an objective condition that does not necessarily imply a perceived threat. Similarly, item 25 (“I work with students that are non-cooperative”) lacks coherence with Factor 6 (“competition among students”), as a lack of cooperation reflects an individualistic climate rather than explicit academic competition (Deutsch, 1962; Johnson & Johnson, 1989). Furthermore, item 9 (“I think that I will not be able to meet the academic requirements to graduate”) was reassigned from Factor 2 (Academic performance) to Factor 3 (Fear of failure), where it demonstrated stronger correlations. From a psychological perspective, this realignment is consistent with the transactional theory of stress (Lazarus, 1991; Lazarus & Folkman, 1984). Item 9 captures a future-oriented threat appraisal, contrasting with the retrospective evaluations of the remaining Factor 2 items.
The removal of items 21 and 25 and the relocation of item 9 improve the psychometric properties reported in the original study (Kamtsios & Karagiannopoulou, 2015). Furthermore, our results demonstrate that the questionnaire -initially designed solely for undergraduate students- exhibits equivalent measurement properties among postgraduate populations, justifying its renaming to the University Student Stressors Questionnaire (USSQ).
Regarding convergent validity, the USSQ exhibited positive associations with indicators of psychological distress (DASS-21) and negative associations with dimensions of psychological well-being (PWB), aligning with our hypothesis and with extensive literature (Andargeery, 2024; Haruna et al., 2025; Karki et al., 2022; Li et al., 2022; Luo et al., 2025; Mirza et al., 2021; Ramesh et al., 2024; Vinet et al., 2022). However, these associations were more moderate than typically reported. This divergence likely stems from the fact that other academic stress scales often conflate stressors with emotional symptoms, inherently overlapping with the construct of psychological distress. Conversely, by strictly focusing on academic stressors rather than the symptoms they generate, the moderate correlations found in our study reinforce the conceptual boundary between these constructs, thereby providing evidence of discriminant validity. Furthermore, the multidimensional structure of the scale may also account for the magnitude of the observed correlations. Rather than reflecting a single global dimension of academic stress, the instrument comprises seven distinct factors, each capturing a specific facet of the construct. Consequently, associations with external measures are expected to be more nuanced, variable, or selective, depending on the degree of conceptual correspondence of each specific dimension.
In alignment with the expected pattern, all seven USSQ factors correlated significantly and positively with the DASS-21 scales, confirming the first hypothesis. The second hypothesis was also confirmed: the strongest associations were observed with the DASS-21 total score—a finding consistent with research utilizing alternative stressor questionnaires (Luo et al., 2025; Ramesh et al., 2024); among the specific subscales, correlations followed a descending order of magnitude from stress to anxiety, with the weakest associations found with the depression subscale. The only exception to this pattern was Factor 2 (Academic performance), which presented its strongest correlation with the DASS-21 depression subscale. This finding is theoretically congruent; while the anticipation of tasks or exams predominantly elicits anxiety and tension, sustained worry regarding academic performance -or the perception of failing to meet required standards- is more closely linked to feelings of failure, diminished self-efficacy, and hopelessness, which are core features of depressive symptomatology (Beck, 1967).
Finally, all USSQ factors were negatively associated with Ryff's Psychological Well-Being scale, in line with the third hypothesis. This inverse relationship is in accordance with existing literature documenting the detrimental impact of academic stress on student well-being (Abdul Aziz et al., 2024; Delgado-Tenorio et al., 2021; Jabin, 2025; Ofori et al., 2018).
Our study presents several notable strengths. Primary among these is the large, census-based sample, which provides comprehensive representation of students across all degree programs and academic years at the university. Furthermore, unlike the original validation (Kamtsios & Karagiannopoulou, 2015), which focused solely on undergraduates, the current study expands the instrument's scope by including postgraduate students, for whom the scale yielded equally robust psychometric properties
Several limitations should be acknowledged. First, data collection occurred via in-person classroom visits, inherently excluding students who were absent on those days. This may introduce a degree of selection bias, as regular attendees might perceive university stressors differently than their frequently absent peers. Second, while the substantial sample size partially mitigates concerns regarding representativeness, the generalizability of our findings to students at other Spanish universities remains to be established. Third, although the present study centers on traditional academic stressors that have consistently dominated the literature, future research must also address emerging sources of strain. These include digital stress (Chaouali et al., 2025), fear of missing out (FoMO), social media fatigue (Zhan et al., 2025), and poor sleep quality, all of which are strongly linked to elevated anxiety and depression. Furthermore, successive crises in the aftermath of COVID-19 have increased loneliness (Pérez-Jorge et al., 2025) and identity-related challenges (Brata et al., 2025). Contemporary students are required to shape their identities within an environment characterized by fluidity and uncertainty, a context that heavily amplifies psychological strain. Finally, it is noteworthy that these emerging variables do not operate in isolation; rather, they interact dynamically with traditional academic demands to form a complex, multilayered network of stress.
This study equips the scientific community with a robust psychometric tool to examine the perception of academic stressors among both undergraduate and postgraduate students. To streamline the scoring process and mitigate potential manual calculation errors, an open-access web application was developed using R Shiny, allowing researchers and practitioners to simply input item responses to generate results. This tool is freely available to all users at https://diegorivera.shinyapps.io/calculator_ussq/. Ultimately, it is anticipated that the accessibility of the USSQ will foster international research, yielding data that elucidate the similarities and differences in perceived university stressors across diverse cultural contexts and higher education systems.
Factor 3 ('Fear of failure') accounted for the largest proportion of variance (.12) and exhibited the strongest positive association with psychological distress (DASS-21) alongside the strongest negative association with well-being (PWB). Specifically, its constituent items encompass anxiety and worry regarding academic performance, conceptually positioning it closer to psychological distress and suggesting it may constitute the core of academic stress within our student sample. These results are consistent with contemporary evidence indicating that worry over evaluations, exams, and beliefs about one's capacity to meet academic demands represent primary sources of stress for university students (Rastogi et al., 2025; Ruiz-Camacho & Gozalo, 2025). This suggests that preventive efforts should target this specific domain through broad educational measures, targeted group interventions, and, when clinically indicated, individualized psychological support.
Our findings highlight several promising avenues for future research. First, subsequent studies should investigate variations in perceived university stressors across diverse academic disciplines. Particular focus is warranted on health sciences programs, which literature consistently identifies as highly stressful environments for students (Chen et al., 2020; Ruiz-Robledillo et al., 2022). Second, longitudinal designs tracking student cohorts from their first year (T1) to their final year (T2) would be highly valuable for analyzing developmental trajectories of perceived academic stressors. Furthermore, such designs would enable researchers to evaluate the predictive validity of the USSQ—specifically, whether stressor dimensions measured at T1 forecast mental health outcomes at T2—as well as to explore the complex mediators and moderators underlying these effects.
5. Conclusions
This study provides the first comprehensive adaptation and psychometric validation of the University Student Stressors Questionnaire (USSQ) in a large Spanish university population. By optimizing the scale into a robust 27-item, seven-factor structure, the USSQ clearly isolates academic stressors from emotional symptoms, demonstrating sound construct validity, high internal consistency, and full measurement invariance across both undergraduate and postgraduate educational levels. Notably, Fear of failure emerges as the most salient academic stressor and the strongest correlate of psychological distress.
From a practical and applied standpoint, the USSQ equips university mental health services, student guidance units, and academic policymakers with a precise instrument to monitor institutional well-being and identify students with high levels of distress. Furthermore, the availability of an open-access web application allows educators and clinicians to automate scoring, facilitating early risk detection and the design of targeted preventive interventions to foster student resilience.
Author Contributions
Conceptualization, M.Ber., M.Bey. and D.R.; methodology, M.Ber., M.Bey. and D.R.; formal analysis, S.Y.-L. and D.R.; investigation, M.Ber., E.E. and M.Bey.; data curation, E.E.; writing—original draft preparation, M.Ber., S.Y.-L., E.E., M.Bey. and D.R.; writing—review and editing, S.K. and E.K. All authors have read and agreed to the published version of the manuscript.
Funding
This study is part of the EVAPSI research project, financed by the Health Department of the Government of Navarra (Spain) (Resolution 1068/2024, Project 13).
Institutional Review Board Statement
The study was conducted in accordance with the Declaration of Helsinki, and approved by the Clinical Research Ethics Committee of Navarra (Protocol v.2_3sep2024; PIS and IC v.4_5sep2024) for the project “EVAPSI: Study and Assessment of University Psychological Health”.
Informed Consent Statement
Digital informed consent was obtained from all subjects involved in the study.
Data Availability Statement
The datasets generated and analyzed during the current study are openly available in the Zenodo repository at https://zenodo.org/records/20529873 (DOI: 10.5281/zenodo.20529873). The analysis scripts and reproducible materials are available in the GitHub repository at https://github.com/diegoriveraps/evapsi_upna/tree/main/manuscript_1_stress
Acknowledgments
The authors would like to thank Elsa Casanova, Poppie Raphaelaki, Esther Landa-Torre and Rubén Valtierra for their valuable collaboration in the back-translation process of the instrument.
Conflicts of Interest
The authors declare no conflicts of interest.
Abbreviations
The following abbreviations are used in this manuscript:
| USQ | Undergraduates Stressors Questionnaire |
| USSQ | University Student Stressors Questionnaire |
| DASS-21 | Depression, Anxiety and Stress Scale-21 |
| PWB | Ryff Scales of Psychological Well-Being |
References
- Abdul Aziz, A. R.; Hasbullah, N. I.; Shafie, A. A.-H. Academic stress and psychological wellbeing among university students. Int. J. Educ. Psychol. Couns. 2024, 9, 212–222. [Google Scholar] [CrossRef]
- Andargeery, S. Y. The perception and association between depression and academic stress among female undergraduate nursing students: A cross-sectional study. Front. Public Health 2024, 12, 1414469. [Google Scholar] [CrossRef] [PubMed]
- Arango-Lasprilla, J. C.; Zeldovich, M.; Christ, B. R.; Ramos-Usuga, D.; von Steinbuechel, N.; Perrin, P. B.; Rivera, D. Longitudinal measurement invariance of the Patient Health Questionnaire-9 across racial/ethnic groups: Results from the traumatic brain injury model system study. Rehabil. Psychol. 2025, 70, 26–35. [Google Scholar] [CrossRef] [PubMed]
- Brata, W. W. W.; Susanto, H.; Zubaidah, S. Theoretical underpinnings and future research on academic stress in biological and educational perspectives. Humanit. Soc. Sci. Commun. 2025, 12, 146. [Google Scholar] [CrossRef]
- Chaouali, W.; Nasr, H. E.; Woodside, A. G.; Khalil, A.; Ben Saad, S. Social media fatigue among university students: A configural modeling of stressors and distractions. Mark. Intell. Plan. 2025, 44, 166–188. [Google Scholar] [CrossRef]
- Chen, Y.; Liu, X.; Yan, N.; Jia, W.; Fan, Y.; Yan, H.; Ma, L.; Ma, L. Higher academic stress was associated with increased risk of overweight and obesity among college students in China. Int. J. Environ. Res. Public Health 2020, 17, 5559. [Google Scholar] [CrossRef] [PubMed]
- Christensen, A. P.; Golino, H. Estimating the stability of psychological dimensions via bootstrap exploratory graph analysis: A Monte Carlo simulation and tutorial. Psych 2021, 3, 479–500. [Google Scholar] [CrossRef]
- Delgado-Tenorio, A. L.; Oyanguren-Casas, N. A.; Reyes-González, A. A. I.; Zegarra, Á. Ch.; Cueva, M. E. El rol moderador de la procrastinación sobre la relación entre el estrés académico y bienestar psicológico en estudiantes de pregrado. Propós. Represent. 2021, 9. [Google Scholar] [CrossRef]
- Deutsch, M. Cooperation and trust: Some theoretical notes. In Nebraska Symposium on Motivation; Jones, E.M.R., Ed.; University of Nebraska Press, 1962; pp. 275–320. [Google Scholar]
- Evans, J. D. Straightforward statistics for the behavioral sciences; Thomson Brooks/Cole Publishing Co., 1996. [Google Scholar]
- Greiff, S.; Iliescu, D. A Test Is Much More Than Just the Test Itself: Some Thoughts on Adaptation and EquivalenceA Test Is Much More Than Just the Test Itself: Some Thoughts on Adaptation and Equivalence; Hogrefe Publishing, 2017; Número 3; pp. 145–148. [Google Scholar] [CrossRef]
- Haruna, U.; Mohammed, A.-R.; Braimah, M. Understanding the burden of depression, anxiety and stress among first-year undergraduate students. BMC Psychiatry 2025, 25, 632. [Google Scholar] [CrossRef] [PubMed]
- Hu, L.; Bentler, P. M. Cutoff criteria for fit indexes in covariance structure analysis: Conventional criteria versus new alternatives. Struct. Equ. Model. A Multidiscip. J. 1999, 6, 1–55. [Google Scholar] [CrossRef]
- Jabin, S. The impact of Open and Distance Learning (ODL) on students’ psychological well-being in Bangladesh. Health Sci. Rep. 2025, 8, e70673. [Google Scholar] [CrossRef] [PubMed]
- Johnson, D. W.; Johnson, R. T. Cooperation and competition: Theory and research; Interaction Book Co., 1989. [Google Scholar]
- Kamtsios, S.; Karagiannopoulou, E. Exploring relationships between academic hardiness, academic stressors and achievement in university undergraduates. J. Appl. Educ. Policy Res. 2015, 1, 53–73. [Google Scholar] [CrossRef]
- Karki, A.; Thapa, B.; Pradhan, P. M. S.; Basel, P. Depression, anxiety and stress among high school students: A cross-sectional study in an urban municipality of Kathmandu, Nepal. PLoS Glob. Public Health 2022, 2, e0000516. [Google Scholar] [CrossRef] [PubMed]
- Lazarus, R. S. Emotion and adaptation; Oxford University Press, 1991. [Google Scholar]
- Lazarus, R. S.; Folkman, S. Stress, appraisal, and coping; Springer Publishing Company, 1984. [Google Scholar]
- Li, P.; Yang, J.; Zhou, Z.; Zhao, Z.; Liu, T. The influence of college students’ academic stressors on mental health during COVID-19: The mediating effect of social support, social well-being, and self-identity. Front. Public Health 2022, 10, 917581. [Google Scholar] [CrossRef] [PubMed]
- Liu, Y.; Millsap, R. E.; West, S. G.; Tein, J.-Y.; Tanaka, R.; Grimm, K. J. Testing measurement invariance in longitudinal data with ordered-categorical measures. Psychol. Methods 2017, 22, 486–506. [Google Scholar] [CrossRef] [PubMed]
- Luo, J.; Xian, G.; Yao, C.; Jin, J.; Zhao, J.; Song, X.; Gong, J. Further validating of the Depression Anxiety Stress Scales-21 (DASS-21) in Chinese adolescents: Factor structure and measurement invariance. BMC Public Health 2025, 25, 2073. [Google Scholar] [CrossRef] [PubMed]
- Millsap, R. E.; Yun-Tein, J. Assessing factorial invariance in ordered-categorical measures. Multivar. Behav. Res. 2004, 39, 479–515. [Google Scholar] [CrossRef] [PubMed]
- Mirza, A. A.; Baarimah, H.; Baig, M.; Mirza, A. A.; Halawani, M. A.; Beyari, G. M.; AlRaddadi, K. S.; Alreefi, M. Academic and non-academic life stressors and their impact on psychological psychological wellbeing of medical students. AIMS Public Health 2021, 8, 563–580. [Google Scholar] [CrossRef] [PubMed]
- Ofori, I. N.; Addai, P.; Avor, J.; Quaye, M. G. Too much academic stress: Implications on interpersonal relationships and psychological well-being among final year University of Ghana students. Asian J. Educ. Soc. Stud. 2018, 2, 1–7. [Google Scholar] [CrossRef]
- Pérez-Jorge, D.; Boutaba-Alehyan, M.; González-Contreras, A. I.; Pérez-Pérez, I. Examining the effects of academic stress on student well-being in higher education. Humanit. Soc. Sci. Commun. 2025, 12, 449. [Google Scholar] [CrossRef]
- R Core Team. R: A Language and Environment for Statistical Computing. R Foundation for Statistical Computing. 2024. Available online: https://www.R-project.org/.
- Ramesh, A.; Sureshramana Mayya, S.; Martis, M.; Mayya, A. Validation and reliability of the revised Manipal Inventory of Academic Stress (MIAS) among higher secondary students in Karnataka, India. Pertanika J. Soc. Sci. Humanit. 2024, 32, 1281–1300. [Google Scholar] [CrossRef]
- Rastogi, S.; Gupta, S.; Deepak, D.; Mishra, B. N.; Gore, R.; Singh, V. A systematic literature review on anxiety among undergraduate students: Causes and coping strategies. Ann. Neurosci. 2025, 09727531251366078. [Google Scholar] [CrossRef] [PubMed]
- Ruiz-Camacho, C.; Gozalo, M. Predicting university students’ stress responses: The role of academic stressors and sociodemographic variables. Eur. J. Investig. Health Psychol. Educ. 2025, 15, 163. [Google Scholar] [CrossRef] [PubMed]
- Ruiz-Robledillo, N.; Vela-Bermejo, J.; Clement-Carbonell, V.; Ferrer-Cascales, R.; Alcocer-Bruno, C.; Albaladejo-Blázquez, N. Impact of COVID-19 pandemic on academic stress and perceived classroom climate in Spanish university students. Int. J. Environ. Res. Public Health 2022, 19, 4398. [Google Scholar] [CrossRef] [PubMed]
- Schermelleh-Engel, K.; Moosbrugger, H.; Müller, H. Evaluating the fit of structural equation models: Tests of significance and descriptive goodness-of-fit measures. Methods Psychol. Res. Online 2003, 8, 23–74. [Google Scholar]
- Schreiber, J. B.; Nora, A.; Stage, F. K.; Barlow, E. A.; King, J. Reporting structural equation modeling and confirmatory factor analysis results: A review. J. Educ. Res. 2006, 99, 323–338. [Google Scholar] [CrossRef]
- Tse, W. W.-Y.; Lai, M. H. C.; Zhang, Y. Does strict invariance matter? Valid group mean comparisons with ordered-categorical items. Behav. Res. Methods 2024, 56, 3117–3139. [Google Scholar] [CrossRef] [PubMed]
- Vinet, E. V.; Trizano-Hermosilla, Í.; L. Saiz, J.; Cova, F. Desarrollo del inventario de desajustes psicológicos para estudiantes universitarios chilenos. Revista Iberoamericana de Diagnóstico y Evaluación – e Avaliação Psicológica 2022, 64, 93–108. [Google Scholar] [CrossRef]
- Wu, H.; Estabrook, R. Identification of confirmatory factor analysis models of different levels of invariance for ordered categorical outcomes. Psychometrika 2016, 81, 1014–1045. [Google Scholar] [CrossRef] [PubMed]
- Zhan, Y.; Luo, L.; Hu, X. Digital stress and problematic social media use among college students: Exploring dual emotional pathways and the moderating role of cognitive reappraisal. BMC Psychol. 2025, 13, 1311. [Google Scholar] [CrossRef] [PubMed]
Figure 1.
Exploratory Graph Analysis results: showing factor hubs.
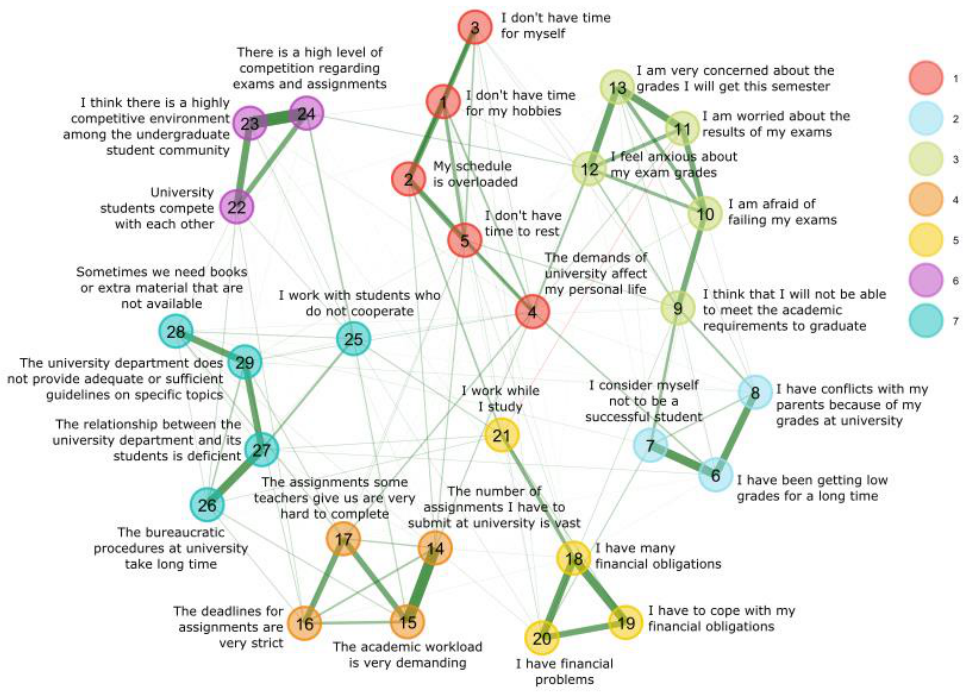

Table 1.
Construct validity, and reliability estimation.
| Factor | Items | Standardized loadings (λj) | ω value |
|---|---|---|---|
| F1 | 1. I don't have time for my hobbies [No tengo tiempo para mis aficiones] | .742 | .835 |
| 2. My schedule is overloaded [Mi agenda diaria está sobrecargada] | .784 | ||
| 3. I don't have time for myself [No tengo tiempo suficiente para divertirme] | .664 | ||
| 4. The demands of university affect my personal life [Las exigencias de la universidad afectan a mi vida personal] | .786 | ||
| 5. I don't have time to rest [No tengo tiempo para descansar] | .805 | ||
| F2 | 6. I have been getting low grades for a long time [Llevo mucho tiempo sacando notas bajas] | .820 | .732 |
| 7. I consider myself not to be a successful student [Considero que no soy un/a estudiante exitoso/a] | .770 | ||
| 8. I have conflicts with my parents because of my grades at university [Tengo conflictos con mis padres debido a mis notas en la universidad] | .664 | ||
| F3 | 9† I think that I will not be able to meet the academic requirements to graduate [Pienso que no voy a ser capaz de cumplir con las exigencias académicas para graduarme] | .664 | .870 |
| 10. I am afraid of failing my exams [Tengo miedo de suspender los exámenes] | .823 | ||
| 11. I am worried about the results of my exams [Me preocupan los resultados de mis exámenes] | .811 | ||
| 12. I feel anxious about my exam grades [Siento ansiedad ante las notas de mis exámenes] | .858 | ||
| 13. I am very concerned about the grades I will get this semester [Me preocupan mucho las notas que voy a sacar este semestre] | .868 | ||
| F4 | 14. The number of assignments we have to submit at university is vast [La cantidad de trabajos que tenemos que entregar en la universidad es muy elevada] | .843 | .844 |
| 15. The academic workload is very demanding [Los trabajos que tenemos que entregar suelen ser extensos] | .873 | ||
| 16. The deadlines for assignments are very strict [Las fechas de entrega de los trabajos son muy estrictas] | .721 | ||
| 17. The assignments some teachers give us are very hard to complete [Los trabajos que nos piden algunos docentes son difíciles de hacer] | .793 | ||
| F5 | 18. I have many financial obligations [Tengo muchas obligaciones económicas] | .913 | .802 |
| 19. I have to cope with my financial obligations [Tengo que gestionar eficazmente mi economía] | .746 | ||
| 20. I have financial problems [Tengo dificultades económicas] | .807 | ||
| F6 | 22. University students compete with each other [El estudiantado universitario compite entre sí] | .847 | .892 |
| 23. I think there is a highly competitive environment among the undergraduate student community [Percibo que en la universidad hay un ambiente académico competitivo] | .955 | ||
| 24. There is a high level of competition regarding exams and assignments [Hay una gran competencia por las notas de los exámenes] | .917 | ||
| F7 | 26. The bureaucratic procedures at university take a long time [Los trámites burocráticos en la universidad llevan mucho tiempo] | .695 | .759 |
| 27. The relationship between the university department and its students is deficient [La relación entre la administración de la universidad y los estudiantes es deficiente] | .760 | ||
| 28. Sometimes we need books or extra material that are not available [A veces necesitamos libros o material extra que no están disponibles] | .617 | ||
| 29. The university department does not provide adequate or sufficient guidelines on specific topics [La universidad no proporciona directrices claras sobre determinados temas] | .762 |
Note: p-values for all standardized loadings were <0.001. Empty cells in the item columns denote an item not being part of that factor within that model. † Item 9 was moved from F2 to F3 in the proposed model; F1 = Lack of leisure time [falta de tiempo libre]; F2 = Academic performance [rendimiento académico]; F3 = Fear of failure [miedo al fracaso académico]; F4 = Academic overload [sobrecarga académica]; F5 = Finances [aspectos económicos]; F6 = Competition between students [competencia entre estudiantes]; F7 = Relationships with university faculty [relaciones con la universidad].
Table 2.
Correlations with DASS-21 and Ryff PWB scores.
| USSQ factors* | DASS-21† | DASS-21 Total | PWB+ | |||||||
|---|---|---|---|---|---|---|---|---|---|---|
| D | A | S | Sel | Pos | Aut | Env | Pur | Per | ||
| F1 | .342 | .347 | .403 | .401 | -.223 | -.199 | -.136 | -.250 | -.095 | -.143 |
| F2 | .302 | .278 | .262 | .300 | -.286 | -.189 | -.160 | -.310 | -.217 | -.300 |
| F3 | .395 | .428 | .440 | .460 | -.296 | -.188 | -.247 | -.300 | -.116 | -.213 |
| F4 | .206 | .238 | .249 | .252 | -.133 | -.117 | -.122 | -.167 | -.060 | -.090 |
| F5 | .280 | .281 | .299 | .314 | -.187 | -.202 | -.088 | -.213 | -.086 | -.105 |
| F6 | .221 | .241 | .267 | .267 | -.112 | -.123 | -.115 | -.137 | -.031 | -.039 |
| F7 | .204 | .217 | .236 | .239 | -.138 | -.116 | -.082 | -.174 | -.084 | -.119 |
Note: p-values for all correlations were <0.001. * F1 (Lack of leisure time), F2 (Academic performance), F3 (Fear of failure), F4 (Academic overload), F5 (Finances), F6 (Competition between students), F7 (Relationships with university faculty). † D (Depression), A (Anxiety), S (Stress). + Sel (Self-acceptance), Pos (Positive relations with others), Aut (Autonomy), Env (Environmental mastery), Pur (Purpose in life), Per (Personal growth).
Table 3.
Measurement Invariance.
| Variable | Invariance level | χ2 | df | p | χ2/df | RMSEA | [IC90%] | CFI | TLI | SRMR | p-value |
|---|---|---|---|---|---|---|---|---|---|---|---|
| Biological sex | 1. Configural | 4976.648 | 606 | <0.001 | 8.21 | 0.054 | [0.053, 0.056] | 0.967 | 0.961 | 0.045 | |
| 2. Threshold | 5065.908 | 633 | <0.001 | 8.00 | 0.053 | [0.052, 0.055] | 0.966 | 0.962 | 0.045 | 0.006 | |
| with 1 freed | 5058.541 | 632 | <0.001 | 8.00 | 0.053 | [0.052, 0.055] | 0.966 | 0.962 | 0.045 | 0.036 | |
| with 2 freed | 5051.409 | 631 | <0.001 | 8.01 | 0.053 | [0.052, 0.055] | 0.966 | 0.962 | 0.045 | 0.184 | |
| 3. Loading | 4983.516 | 651 | <0.001 | 7.66 | 0.052 | [0.051, 0.053] | 0.967 | 0.964 | 0.046 | 0.0002 | |
| with 1 freed | 4974.831 | 650 | <0.001 | 7.65 | 0.052 | [0.051, 0.053] | 0.967 | 0.964 | 0.046 | 0.005 | |
| with 2 freed | 4972.066 | 649 | <0.001 | 7.66 | 0.052 | [0.051, 0.053] | 0.967 | 0.964 | 0.046 | 0.081 | |
| with 3 freed | 4967.130 | 648 | <0.001 | 7.67 | 0.052 | [0.051, 0.053] | 0.967 | 0.964 | 0.046 | 0.190 | |
| Gender identity | 1. Configural | 4996.927 | 606 | <0.001 | 8.25 | 0.054 | [0.053, 0.056] | 0.966 | 0.961 | 0.046 | |
| 2. Threshold | 5087.111 | 633 | <0.001 | 8.04 | 0.054 | [0.052, 0.055] | 0.966 | 0.962 | 0.046 | 0.004 | |
| with 1 freed | 5079.568 | 632 | <0.001 | 8.04 | 0.054 | [0.052, 0.055] | 0.966 | 0.962 | 0.046 | 0.028 | |
| with 2 freed | 5072.075 | 631 | <0.001 | 8.04 | 0.054 | [0.052, 0.055] | 0.966 | 0.962 | 0.046 | 0.170 | |
| 3. Loading | 5012.755 | 651 | <0.001 | 7.70 | 0.052 | [0.051, 0.054] | 0.967 | 0.964 | 0.046 | 4.39x10⁻⁶ | |
| with 1 freed | 4998.293 | 650 | <0.001 | 7.69 | 0.052 | [0.051, 0.054] | 0.967 | 0.964 | 0.046 | 0.0006 | |
| with 2 freed | 4990.454 | 649 | <0.001 | 7.69 | 0.052 | [0.051, 0.054] | 0.967 | 0.964 | 0.046 | 0.009 | |
| with 3 freed | 4986.714 | 648 | <0.001 | 7.70 | 0.052 | [0.051, 0.054] | 0.967 | 0.964 | 0.046 | 0.161 | |
| Study level | 1. Configural | 4343.305 | 606 | <0.001 | 7.17 | 0.050 | [0.049, 0.051] | 0.970 | 0.965 | 0.043 | |
| 2. Threshold | 4396.001 | 633 | <0.001 | 6.94 | 0.049 | [0.048, 0.051] | 0.970 | 0.967 | 0.043 | 0.764 | |
| 3. Loading | 4311.575 | 653 | <0.001 | 6.60 | 0.048 | [0.046, 0.049] | 0.971 | 0.969 | 0.043 | 0.910 |
Note: χ2 = chi-square value; df = degrees of freedom; p = p-value; χ2/df = chi-square and degrees of freedom ratio; CFI: comparative fit index; TLI = Tucker-Lewis index; RMSEA = root-mean-square error of approximation, with its 90% confidence interval; SRMS = standardized root-mean-square residual; p-value = likelihood ratio test’s p-value4. Discussion.
Disclaimer/Publisher’s Note: The statements, opinions and data contained in all publications are solely those of the individual author(s) and contributor(s) and not of MDPI and/or the editor(s). MDPI and/or the editor(s) disclaim responsibility for any injury to people or property resulting from any ideas, methods, instructions or products referred to in the content. |
© 2026 by the authors. Licensee MDPI, Basel, Switzerland. This article is an open access article distributed under the terms and conditions of the Creative Commons Attribution (CC BY) license (http://creativecommons.org/licenses/by/4.0/).
Copyright: This open access article is published under a Creative Commons CC BY 4.0 license, which permit the free download, distribution, and reuse, provided that the author and preprint are cited in any reuse.