

Submitted:
07 October 2026
Posted:
09 October 2026
You are already at the latest version
Abstract
Background/Objectives: Sodium-glucose cotransporter 2 (SGLT2) inhibitors share a renal mechanism but differ in SGLT1 selectivity, off-target activity and licensed indications. We compared exposure-adjusted reporting of suspected adverse reactions for canagliflozin, dapagliflozin, empagliflozin and ertugliflozin and examined whether differences between them are consistent with molecule-specific pharmacology. Methods: UK Yellow Card reaction entries for 2021–2025 were related to English NHS general practice and estimated hospital prescribed items for the same 60 months. Rates were calculated with exact Poisson intervals, reporting rate ratios (RRRs) versus dapagliflozin with Poisson regression and Holm adjustment, and annual trends with quasi-Poisson regression; within-class disproportionality was also calculated without a prescribing denominator. Results: The analysis included 8789 reaction entries and 52.19 million items. Total reporting rates were 125.47, 188.83, 143.53 and 213.64 per million items, respectively. Ketoacidosis and ketosis reporting was higher for canagliflozin (RRR 2.45, 95% CI 2.02–2.95) and empagliflozin (1.93, 1.69–2.19), as was euglycaemic ketoacidosis reporting, and peripheral tissue injury reporting was higher for canagliflozin (2.80, 1.63–4.64). Amputation reporting was higher for canagliflozin (3.69, 1.14–10.61) but not after adjustment, and 2.68 for lower-limb terms. Within the class, the entry-level ketoacidosis reporting odds ratio for canagliflozin was 3.10 (2.53–3.80). Ketoacidosis reporting declined by 32.0% per year for dapagliflozin and by 24.4% for empagliflozin. Conclusions: Higher ketoacidosis and peripheral tissue injury reporting for canagliflozin is compatible with its lower SGLT2 selectivity, but equally with population or reporting differences, which these data cannot separate. Empagliflozin does not fit a selectivity explanation. These are reporting rates, not incidence estimates.
Keywords:
sodium-glucose cotransporter 2 inhibitors
; pharmacovigilance
; Yellow Card
; spontaneous reporting
; diabetic ketoacidosis
; amputation
; canagliflozin
; SGLT1 selectivity
; indication channelling
; prescribing data
1. Introduction
Sodium-glucose cotransporter 2 (SGLT2) inhibitors were introduced as glucose-lowering medicines for type 2 diabetes and have become established treatments for cardiovascular and kidney protection. Cardiovascular outcome trials of empagliflozin, canagliflozin, dapagliflozin and ertugliflozin in type 2 diabetes [1,2,3,4] were followed by trials showing kidney benefits in diabetic kidney disease [5] and benefits in heart failure and chronic kidney disease in people with or without diabetes [6,7,8]. Collaborative meta-analyses have confirmed kidney benefits irrespective of diabetes status and across levels of kidney function and albuminuria [9,10]. In the United Kingdom (UK), dapagliflozin and empagliflozin are now licensed for type 2 diabetes, heart failure and chronic kidney disease, but canagliflozin and ertugliflozin are licensed only for type 2 diabetes [11,12,13,14]. The populations treated with individual SGLT2 inhibitors have therefore diverged.
SGLT2 inhibitors reduce glucose reabsorption in the proximal renal tubule, causing glycosuria and osmotic diuresis [11]. In human mechanistic studies, dapagliflozin increased the glucagon-to-insulin ratio and endogenous glucose production [15], and empagliflozin increased ketone production [16]. Haemodynamic, vascular and metabolic effects are thought to contribute to cardiorenal protection, although the precise mechanisms remain unresolved [17]. The same primary mechanism underlies the principal adverse reactions of the class. UK regulatory communications have warned about diabetic ketoacidosis, including presentations with only moderately elevated blood glucose [18], and Fournier’s gangrene [19]; genital infections are increased more than threefold in randomised trials [20]; and osmotic diuresis can cause volume depletion [11]. An increased risk of lower-limb amputation, mainly of the toes, was observed with canagliflozin in the CANVAS Program but not in CREDENCE, and regulators extended precautionary advice to the whole class because data for the other SGLT2 inhibitors were limited [2,5,21,22].
Despite a shared target, SGLT2 inhibitors differ in properties that could modify their adverse reaction profiles. Canagliflozin has the lowest reported selectivity for SGLT2 over SGLT1, with half-maximal inhibitory concentrations (IC50) of 2.7 and 710 nM, respectively, compared with 1.2 and 1400 nM for dapagliflozin, 3.1 and 8300 nM for empagliflozin and 0.87 and 1960 nM for ertugliflozin [23]. Canagliflozin is a low-potency inhibitor of SGLT1 [11], and in healthy volunteers a single 300 mg dose delayed intestinal glucose absorption, consistent with transient intestinal SGLT1 inhibition [24]. In experimental studies, canagliflozin activated AMP-activated protein kinase (AMPK) at concentrations measured in human plasma by inhibiting mitochondrial complex I [25]. A Publisher’s Note concerning that article has since been published [26]; we therefore cite it only for the findings with canagliflozin and do not infer from it that other SGLT2 inhibitors lack this effect. Canagliflozin also inhibited human endothelial cell proliferation at clinically relevant concentrations, unlike dapagliflozin and empagliflozin [27]. Whether such properties translate into clinically different adverse reaction profiles is uncertain.
Spontaneous reporting complements clinical trials by capturing suspected adverse reactions in routine care. In the UK, the Medicines and Healthcare products Regulatory Agency (MHRA) publishes Yellow Card data, including reports from healthcare professionals, patients and pharmaceutical companies, as interactive Drug Analysis Profiles [28]. A report does not establish causality, one report may contain several reaction terms, and the number of reports cannot be used to determine the probability of a patient experiencing an adverse reaction [29]. Reporting is also incomplete, with a median under-reporting rate of 94% in a systematic review [30], and it can be stimulated by safety alerts [31]. Relating reports to prescribing volume partly accounts for differences in exposure. Using this approach, Matharu et al. related UK Yellow Card reports for 2013–2019 to English primary care prescriptions and proposed that differences in SGLT2 selectivity might contribute to differences in suspected adverse reaction rates [23]. Mokbel et al. applied a similar framework across 137 medicines [32], and we recently applied it to glucagon-like peptide-1 (GLP-1)-based therapies [33].
The use of SGLT2 inhibitors in the UK has since changed substantially. The National Institute for Health and Care Excellence (NICE) recommended dapagliflozin for heart failure with reduced ejection fraction in February 2021 [34]; dapagliflozin and empagliflozin are now licensed for heart failure and chronic kidney disease [12,13]; and dapagliflozin 5 mg ceased to be authorised for type 1 diabetes from 25 October 2021 [35]. To our knowledge, exposure-adjusted reporting for individual SGLT2 inhibitors has not been interpreted in relation to molecule-specific pharmacology since these changes. We therefore aimed (i) to estimate and compare exposure-adjusted Yellow Card reporting rates for canagliflozin, dapagliflozin, empagliflozin and ertugliflozin, overall and for adverse reactions mechanistically linked to SGLT2 inhibition, using English National Health Service (NHS) prescribing as the exposure denominator; and (ii) to assess whether between-medicine differences are consistent with molecule-specific pharmacology (SGLT2/SGLT1 selectivity, glycosuric effect and off-target activity) or are better explained by differences in licensed indications, treated populations and reporting behaviour.
2. Materials and Methods
2.1. Study Design and Methodological Foundations
We conducted a retrospective, aggregate pharmacovigilance study of canagliflozin, dapagliflozin, empagliflozin and ertugliflozin over the five calendar years from 1 January 2021 to 31 December 2025. The study combined UK Yellow Card reaction-entry counts with English NHS prescribing volumes for the corresponding 60 months. The estimand was the number of recorded suspected reaction entries per million captured prescribed items, together with relative differences in these reporting rates and in the composition of recorded reactions. It was not the incidence of adverse events in treated patients, an absolute clinical risk or a causal comparison of medicine safety. No person-time denominator or patient-level linkage was available.
The exposure-adjusted reporting framework was informed by the earlier SGLT2 analysis of Matharu et al. [23] and the cross-medicine Yellow Card and prescribing analysis of Mokbel et al. [32]. These studies provided the rationale for relating spontaneous reports to prescribing volume; the present calendar-year reconciliation, exact comparisons, quasi-Poisson analyses and sensitivity analyses are specified below rather than attributed wholesale to either study. The within-class proportional analysis used the PRR framework described by Evans et al. [36], with comparator selection informed by Gravel et al. [37] and interpretation informed by EMA guidance [38]. This was an adaptation to available aggregate reaction entries, not a replication of a deduplicated individual-case safety-report analysis.
Analyses were exploratory and hypothesis-generating. The focused outcomes and comparison families were fixed in the final analysis code before producing the final tables, but no prospective registration is claimed. A primary set of exposure-adjusted analyses and a separate set of entry-composition analyses were kept distinct because their denominators and statistical interpretations differ.
2.2. Data Sources and Calendar-Year Selection
Suspected adverse reaction information came from the MHRA Yellow Card interactive Drug Analysis Profiles [28,29]. The final source audit records selection of calendar years 2021 through 2025, inclusive, with all available ages, reporter types, submission routes and System Organ Classes included. Preferred Term tables, System Organ Class summaries and aggregate report totals were retained separately. Female, male and serious-or-fatal strata were obtained with the corresponding source filters. The final reconciliation and supplementary stratum verification were completed on 21 September 2026; the source verification record identifies 11 August 2026 as the source extract/update date. These are source extract and verification dates, distinct from bibliographic access dates for consultation of the cited references. They do not change the selected 2021–2025 observation window.
The source selection was labelled Year Received. The available documentation did not establish whether the displayed year always represents first receipt or can reflect the most recent revision of a report. Consequently, annual analyses concern the selected source-calendar-year field and are not interpreted as time since treatment initiation or confirmed event-onset year. This unresolved distinction is especially relevant to interpretation of temporal change.
Monthly general practice prescribed-item counts and quantities were obtained from OpenPrescribing [39]. NHS Business Services Authority English Prescribing Data supplied January 2021 where required to complete the window [40]. Hospital exposure came from Secondary Care Medicines Data accessed through OpenPrescribing Hospitals [41]. The exposure data cover England, whereas the reaction data cover the UK. The resulting geographical mismatch can inflate absolute rates and may affect between-medicine ratios if the geographical distribution of use differs by medicine. No UK-wide exposure adjustment was applied.
2.3. Counting Units and Reconciliation
The primary counting unit was a recorded Preferred Term reaction entry. One Yellow Card report may include several Preferred Terms; a sum of reaction entries is therefore neither a count of unique reports nor a count of affected patients [29]. A report may contribute more than one entry to a composite outcome and may contribute both outcome and other-reaction entries to a two-by-two table. Report identifiers were unavailable, so this dependence could not be removed by record-level deduplication. Aggregate report totals were used only for analyses explicitly labelled as report-count analyses.
For each medicine and available year, Preferred Term sums were reconciled against the displayed grand total. System Organ Class headings were not added to their constituent Preferred Terms. In the canagliflozin 2021 extract, a collapsed respiratory System Organ Class subtotal of three entries was excluded to avoid double-counting its underlying terms. The reconciled counts were 114 entries for that year and 514 over the full period. Full-period totals were 514 for canagliflozin, 5703 for dapagliflozin, 2559 for empagliflozin and 13 for ertugliflozin, giving 8789 entries overall.
An absent term was assigned zero only within an otherwise available, completely reviewed positive-result table. An annual query returning No Results was not interpreted as a confirmed zero. Ertugliflozin had unavailable annual reaction counts for 2021 and 2023 and was therefore excluded from annual models and annual within-class comparisons. Its full-period total of 13 was verified from a separate 2021–2025 range query and was used in full-period analyses. No missing annual count was imputed, and the full-period total was not used to manufacture annual zeros. Annual reaction reconciliation and report counts are given in Table S2 and Table S3.
The female and male counts were reconciled with each medicine–outcome total; their remainder was retained as sex not recorded as female or male. Serious-or-fatal counts were required not to exceed the corresponding all-entry counts. Fatal-outcome counts were checked against the filtered source counts. Blank fatal cells were treated as zero only where the nonfatal count equalled the displayed total. These rules distinguish a supported numerical zero from unavailable information.
2.4. Outcome Definitions
The original descriptive atlas contains 43 outcomes comprising total entries, selected composites, individual Preferred Terms and selected System Organ Classes. Formal focused comparisons were restricted to ten outcomes: all reaction entries; ketoacidosis and ketosis; euglycaemic ketoacidosis; genital infection; Fournier’s gangrene or necrotising fasciitis; urinary tract infection and urosepsis; volume depletion; acute kidney injury and renal failure; amputation including finger; and peripheral tissue injury. Nine specific outcomes entered the proportional analysis; all reaction entries could not serve as a specific event against an other-entry category because that would leave no other entries.
Outcome membership was implemented as exact matching against the retained Preferred Term lists, reproduced in Appendix A and Table S4. The broad ketoacidosis composite includes diagnostic terms, ketosis and ketone-related laboratory terms; euglycaemic ketoacidosis is a nested subset. The genital composite is not restricted to mycotic infection. The renal composite includes renal impairment; the necrotising fasciitis composite is not restricted to genital or perineal sites. The amputation composite includes finger and anatomically unspecified terms. Peripheral tissue injury is a study-specific grouping, not a standardised MedDRA query and not a synonym for amputation.
Three restricted definitions were analysed separately: diagnostic ketoacidosis terms only, explicitly lower-limb amputation terms only, and Fournier’s gangrene alone. The archived definition file contains the actual source terms but does not establish the MedDRA dictionary version used by the source. A version number was therefore not inferred solely from the calendar date. Outcomes were analysed independently; overlapping composites and their nested terms were not summed into a combined burden measure.
2.5. Prescribing Denominators and Hospital Conversion
For each medicine, monthly general practice exposure included the single-ingredient formulations and fixed-dose combinations containing that medicine. Item counts and dispensed quantities were aggregated within medicine, formulation and calendar month, and formulation names were normalised before matching to hospital products. The medicine-level denominator contained 60 monthly observations; all four medicines had 12 months in each study year. The final combined denominator was approximately 52.19 million prescribed items, including approximately 0.88 million estimated hospital item-equivalents (annual denominators in Table S1).
Hospital defined daily doses (DDDs) were converted to tablet-equivalents by multiplying the recorded number of DDDs by the assigned DDD in milligrams and dividing by the tablet strength in milligrams. The assigned DDDs were 200 mg for canagliflozin, 10 mg for dapagliflozin, 17.5 mg for empagliflozin and 10 mg for ertugliflozin [42]. For each matched formulation and month, the general practice quantity per item was calculated as quantity divided by prescribed items. Hospital tablet-equivalents were divided by that quantity per item to obtain estimated hospital items.
In symbols, hospital tablets = hospital DDDs × assigned DDD (mg) / tablet strength (mg); GP quantity per item = GP quantity / GP items; and estimated hospital items = hospital tablets / GP quantity per item. The primary denominator was GP items plus available estimated hospital items, summed over the same year or full period as the reaction numerator. The secondary denominator contained GP items only. No rounding was applied before rate calculation; rounding was reserved for displayed tables.
This conversion assumes comparable quantities per item in general practice and hospital supply. Hospital formulations without a verified match contributed no hospital estimate, so the denominator is described as GP plus available hospital exposure. Unverified hospital combination-product coverage was not treated as complete. Private prescribing, prescribing outside England and uncaptured hospital use were not estimated from new data. A prescribed item is not a patient, dose, treatment course or measure of person-time.
2.6. Reporting Rates and Descriptive Forest Plots
For medicine d and outcome k, the reporting rate was r(d,k) = 1,000,000 × N(d,k) / E(d), where N is the reaction-entry count and E is the captured prescribed-item denominator. The same expression was used for full-period and annual descriptive rates with period-matched exposure. Two-sided 95% Garwood Poisson intervals were calculated for N and divided by E, then multiplied by one million [43]. For N > 0, the lower count limit was one half of the 0.025 quantile of a chi-squared distribution with 2N degrees of freedom; the upper limit was one half of the 0.975 quantile with 2(N + 1) degrees of freedom. For N = 0, the lower limit was zero and the finite upper limit was retained.
The metarate forest displays were produced using the meta package [44]. A Poisson generalised linear mixed model with log-rate parameterisation was fitted to the four medicine counts and exposure totals. The common-effect estimate represents a shared reporting rate and corresponds to the pooled crude count divided by pooled exposure. The random-effects model allows a normally distributed medicine-specific deviation on the log-rate scale, with between-medicine variance estimated by maximum likelihood. Individual displayed intervals were the exact Poisson intervals described above. The plots retain the supplied labels Fixed effect model and Random effects model and show I², τ² and the heterogeneity test result.
Medicines are the comparators under investigation, not independent studies sampling a common clinical effect. These pooled estimates and heterogeneity measures are descriptive displays only and do not establish a class-level safety estimate, comparative causality or independent corroboration of the rate-ratio analysis. Zero counts remain explicit in the underlying tables; non-estimable pooled quantities and model warnings are retained in the model audit rather than converted into evidence of absence.
2.7. Formal Reporting Rate Ratios
A separate four-row dataset was constructed for each focused outcome, with the fields drug, outcome, reactions and items. Dapagliflozin was the reference because it had the largest captured exposure and substantial reaction counts. The model was reactions ~ drug + offset(log(items)), fitted with a Poisson log link. In mathematical form, log E[N(d,k)] = log E(d) + α(k) + β(d,k), with β(dapagliflozin,k) = 0. Exponentiating β gives the reporting rate ratio (RRR); at a boundary with zero entries, the crude rate ratio and exact comparison provide the interpretable output instead of a large finite numerical coefficient from a non-convergent boundary fit.
The reported point estimate is [N(d,k)/E(d)] / [N(reference,k)/E(reference)]. The 95% confidence intervals and two-sided p values in the final comparison tables were obtained from exact conditional Poisson comparisons using R’s poisson.test function [45]. Conditional on the sum of the two counts, the null allocation is binomial with probability E(d)/[E(d) + E(reference)] when the null rate ratio is one. Thus, the displayed p values are exact conditional test results, not Wald p values from the regression coefficient table. The equivalent Poisson model supplies the regression formulation and agrees with the ratio point estimate where the maximum-likelihood coefficient is finite.
Holm adjustment was applied across 30 focused comparisons, comprising ten outcomes and three non-reference medicines [46]. The nine restricted-definition comparisons formed a separate family. Each denominator specification was reported as a separate sensitivity analysis with its own adjustment family. Marginal 95% intervals were not adjusted for multiplicity, so an interval excluding one can coexist with a Holm-adjusted p value above 0.05. Adjusted p values, rather than the unadjusted interval alone, governed statements about evidence of a focused between-medicine difference.
The aggregate medicine model is saturated: four observations and four medicine-specific mean parameters leave no residual degrees of freedom. A Pearson dispersion estimate and a defensible quasi-Poisson sensitivity analysis cannot be obtained from those four rows. Exact conditional inference addresses discreteness and small counts under the Poisson model; it does not correct within-report clustering, unmeasured confounding or under-reporting. This limitation also applies to formal comparisons of composite reaction-entry counts.
2.8. Medicine-Specific Annual Models and Robustness Checks
Annual models used the five observations for each medicine with complete reaction counts. Calendar year was centred at 2021. Separate log-link models related annual counts to centred year with log annual items as an offset: log μ(d,t) = log E(d,t) + α(d) + β(d)(t − 2021). The exponentiated slope is the annual reporting rate ratio; 100 × [exp(β) − 1] is the annual percentage change. These are calendar-time reporting trends, not longitudinal changes in risk for the same treated individuals.
The final primary models used a quasi-Poisson variance, Var(N) = φμ. Dispersion was estimated from the Pearson residual sum of squares divided by residual degrees of freedom. Each complete five-year medicine-specific model had three residual degrees of freedom. Confidence intervals used the estimated standard error and the Student t critical value with three degrees of freedom, and two-sided slope tests used the corresponding t distribution [47]. Ordinary Poisson fits were retained as sensitivity analyses. The fitted dispersion was used as estimated in the primary quasi-Poisson results; the archived output also includes a sensitivity calculation using a dispersion floor of one.
The model specifications were applied to total reaction entries, aggregate total report counts and the ketoacidosis-and-ketosis entry composite. Outcome-specific unique-report counts were not available, so the ketoacidosis composite was not analysed as though it consisted of deduplicated cases. Analyses were repeated with the GP-only denominator. Holm adjustment used four planned medicine-specific tests within each outcome, counting unit, denominator and model specification; the unavailable ertugliflozin analysis was not assigned a synthetic estimate, and retaining a family size of four was conservative.
Leave-one-year-out analyses omitted each calendar year in turn and refitted the same models using the remaining four observations, giving two residual degrees of freedom for a medicine-specific quasi-Poisson fit. The direction, magnitude and uncertainty of the slope were compared with the complete-series estimate. These refits assessed sensitivity to individual years, not five independent replications. Only five time points were available, so no seasonal model, treatment-duration model or reliable assessment of complex non-linear or serially correlated trends was attempted.
2.9. Formal Comparison of Temporal Trends Between Medicines
The combined temporal model used 15 medicine-year observations: three medicines multiplied by five years. It included medicine, centred calendar year, their interaction and the log-item offset: reactions ~ drug * year_c + offset(log(items)). The reduced model omitted the interaction and imposed a common annual slope while allowing different baseline rates. The full model estimated three medicine-specific intercepts and three slopes, leaving nine residual degrees of freedom.
The primary omnibus test compared the reduced and full quasi-Poisson models using an F test with two numerator and nine denominator degrees of freedom. This tests whether the slope differences represented by the medicine-by-year interaction are collectively zero. Corresponding Poisson likelihood-ratio tests were retained as sensitivity analyses, but quasi-Poisson inference was prioritised when Pearson dispersion exceeded one. Total entries, total reports and ketoacidosis entries were examined separately, with GP-only and leave-one-year-out checks retained in the analysis output. A non-significant interaction denotes insufficient evidence of different trends and does not demonstrate equivalence of slopes. These three exploratory interaction tests were reported separately without an additional shared multiplicity adjustment (Table S8).
2.10. Within-Class Reaction-Entry Disproportionality
This analysis asked whether a selected outcome occupied a larger share of one medicine’s recorded reactions than of the comparator medicines’ recorded reactions. It did not use prescribed items. Full-period comparisons used each of the four medicines against the other three combined; annual comparisons used each of canagliflozin, dapagliflozin and empagliflozin against the other two in the same year. Ertugliflozin was excluded from every annual comparator set because two annual counts were unavailable. There were 36 full-period comparisons and 135 annual comparisons across nine specific outcomes. Full-period and annual estimates therefore use different comparator sets, and the full-period ratio is not an average of the five annual ratios.
Evans et al. [36] supplied the foundational PRR construction and the familiar count/ratio/chi-squared screening thresholds. Gravel et al. [37] informed the decision to state the restricted comparator explicitly and to recognise that comparator choice and calendar period can alter apparent disproportionality. Their study used FAERS data and examined several comparator strategies; it did not validate the current entry-based Yellow Card analysis or establish that a within-class comparator removes bias. EMA guidance [38] supplied the reference interpretation for report-level ROR analysis. The present counting unit differs from that regulatory setting, so the calculated measures are explicitly described as entry-level analogues.
For each medicine–outcome–period combination, a was the number of matching outcome entries for the target medicine; b was its total entry count minus a; c was the sum of matching outcome entries for the comparator medicines; and d was their summed total entry count minus c. The four cells partition entries by medicine group and outcome membership. They do not partition independent patients or independent reports. Both the raw cells and the comparator membership were exported with every estimate, allowing the numerator and denominator to be reconstructed.
The proportional reporting ratio was PRR = [a/(a + b)] / [c/(c + d)]. The reporting odds ratio was ROR = (a/b)/(c/d) = ad/bc. PRR compares two proportions, whereas ROR compares the corresponding odds; the measures are not numerically interchangeable when an outcome is common among recorded reactions. Neither is an exposure-adjusted reporting rate ratio. An entry-level ratio above one indicates relative over-representation in the target medicine’s reaction composition; a ratio below one indicates relative under-representation, not protection or a lower patient risk.
For positive cells, nominal 95% intervals were calculated on the natural-log scale. The standard error for log ROR was sqrt(1/a + 1/b + 1/c + 1/d). For log PRR, it was sqrt[1/a − 1/(a + b) + 1/c − 1/(c + d)]. Each interval was exp[log(estimate) ± 1.96 × standard error]. These intervals use the conventional independent-entry approximation. Because multiple entries may arise from the same report, their nominal 95% coverage is not assured. They quantify model-based uncertainty under an explicit working assumption and are not cluster-adjusted report-level intervals.
For the accompanying Yates-corrected chi-squared statistic, let N = a + b + c + d. The statistic was N × max(0, |ad − bc| − N/2)² / [(a + b)(c + d)(a + c)(b + d)] [48]. The comparison was marked as crossing an exploratory screening threshold only when a ≥ 3, PRR ≥ 2 and this statistic was ≥ 4, using the raw counts. These thresholds follow the convention reported by Evans et al. [36], but applying them here does not create a validated regulatory signal because the counting unit and comparator differ. Threshold crossing, a nominal interval excluding one and agreement with an exposure-adjusted RRR were not treated as independent confirmation or decisive evidence of causality.
No pseudo-count or continuity addition was applied to the cell counts for ROR or PRR. When a was zero with otherwise positive margins, the raw ratio was retained as zero in the tables, but a finite log-scale confidence interval was not reported and the point was omitted from the logarithmic figure. Comparisons with other zero cells were retained with an unavailable or boundary estimate as appropriate. This rule preserves the distinction between a recorded zero and missing data. Yates’ correction to the chi-squared statistic is a separate operation and does not add 0.5 to all four cells.
No multiplicity correction was applied to the proportional screening outputs; all nine outcomes and all calendar years were retained in the numerical tables rather than selecting only large ratios. The nominal intervals and screening flags therefore cannot be interpreted as controlling a family-wise false-positive rate. A shared class adverse effect may be present in the comparator, reducing apparent disproportionate representation. Conversely, an increase in one type of reaction can reduce the shares of other reactions without any change in their absolute counts. The reaction-entry composition analysis avoids dependence on prescribed-item denominators but does not remove stimulated reporting, indication differences, coding differences or other selection effects.
As a reproducibility example, the full-period canagliflozin ketoacidosis-and-ketosis table contains a = 147, b = 367, c = 947 and d = 7328. The target proportion is 147/514 and the comparator proportion is 947/8275. These give PRR = 2.4990 and ROR = 3.0995, with a nominal ROR interval of approximately 2.53–3.80 and Yates-corrected chi-squared statistic of 129.1174. This example demonstrates the arithmetic and counting unit; it does not imply a threefold increase in patient risk.
2.11. Presentation of Disproportionality Figures
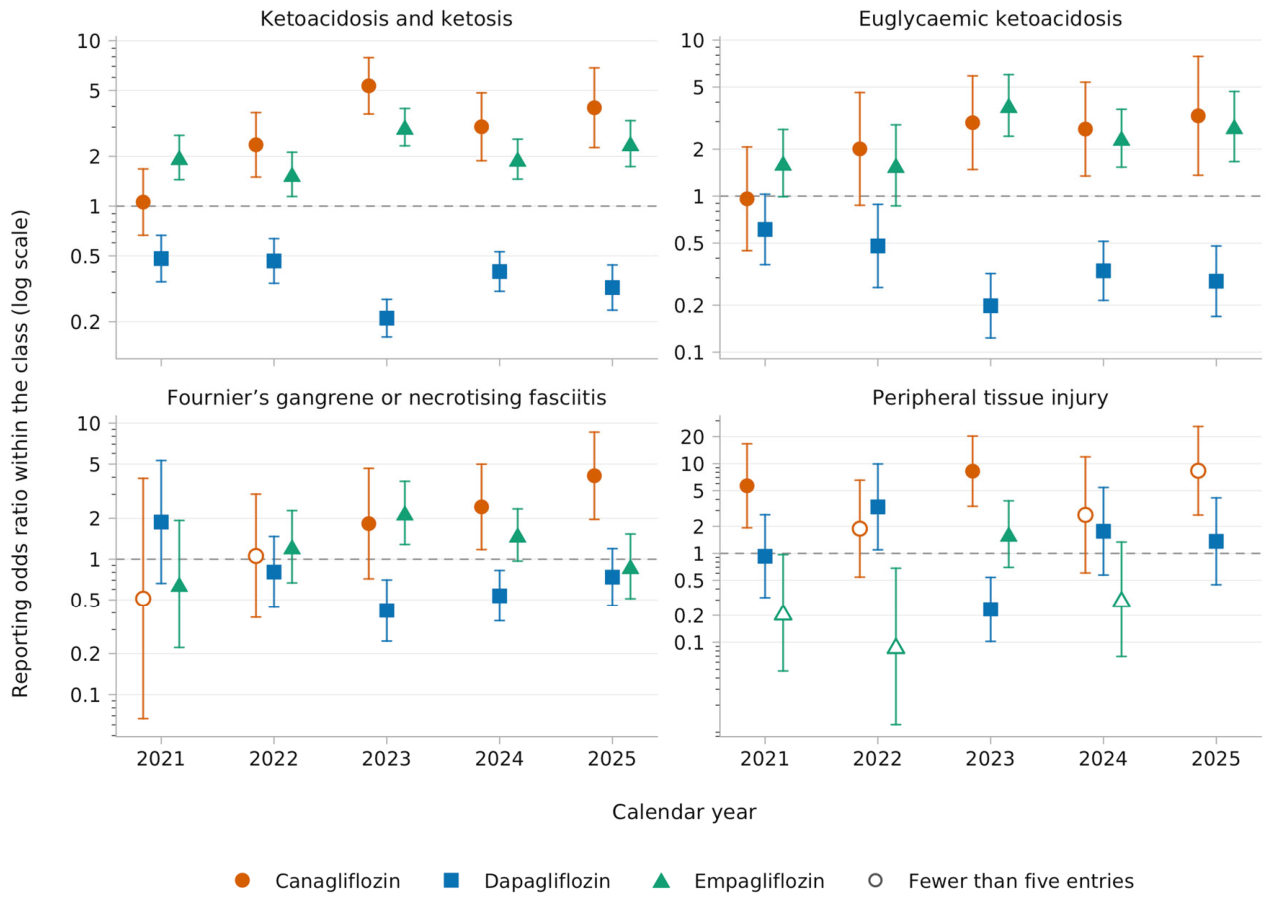
Figure 6 displays four outcome panels in the following order: ketoacidosis and ketosis, euglycaemic ketoacidosis, Fournier’s gangrene or necrotising fasciitis, and peripheral tissue injury. The horizontal axis contains the five calendar years; the vertical axes are logarithmic ROR scales with panel-specific limits. Orange circles represent canagliflozin, blue squares dapagliflozin and green triangles empagliflozin. Small horizontal offsets separate the medicine estimates within each year. Open markers identify target outcome counts below five; the dashed horizontal line denotes a ratio of one. Error bars show the nominal intervals specified above, and points are not joined by trend lines.
The full-period supplementary forest (Figure S46) displays the same nine outcomes as the numerical proportional-comparison table. It uses the same medicine colours and marker shapes, a logarithmic horizontal ROR axis, a vertical reference line at one and a numerical estimate-and-interval column. Ertugliflozin contributes to the full-period comparator totals and remains in the exported tables, but its zero outcome estimates are not represented as positive points on the logarithmic forest. The annual peripheral-tissue-injury comparison for empagliflozin in 2025 is likewise retained as a zero in the table and omitted from the log plot.
The disproportionality figures were generated from reconstructed counts in R 4.5.3 using native grid graphics and saved as PNG and vector PDF. Data, equations, labels, panel order, symbols and colour assignments are specified in the accompanying R script, and both the full-period and annual comparison tables are available in CSV format. The numerical cells were reconciled to the analysis dataset and the nonzero full-period RORs were checked against Table 6.
2.12. Exposure Under-Capture Scenarios
For a medicine whose reporting rate exceeded the dapagliflozin rate for a given outcome, we calculated the additional target-medicine exposure needed to make the two observed reporting rates equal while holding both reaction counts and the reference exposure fixed. If RRR(d,k) = r(d,k)/r(reference,k), the required total target exposure is E*(d,k) = E(d) × RRR(d,k). Additional items equal E(d) × [RRR(d,k) − 1], and the additional percentage is 100 × [RRR(d,k) − 1]. Where RRR ≤ 1, no increase is needed to remove an excess and the additional-exposure threshold is reported as zero.
These calculations were performed separately for focused outcomes and denominator specifications (Table S10). They are parity thresholds, not estimates of private prescribing, corrected rates or probabilities of missing exposure. A single medicine has one true exposure volume, so the different outcome-specific thresholds must not be interpreted as simultaneously valid corrections. The scenario does not address missing reactions, geographical differences in reporting or private use of the reference medicine. No new private prescribing data were collected.
2.13. Sex Distribution and Serious or Fatal Reporting
Sex reporting patterns were summarised by female entries F, male entries M, entries not recorded as female or male U, the ratio F/M, and 100F/(F + M). The unknown or unclassified share was 100U/(F + M + U). The female percentage therefore excludes unknown entries from its denominator, whereas the unknown share uses all entries. No 50:50 exposed population was assumed. Outcome-specific ratios and percentages were highlighted only when F + M ≥ 20 and both F and M were at least five; sparse raw counts remained available. Where M = 0, a finite female-to-male ratio was not manufactured. No sex-specific incidence, prescribing-adjusted risk or sex-effect regression was calculated.
Serious-or-fatal entries were those appearing within reports classified by the source as serious or fatal. Their presence in that stratum does not establish that every reaction term in the report was independently serious. Entries with a fatal reaction outcome were counted separately and treated as a subset, not added again to the serious-or-fatal total. For each stratum and outcome, counts were divided by the same overall medicine-specific prescribing denominator to describe stratum-specific reporting rates, with exact Poisson intervals. The percentage of outcome entries within serious-or-fatal reports used the all-entry outcome count as its denominator.
Supplementary stratum comparisons (Table S16) used exact conditional Poisson rate-ratio intervals and p values, with separate Holm families of 30 comparisons within each seriousness stratum and denominator specification. If both compared counts were zero, the rate ratio was not estimable; one-sided zero counts were retained as boundary estimates with exact intervals where defined. These analyses describe reporting strata and do not estimate the probability of death or serious harm among treated patients. Figure displays of serious-report shares used an all-entry outcome count of at least 20 to limit unstable graphical summaries.
2.14. Triangulation and Pharmacological Interpretation
The triangulation summary (Table S18) brought together the highest observed reporting rate, elevated RRRs that retained evidence after Holm adjustment, available annual trend results, sex reporting summaries, count sparsity and restricted-definition sensitivity. The highest rate was a ranking of observed point estimates, not a formal superiority claim. Outcomes without an annual model were identified as not modelled rather than assigned an increasing or decreasing trend. Sparse evidence was flagged at the relevant medicine–outcome comparison; ertugliflozin’s small total should not be allowed to imply that every comparison between the other medicines is equally sparse.
This summary was an organisational aid rather than a validated scoring system. Reporting rates, RRRs, within-class composition ratios and exposure-parity factors reuse the same reaction counts, and agreement across them is not independent replication. A large ratio based on few entries, an unstable sensitivity result or an interval dependent on the independent-entry assumption was described accordingly. Sex distributions were interpreted as reporting patterns without an exposure-based claim of imbalance in biological susceptibility.
Pharmacological interpretation considered shared SGLT2 effects, proposed molecule-specific properties and non-pharmacological explanations such as indication channelling, differential uptake and reporting behaviour. Earlier SGLT2 reporting findings [23] and the patient-level cohort of Douros et al. [49] were used as external context. The latter compared individual SGLT2 medicines with DPP-4 inhibitors; a ranking of those separate hazard ratios was not treated as a formal head-to-head SGLT2 comparison. The analysis cannot distinguish a mechanistic drug effect from confounding by indication, diabetes status, dose, treatment duration, comorbidity or concomitant treatment. Mechanistic explanations therefore remain hypotheses, including when they are pharmacologically plausible.
2.15. Reproducibility and Interpretation of Uncertainty
All analytical datasets retained the selected study years, medicine identifiers, outcome definitions, count units and denominator specifications. All statistical analyses and figures were produced in R. The original scripts provide the rate, exact-comparison, temporal, stratum and metarate calculations and the ggplot2 figures for annual rates, annual proportional comparisons, sex distributions and seriousness (Figure 5 and Figure 7; Figure S44 and Figure S45). The companion R script reconstructs the proportional-comparison cells and generates the ROR figures using native grid graphics (Figure 6; Figure S46). A common medicine colour palette is used across these displays. Assertions check the study window, missing-year rules, nonnegative integer cells, expected comparison counts and the worked-example result. R session information and input-file checksums are retained with the reproducibility package.
Formal inference used two-sided tests and a nominal 0.05 threshold, with Holm-adjusted p values where the comparison family was defined above. Numerical precision in a table is not evidence that the underlying measurements are unbiased. Confidence intervals condition on the captured denominators and the statistical assumptions; they do not incorporate uncertainty from incomplete exposure, report selection, source revisions, hospital conversion or within-report clustering. The final language is therefore Yellow Card reporting rates per million prescribed items and entry-level reporting patterns, not true incidence, absolute risk or direct comparative medicine safety.
3. Results
3.1. Reaction Entries and Exposure
For 2021–2025, 8789 reaction entries were analysed against 52.19 million combined prescribed items: 5703 entries for dapagliflozin, 2559 for empagliflozin, 514 for canagliflozin and 13 for ertugliflozin (Table 1). All four medicines had complete 60-month prescribing data. Annual reaction counts were available for all years for canagliflozin, dapagliflozin and empagliflozin; for ertugliflozin the source returned no results for 2021 and 2023, so its 13 entries were taken from a full-period query and it was excluded from annual models.
3.2. Reporting Rates
Total reporting rates were 213.64 per million combined items for ertugliflozin (95% CI 113.75–365.33), 188.83 for dapagliflozin, 143.53 for empagliflozin and 125.47 for canagliflozin (Figure 1). The highest point estimate, for ertugliflozin, rests on 13 entries and has a wide interval. Between-medicine heterogeneity was high for total reporting (I2 = 98.4%) and for the ketoacidosis and ketosis composite (97.8%), for which rates were 35.88 (30.32–42.17) for canagliflozin, 28.27 (25.85–30.85) for empagliflozin and 14.67 (13.33–16.10) for dapagliflozin (Figure 2). Rates for all 43 outcomes, including individual Preferred Terms and System Organ Classes, are shown in the supplementary atlas (Figure S1–S43), and their pooled summaries in Table S13.
3.3. Reporting Rate Ratios
Relative to dapagliflozin, total reporting was lower for canagliflozin (RRR 0.66, 95% CI 0.61–0.73) and empagliflozin (0.76, 0.73–0.80). Ketoacidosis and ketosis reporting was higher for canagliflozin (2.45, 2.02–2.95) and empagliflozin (1.93, 1.69–2.19), as was euglycaemic ketoacidosis reporting (2.36, 1.62–3.38 and 2.26, 1.79–2.87, respectively); all four differences remained statistically significant after Holm adjustment (Table 2). Reporting was lower for canagliflozin for urinary tract infection and urosepsis (0.25, 0.08–0.60; Holm p = 0.006) and lower for empagliflozin for acute kidney injury and renal failure (0.39, 0.19–0.71; p = 0.024) and peripheral tissue injury (0.38, 0.19–0.70; p = 0.018). Comparisons for genital infection, Fournier’s gangrene or necrotising fasciitis, volume depletion and amputation did not retain evidence of a difference after adjustment. Ertugliflozin had no entries for any of the nine specific outcomes, and its total reporting rate ratio was 1.13 (0.60–1.94; Holm p = 1.000) (Table S17).
Restricting the definitions changed the amputation comparison most. With diagnostic ketoacidosis terms only, the ratios were similar to the broad composite (canagliflozin 2.48, 2.03–3.00; empagliflozin 1.90, 1.67–2.18). With lower-limb amputation terms only, the canagliflozin ratio fell from 3.69 to 2.68 (0.62–9.05) and remained non-significant, and restricting to Fournier’s gangrene alone did not change the conclusion for that composite (Table 3).
3.4. Amputation and Peripheral Tissue Injury
Amputation reporting was highest for canagliflozin (1.46 per million items, based on six entries, versus 0.40 for dapagliflozin and 0.39 for empagliflozin), with an RRR of 3.69 (1.14–10.61) that did not survive Holm adjustment (p = 0.301) (Figure 3). Peripheral tissue injury reporting was also highest for canagliflozin (5.37 per million items, 22 entries), with an RRR of 2.80 (1.63–4.64) that remained significant after adjustment (p = 0.004), while empagliflozin reporting was lower than dapagliflozin (0.38, 0.19–0.70) (Figure 4).
3.5. Annual Trends
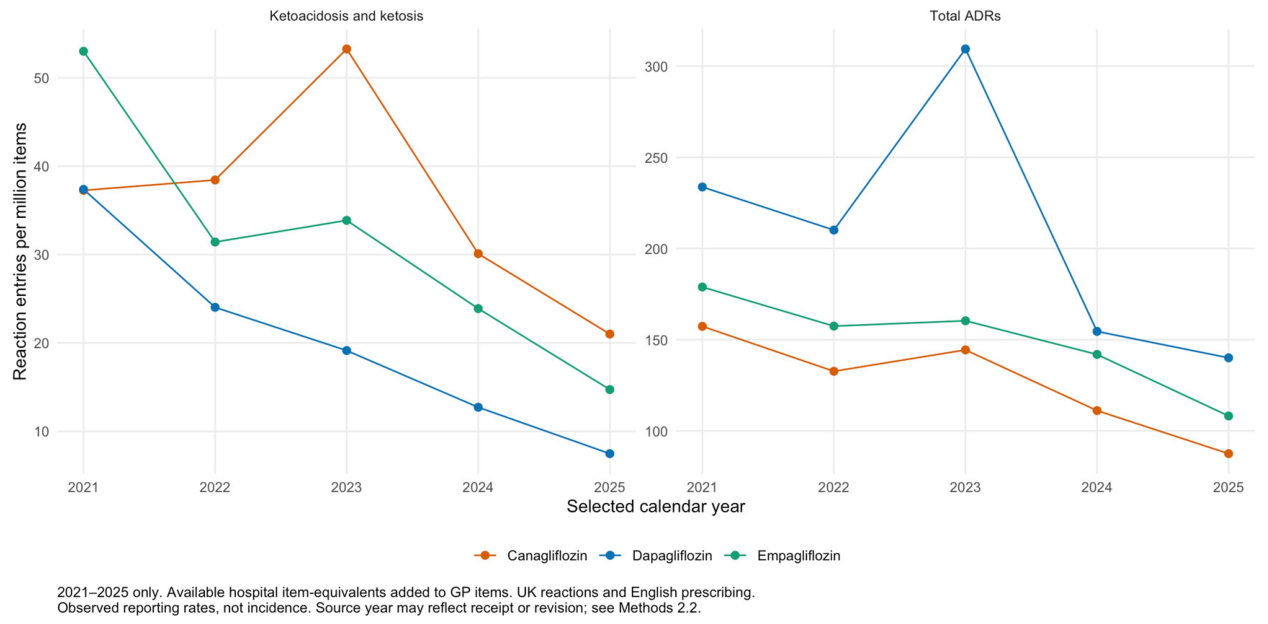
Annual reporting rates fell for all three medicines with complete annual data (Figure 5). After Holm adjustment, the declines that remained statistically significant were for the ketoacidosis and ketosis composite: 32.0% per year for dapagliflozin (annual rate ratio 0.68, 95% CI 0.62–0.75; p = 0.004) and 24.4% per year for empagliflozin (0.76, 0.64–0.90; p = 0.041); the canagliflozin slope for this outcome was 0.89 (0.63–1.25) (Table 4). Slopes for all reaction entries and for report counts were below one for every medicine but did not pass their Holm thresholds. In leave-one-year-out analyses, the dapagliflozin ketoacidosis slope stayed below one in all five runs and remained significant in four, whereas no empagliflozin run retained significance (Table S9).
Figure 5.
Observed annual reporting rates per million combined prescribed items, 2021–2025, for ketoacidosis and ketosis (left) and all reaction entries (Total ADRs; right). Lines connect observed values and are not fitted trends. Ertugliflozin is not shown because annual counts for 2021 and 2023 were unavailable.
Dispersion was substantial for total reaction entries (Pearson dispersion 39.03 in the interaction model), so quasi-Poisson tests were used as the primary inference. No medicine-by-year interaction reached p < 0.05 (quasi-Poisson p = 0.839 for all reaction entries, 0.570 for report counts and 0.083 for ketoacidosis and ketosis), although the corresponding Poisson tests were significant for two of the three (Table 5). This is insufficient evidence of different slopes rather than evidence that the slopes are the same.
3.6. Within-Class Disproportionality
These ratios count reaction entries rather than individual case safety reports, so they are entry-level analogues of the standard statistics and are reported as descriptive comparisons of reporting composition, not as regulatory signals of disproportionate reporting.
Without any prescribing denominator, the ketoacidosis and ketosis composite accounted for 147 of 514 canagliflozin entries (28.6%), compared with 947 of 8275 entries (11.4%) for the other three medicines combined, giving a reporting odds ratio (ROR) of 3.10 (95% CI 2.53–3.80) and a proportional reporting ratio (PRR) of 2.50 (χ2 = 129.1). The composite was also over-represented for empagliflozin (2.34, 2.06–2.67) and under-represented for dapagliflozin (0.32, 0.28–0.36), and euglycaemic ketoacidosis followed the same pattern (Table 6). The largest ratios were for canagliflozin: amputation 5.13 (2.04–12.91) on six entries and peripheral tissue injury 5.17 (3.18–8.41) on 22 entries; empagliflozin had the lowest ratio for peripheral tissue injury (0.39, 0.22–0.71). Using the conventional criteria of at least three entries, PRR of at least two and χ2 of at least four, the comparisons that met all three over the full period were ketoacidosis and ketosis, euglycaemic ketoacidosis, amputation and peripheral tissue injury for canagliflozin, and ketoacidosis and ketosis and euglycaemic ketoacidosis for empagliflozin. Meeting these thresholds, or an interval that excludes one, orders the comparisons within this dataset and is not treated here as decisive evidence for any of them.

Table 6.
Within-class disproportionality: reporting odds ratios for each medicine versus the other SGLT2 inhibitors combined, 2021–2025.
Table 6.
Within-class disproportionality: reporting odds ratios for each medicine versus the other SGLT2 inhibitors combined, 2021–2025.
| Outcome | Canagliflozin | Dapagliflozin | Empagliflozin | |||
|---|---|---|---|---|---|---|
| n | ROR (95% CI) | n | ROR (95% CI) | n | ROR (95% CI) | |
| Ketoacidosis and ketosis | 147 | 3.10 (2.53–3.80) | 443 | 0.32 (0.28–0.36) | 504 | 2.34 (2.06–2.67) |
| Euglycaemic ketoacidosis | 41 | 2.31 (1.65–3.25) | 128 | 0.31 (0.25–0.39) | 171 | 2.57 (2.07–3.19) |
| Genital infection | 15 | 0.78 (0.46–1.32) | 199 | 0.86 (0.69–1.09) | 109 | 1.25 (0.99–1.58) |
| Fournier’s gangrene or necrotising fasciitis | 28 | 1.83 (1.23–2.74) | 155 | 0.66 (0.52–0.84) | 97 | 1.30 (1.01–1.67) |
| Urinary tract infection and urosepsis | 5 | 0.36 (0.15–0.88) | 147 | 1.03 (0.78–1.37) | 72 | 1.16 (0.87–1.54) |
| Volume depletion | 4 | 0.65 (0.24–1.77) | 70 | 1.15 (0.76–1.74) | 29 | 0.95 (0.62–1.47) |
| Acute kidney injury and renal failure | 5 | 1.15 (0.46–2.87) | 57 | 1.72 (1.01–2.93) | 13 | 0.51 (0.28–0.93) |
| Amputation (including finger) | 6 | 5.13 (2.04–12.91) | 12 | 0.50 (0.23–1.09) | 7 | 0.95 (0.39–2.27) |
| Peripheral tissue injury | 22 | 5.17 (3.18–8.41) | 58 | 0.90 (0.59–1.37) | 13 | 0.39 (0.22–0.71) |
Reporting odds ratios (RORs) compare the odds of outcome entries versus other entries for each medicine with the corresponding odds for the other SGLT2 inhibitors combined, using two-by-two counts of entries. The counting unit is the reaction entry, not the individual case safety report used in regulatory signal detection, so these are entry-level analogues of the ROR and not report-level statistics. Confidence intervals (CIs) are calculated on the log scale and are not adjusted for multiplicity. Because entries from the same report are not independent, the intervals are likely to be too narrow. The comparator is the rest of the class, so a ratio below one means a smaller share of entries than the other SGLT2 inhibitors, not a lower risk. Ertugliflozin had no entries for any of these outcomes. Proportional reporting ratios, chi-squared values and the two-by-two counts are in Table S11, and annual results in Table S12.
Year by year, the ketoacidosis and ketosis ratio exceeded one for canagliflozin in all five years, although the interval excluded one only from 2022 onwards, and exceeded one with the interval excluding one in every year for empagliflozin; dapagliflozin stayed below one, with the interval excluding one in every year (Figure 6). Peripheral tissue injury ratios for canagliflozin excluded one in 2021, 2023 and 2025 on four to seven entries per year, and the Fournier’s gangrene or necrotising fasciitis ratio for canagliflozin rose from 0.51 in 2021 to 4.11 (1.96–8.59) in 2025, on one to nine entries a year. All outcomes, years and two-by-two counts, with proportional reporting ratios and χ2 values, are in Table S11 and Table S12, and the full-period plot is Figure S46. These ratios describe the composition of recorded reactions within the class, count entries rather than unique reports, and were not adjusted for multiplicity.
Figure 6.
Annual within-class entry-level reporting odds ratios for 2021–2025, with nominal 95% log-scale intervals. Each medicine is compared with the other two medicines with complete annual data. The dashed reference line is one; panel scales differ. Open markers indicate fewer than five target outcome entries. Zero estimates remain in the tables and are omitted from the logarithmic display, including empagliflozin peripheral tissue injury in 2025. Ertugliflozin is excluded because its annual counts for 2021 and 2023 are unavailable. Intervals are unadjusted for multiplicity and assume independent entries; they do not account for multiple reactions within one report. Full-period estimates are in Table 6 and complete numerical outputs in Table S11 and Table S12.
3.7. Sex Distribution
Among entries with sex recorded, the percentage in women was 43.4% for canagliflozin, 44.5% for dapagliflozin, 46.7% for empagliflozin and 46.2% for ertugliflozin, and female-to-male ratios ranged from 0.77 to 0.88; sex was not recorded for 3.5% of dapagliflozin entries, 4.9% of canagliflozin entries and 5.8% of empagliflozin entries (Table 7). Male predominance was most marked for Fournier’s gangrene or necrotising fasciitis, in which women accounted for 29.6% of known-sex entries for canagliflozin, 26.3% for dapagliflozin and 13.7% for empagliflozin, whereas urinary tract infection and urosepsis entries were slightly more frequent in women (53.3% and 53.7% for dapagliflozin and empagliflozin) (Table S14).
3.8. Serious and Fatal Reporting
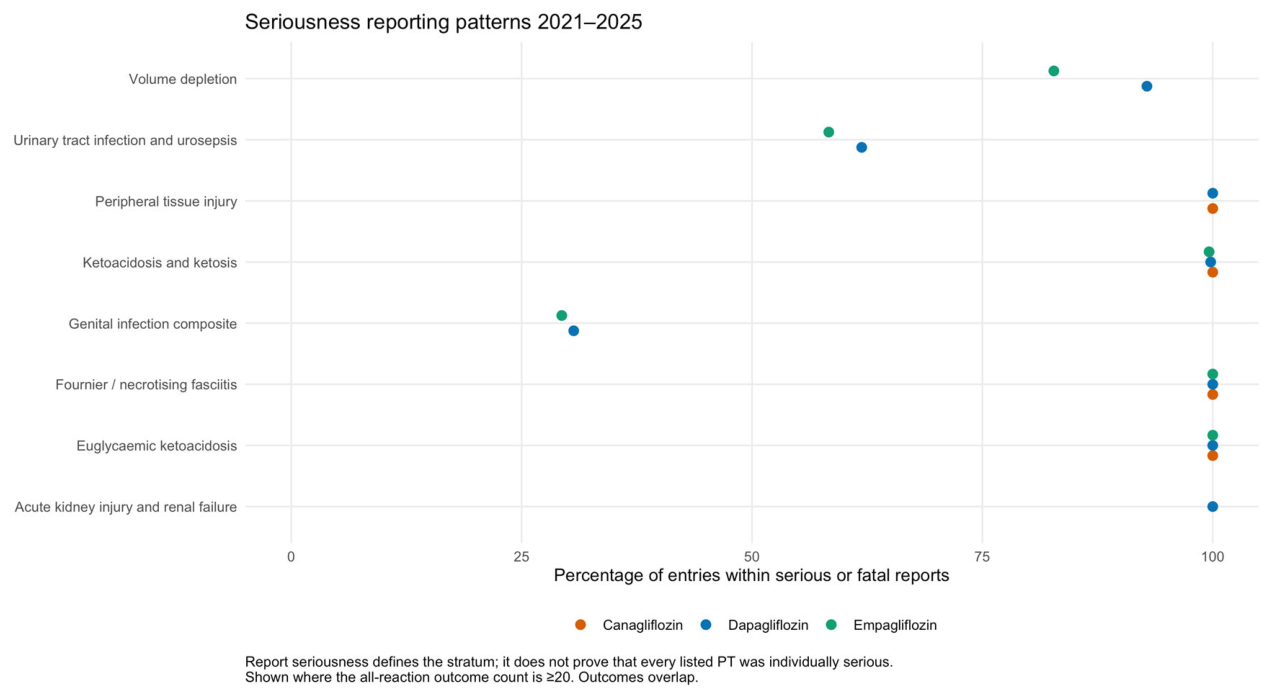
Entries within reports classified as serious or fatal accounted for 80.7% of canagliflozin entries, 69.4% of dapagliflozin entries, 68.8% of empagliflozin entries and 69.2% of ertugliflozin entries, giving rates of 101.30, 130.98, 98.71 and 147.90 per million combined items (Table 8). Almost all ketoacidosis and ketosis entries fell within this stratum (147 of 147 for canagliflozin, 442 of 443 for dapagliflozin and 502 of 504 for empagliflozin) (Figure 7). Entries with a fatal outcome were few: four for canagliflozin, 39 for dapagliflozin, 18 for empagliflozin and none for ertugliflozin, with rates of about one per million items and overlapping intervals.
Figure 7.
Share of reaction entries that fell within reports classified as serious or fatal, by outcome, shown where an outcome had at least 20 entries. Sparse outcomes are listed in Table S15.
Figure 7.
Share of reaction entries that fell within reports classified as serious or fatal, by outcome, shown where an outcome had at least 20 entries. Sparse outcomes are listed in Table S15.
4. Discussion
4.1. Principal Findings
In this analysis of 52.19 million prescribed items over five calendar years, exposure-adjusted Yellow Card reporting differed between SGLT2 inhibitors. Relative to dapagliflozin, total reporting was lower for canagliflozin and empagliflozin, but ketoacidosis and ketosis reporting was higher for both, and peripheral tissue injury reporting was higher for canagliflozin. Amputation reporting was also highest for canagliflozin, but it rested on six entries and did not remain significant after adjustment or when restricted to lower-limb terms. Ketoacidosis reporting declined over the five years for dapagliflozin and empagliflozin, without clear evidence that the trends differed between medicines. Ertugliflozin had the highest total reporting rate on 13 entries. A within-class comparison of the share of reaction entries, which uses no prescribing denominator, showed the same ordering for the ketoacidosis and ketosis composite, amputation and peripheral tissue injury, and placed canagliflozin above the other two medicines with complete annual data for ketoacidosis and ketosis in every year, with the interval excluding one in four of the five years.
4.2. Pharmacological Interpretation
Interpreting these differences requires separating effects shared by the class from those specific to individual molecules, and both from differences in the patients who receive each medicine and in how reactions are reported. Table 9 summarises pharmacological and regulatory characteristics relevant to the focused outcomes, and Table 10 compares the present findings with earlier UK Yellow Card data and a multinational cohort study. Two general caveats apply. First, selectivity estimates vary between sources: product information states that dapagliflozin is more than 1400 times and empagliflozin 5000 times more selective for SGLT2 than for SGLT1 [12,13], while the IC50 values cited above imply ratios of approximately 1170 and 2680 [23]; the rank order of selectivity is therefore more informative than absolute values. Second, not all proposed off-target actions of SGLT2 inhibitors have been reproduced; for example, empagliflozin did not inhibit the cardiac sodium-hydrogen exchanger 1 in one experimental study [50], and single-cell transcriptomic analysis found little SGLT2 expression in the heart [51].
4.2.1. Ketoacidosis
Ketoacidosis is a class effect of SGLT2 inhibition: glycosuria is accompanied by a higher glucagon-to-insulin ratio [15] and increased ketone production [16], and ketoacidosis may develop with only moderately elevated blood glucose, particularly in patients with low beta-cell function reserve, restricted food intake, severe dehydration, acute illness or a sudden reduction in insulin [18]. Several properties could plausibly increase this propensity for canagliflozin. It has the lowest SGLT2 selectivity of the four medicines and inhibits intestinal SGLT1 [23,24]; urinary glucose excretion of 77–119 g/day has been reported at its licensed doses, compared with approximately 70 g/day for dapagliflozin and 78 g/day for empagliflozin in separate studies [11,12,13]; and, in experimental studies, it activated AMPK through inhibition of mitochondrial complex I at concentrations measured in human plasma [25,26]. Whether these properties increase ketogenesis in patients has not been established. Two observations are nevertheless consistent with a molecule-related component. First, the ratio of the canagliflozin to the empagliflozin ketoacidosis reporting rate was similar in UK data for 2013–2019 (1.35) [23] and in the present study (1.27), despite differences in period, outcome definition and denominator (Table 10). Second, in a multinational cohort of new users with type 2 diabetes, conducted before the heart failure and kidney indications were introduced, hazard ratios for diabetic ketoacidosis versus dipeptidyl peptidase-4 inhibitors followed the same order (canagliflozin 3.58, empagliflozin 2.52 and dapagliflozin 1.86) [49]. Because each medicine was compared with dipeptidyl peptidase-4 inhibitors and not with the other SGLT2 inhibitors, and because the confidence intervals overlapped, that order is an indirect comparison rather than a demonstration of between-medicine differences. A third observation points the same way but is not independent, because it reuses the same reaction entries: without any prescribing denominator, the ketoacidosis and ketosis composite accounted for 28.6% of canagliflozin entries, compared with 11.4% of the entries for the other three medicines combined (reporting odds ratio 3.10, 95% CI 2.53–3.80), and the ratio was above one in every calendar year, with the interval excluding one from 2022 onwards (Table 6, Figure 6).
Selectivity cannot explain the higher ketoacidosis reporting for empagliflozin than for dapagliflozin, because empagliflozin is the more selective molecule. In addition, dapagliflozin had the highest ketoacidosis reporting rate of the three medicines in 2013–2019 [23] but the lowest in the present study (Table 10). Because the molecule did not change, this reversal more plausibly reflects changes in the treated population. Dapagliflozin was recommended for heart failure with reduced ejection fraction in February 2021 [34] and is licensed for heart failure and chronic kidney disease irrespective of diabetes status [12], extending its use to patients without diabetes, who generally lack the low beta-cell function reserve that predisposes to ketoacidosis [18]. In addition, any contribution from type 1 diabetes, in which diabetic ketoacidosis had been reported commonly in clinical studies, would have diminished after dapagliflozin 5 mg ceased to be authorised for this indication on 25 October 2021 [35]. Empagliflozin shares the heart failure and kidney indications [13], but the indication mix of each medicine was not available, and differences in the timing and extent of uptake for these indications may contribute to the contrast between empagliflozin and dapagliflozin. Ketoacidosis RRRs relative to dapagliflozin are therefore likely to combine a molecule-related component, most plausibly for canagliflozin, with a population component that aggregate data cannot separate.
4.2.2. Amputation and Peripheral Tissue Injury
Canagliflozin also had the highest amputation and peripheral tissue injury reporting rates, although the amputation comparison rested on six entries and did not survive multiplicity adjustment (RRR 3.69, 95% CI 1.14–10.61; Holm p = 0.301), falling to 2.68 (0.62–9.05) when restricted to lower-limb terms. The amputation pattern was present in UK Yellow Card data for 2013–2019, in which amputation Preferred Terms were reported at 1.56, 0.43 and 0.35 per 100,000 prescriptions for canagliflozin, dapagliflozin and empagliflozin, respectively (Table 10) [23], and is concordant with the excess observed with canagliflozin in the CANVAS Program (6.3 vs. 3.4 participants with amputation per 1000 patient-years; hazard ratio 1.97, 95% CI 1.41–2.75) [2], which was not reproduced in CREDENCE (hazard ratio 1.11, 0.79–1.56) [5]. An increase has not been seen in studies of dapagliflozin and empagliflozin, although regulators considered the available data limited [22], and in VERTIS CV, non-traumatic lower-limb amputations occurred in 2.0% and 2.1% of participants receiving ertugliflozin 5 and 15 mg and in 1.6% of those receiving placebo [14]. Volume contraction is shared across the class and would not by itself explain a canagliflozin-specific pattern. Canagliflozin-specific experimental actions, including inhibition of mitochondrial complex I [25,26] and of endothelial cell proliferation and tube formation in vitro [27], could plausibly impair tissue perfusion or repair but have not been linked to limb outcomes, and an underlying mechanism has not been established [11,22]. Stimulated reporting after regulatory communications that initially concerned canagliflozin [22,31] and the small number of amputation entries (six for canagliflozin, without Holm-adjusted significance) are important alternative explanations. The peripheral tissue injury excess was based on more entries (22) and remained significant after adjustment, but it is subject to the same alternative explanations and to possible differences in baseline vascular risk between treated populations. The same ordering appears without a prescribing denominator, although it reuses the same entries: amputation and peripheral tissue injury accounted for a larger share of canagliflozin entries than of entries for the other medicines (reporting odds ratios 5.13, 95% CI 2.04–12.91, and 5.17, 3.18–8.41; Table 6).
4.2.3. Infections, Volume Depletion and Kidney Events
For reactions with an established class effect, reporting differences did not follow pharmacological expectations. SGLT2 inhibitors increase genital infections in randomised trials (relative risk 3.37, 95% CI 2.89–3.93, vs. placebo) [20], and vaginal Candida colonisation and symptomatic vulvovaginal adverse events were numerically more frequent with canagliflozin in a 12-week randomised study [53], yet genital mycotic infection reporting was not higher for canagliflozin. In general practice studies, under-reporting was more marked for all adverse drug reactions than for serious or severe reactions [30], which limits comparisons of predictable, non-serious reactions between medicines. Lower urinary tract infection reporting for canagliflozin is directionally consistent with the meta-analytic finding that, among SGLT2 inhibitors, only dapagliflozin 10 mg increased the risk of urinary tract infection versus placebo (relative risk 1.33, 95% CI 1.10–1.61) [20]; in the present data this was the only infection comparison that remained statistically significant after adjustment (RRR 0.25, 95% CI 0.08–0.60; Holm p = 0.006), on five entries. Volume depletion reporting did not differ significantly between medicines, which is consistent with a class effect of osmotic diuresis. Lower acute kidney injury reporting for empagliflozin should be interpreted in the light of randomised evidence that SGLT2 inhibitors reduce acute kidney injury overall (relative risk 0.77, 95% CI 0.70–0.84) [9], the haemodynamic nature of the early decline in glomerular filtration rate [54] and the licensing of dapagliflozin for chronic kidney disease [12], which increases the likelihood that background kidney events are reported as suspected reactions; it does not indicate greater renoprotection with empagliflozin, which has the same indication [13]. Finally, the male predominance of Fournier’s gangrene or necrotising fasciitis entries is anatomically expected, although around one-third of the European Union cases reviewed by regulators occurred in women [19].
4.2.4. Total Reporting and Temporal Trends
Total and fatal or serious reporting combine many mechanisms and appear to be dominated by reporting dynamics. Canagliflozin had the highest total reporting rate of the three medicines in 2013–2019 [23] but the lowest of the four in the present study (Table 10), so its lower total RRR cannot be attributed to a protective pharmacological property. Annual slopes for total reporting were below one for all three medicines with complete annual data but did not pass their multiplicity thresholds, so they should not be read as pharmacological tolerance or cumulative organ protection: they are aggregate calendar-time series rather than follow-up of the same patients. The declines that did remain significant were outcome-specific: ketoacidosis and ketosis reporting fell by about a third each year for dapagliflozin and by about a quarter for empagliflozin, while the canagliflozin slope for the same outcome was closer to one. A falling ketoacidosis reporting rate for the two medicines whose indications widened during the period is consistent with dilution of the denominator by patients treated for heart failure or chronic kidney disease, although changes in reporting behaviour would produce the same pattern. The classical Weber pattern of reporting peaks early after marketing has not been observed consistently in modern reporting systems [55], so time since launch alone is an insufficient explanation.
4.3. Comparison with Previous Studies
The present findings extend the earlier UK analysis for 2013–2019 [23] to a period in which SGLT2 inhibitor use expanded beyond type 2 diabetes. Matharu et al. reported that empagliflozin, the most selective agent, had the lowest suspected adverse reaction rate and related the intensity of glycosuria to selectivity [23]. In the present data, the canagliflozin excess persisted for ketoacidosis, and its amputation and peripheral tissue injury rates remained the highest, but overall reporting was no longer ordered by selectivity, suggesting that factors other than selectivity, including treated populations and reporting behaviour, dominate overall reporting. The patient-level cohort study by Douros et al. reported a similar ordering of point estimates for ketoacidosis within type 2 diabetes, in an indirect comparison against a common comparator [49]. In our analysis of GLP-1-based therapies, reporting rates varied more than 200-fold, and the denominator omitted private prescribing, which supplies most UK weight-management use [33]; the 1.70-fold range among SGLT2 inhibitors is narrow by comparison, although a narrow range cannot by itself establish that the denominator is complete.
4.4. Strengths and Limitations
This study related national spontaneous reporting data to national prescribing data for four SGLT2 inhibitors over the same five calendar years, used formal between-medicine comparisons with correction for multiple testing, tested the sensitivity of each conclusion to the outcome definition, the counting unit, the denominator and the omission of single years, added a within-class disproportionality analysis that does not depend on prescribing data at all, and interpreted the findings against molecule-specific pharmacology, earlier UK reporting data and patient-level evidence.
Several limitations should be considered. Spontaneous reporting is incomplete and susceptible to stimulated reporting, and a report does not establish causality [29,30,31]. Reaction entries within a report are not independent, and overlapping outcomes may count the same clinical episode, so the confidence intervals are likely to be too narrow; because the models compare four aggregated medicine rows, overdispersion could not be estimated, and exact conditional Poisson intervals are therefore reported throughout (Table 2 and Table 3, Table S5 and Table S6). The ketoacidosis and ketosis composite included ketosis and ketone-related laboratory terms, and no outcome was clinically adjudicated, although restricting the definition changed the estimates little (Table 3). Peripheral tissue injury is a composite assembled for this study rather than a standardised MedDRA query, so that comparison should be confirmed against an independently specified definition. Prescribed items are not patients or person-time, and information on indication, dose, duration, diabetes status and comorbidity was unavailable, so differences between treated populations could not be adjusted for.
Regulatory communications may have influenced reporting differentially. After an Article 20 referral prompted by the canagliflozin trial data, a warning about lower-limb amputation was added in 2017 to the product information of canagliflozin, dapagliflozin and empagliflozin, but canagliflozin alone also lists lower-limb amputation as an uncommon adverse reaction [21,22]; ketoacidosis and Fournier’s gangrene were the subject of UK advice for the whole class in 2016 and 2019 [18,19]. These communications all precede the study period, so the transient rise in reporting that follows an alert had passed, but the difference in labelling persists and may keep reporters more likely to associate an amputation with canagliflozin. Such notoriety bias [31] cannot be quantified with these data and is an alternative explanation for the two outcomes in which canagliflozin stood out most, amputation and peripheral tissue injury. It is a less plausible explanation for ketoacidosis, for which the class-wide advice applied equally to all four medicines.
The reaction data cover the UK but the prescribing data cover England only, which inflates absolute rates and could bias comparisons if medicine use differed between the UK nations. Hospital exposure was estimated from defined daily doses under assumptions about the quantity per item, hospital formulations that could not be matched contribute no estimate, and hospital items accounted for at most 2.3% of exposure. General practice exposure includes fixed-dose combination products, but the corresponding hospital products could not be verified, so combined exposure is slightly incomplete for the medicines with such products. Whether the calendar year recorded in the reaction data refers to first receipt or to the most recent revision of a report could not be resolved, which affects the placement of reports in annual models. Annual counts for ertugliflozin were unavailable for 2021 and 2023 and were not imputed as zero, so its 13 entries support only full-period comparisons.
The annual models used five observations per medicine and three residual degrees of freedom; in leave-one-year-out fits the declining dapagliflozin ketoacidosis slope was stable, whereas the empagliflozin slope kept its direction but lost significance, so the inferential strength depends on the complete five-year series. The interaction test has correspondingly little power. The within-class disproportionality analysis avoids the denominator problems above, but it compares shares, so an excess for one outcome lowers the ratios for the others; its comparator is the rest of the class, so a ratio below one means a smaller share of entries and not a lower risk; it counts reaction entries rather than unique reports, so its confidence intervals assume an independence that reports with several reaction terms do not provide and are likely to be too narrow; and it is not adjusted for multiplicity. Sex-specific and seriousness-specific denominators were unavailable, so those analyses describe the composition of reports. Finally, the pharmacological interpretation is inferential: the comparisons with earlier UK data and the cohort study involve different outcome definitions, counting units, denominators and periods (Table 10), and the proposed mechanisms remain hypotheses.
4.5. Implications and Future Research
Exposure-adjusted reporting, interpreted together with molecule-specific pharmacology and changes in treated populations, can help prioritise questions for patient-level evaluation. The persistence of higher ketoacidosis reporting for canagliflozin across periods and data sources supports continued monitoring of ketoacidosis with this medicine, and comparisons that use dapagliflozin as the reference should consider its expanded indications. Future studies should use patient-level data with information on indication, dose and diabetes status; test whether the decline in ketoacidosis reporting for dapagliflozin and empagliflozin tracks the uptake of the heart failure and kidney indications; and examine whether the amputation and peripheral tissue injury differences for canagliflozin persist in data that count unique reports.
5. Conclusions
Over five calendar years, exposure-adjusted Yellow Card reporting differed between SGLT2 inhibitors. The most consistent difference was for ketoacidosis, which was reported more often for canagliflozin and empagliflozin than for dapagliflozin under every definition, denominator and counting unit examined, and which fell over the period for the two medicines whose indications widened. Peripheral tissue injury reporting was higher for canagliflozin, whereas the amputation comparison was too sparse and too definition-dependent to support a firm conclusion. These findings are compatible with a molecule-related contribution for canagliflozin, but they are equally compatible with differences between the treated populations, with differential reporting after earlier safety communications, or with a combination of the three, and the higher ketoacidosis reporting for empagliflozin than for dapagliflozin is not explained by selectivity at all. These data cannot separate those explanations, and no ordering of them is established here. Reporting rates cannot establish incidence or causality, but combining exposure adjustment with molecule-specific pharmacology and population context can help prioritise questions for patient-level study.
Supplementary Materials
The following supporting information can be downloaded at the website of this paper posted on Preprints.org. The file contains Table S1–S18 (annual prescribing denominators; reaction-source reconciliation; report counts; outcome definitions; focused and restricted reporting rate ratios for combined and general practice-only denominators; medicine-specific annual models; interaction and leave-one-year-out analyses; denominator parity thresholds; full-period and annual within-class disproportionality; pooled rate estimates; sex, seriousness and stratified comparisons; ertugliflozin full-period comparisons; and a triangulation summary), Figure S1–S43 (reporting rates for all 43 outcomes), Figure S44 (annual within-class composition), Figure S45 (outcome-specific percentage of entries in women) and Figure S46 (within-class reporting odds ratios for all nine outcomes).
Author Contributions
Ahmed Asiri (A.A.): data curation, investigation, formal analysis, writing—original draft. Rob Daniels (R.D.): conceptualization, resources, data curation, supervision, data interpretation, writing—review and editing. Ahmed Nijim (A.N.): supervision, data interpretation, writing—review and editing. Hairil Abdul Razak (H.A.R.): supervision, data interpretation, writing—review and editing. Kinan Mokbel (K.M.): conceptualization, formal analysis, supervision, data interpretation, writing—review and editing. All authors have read and agreed to the published version of the manuscript.
Funding
This research received no external funding.
Institutional Review Board Statement
Not applicable.
Informed Consent Statement
Not applicable.
Data Availability Statement
The data used in this study are available from the MHRA Yellow Card interactive Drug Analysis Profiles [28], OpenPrescribing [39] and OpenPrescribing Hospitals [41]. The analysis datasets, the R scripts, the model outputs and the detailed result tables in comma-separated form are available from the corresponding author on request.
Acknowledgments
During preparation of this manuscript, the authors used Claude (Anthropic) for language editing. The authors are responsible for reviewing the analyses and text and for the content of the manuscript.
Conflicts of Interest
The authors declare no conflict of interest.
Abbreviations
The following abbreviations are used in this manuscript:
| ADR | adverse drug reaction |
| AMPK | AMP-activated protein kinase |
| CI | confidence interval |
| CKD | chronic kidney disease |
| DDD | defined daily dose |
| df | degrees of freedom |
| DPP-4 | dipeptidyl peptidase-4 |
| F:M | female-to-male ratio |
| GLMM | generalised linear mixed model |
| GLP-1 | glucagon-like peptide-1 |
| HR | hazard ratio |
| IC50 | half-maximal inhibitory concentration |
| LRT | likelihood-ratio test |
| MedDRA | Medical Dictionary for Regulatory Activities |
| MHRA | Medicines and Healthcare products Regulatory Agency |
| NHE1 | sodium-hydrogen exchanger 1 |
| NHS | National Health Service |
| NICE | National Institute for Health and Care Excellence |
| PT | Preferred Term |
| RRR | reporting rate ratio |
| SGLT1 | sodium-glucose cotransporter 1 |
| SGLT2 | sodium-glucose cotransporter 2 |
| UGT | uridine 5′-diphospho-glucuronosyltransferase |
| UK | United Kingdom |
Appendix A. Exact Outcome Membership
The following lists reproduce the Preferred Terms used for focused and restricted definitions. Membership was based on exact source-term matching. These study definitions are not presented as validated Standardised MedDRA Queries. The complete definition file covering the 43 descriptive outcomes and three restricted definitions is included in the reproducibility dataset.
Total ADRs
All Preferred Term reaction entries in the selected medicine and period; System Organ Class subtotals are not added again.
Ketoacidosis and Ketosis
Diabetic ketoacidosis; Euglycaemic diabetic ketoacidosis; Ketoacidosis; Ketosis; Diabetic ketosis; Blood ketone body increased; Ketonuria
Euglycaemic Ketoacidosis
Euglycaemic diabetic ketoacidosis
Genital Infection Composite
Vulvovaginal candidiasis; Balanitis candida; Genital candidiasis; Vulvovaginal mycotic infection; Genital infection fungal; Fungal balanitis; Balanoposthitis; Vulvovaginitis
Fournier / Necrotising Fasciitis
Fournier's gangrene; Necrotising fasciitis
Urinary Tract Infection and Urosepsis
Urinary tract infection; Urosepsis; Pyelonephritis; Pyelonephritis acute; Genitourinary tract infection
Volume Depletion
Dehydration; Hypotension; Orthostatic hypotension; Syncope; Presyncope; Hypovolaemia
Acute kidney Injury and Renal Failure
Acute kidney injury; Renal failure; Renal impairment
Amputation Including Finger
Amputation; Toe amputation; Foot amputation; Leg amputation; Limb amputation; Finger amputation
Peripheral Tissue Injury
Skin ulcer; Peripheral ischaemia; Necrosis; Gangrene; Dry gangrene; Diabetic foot; Diabetic foot infection
Diagnostic Ketoacidosis
Diabetic ketoacidosis; Euglycaemic diabetic ketoacidosis; Ketoacidosis
Lower Limb Amputation Only
Toe amputation; Foot amputation; Leg amputation
Fournier Gangrene Only
Fournier's gangrene
References
- Zinman, B.; Wanner, C.; Lachin, J.M.; et al. Empagliflozin, Cardiovascular Outcomes, and Mortality in Type 2 Diabetes. N. Engl. J. Med. 2015, 373, 2117–2128. [CrossRef]
- Neal, B.; Perkovic, V.; Mahaffey, K.W.; et al. Canagliflozin and Cardiovascular and Renal Events in Type 2 Diabetes. N. Engl. J. Med. 2017, 377, 644–657. [CrossRef]
- Wiviott, S.D.; Raz, I.; Bonaca, M.P.; et al. Dapagliflozin and Cardiovascular Outcomes in Type 2 Diabetes. N. Engl. J. Med. 2019, 380, 347–357. [CrossRef]
- Cannon, C.P.; Pratley, R.E.; Dagogo-Jack, S.; et al. Cardiovascular Outcomes with Ertugliflozin in Type 2 Diabetes. N. Engl. J. Med. 2020, 383, 1425–1435. [CrossRef]
- Perkovic, V.; Jardine, M.J.; Neal, B.; et al. Canagliflozin and Renal Outcomes in Type 2 Diabetes and Nephropathy. N. Engl. J. Med. 2019, 380, 2295–2306. [CrossRef]
- McMurray, J.J.V.; Solomon, S.D.; Inzucchi, S.E.; et al. Dapagliflozin in Patients with Heart Failure and Reduced Ejection Fraction. N. Engl. J. Med. 2019, 381, 1995–2008. [CrossRef]
- Anker, S.D.; Butler, J.; Filippatos, G.; et al. Empagliflozin in Heart Failure with a Preserved Ejection Fraction. N. Engl. J. Med. 2021, 385, 1451–1461. [CrossRef]
- The EMPA-KIDNEY Collaborative Group. Empagliflozin in Patients with Chronic Kidney Disease. N. Engl. J. Med. 2023, 388, 117–127. [CrossRef]
- Nuffield Department of Population Health Renal Studies Group; SGLT2 inhibitor Meta-Analysis Cardio-Renal Trialists’ Consortium. Impact of Diabetes on the Effects of Sodium Glucose Co-Transporter-2 Inhibitors on Kidney Outcomes: Collaborative Meta-Analysis of Large Placebo-Controlled Trials. Lancet 2022, 400, 1788–1801. [CrossRef]
- Neuen, B.L.; Fletcher, R.A.; Anker, S.D.; et al. SGLT2 Inhibitors and Kidney Outcomes by Glomerular Filtration Rate and Albuminuria: A Meta-Analysis. JAMA 2026, 335, 233–244. [CrossRef]
- Menarini Farmaceutica Internazionale SRL. Invokana 100 mg Film-Coated Tablets: Summary of Product Characteristics. Available online: https://www.medicines.org.uk/emc/product/8855/smpc (accessed on 14 September 2026).
- AstraZeneca UK Limited. Forxiga 10 mg Film-Coated Tablets: Summary of Product Characteristics. Available online: https://www.medicines.org.uk/emc/product/7607/smpc (accessed on 15 September 2026).
- Boehringer Ingelheim Limited. Empagliflozin 10 mg Film-Coated Tablets (Previously Known as Jardiance): Summary of Product Characteristics. Available online: https://www.medicines.org.uk/emc/product/5441/smpc (accessed on 15 September 2026).
- Merck Sharp & Dohme (UK) Limited. Steglatro 5 mg Film-Coated Tablets: Summary of Product Characteristics. Available online: https://www.medicines.org.uk/emc/product/9803/smpc (accessed on 15 September 2026).
- Merovci, A.; Solis-Herrera, C.; Daniele, G.; et al. Dapagliflozin Improves Muscle Insulin Sensitivity but Enhances Endogenous Glucose Production. J. Clin. Investig. 2014, 124, 509–514. [CrossRef]
- Ferrannini, E.; Baldi, S.; Frascerra, S.; et al. Renal Handling of Ketones in Response to Sodium–Glucose Cotransporter 2 Inhibition in Patients with Type 2 Diabetes. Diabetes Care 2017, 40, 771–776. [CrossRef]
- Zelniker, T.A.; Braunwald, E. Cardioprotective Properties of Empagliflozin and Other SGLT2 Inhibitors. Nat. Rev. Cardiol. 2026, advance online publication, 27 July 2026. [CrossRef]
- Medicines and Healthcare products Regulatory Agency. SGLT2 Inhibitors: Updated Advice on the Risk of Diabetic Ketoacidosis. Drug Safety Update, 18 April 2016. Available online: https://www.gov.uk/drug-safety-update/sglt2-inhibitors-updated-advice-on-the-risk-of-diabetic-ketoacidosis (accessed on 15 September 2026).
- Medicines and Healthcare products Regulatory Agency. SGLT2 Inhibitors: Reports of Fournier’s Gangrene (Necrotising Fasciitis of the Genitalia or Perineum). Drug Safety Update, 18 February 2019. Available online: https://www.gov.uk/drug-safety-update/sglt2-inhibitors-reports-of-fournier-s-gangrene-necrotising-fasciitis-of-the-genitalia-or-perineum (accessed on 14 September 2026).
- Puckrin, R.; Saltiel, M.-P.; Reynier, P.; Azoulay, L.; Yu, O.H.Y.; Filion, K.B. SGLT-2 Inhibitors and the Risk of Infections: A Systematic Review and Meta-Analysis of Randomised Controlled Trials. Acta Diabetol. 2018, 55, 503–514. [CrossRef]
- Medicines and Healthcare products Regulatory Agency. SGLT2 Inhibitors: Updated Advice on Increased Risk of Lower-Limb Amputation (Mainly Toes). Drug Safety Update, 22 March 2017. Available online: https://www.gov.uk/drug-safety-update/sglt2-inhibitors-updated-advice-on-increased-risk-of-lower-limb-amputation-mainly-toes (accessed on 14 September 2026).
- European Medicines Agency. SGLT2 Inhibitors (Previously Canagliflozin): Article 20 Referral. Available online: https://www.ema.europa.eu/en/medicines/human/referrals/sglt2-inhibitors-previously-canagliflozin (accessed on 15 September 2026).
- Matharu, K.; Chana, K.; Ferro, C.J.; Jones, A.M. Polypharmacology of Clinical Sodium Glucose Co-Transport Protein 2 Inhibitors and Relationship to Suspected Adverse Drug Reactions. Pharmacol. Res. Perspect. 2021, 9, e00867. [CrossRef]
- Polidori, D.; Sha, S.; Mudaliar, S.; et al. Canagliflozin Lowers Postprandial Glucose and Insulin by Delaying Intestinal Glucose Absorption in Addition to Increasing Urinary Glucose Excretion: Results of a Randomized, Placebo-Controlled Study. Diabetes Care 2013, 36, 2154–2161. [CrossRef]
- Hawley, S.A.; Ford, R.J.; Smith, B.K.; Gowans, G.J.; Mancini, S.J.; Pitt, R.D.; Day, E.A.; Salt, I.P.; Steinberg, G.R.; Hardie, D.G. The Na+/Glucose Cotransporter Inhibitor Canagliflozin Activates AMPK by Inhibiting Mitochondrial Function and Increasing Cellular AMP Levels. Diabetes 2016, 65, 2784–2794. [CrossRef]
- American Diabetes Association. Publisher’s Note. Diabetes 2026, 75, 224. [CrossRef]
- Behnammanesh, G.; Durante, Z.E.; Peyton, K.J.; Martinez-Lemus, L.A.; Brown, S.M.; Bender, S.B.; Durante, W. Canagliflozin Inhibits Human Endothelial Cell Proliferation and Tube Formation. Front. Pharmacol. 2019, 10, 362. [CrossRef]
- Medicines and Healthcare products Regulatory Agency. Yellow Card Interactive Drug Analysis Profiles. Available online: https://yellowcard.mhra.gov.uk/idaps (initial access on 14 September 2026; final source verification on 21 September 2026).
- Medicines and Healthcare products Regulatory Agency. Detailed Drug Analysis Print Interpretation Guide. Available online: https://assets.publishing.service.gov.uk/media/669e21590808eaf43b50d375/DAP_guidance__004_.pdf (accessed on 4 October 2026).
- Hazell, L.; Shakir, S.A.W. Under-Reporting of Adverse Drug Reactions: A Systematic Review. Drug Saf. 2006, 29, 385–396. [CrossRef]
- Pariente, A.; Gregoire, F.; Fourrier-Reglat, A.; Haramburu, F.; Moore, N. Impact of Safety Alerts on Measures of Disproportionality in Spontaneous Reporting Databases: The Notoriety Bias. Drug Saf. 2007, 30, 891–898. [CrossRef]
- Mokbel, K.; Daniels, R.; Weedon, M.N.; Jackson, L. A Comparative Safety Analysis of Medicines Based on the UK Pharmacovigilance and General Practice Prescribing Data in England. In Vivo 2022, 36, 780–800. [CrossRef]
- Asiri, A.; Daniels, R.; Nijim, A.; Abdul Razak, H.; Mokbel, K. Comparative Exposure-Adjusted Adverse Reaction Reporting Rates for GLP-1-Based Therapies: An Analysis of UK MHRA Yellow Card Data and NHS Prescribing Data for England. Preprints 2026, 2026081213. [CrossRef]
- National Institute for Health and Care Excellence. Dapagliflozin for Treating Chronic Heart Failure with Reduced Ejection Fraction; Technology Appraisal Guidance TA679; NICE: London, UK, 2021. Available online: https://www.nice.org.uk/guidance/ta679 (accessed on 15 September 2026).
- AstraZeneca UK Limited. Forxiga (Dapagliflozin) 5 mg Should No Longer Be Used for the Treatment of Type 1 Diabetes Mellitus. Direct Healthcare Professional Communication, 2 November 2021. Available online: https://assets.publishing.service.gov.uk/media/619374948fa8f5037ffaa083/20211102-uk-dhpc-forxiga-T1D-withdrawal.pdf (accessed on 15 September 2026).
- Evans SJW, Waller PC, Davis S. Use of proportional reporting ratios (PRRs) for signal generation from spontaneous adverse drug reaction reports. Pharmacoepidemiology and Drug Safety. 2001;10(6):483–486.
- Gravel, C.A.; Bai, W.; Douros, A. Comparators in Pharmacovigilance: A Quasi-Quantification Bias Analysis. Drug Saf. 2024, 47, 809–819. [CrossRef]
- European Medicines Agency. Screening for Adverse Reactions in EudraVigilance; EMA/849944/2016; Inspections, Human Medicines, Pharmacovigilance and Committees Division: London, UK, 19 December 2016. Available online: https://www.ema.europa.eu/en/documents/other/screening-adverse-reactions-eudravigilance_en.pdf (accessed on 25 September 2026).
- Bennett Institute for Applied Data Science, University of Oxford. OpenPrescribing.net. Available online: https://openprescribing.net (accessed on 18 September 2026).
- NHS Business Services Authority. English Prescribing Data (EPD). Available online: https://www.nhsbsa.nhs.uk/prescription-data/prescribing-data/english-prescribing-data-epd (accessed on 18 September 2026).
- Bennett Institute for Applied Data Science, University of Oxford. OpenPrescribing Hospitals: Frequently Asked Questions. Available online: https://hospitals.openprescribing.net/faq/ (accessed on 14 September 2026).
- WHO Collaborating Centre for Drug Statistics Methodology. ATC/DDD Index: A10BK. Available online: https://atcddd.fhi.no/atc_ddd_index/?code=A10BK (accessed on 15 September 2026).
- Garwood F. Fiducial Limits for the Poisson Distribution. Biometrika. 1936;28(3–4):437–442.
- Schwarzer G and contributors. meta: General Package for Meta-Analysis. R package version 8.5-0. 2026. See metarate and forest.meta documentation. https://cran.r-project.org/web/packages/meta/meta.pdf.
- R Core Team. Exact Poisson tests: poisson.test. R stats package documentation. https://stat.ethz.ch/R-manual/R-devel/library/stats/html/poisson.test.html.
- Holm S. A Simple Sequentially Rejective Multiple Test Procedure. Scandinavian Journal of Statistics. 1979;6(2):65–70. https://www.jstor.org/stable/4615733. Implementation: R Core Team, p.adjust. https://stat.ethz.ch/R-manual/R-devel/library/stats/html/p.adjust.html.
- R Core Team. Summarizing Generalized Linear Model Fits: summary.glm. R stats package documentation. https://stat.ethz.ch/R-manual/R-devel/library/stats/html/summary.glm.html.
- R Core Team. Pearson’s Chi-squared Test for Count Data: chisq.test. R stats package documentation. https://stat.ethz.ch/R-manual/R-devel/library/stats/html/chisq.test.html.
- Douros, A.; Lix, L.M.; Fralick, M.; et al. Sodium–Glucose Cotransporter-2 Inhibitors and the Risk for Diabetic Ketoacidosis: A Multicenter Cohort Study. Ann. Intern. Med. 2020, 173, 417–425. [CrossRef]
- Chung, Y.J.; Park, K.C.; Tokar, S.; et al. Off-Target Effects of Sodium-Glucose Co-Transporter 2 Blockers: Empagliflozin Does Not Inhibit Na+/H+ Exchanger-1 or Lower [Na+]i in the Heart. Cardiovasc. Res. 2021, 117, 2794–2806. [CrossRef]
- Mourad, O.; Vohra, S.; Nunes, S.S. Single Cell Transcriptomic Analysis of SGLT2 Expression Supports an Indirect or Off-Target Role for the Cardioprotective Benefits of Empagliflozin in Heart Failure. Sci. Rep. 2025, 15, 8265. [CrossRef]
- Fediuk, D.J.; Nucci, G.; Dawra, V.K.; et al. Overview of the Clinical Pharmacology of Ertugliflozin, a Novel Sodium-Glucose Cotransporter 2 (SGLT2) Inhibitor. Clin. Pharmacokinet. 2020, 59, 949–965. [CrossRef]
- Nyirjesy, P.; Zhao, Y.; Ways, K.; Usiskin, K. Evaluation of Vulvovaginal Symptoms and Candida Colonization in Women with Type 2 Diabetes Mellitus Treated with Canagliflozin, a Sodium Glucose Co-Transporter 2 Inhibitor. Curr. Med. Res. Opin. 2012, 28, 1173–1178. [CrossRef]
- van Bommel, E.J.M.; Muskiet, M.H.A.; van Baar, M.J.B.; et al. The Renal Hemodynamic Effects of the SGLT2 Inhibitor Dapagliflozin Are Caused by Post-Glomerular Vasodilatation Rather than Pre-Glomerular Vasoconstriction in Metformin-Treated Patients with Type 2 Diabetes in the Randomized, Double-Blind RED Trial. Kidney Int. 2020, 97, 202–212. [CrossRef]
- Hoffman, K.B.; Dimbil, M.; Erdman, C.B.; Tatonetti, N.P.; Overstreet, B.M. The Weber Effect and the United States Food and Drug Administration’s Adverse Event Reporting System (FAERS): Analysis of Sixty-Two Drugs Approved from 2006 to 2010. Drug Saf. 2014, 37, 283–294. [CrossRef]
Figure 1.
Reporting rates for all reaction entries per million combined prescribed items, 2021–2025. The common-effect estimate is labelled “fixed effect model” and the random-effects estimate is from a Poisson-normal generalised linear mixed model; I2, τ2 and the heterogeneity p value are shown below the plot. The four medicines are the units being pooled, so these summaries are descriptive and are not a meta-analysis of independent studies. CI, confidence interval.
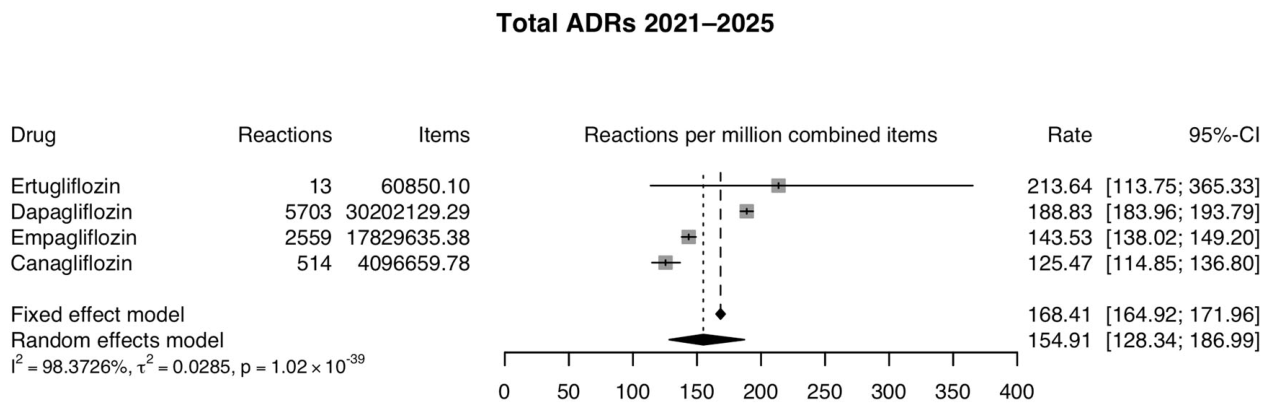
Figure 2.
Reporting rates for the ketoacidosis and ketosis composite per million combined prescribed items. The composite includes diagnostic ketoacidosis terms, ketosis and ketone-related laboratory terms; the restricted diagnostic definition is shown in Table 3. Details as in Figure 1.
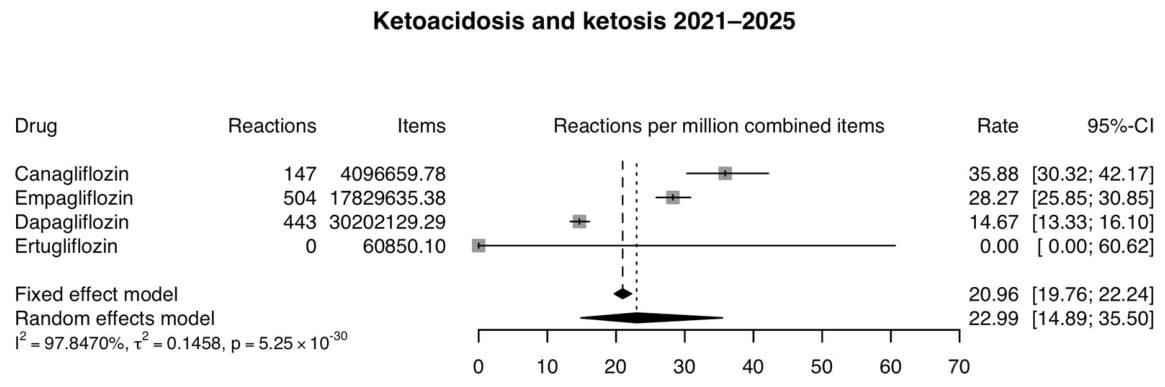
Figure 3.
Reporting rates for the amputation composite, which includes finger and site-unspecified terms. Counts are sparse and the estimates are sensitive to the definition (Table 3). Details as in Figure 1.
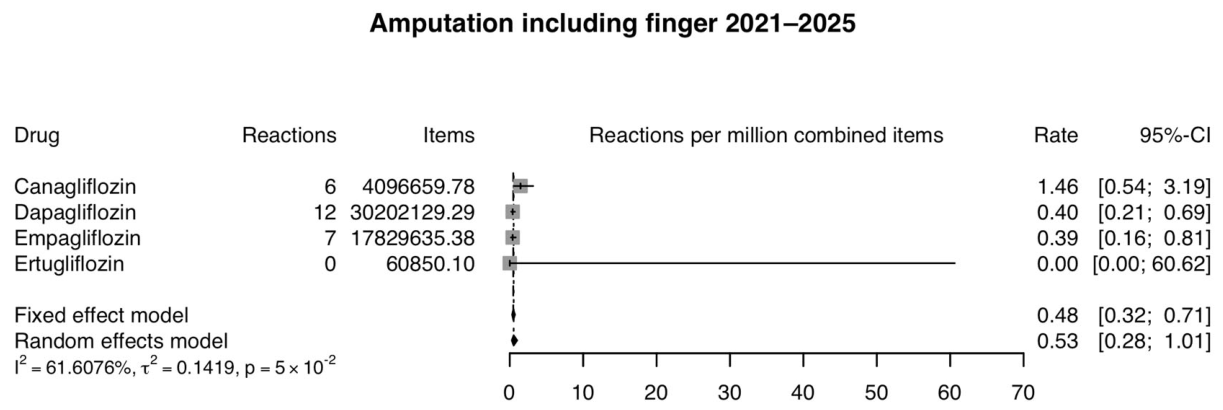
Figure 4.
Reporting rates for peripheral tissue injury, a broader composite that is distinct from amputation and must not be read as its equivalent. Details as in Figure 1.
Figure 4.
Reporting rates for peripheral tissue injury, a broader composite that is distinct from amputation and must not be read as its equivalent. Details as in Figure 1.
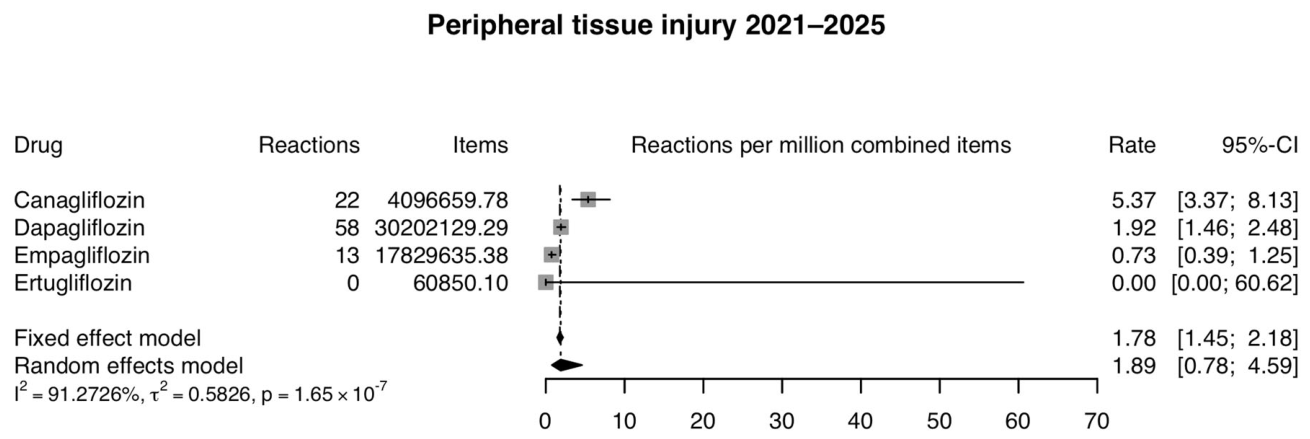
Table 1.
Reaction entries, prescribed items and total reporting rates by medicine, 2021–2025.
| Medicine | Reaction Entries | General Practice Items | Estimated Hospital Items | Combined Items | Rate (95% CI) |
|---|---|---|---|---|---|
| Canagliflozin | 514 | 4,069,480 | 27,180 | 4,096,660 | 125.47 (114.85–136.80) |
| Dapagliflozin | 5703 | 29,520,986 | 681,143 | 30,202,129 | 188.83 (183.96–193.79) |
| Empagliflozin | 2559 | 17,659,451 | 170,184 | 17,829,635 | 143.53 (138.02–149.20) |
| Ertugliflozin | 13 | 60,739 | 111 | 60,850 | 213.64 (113.75–365.33) |
| All medicines | 8789 | 51,310,656 | 878,619 | 52,189,275 | 168.41 a (164.92–171.96) |
Rates are reaction entries per million combined prescribed items with exact (Garwood) Poisson 95% confidence intervals (CIs). General practice items include fixed-dose combination products containing the medicine. Hospital items were estimated from defined daily doses and are rounded to whole numbers. a Pooled crude rate (common-effect estimate); the random-effects estimate was 154.91 (128.34–186.99) per million items.
Table 2.
Reporting rate ratios for canagliflozin and empagliflozin relative to dapagliflozin, 2021–2025.
Table 2.
Reporting rate ratios for canagliflozin and empagliflozin relative to dapagliflozin, 2021–2025.
| Outcome | Dapagliflozin | Canagliflozin | Empagliflozin | ||||
|---|---|---|---|---|---|---|---|
| n | n | RRR (95% CI) | Holm p | n | RRR (95% CI) | Holm p | |
| All reaction entries | 5703 | 514 | 0.66 (0.61–0.73) | <0.001 | 2559 | 0.76 (0.73–0.80) | <0.001 |
| Ketoacidosis and ketosis | 443 | 147 | 2.45 (2.02–2.95) | <0.001 | 504 | 1.93 (1.69–2.19) | <0.001 |
| Euglycaemic ketoacidosis | 128 | 41 | 2.36 (1.62–3.38) | <0.001 | 171 | 2.26 (1.79–2.87) | <0.001 |
| Genital infection | 199 | 15 | 0.56 (0.31–0.94) | 0.497 | 109 | 0.93 (0.73–1.18) | 1.000 |
| Fournier’s gangrene or necrotising fasciitis | 155 | 28 | 1.33 (0.86–2.00) | 1.000 | 97 | 1.06 (0.81–1.38) | 1.000 |
| Urinary tract infection and urosepsis | 147 | 5 | 0.25 (0.08–0.60) | 0.006 | 72 | 0.83 (0.62–1.11) | 1.000 |
| Volume depletion | 70 | 4 | 0.42 (0.11–1.13) | 1.000 | 29 | 0.70 (0.44–1.10) | 1.000 |
| Acute kidney injury and renal failure | 57 | 5 | 0.65 (0.20–1.60) | 1.000 | 13 | 0.39 (0.19–0.71) | 0.024 |
| Amputation (including finger) | 12 | 6 | 3.69 (1.14–10.61) | 0.301 | 7 | 0.99 (0.33–2.72) | 1.000 |
| Peripheral tissue injury | 58 | 22 | 2.80 (1.63–4.64) | 0.004 | 13 | 0.38 (0.19–0.70) | 0.018 |
Rate ratios correspond to Poisson regression of reaction entries on medicine with log combined prescribed items as an offset; dapagliflozin is the reference. Confidence intervals (CIs) and unadjusted p values are from exact conditional Poisson comparisons. CIs are marginal and not adjusted for multiplicity; statistical significance is judged on Holm-adjusted p values across 30 planned comparisons (10 outcomes × 3 comparator medicines). Ertugliflozin had 13 entries in total and none for the nine specific outcomes; its comparisons are shown in Table S17. Lower ratios describe reporting, not protection. RRR, reporting rate ratio.
Table 3.
Restricted-definition sensitivity analyses, 2021–2025.
| Restricted Outcome | Dapagliflozin | Canagliflozin | Empagliflozin | ||||
|---|---|---|---|---|---|---|---|
| n | n | RRR (95% CI) | Holm p | n | RRR (95% CI) | Holm p | |
| Diagnostic ketoacidosis terms only | 420 | 141 | 2.48 (2.03–3.00) | <0.001 | 472 | 1.90 (1.67–2.18) | <0.001 |
| Lower-limb amputation only | 11 | 4 | 2.68 (0.62–9.05) | 0.662 | 5 | 0.77 (0.21–2.40) | 1.000 |
| Fournier’s gangrene only | 118 | 22 | 1.37 (0.83–2.18) | 1.000 | 84 | 1.21 (0.90–1.61) | 1.000 |
Definitions restricted to diagnostic ketoacidosis terms (excluding ketosis and ketone-related laboratory terms), to lower-limb amputation terms (excluding finger and site-unspecified terms) and to Fournier’s gangrene (excluding necrotising fasciitis at other sites). Holm adjustment covers the nine restricted comparisons as a separate family from Table 2. RRR, reporting rate ratio.
Table 4.
Annual reporting rate ratios by medicine, 2021–2025 (quasi-Poisson regression).
| Outcome and Counting Unit | Medicine | Annual Rate Ratio (95% CI) | Dispersion | p | Holm p |
|---|---|---|---|---|---|
| All reaction entries | Canagliflozin | 0.88 (0.78–0.99) | 1.30 | 0.037 | 0.119 |
| All reaction entries | Dapagliflozin | 0.84 (0.59–1.18) | 111.63 | 0.198 | 0.397 |
| All reaction entries | Empagliflozin | 0.89 (0.81–0.98) | 4.17 | 0.030 | 0.119 |
| Total reports | Canagliflozin | 0.93 (0.80–1.08) | 1.51 | 0.207 | 0.414 |
| Total reports | Dapagliflozin | 0.86 (0.79–0.95) | 4.15 | 0.014 | 0.058 |
| Total reports | Empagliflozin | 0.87 (0.80–0.95) | 2.39 | 0.014 | 0.058 |
| Ketoacidosis and ketosis | Canagliflozin | 0.89 (0.63–1.25) | 3.34 | 0.346 | 0.692 |
| Ketoacidosis and ketosis | Dapagliflozin | 0.68 (0.62–0.75) | 0.74 | 0.001 | 0.004 |
| Ketoacidosis and ketosis | Empagliflozin | 0.76 (0.64–0.90) | 2.81 | 0.014 | 0.041 |
Each model used five annual observations with three residual degrees of freedom, calendar year centred at 2021 and the logarithm of annual combined prescribed items as an offset; intervals are quasi-Poisson t intervals. A rate ratio below one indicates a declining reporting rate per captured item. Ertugliflozin was not modelled because annual counts for 2021 and 2023 were unavailable. Holm adjustment covers the four planned medicine-specific slopes within each outcome, counting unit, denominator and model. Poisson results and general practice-only denominators are in Table S7. CI, confidence interval.
Table 5.
Medicine-by-year interaction tests, 2021–2025.
| Outcome and Counting Unit | Observations | Dispersion | Quasi-Poisson p | Poisson p |
|---|---|---|---|---|
| All reaction entries | 15 | 39.03 | 0.839 | <0.001 |
| Total reports | 15 | 2.68 | 0.570 | 0.200 |
| Ketoacidosis and ketosis | 15 | 2.29 | 0.083 | <0.001 |
Models included medicine, centred calendar year and their interaction with the logarithm of annual combined items as an offset; quasi-Poisson F tests used 2 and 9 degrees of freedom. Because dispersion was substantial, the quasi-Poisson results are the primary interpretation. No interaction reached p < 0.05, which is insufficient evidence of different slopes rather than evidence that the slopes are identical. Ertugliflozin was excluded.
Table 7.
Sex distribution of reaction entries by medicine, 2021–2025.
| Medicine | Female, n | Male, n | Not Recorded, n | F:M | Female, % known sex |
|---|---|---|---|---|---|
| Canagliflozin | 212 | 277 | 25 | 0.77 | 43.4 |
| Dapagliflozin | 2450 | 3051 | 202 | 0.80 | 44.5 |
| Empagliflozin | 1125 | 1285 | 149 | 0.88 | 46.7 |
| Ertugliflozin | 6 | 7 | 0 | 0.86 | 46.2 |
F, entries recorded as female; M, entries recorded as male; F:M, female-to-male ratio. Entries not recorded as female or male are all remaining entries. Sex-specific prescribing denominators were unavailable, so these data describe the composition of reports and not sex differences in risk. Outcome-specific counts are in Table S14.
Table 8.
Reaction entries within reports classified as serious or fatal, and entries with a fatal outcome, 2021–2025.
Table 8.
Reaction entries within reports classified as serious or fatal, and entries with a fatal outcome, 2021–2025.
| Medicine | All Entries | Serious or Fatal Reports | Fatal Reaction Outcome | ||
|---|---|---|---|---|---|
| n (%) | Rate (95% CI) | n | Rate (95% CI) | ||
| Canagliflozin | 514 | 415 (80.7) | 101.30 (91.79–111.53) | 4 | 0.98 (0.27–2.50) |
| Dapagliflozin | 5703 | 3956 (69.4) | 130.98 (126.93–135.13) | 39 | 1.29 (0.92–1.77) |
| Empagliflozin | 2559 | 1760 (68.8) | 98.71 (94.15–103.43) | 18 | 1.01 (0.60–1.60) |
| Ertugliflozin | 13 | 9 (69.2) | 147.90 (67.63–280.77) | 0 | 0.00 (0.00–60.62) |
Counts are reaction entries within reports that the source classified as serious or fatal, not unique serious reports, and do not establish that every listed reaction was itself serious. Entries with a fatal outcome are a subset and must not be added to the serious or fatal stratum. Rates are per million combined prescribed items with exact Poisson confidence intervals (CIs). Outcome-specific counts are in Table S15.
Table 9.
Pharmacological and regulatory characteristics of the SGLT2 inhibitors relevant to the focused outcomes.
Table 9.
Pharmacological and regulatory characteristics of the SGLT2 inhibitors relevant to the focused outcomes.
| Characteristic | Canagliflozin | Dapagliflozin | Empagliflozin | Ertugliflozin |
|---|---|---|---|---|
| SGLT2 IC50, nM a | 2.7 | 1.2 | 3.1 | 0.87 |
| SGLT1 IC50, nM a | 710 | 1400 | 8300 | 1960 |
| Selectivity ratio, IC50(SGLT1)/IC50(SGLT2) b | ≈260 | ≈1170 | ≈2680 | ≈2250 |
| Selectivity in product information or pharmacology review | Low-potency SGLT1 inhibitor | >1400-fold | 5000-fold | >2000-fold |
| Urinary glucose excretion c | 77–119 g/day (100 or 300 mg) | ≈70 g/day (10 mg) | ≈78 g/day | Dose-dependent increase |
| Intestinal SGLT1 inhibition | Transient, after a single 300 mg dose (healthy volunteers) | Not reported | Not reported | Not reported |
| Main metabolic pathway | UGT1A9, UGT2B4 | UGT1A9 | UGT1A3, UGT1A8, UGT1A9, UGT2B7 | UGT1A9, UGT2B7 |
| Experimental off-target findings | AMPK activation via mitochondrial complex I inhibition e; inhibition of endothelial cell proliferation | No inhibition of endothelial cell proliferation at clinically relevant concentrations | No inhibition of endothelial cell proliferation at clinically relevant concentrations; no inhibition of cardiac NHE1 in one study | Not reported |
| UK licensed indications | Type 2 diabetes | Type 2 diabetes, heart failure, CKD d | Type 2 diabetes, heart failure, CKD | Type 2 diabetes |
| Amputation in outcome trials | CANVAS Program: HR 1.97 (1.41–2.75); CREDENCE: HR 1.11 (0.79–1.56) | Increase not seen; data limited | Increase not seen; data limited | VERTIS CV: 2.0% (5 mg) and 2.1% (15 mg) vs. 1.6% (placebo) |
Sources: IC50 values [23]; selectivity statements, urinary glucose excretion, metabolism and indications [11,12,13,14,52]; intestinal SGLT1 [24]; off-target findings [25,27,50]; amputation [2,5,14,22]. a Values vary between assays. b Calculated from the IC50 values shown. c From separate studies; not directly comparable. d Dapagliflozin 5 mg ceased to be authorised for type 1 diabetes from 25 October 2021 [35]. e A Publisher’s Note concerning the source article has been published [26]; findings for the other medicines in that article are not shown. AMPK, AMP-activated protein kinase; CKD, chronic kidney disease; HR, hazard ratio; IC50, half-maximal inhibitory concentration; NHE1, sodium-hydrogen exchanger 1; SGLT, sodium-glucose cotransporter; UGT, uridine 5′-diphospho-glucuronosyltransferase.
Table 10.
Reporting patterns for canagliflozin, dapagliflozin and empagliflozin across data sources and periods.
Table 10.
Reporting patterns for canagliflozin, dapagliflozin and empagliflozin across data sources and periods.
| Source (Period; Population) | Measure | Canagliflozin | Dapagliflozin | Empagliflozin | Order |
|---|---|---|---|---|---|
| Matharu et al. [23]: UK Yellow Card and English primary care prescriptions (2013–2019) | Diabetic ketoacidosis per 100,000 prescriptions | 13.00 | 16.09 | 9.62 | D > C > E |
| Present study: UK Yellow Card and English NHS prescribed items (2021–2025) | Ketoacidosis and ketosis per million items | 35.88 | 14.67 | 28.27 | C > E > D |
| Douros et al. [49]: cohort in seven Canadian provinces and the UK (2013–2018); new users with type 2 diabetes | Diabetic ketoacidosis, HR (95% CI) vs. DPP-4 inhibitors | 3.58 (2.13–6.03) | 1.86 (1.11–3.10) | 2.52 (1.23–5.14) | C > E > D |
| Matharu et al. [23] | Amputation terms per 100,000 prescriptions a | 1.56 | 0.43 | 0.35 | C > D > E |
| Present study | Amputation composite per million items | 1.46 | 0.40 | 0.39 | C > D ≈ E |
| Matharu et al. [23] | Total ADRs per 100,000 prescriptions | 82 | 78 | 44.07 | C > D > E |
| Present study | Total reactions per million items | 125.47 | 188.83 | 143.53 | D > E > C |
Measures differ in outcome definition, counting unit, denominator and period and are not directly comparable; the rank order and ratios between medicines are the relevant comparison. Present-study values are from Table 1 and Figure 2 and Figure 3. The hazard ratios of Douros et al. compare each medicine with dipeptidyl peptidase-4 inhibitors and not with the other SGLT2 inhibitors, so that order is an indirect comparison. a Amputation Preferred Terms only (14, 9 and 10 entries for canagliflozin, dapagliflozin and empagliflozin), calculated from Table 3 of that study and the prescription numbers implied by its total reaction counts and rates. The text of that study quotes 1.17, 0.57 and 0.53; the last two are the totals for the whole surgical and medical procedures category, which also includes non-amputation terms. ADR, adverse drug reaction; C, canagliflozin; CI, confidence interval; D, dapagliflozin; DPP-4, dipeptidyl peptidase-4; E, empagliflozin; HR, hazard ratio; NHS, National Health Service.
Disclaimer/Publisher’s Note: The statements, opinions and data contained in all publications are solely those of the individual author(s) and contributor(s) and not of MDPI and/or the editor(s). MDPI and/or the editor(s) disclaim responsibility for any injury to people or property resulting from any ideas, methods, instructions or products referred to in the content. |
© 2026 by the authors. Licensee MDPI, Basel, Switzerland. This article is an open access article distributed under the terms and conditions of the Creative Commons Attribution (CC BY) license.
Copyright: This open access article is published under a Creative Commons CC BY 4.0 license, which permit the free download, distribution, and reuse, provided that the author and preprint are cited in any reuse.