

Submitted:
05 October 2026
Posted:
08 October 2026
You are already at the latest version
Abstract
Population ageing is becoming increasingly widespread across regions, yet the capacity to provide adequate pension income remains territorially uneven. This study examines how the spatial distribution of ageing-related pension demand corresponds to the spatial distribution of pension provision in China. Drawing on provincial-level data for 2015 and 2023, the study conceptualizes pension income security as a socio-spatial outcome shaped by the interaction between demographic change, uneven regional development, and the territorial organization of redistribution. It combines Gini coefficients to assess spatial differentiation, Spearman rank correlations to examine demand–supply alignment, and Geographic Detector analysis to identify factors associated with spatial differentiation in pension provision. The results show that ageing-related pension demand has become a broadly distributed demographic condition, while pension provision remains substantially more differentiated across regions, particularly in economic, fiscal, and pension-fund capacity. Demand–supply associations are predominantly negative, indicating that regions facing greater ageing-related pressure often have weaker pension provision capacity. The comparison between the Urban Employee Basic Pension and the Urban and Rural Resident Basic Pension further shows that the spatial organization of redistribution matters: broader pooling and interregional adjustment are associated with a weaker correspondence between local economic conditions and pension outcomes, whereas the more territorially embedded resident pension system remains more closely associated with regional economic and income conditions. These findings highlight spatial mismatch as an important dimension of pension security in ageing societies and demonstrate how demographic pressures, uneven development, and the scale of welfare redistribution jointly shape the geography of social protection.
Keywords:
population ageing
; pension income security
; spatial mismatch
; territorialized redistribution
; uneven regional development
1. Introduction
Population ageing has become one of the defining demographic transformations of the twenty-first century. Its significance, however, extends beyond changes in population age structure. As fertility declines, longevity increases, and demographic transition advances, ageing increasingly becomes a widespread condition across national territories. This transformation changes not only the size and composition of populations but also the spatial distribution of social needs associated with later life. Pension income security is one of the most important of these needs because pensions provide a major institutional mechanism through which societies redistribute resources across the life course and protect older people against income loss after retirement. Understanding how pension systems respond to the changing geography of population ageing is therefore an important demographic and population-policy question.
Population ageing is nevertheless not distributed independently of economic and institutional conditions. The geography of ageing has historically been shaped by fertility decline, mortality change, migration, and regional differences in socioeconomic development. Selective migration of younger working-age populations, for example, can accelerate ageing in areas experiencing persistent population outflows, while economically dynamic regions may attract younger workers and temporarily moderate their ageing pressures. As demographic transition becomes more advanced, however, ageing is no longer confined to particular peripheral, rural, or economically declining areas. It increasingly spreads across regions, creating a more generalized geography of demographic ageing. This raises a fundamental question: does the spatial distribution of resources available to support older populations change at the same pace as the spatial distribution of ageing-related needs?
Pension income security provides a particularly useful setting in which to examine this question. Pension income refers here to regular cash payments received through institutionalized pension systems after retirement, while pension income security denotes the extent to which these institutions provide adequate and sustainable income protection for older people. Existing research has examined pension security primarily from demographic, economic, and institutional perspectives. Demographic research emphasizes population ageing, dependency ratios, longevity, and the resulting pressures on pension systems. Economic research focuses on employment, income, fiscal resources, and the sustainability of pension financing. Institutional research examines pension design, contribution arrangements, benefit adequacy, and the organization of redistribution. These approaches have generated important insights, but they have often examined pension demand and pension provision separately. Consequently, less attention has been paid to whether the geographical distribution of pension resources corresponds to the geographical distribution of ageing-related demographic pressures.
This spatial relationship is increasingly important because the geography of demographic need and the geography of economic and fiscal capacity do not necessarily coincide. Regions with relatively large older populations may have weaker economic foundations, narrower contribution bases, or more limited fiscal resources, particularly where long-term population out-migration has reduced the working-age population. Conversely, economically dynamic regions may possess stronger fiscal and pension financing capacity while facing comparatively lower ageing-related dependency pressures. The resulting relationship cannot be captured adequately by examining either the level of population ageing or the level of pension provision alone. What matters is their spatial alignment.
This study conceptualizes this problem as a spatial mismatch between convergent demographic demand and territorially organized pension supply. The concept of convergent demand refers to the increasingly widespread geographical distribution of ageing-related pension pressures as demographic transition matures. It does not imply that all regions face identical demographic conditions, nor does it imply that spatial inequality in ageing necessarily declines continuously over time. Rather, it emphasizes that ageing-related pension pressures have become substantially more generalized across the national territory. Territorialized supply, by contrast, refers to the fact that pension provision remains embedded within geographically differentiated economic, fiscal, and institutional structures. The resources available for pension provision continue to reflect regional differences in economic development, fiscal capacity, pension financing, and governance arrangements. Spatial mismatch arises when the geography of demographic need does not correspond to the geography of the resources and institutional capacity available to meet that need.
China provides an important setting for examining this relationship. Rapid demographic transition has transformed population ageing from a regional phenomenon into an increasingly nationwide condition. At the same time, China’s regions continue to differ substantially in economic development, fiscal resources, population structure, and migration patterns. These differences have important consequences for pension provision because pension financing and administration are not organized at a single uniform territorial scale. The Urban Employee Basic Pension (UEBP) has progressively incorporated broader pooling and interregional redistribution mechanisms, allowing pension financing to move beyond purely local resource bases. By contrast, the Urban and Rural Resident Basic Pension (URRBP) remains more closely associated with local fiscal capacity and territorial administration. The two programs therefore provide an important institutional contrast for examining how the scale of redistribution mediates the relationship between population ageing and pension security.
Previous studies have documented substantial regional disparities in China’s pension funds, benefit levels, fiscal subsidies, and pension financing capacity, while identifying demographic structure, economic development, fiscal conditions, and migration as important influences (Wang & Wu, 2016; Li et al., 2018; Chen & Chen, 2021; Wang & Huang, 2023; Wang et al., 2023; Zhang et al., 2023). Research has also increasingly recognized the importance of pension reform, interregional redistribution, and differences between pension programs. Nevertheless, three limitations remain particularly relevant from a population perspective.
First, existing studies tend to examine the geography of population ageing and the geography of pension provision separately. This makes it difficult to determine whether regional differences in pension resources correspond to the spatial distribution of demographic need. A regionally unequal pension system does not necessarily imply spatial mismatch: inequality may be less problematic when greater resources are directed toward areas facing greater demographic pressures. Conversely, relatively similar pension provision may conceal mismatch if ageing-related needs are highly differentiated. Examining the two distributions jointly provides a different perspective from measuring regional inequality in either ageing or pensions alone.
Second, relatively limited attention has been given to the possibility that demographic convergence and institutional territorialization may proceed simultaneously. Population ageing may become increasingly widespread across space even while the economic and fiscal foundations of pension provision remain geographically differentiated. This creates a potential divergence between the geography of demographic change and the geography of redistributive capacity. The issue is therefore not simply whether ageing is more or less unequal across regions, but whether the spatial organization of pension provision is keeping pace with the changing geography of ageing.
Third, the institutional scale of redistribution may mediate this relationship. Pension systems differ in the extent to which contributions, fiscal resources, and benefits are pooled and redistributed across territorial boundaries. Broader pooling can partially separate pension outcomes from local economic conditions, whereas territorially bounded arrangements can transmit regional differences in economic and fiscal capacity more directly into pension provision. Comparing the UEBP and URRBP allows the analysis to move beyond a general discussion of pension inequality and examine how institutional scale shapes the spatial relationship between demographic demand and pension supply.
Against this background, this study asks three questions. First, how spatially differentiated are ageing-related pension demands across Chinese provinces, and how does this compare with the spatial differentiation of pension provision? Second, to what extent is the spatial distribution of pension supply aligned with the distribution of ageing-related demographic pressure? Third, how do demographic, economic, fiscal, and institutional factors help explain the spatial differentiation of pension outcomes, and do these relationships differ between the UEBP and URRBP?
To answer these questions, the study uses provincial-level data for China and combines three complementary analytical approaches. The Gini coefficient is used to examine the magnitude and evolution of spatial inequality in indicators of pension demand and supply. Spearman’s rank correlation is then used to assess the spatial association between demographic demand and pension provision. Finally, the Geographic Detector is employed to examine the explanatory power and interaction of demographic, economic, fiscal, and institutional factors underlying spatial differentiation. Together, these methods allow the study to move from describing the geography of ageing and pension provision to examining their spatial relationship and the factors associated with that relationship.
The study makes three contributions. First, it contributes to population research by showing that population ageing should be understood not only as a change in the size of the older population but also as a changing spatial distribution of demographic need. The increasingly widespread geography of ageing has implications for how pension demand is distributed across regions. Second, it contributes to population geography by bringing the geography of ageing into direct analytical relationship with the geography of economic and fiscal resources. Rather than treating demographic change and regional development as separate processes, the study examines their spatial interaction through pension income security. Third, it contributes to research on population-related policy by showing how institutional scale mediates the translation of demographic pressures into pension outcomes. The contrast between the UEBP and URRBP illustrates that the spatial consequences of population ageing depend partly on how widely pension risks and resources are pooled across territories.
More broadly, the study argues that population ageing creates a distinctive spatial policy challenge. As ageing becomes increasingly generalized across national territory, pension demand becomes less exclusively associated with particular ageing regions, while the resources available to meet that demand may remain geographically differentiated. The resulting tension between the geography of demographic need and the geography of redistributive capacity provides a population-geographical perspective on pension income security. China therefore offers a useful case for examining a broader issue facing ageing societies: whether institutions of social protection are organized at a spatial scale capable of responding to the changing geography of demographic change.
The remainder of the paper proceeds as follows. Section 2 reviews the literature on the spatial differentiation of population ageing, ageing-related pension demand, regional inequality in pension provision, and the emerging concept of spatial mismatch. Section 3 develops the conceptual framework and presents the analytical strategy, data, and indicators. Section 4 examines the spatial distribution of pension demand and supply. Section 5 analyzes the spatial association between demographic demand and pension provision and identifies the factors associated with spatial differentiation. Section 6 discusses the demographic and institutional implications of the findings, and Section 7 concludes.
2. Literature Review: Population Ageing, Pension Security, and Spatial Mismatch
Research on pension income security has developed across demography, population geography, economics, social policy, and spatial political economy. These literatures have generated substantial knowledge about the consequences of population ageing, the determinants of pension adequacy, the regional distribution of pension resources, and the institutional organization of redistribution. Yet they have rarely been brought together around a common spatial question: whether the geography of pension provision corresponds to the geography of ageing-related demographic need. This study connects these strands by treating pension income security as a population-geographical outcome arising from the interaction between demographic change and territorially differentiated institutional capacity.
2.1. The Spatial Differentiation of Population Ageing
Population ageing is fundamentally a demographic process generated by changes in fertility, mortality, longevity, and migration. Its consequences, however, are spatially differentiated because demographic processes do not occur uniformly across geographical space. Differences in fertility histories, mortality conditions, migration patterns, and population redistribution can produce substantial regional variation in the pace and intensity of ageing. In China, for example, population ageing has historically been particularly pronounced in areas experiencing sustained out-migration of younger workers, while economically dynamic regions have attracted working-age populations through employment opportunities and urbanization (Wang & Wu, 2016).
The spatial geography of ageing is therefore closely connected to population mobility and regional development. Selective migration can simultaneously reshape the numerator and denominator of regional ageing: the departure of younger adults increases the relative weight of older residents, while the concentration of working-age populations in economically dynamic areas can moderate the ageing of destination regions. Ageing in place may further reinforce the persistence of older populations in particular localities. These processes demonstrate that population ageing is not simply a national demographic trend reproduced uniformly across territory. It is also a process of population redistribution through which demographic pressures become spatially differentiated.
At the same time, demographic transition can gradually broaden the geography of ageing. As fertility decline and longevity improvements spread across regions, ageing becomes increasingly widespread rather than being confined to historically older or economically peripheral populations. This does not mean that regional differences in ageing disappear. Instead, the demographic significance of ageing shifts from a geographically concentrated phenomenon toward a more generalized population condition. This distinction is important for understanding pension demand. When ageing is concentrated in a limited number of regions, pension pressures may be interpreted primarily as regional demographic burdens. When ageing becomes widespread, pension demand increasingly becomes a national population issue while retaining important spatial differences in intensity.
This literature has suggested two related but distinct propositions. First, population ageing remains spatially heterogeneous because demographic change interacts with migration and regional population dynamics. Second, the geographical reach of ageing-related needs can expand even when regional differences persist. The relevant question for pension security is consequently not whether ageing is spatially equal, but whether the spatial distribution of pension-related demographic pressures is becoming more generalized relative to the distribution of the resources available to address them.
This perspective also connects population ageing to the broader concept of social reproduction. Older populations require continuing access to income, healthcare, housing, care, and other forms of social support. These needs are experienced locally, but the resources required to meet them may be generated and redistributed across different geographical scales. The spatial organization of ageing creates a potential tension between the location of demographic need and the location of economic and institutional resources.
2.2. Population Ageing and Pension Demand
Population ageing has long been identified as a central challenge for pension systems. An increasing share of older people relative to the working-age population changes the balance between pension beneficiaries and contributors and can place pressure on contribution revenues, public transfers, and pension funds. Demographic indicators such as the proportion of older people and pension dependency ratios are consequently widely used to assess pension pressure and the sustainability of pension systems.
From a population perspective, however, pension demand should not be understood simply as the number of older people. The demand for pension income reflects the interaction between population age structure and the institutional organization of old-age support. A larger older population creates a greater need for income protection, but the intensity of this need also depends on employment histories, contribution coverage, household resources, and the institutional role of pensions relative to family support and other sources of income. Pension demand is both demographic and institutional.
This distinction is particularly important in China. The expansion of formal pension systems has transformed the institutional basis of old-age income security, while demographic ageing and population mobility have altered the spatial distribution of potential pension beneficiaries. The UEBP and URRBP cover different population groups and operate through different financing and benefit arrangements. Regional differences in the size of contributor and beneficiary populations generate different forms of pension dependency pressure.
The literature on Chinese pensions has documented regional disparities in pension funds, benefit levels, financing conditions, and pension adequacy (Dong & Wang, 2016; Li et al., 2018; Chen & Chen, 2021; Wang & Huang, 2023; Zhang et al., 2023). Research has also shown that pension reform and institutional integration can affect differences in pension outcomes across population groups and regions. These studies establish that pension security is closely related to demographic structure and regional economic conditions. Nevertheless, most analyses focus on the level or inequality of pension outcomes rather than asking whether the spatial distribution of pension resources corresponds to the spatial distribution of pension demand.
This distinction is analytically important. Suppose two regions have different levels of pension provision. Such a difference does not necessarily indicate a spatial problem if the region with greater demographic pressure also receives greater pension resources. Conversely, similar pension levels across regions may not imply comparable pension security if demographic pressures differ substantially. The central issue is alignment between need and provision, rather than inequality in either dimension considered independently.
The present study accordingly conceptualizes population ageing and pension dependency as indicators of the spatial distribution of pension demand. These indicators do not measure individual-level demand for pensions, nor do they capture every dimension of old-age economic vulnerability. Rather, they provide population-level measures of the demographic pressure that pension institutions must accommodate. This population-level interpretation is consistent with the study’s provincial analytical scale and allows demographic demand to be examined alongside the regional capacity to provide pension income.
2.3. Spatial Inequality in Pension Provision
A second body of literature examines the spatial distribution of pension provision. Research on welfare geography and regional inequality has demonstrated that social protection is not spatially neutral. Pension systems are implemented through institutions that operate at particular territorial scales, and the availability of welfare resources reflects differences in regional economic development, fiscal capacity, administrative organization, and intergovernmental transfers.
The spatial political-economy literature provides a useful explanation for these differences. Uneven development produces geographically differentiated economic resources through processes of capital accumulation, labor mobility, and state intervention (Harvey, 1973; Smith, 1984; Massey, 1995; Scott & Storper, 2003). These differences matter for social protection because regions with stronger economic foundations generally possess greater fiscal and institutional resources with which to finance welfare provision. Regional inequality in pension resources can reflect broader patterns of uneven development rather than pension institutions alone.
Welfare-geographical research further emphasizes that social protection is embedded within territorial governance. Fiscal decentralization, administrative boundaries, and intergovernmental transfers influence the extent to which welfare resources can be redistributed across space (Oates, 1972; Wolch, 1989; Morgan, 2007; Rodríguez-Pose, 2018). When welfare provision remains closely tied to local fiscal capacity, economic disparities can be transmitted into differences in social protection. Conversely, broader pooling and stronger interregional transfers can weaken this relationship by redistributing resources beyond the territories in which they are generated.
These arguments are particularly relevant to China’s pension system. Previous research has identified substantial regional disparities in pension fund revenues, balances, subsidies, and benefit levels (Li et al., 2018; Wang & Huang, 2023; Zhang et al., 2023). Regional economic development and fiscal capacity also differ substantially, creating heterogeneous foundations for pension provision. The geographical organization of pension systems matters because institutional arrangements determine the extent to which local demographic and economic conditions are translated into pension outcomes.
The distinction between the UEBP and URRBP is especially informative in this respect. The UEBP has progressively developed broader pooling and adjustment mechanisms, allowing pension financing to operate beyond strictly local boundaries. The URRBP, in contrast, remains more closely embedded within local fiscal and administrative structures. Existing research on China’s pension reforms suggests that differences in institutional design and redistribution can influence regional pension inequality and the relationship between local economic conditions and pension outcomes (Wang & Huang, 2023; Wang et al., 2023).
The implication is that spatial inequality in pension provision cannot be interpreted solely as an outcome of differences in demographic pressure. It may also reflect differences in the territorial organization of redistribution. This provides the institutional foundation for considering a spatial mismatch between pension demand and supply.
2.4. From Spatial Inequality to Spatial Mismatch
The preceding literatures reveal an important gap. Research on population ageing primarily asks where ageing occurs and how demographic change varies across space. Research on pension systems generally asks whether pensions are adequate, sustainable, or regionally unequal. Research in welfare geography and spatial political economy explains why social protection resources are distributed unevenly across territories. Yet these perspectives have rarely been integrated to examine the spatial relationship between demographic need and pension provision.
The concept of spatial mismatch provides a way to connect these literatures. In this study, spatial mismatch refers to a situation in which the spatial distribution of ageing-related pension demand does not correspond to the spatial distribution of pension provision capacity. It is therefore a relational concept rather than a simple measure of inequality. Spatial inequality describes differences in the level of an indicator across regions; spatial mismatch concerns the relationship between two spatial distributions.
This distinction is important for interpreting pension security. If pension demand and pension supply are both concentrated in the same regions, regional inequality in pension provision may coexist with relatively strong spatial alignment. If, however, demographic pressures are concentrated in regions with weaker pension capacity, inequality in pension provision becomes more consequential because the geography of need and the geography of resources diverge. Spatial mismatch draws attention to the relationship between demographic vulnerability and institutional capacity.
The concept also introduces a scalar dimension. Demographic ageing is generated through population processes that increasingly operate across national territory, whereas pension financing and administration may remain partly embedded within subnational fiscal and administrative structures. The scale at which demographic risks are experienced does not necessarily coincide with the scale at which pension resources are mobilized and redistributed. Intergovernmental transfers, pension pooling, and fiscal equalization can be understood as institutional mechanisms that attempt to bridge this scalar difference (Brenner, 2004; McCann, 2020).
From this perspective, the spatial organization of pension security reflects the interaction of three processes. First, population reproduction and demographic transition shape the geography of ageing-related need. Second, uneven regional development shapes the geography of economic and fiscal resources available to support older populations. Third, pension governance and the scale of redistribution mediate the extent to which resources can move across territorial boundaries. Spatial mismatch emerges from the interaction of these processes rather than from any single demographic or economic factor.
This framework also suggests that different pension programs may generate different spatial relationships between demand and supply. Programs with broader pooling and redistribution mechanisms may weaken the dependence of pension provision on local economic conditions. Programs that remain more closely tied to local fiscal capacity may transmit regional economic differences more directly into pension outcomes. Institutional heterogeneity is not simply an additional source of regional inequality; it is a mechanism through which the relationship between demographic demand and pension supply is mediated.
The literature consequently points toward a population-geographical research agenda centered on the relationship between the geography of ageing and the geography of pension security. The present study contributes to this agenda by examining whether ageing-related pension demand is spatially differentiated to the same extent as pension provision, whether the two distributions are aligned across Chinese provinces, and how demographic, economic, fiscal, and institutional factors are associated with their spatial differentiation. Rather than treating population ageing and pension inequality as separate outcomes, the study examines them as interconnected dimensions of the spatial organization of old-age income security.
3. Research Method
3.1. Conceptual Framework
This study conceptualizes pension income security as a population-geographical outcome arising from the interaction between population ageing, the spatial distribution of economic and fiscal resources, and the territorial organization of pension institutions. The central analytical distinction is between pension demand and pension supply. Pension demand refers to the demographic pressure for old-age income protection, whereas pension supply refers to the institutional and material capacity to provide such protection. The two dimensions are shaped by different spatial processes and need not be distributed similarly across regions.
The demand side originates primarily in demographic change. Population ageing is driven by long-term changes in fertility, mortality, longevity, and migration. As demographic transition advances, the proportion of older people increases and the number of pension beneficiaries relative to contributors may rise. These processes generate ageing-related demand for pension income. Importantly, the geographical distribution of this demand is not determined by ageing alone. Population mobility also reshapes the spatial distribution of older and working-age populations. Regions experiencing sustained out-migration of younger populations may face both a higher ageing burden and a narrower contribution base, while economically dynamic regions may attract working-age populations and temporarily moderate their ageing pressures.
The supply side follows a different spatial logic. Pension provision depends on the capacity of pension institutions to mobilize, finance, and redistribute resources. This capacity is associated with regional economic development, fiscal resources, household income, pension fund conditions, and institutional arrangements. Because these resources are unevenly distributed across China, pension provision remains territorially differentiated even as ageing becomes increasingly widespread. The geography of pension supply may reflect the geography of economic and fiscal capacity more strongly than the geography of demographic need.
These differences motivate the central proposition of this study: convergent demographic demand and territorialized pension supply. The term convergent demand is used in a relative and spatial sense. It does not imply that all provinces have identical ageing pressures or that spatial inequality in ageing necessarily declines continuously. Rather, it refers to the increasing geographical reach of ageing-related pension demand as demographic transition matures. Ageing is progressively becoming a broadly shared population condition rather than a phenomenon restricted to a small number of historically old or out-migrating regions.
Territorialized supply, by contrast, refers to the continued embedding of pension provision within geographically differentiated economic, fiscal, and institutional structures. Provinces differ in their economic foundations, fiscal resources, pension financing conditions, and administrative capacities. These differences can persist even when demographic pressures become more widely distributed. Consequently, the spatial distribution of pension resources may diverge from the spatial distribution of ageing-related need.
The interaction between these two processes constitutes the spatial mismatch examined in this study. Spatial mismatch is defined as a lack of correspondence between the geographical distribution of ageing-related pension demand and the geographical distribution of pension provision capacity. It is a relational concept rather than a simple indicator of regional inequality. A high degree of spatial inequality in pension provision does not necessarily imply mismatch if greater resources are concentrated in regions facing greater demographic pressure. Conversely, relatively similar pension provision across regions may still coexist with mismatch if demographic needs differ substantially. The analytical focus is consequently on the relationship between the two spatial distributions.
The framework can be summarized as follows: Demographic transition (fertility decline, longevity increase, migration, population ageing) → Spatial distribution of ageing-related pension demand → Interaction with regional economic and fiscal capacity → Territorially organized pension provision → Spatial alignment or mismatch between demand and supply → Regional differentiation in pension income security.
This framework also incorporates the role of governance scale. Population ageing is increasingly a national demographic process, whereas pension financing and administration remain partly organized through territorial fiscal and administrative structures. The geographical scale at which demographic risks are experienced does not necessarily coincide with the scale at which pension resources are generated, pooled, and redistributed. Broader pooling and interregional transfers can extend the geographical reach of redistribution and weaken the dependence of pension outcomes on local resource conditions. Conversely, pension arrangements that remain closely associated with local fiscal capacity may transmit regional economic disparities more directly into pension outcomes.
Institutional heterogeneity is an important part of the framework. The UEBP and URRBP represent two different configurations of pension governance. The UEBP has progressively incorporated broader pooling and interregional adjustment mechanisms, providing greater scope for redistribution across territorial boundaries. The URRBP remains more closely connected to local fiscal and administrative conditions, despite the role of higher-level subsidies. The comparison between the two programs allows the analysis to examine whether differences in the scale and organization of redistribution are associated with different spatial relationships between demographic demand and pension provision.
The framework does not assume that population ageing mechanically causes regional pension inequality. Instead, it proposes that demographic change creates a spatial distribution of pension-related need, while uneven development and institutional arrangements shape the capacity to respond to that need. Spatial mismatch emerges when these two spatial processes do not correspond. This interpretation places population ageing at the center of the analysis while retaining insights from spatial political economy concerning uneven development, territorial governance, and the scalar organization of redistribution.
3.2. Analytical Strategy
The empirical analysis proceeds in three stages. First, the study measures the spatial differentiation of pension demand and pension supply. Second, it examines the spatial relationship between the two dimensions. Third, it investigates the demographic, economic, fiscal, and institutional factors associated with spatial differentiation in pension provision.
3.2.1. Measuring the Spatial Differentiation of Pension Demand and Supply
The first stage constructs a multidimensional indicator system covering both the demand and supply dimensions of pension income security (Table 1).
The demand dimension captures the spatial distribution of ageing-related demographic pressure. It consists of three indicators: the proportion of the population aged 65 and above, the UEBP dependency ratio, and the URRBP dependency ratio. The first measures the overall level of population ageing, while the latter two capture the relationship between pension beneficiaries and contributors within the two major basic pension programs.
The supply dimension captures the capacity to provide pension income through three complementary components. The first is pension adequacy, measured separately for the UEBP and URRBP using absolute and relative benefit indicators. The second is the regional economic foundation, represented by GDP per capita, tax revenue per capita, disposable income per capita, and the relationship between tax revenue and total revenue. The third is fiscal and pension-system sustainability, including public expenditure, social-security expenditure, pension-fund vulnerability, and pension-fund financial health.
This multidimensional structure is designed to distinguish the demographic pressure for pension income from the resources and institutional conditions available to meet that pressure. It also avoids reducing pension income security to a single benefit indicator, which would obscure the broader fiscal and institutional foundations of pension provision.
The Gini coefficient is used to measure the spatial inequality of each indicator across provinces. For an indicator X, the Gini coefficient is expressed as:
where, n is the number of provinces, Xᵢ and Xⱼ represent the values of the indicator in provinces i and j, and is the provincial mean. A larger Gini coefficient indicates greater spatial differentiation.
The Gini analysis serves two purposes. First, it establishes whether ageing-related demand is more or less spatially differentiated than pension provision. Second, comparison between 2015 and 2023 provides descriptive evidence on changes in the geographical distribution of these indicators. Importantly, changes in the Gini coefficient are interpreted descriptively rather than as evidence of a universal convergence or divergence process.
3.2.2. Examining Spatial Alignment Between Demand and Supply
The second stage examines whether provinces with greater ageing-related pension demand also possess stronger pension provision capacity. Spearman’s rank correlation coefficient is used because the analysis focuses on the spatial ordering of provinces and does not require a linear relationship between the variables.
For two provincial indicators X and Y, Spearman’s rank correlation is calculated as:
where, dᵢ is the difference between the ranks of province i on the two indicators and n is the number of provinces.
ρ = 1 − [6Σᵢdᵢ2/n(n2 − 1)]
The correlation analysis distinguishes three broad spatial configurations. A positive correlation indicates that provinces with greater pension demand tend also to have higher levels of the corresponding supply indicator, suggesting spatial alignment. A negative correlation indicates that higher demand tends to coincide with weaker supply, providing evidence consistent with spatial mismatch. A correlation close to zero indicates weak spatial association between the two distributions.
The analysis does not treat a negative correlation as proof of a causal relationship. Rather, it uses the correlation structure as a diagnostic of spatial alignment or misalignment between demographic demand and pension provision. This distinction is important because the provincial analysis cannot by itself establish that demographic pressure causes differences in pension supply.
The analysis also compares the spatial relationships associated with the UEBP and URRBP. Differences in the correlations between economic or fiscal conditions and pension adequacy provide descriptive evidence concerning the extent to which pension outcomes remain associated with local development conditions under different institutional arrangements.
3.2.3. Identifying Factors Associated with Spatial Differentiation
The third stage uses the Geographic Detector to examine the spatial differentiation of pension provision and the interaction among demographic, economic, and fiscal factors. Geographic Detector is appropriate for this purpose because it identifies the extent to which the spatial stratification of an explanatory variable corresponds to the spatial heterogeneity of an outcome without requiring a linear functional form (Wang et al., 2010; Wang & Xu, 2017).
The factor detector produces a q statistic:
where h = 1,...,L denotes the strata of an explanatory variable, Nₕ and σₕ2 are the number of observations and variance within stratum h, and N and σ2 are the corresponding values for the entire study area. The q statistic ranges from 0 to 1, with larger values indicating that the spatial stratification of the explanatory variable corresponds more closely to the spatial heterogeneity of the outcome.
q = 1 − [Σₕ Nₕσₕ2/Nσ2]
The factor detector is used to examine the explanatory power of demographic, economic, fiscal, and institutional variables for the spatial differentiation of pension adequacy. The analysis is conducted separately for the UEBP and URRBP in order to identify whether the two programs exhibit different spatial structures.
The interaction detector is then used to assess whether combinations of factors exhibit stronger explanatory power than individual factors. If the combined q value exceeds the individual q values, the factors exhibit an enhanced spatial explanatory relationship. In particular, nonlinear enhancement is identified when:
q(X₁ ∩ X₂) > q(X₁) + q(X₂)
Such results are interpreted as evidence that spatial differentiation in pension outcomes is associated with the interaction of multiple demographic, economic, and fiscal conditions rather than with a single factor.
The Geographic Detector results are interpreted as spatial explanatory associations, not causal effects. A high q statistic indicates that the spatial stratification of a factor corresponds strongly to the spatial heterogeneity of the outcome; it does not demonstrate that the factor independently causes the observed pension outcome.
3.3. Spatial Scale and Data Sources
The provincial level is adopted as the principal geographical scale because provinces constitute important territorial units for pension administration, fiscal coordination, intergovernmental transfers, and the organization of pension resources in China. This scale also permits comparison across the national territory while maintaining a close connection to the institutional geography of pension provision.
The analysis uses provincial-level data for 2015 and 2023, rather than describing these observations as a conventional panel unless annual observations are incorporated into the empirical analysis. Data are obtained from official statistical sources, principally the National Bureau of Statistics of China, including the China Statistical Yearbook and related statistical publications.
The two-year comparison is used to describe changes in the spatial distribution of pension demand and supply over the study period. The empirical analysis therefore combines temporal comparison with cross-sectional spatial analysis. The Gini coefficients provide evidence on changes in spatial differentiation between the two years, while the Spearman and Geographic Detector analyses identify the spatial relationships and explanatory structures observed in the relevant year.
4. Spatial Distribution of Ageing-Related Pension Demand and Pension Provision
4.1. Spatial Differentiation of Ageing-Related Pension Demand
Table 2 presents the Gini coefficients for the demand and supply indicators in 2015 and 2023. The results reveal a clear asymmetry between the spatial distribution of ageing-related pension demand and that of pension provision. Ageing-related demand is relatively less spatially differentiated, whereas several dimensions of pension provision, particularly fiscal and fund-related indicators, show substantially greater regional differentiation. The evidence suggests that the spatial geography of pension demand is broader and more evenly distributed than the geography of the resources and institutional capacity available to meet that demand.
On the demand side, all three indicators have relatively low Gini coefficients. In 2023, the Gini coefficient is 0.130 for the share of the population aged 65 and above (A1), 0.201 for the UEBP dependency ratio (A2), and 0.181 for the URRBP dependency ratio (A3). These values indicate that ageing-related pension pressure is distributed across a relatively broad range of provinces rather than being concentrated in a small number of regions. The same pattern is visible in 2015, when the corresponding coefficients were 0.107, 0.178, and 0.173. Although the coefficients for A1 and A2 increased between 2015 and 2023, the overall level of spatial differentiation remained considerably lower than that observed for many supply-side indicators.
This pattern is better understood as the increasing geographical generalization of ageing-related pension demand rather than as simple spatial convergence. The increase in the Gini coefficients means that demographic pressures did not become uniformly distributed over the period. Rather, the relatively modest degree of spatial differentiation indicates that ageing and pension dependency have become relevant demographic pressures across a wide range of provinces. Thus, the geography of pension demand is relatively broad compared with the much more differentiated geography of pension financing and provision.
4.2. Spatial Differentiation of Pension Provision
The supply indicators display a substantially more differentiated spatial pattern. Pension adequacy varies considerably across the two pension programs, and the degree of differentiation is especially pronounced for the URRBP. In 2023, the Gini coefficients for the four UEBP adequacy indicators (B1–B4) range from 0.119 to 0.164, whereas those for the four URRBP adequacy indicators (B5–B8) range from 0.234 to 0.376. The contrast indicates that the spatial distribution of pension benefits is considerably more differentiated for the URRBP than for the UEBP.
The temporal changes also point to different trajectories across the two programs. For the UEBP, the Gini coefficient for absolute pension benefit per retiree (B1) declined from 0.144 in 2015 to 0.133 in 2023, while B4, the UEBP benefit relative to urban disposable income, declined from 0.175 to 0.156. Other UEBP indicators changed only modestly, with B2 increasing from 0.110 to 0.119 and B3 from 0.161 to 0.164. Taken together, these results are consistent with a relatively stable and comparatively less differentiated spatial distribution of UEBP adequacy.
The URRBP exhibits substantially greater spatial differentiation. Its absolute benefit indicator (B5) increased from a Gini coefficient of 0.333 in 2015 to 0.376 in 2023. The corresponding coefficients for B6, B7, and B8 also increased, from 0.249 to 0.343, 0.225 to 0.284, and 0.208 to 0.234, respectively. Thus, the regional distribution of URRBP pension adequacy remained markedly more unequal than that of UEBP and became more differentiated over the study period.
The strongest spatial differentiation appears in the economic and fiscal foundations of pension provision. In 2023, the Gini coefficients are 0.214 for GDP per capita (C1), 0.366 for tax revenue per capita (C2), and 0.379 for disposable income per capita (C3). Particularly high differentiation is also observed in indicators of pension-fund and fiscal sustainability. The coefficient for UEBP fund vulnerability (D3) reaches 0.516, while those for social-security expenditure relative to tax revenue (D2) and URRBP fund vulnerability (D5) are 0.304 and 0.300, respectively. These values are much larger than those of the demographic demand indicators. They indicate that the regional capacity to finance and sustain pension provision is more unevenly distributed than the underlying demographic pressure for pension protection.
The results therefore point to an important distinction between the geography of need and the geography of capacity. The relatively modest spatial differentiation of ageing-related demand coexists with substantial differentiation in economic resources, fiscal capacity, and pension-fund conditions. This does not by itself establish that uneven fiscal capacity causes differences in pension outcomes, but it shows that the territorial distribution of the resources supporting pension provision is considerably more heterogeneous than the territorial distribution of demographic demand.
4.3. Institutional Differences in the Spatial Distribution of Pension Provision
The contrast between the UEBP and URRBP provides further evidence of the role of institutional organization in shaping the spatial distribution of pension provision. The UEBP shows relatively low and comparatively stable spatial differentiation in benefit adequacy, whereas URRBP benefits remain much more differentiated across provinces. This pattern is consistent with the different territorial organization of the two programs. Broader pooling and interprovincial adjustment within the UEBP provide greater scope for redistributing pension resources beyond local economic conditions. By contrast, the stronger spatial differentiation of URRBP benefits is consistent with its closer association with local fiscal and economic conditions, despite the contribution of higher-level subsidies.
A further asymmetry concerns the distribution of fiscal and financial risk. The Gini coefficients for UEBP fund vulnerability and financial conditions are relatively high, indicating substantial regional differentiation in the burden associated with maintaining the program. At the same time, UEBP benefit adequacy is considerably less differentiated than these underlying fiscal conditions. For the URRBP, by contrast, fiscal pressures are partly moderated through higher-level support, while benefit adequacy remains substantially differentiated across regions. These patterns suggest that the spatial distribution of pension outcomes cannot be understood solely from benefit levels; it also depends on how financing risks and redistributive responsibilities are distributed across territorial units.
4.4. From Spatial Differentiation to Spatial Mismatch
Together, the descriptive evidence establishes an asymmetric spatial configuration of pension income security. Ageing-related demand is relatively less differentiated across provinces, while pension provision and, especially, the economic and fiscal foundations of provision remain much more territorially differentiated. The two pension programs also display distinct spatial patterns, with UEBP adequacy showing substantially less regional differentiation than URRBP adequacy.
These findings provide descriptive support for the study’s central proposition of a potential mismatch between the geography of ageing-related demand and the geography of pension provision. However, Gini coefficients alone cannot determine whether high-demand regions systematically receive stronger or weaker pension provision. A regionally equal distribution of a supply indicator could coexist with substantial mismatch if demographic demand differs across space, while a differentiated supply distribution could be spatially aligned if resources are concentrated in regions with greater demographic pressure. Assessing the relational dimension of mismatch requires a direct comparison of the two spatial distributions.
Section 5 addresses this question by examining the spatial association between ageing-related pension demand and pension provision using Spearman rank correlations. The analysis moves from the descriptive question of how uneven the two distributions are to the relational question of whether provinces with greater demographic pension pressure also have stronger pension provision. This distinction is essential for identifying spatial mismatch rather than simply documenting regional inequality.
5. Spatial Alignment Between Ageing-Related Pension Demand and Pension Provision
5.1. Spatial Correspondence between Demand and Supply: Structural Decoupling
To examine the spatial correspondence between demand and supply, this study uses Spearman rank correlations to compare the provincial rankings of demand and supply indicators. As shown in Figure 1, the demand indicators are generally positively correlated with one another, whereas their associations with pension benefits are weaker and vary substantially across pension systems.
First, the demand indicators show relatively strong spatial consistency. In 2023, the correlation between the ageing level (A1) and the resident pension support ratio (A3) was 0.71, while that between A1 and the employee pension support ratio (A2) increased from 0.31 in 2015 to 0.65. This indicates that different measures of pension demand exhibit broadly similar provincial spatial patterns.
Second, demand and employee pension benefits show a persistent negative association. In 2023, A1 was negatively correlated with B1–B4, with coefficients of -0.39, -0.39, -0.33, and -0.46, respectively. Although these negative associations were weaker than in 2015, their direction remained unchanged. Thus, provinces with higher ageing levels did not necessarily have higher employee pension benefits. The relatively weak correlations between A2 and B1–B4 further suggest that the spatial distribution of employee pension benefits is not closely aligned with the internal support burden of the system.
Third, the resident pension system displays a different pattern. In 2023, A3 was negatively correlated with employee pension benefits B1–B4, particularly with B4 (-0.68), but was positively correlated with resident pension benefits B5 and B6, at 0.38 and 0.46, respectively. The latter correlations increased from 0.21 and 0.31 in 2015. This suggests a certain degree of spatial correspondence between resident pension demand and benefits within the same system, in contrast to the weaker or negative correspondence observed across systems.
Overall, the results reveal limited and institutionally differentiated spatial correspondence between pension demand and supply. Demand indicators exhibit relatively consistent spatial patterns, but these patterns are not systematically matched by benefit provision. The contrast between employee and resident pension systems suggests that the spatial organization of pension supply is shaped not only by demographic demand but also by the institutional arrangements governing resource pooling, fiscal responsibility, and risk sharing. This provides an empirical basis for the subsequent analysis of mismatch typologies and the role of institutional scale.
5.2. Inverse Association Between Demographic Pressure and Pension Provision
An important finding of Figure 1 is that provinces with relatively greater ageing pressure and pension dependency tend, in the observed cross-section, to have weaker economic foundations and lower fiscal capacity. Conversely, provinces with stronger economic and fiscal resources tend to exhibit lower demographic pressure. The resulting inverse spatial association indicates that the geography of demographic vulnerability does not closely coincide with the geography of the resources available to support pension provision.
This pattern provides relational evidence for the spatial mismatch identified conceptually in Section 3 and Section 4. The result is not simply that some provinces have lower pension resources than others. More importantly, the spatial ordering of pension need and the spatial ordering of redistributive capacity do not consistently coincide. Regions facing greater demographic pressure are not necessarily those with the strongest economic and fiscal foundations. The descriptive Gini results therefore acquire a relational dimension through the correlation analysis.
Several demographic and spatial processes may be relevant to this pattern. Population mobility can redistribute working-age contributors and older residents across provinces, while differences in regional development can simultaneously affect employment opportunities, contribution bases, fiscal resources, and pension financing capacity. Regions experiencing sustained population out-migration may face a combination of rising ageing pressure and a relatively weaker resource base. The present analysis, however, does not directly model migration as a determinant of pension mismatch. The correlation results should consequently be interpreted as being consistent with these mechanisms rather than as establishing their causal effects.

Table 3.
Interaction effects of independent variable combination, 2023.
| Combination of independent variables | UEBP | URRBP | ||||||||||
|---|---|---|---|---|---|---|---|---|---|---|---|---|
| B1 | B2 | B4 | B5 | B6 | B8 | |||||||
| q value | Interaction type | q value | Interaction type | q value | Interaction type | q value | Interaction type | q value | Interaction type | q value | Interaction type | |
| 2019 | ||||||||||||
| C1 ∩ C3 | 0.146 (0.140) |
Double-factor enhancement | 0.414 (0.265) |
Double-factor enhancement | 0.146 (0.195) | Nonlinear enhancement | 0.083 (0.081) |
Double-factor enhancement | 0.233 (0.179) |
Double-factor enhancement | 0.151 (0.138) |
Double-factor enhancement |
| D1 ∩ C4 | 0.639 (0.185) |
Nonlinear enhancement | 0.689 (0.105) |
Double-factor enhancement | 0.441 (0.245) | Double-factor enhancement | 0.879 (0.781) |
Nonlinear enhancement | 0.916 (0.573) |
Nonlinear enhancement | 0.639 (0.499) |
Nonlinear enhancement |
| D3 ∩ D4 | 0.458 (0.410) |
Double-factor enhancement | 0.585 (0.105) |
Double-factor enhancement | 0.478 (0.360) | Double-factor enhancement | 0.289 (0.303) |
Double-factor enhancement | 0.267 (0.175) |
Double-factor enhancement | 0.430 (0.348) |
Double-factor enhancement |
| D5 ∩ D6 | 0.939 (0.005) |
Nonlinear enhancement | 0.912 (0.010) |
Nonlinear enhancement | 0.757 (0.025) | Nonlinear enhancement | 0.707 (0.205) |
Nonlinear enhancement | 0.549 (0.161) |
Nonlinear enhancement | 0.718 (0.280) |
Nonlinear enhancement |
| 2023 | ||||||||||||
| C1 ∩ C3 | 0.083 (0.081) |
Double-factor enhancement | 0.233 (0.179) |
Double-factor enhancement | 0.151 (0.138) |
Double-factor enhancement | 0.912 (0.891) |
Double-factor enhancement | 0.961 (0.787) |
Nonlinear enhancement | 0.963 (0.829) |
Nonlinear enhancement |
| D1 ∩ C4 | 0.879 (0.781) |
Nonlinear enhancement | 0.916 (0.573) |
Nonlinear enhancement | 0.639 (0.499) |
Nonlinear enhancement | 0.693 (0.517) |
Double-factor enhancement | 0.862 (0.598) |
Nonlinear enhancement | 0.832 (0.705) |
Nonlinear enhancement |
| D3 ∩ D4 | 0.289 (0.303) |
Double-factor enhancement | 0.267 (0.175) |
Double-factor enhancement | 0.430 (0.348) |
Double-factor enhancement | 0.440 (0.424) |
Double-factor enhancement | 0.694 (0.424) |
Nonlinear enhancement | 0.694 (0.424) |
Nonlinear enhancement |
| D5 ∩ D6 | 0.707 (0.205) |
Nonlinear enhancement | 0.549 (0.161) |
Nonlinear enhancement | 0.718 (0.280) |
Nonlinear enhancement | 0.020 (0.180) |
Nonlinear weakening | 0.194 (0.180) |
Double-factor enhancement | 0.168 (0.180) |
Nonlinear weakening |
Notes: (1) ***p<0.01; **p<0.05; and *p<0.1. (2) Numbers in parentheses are p value. (3) Criteria for determining interaction types: q(X1∩X2)>max(q(X1), q(X2)), double-factor enhancement; q(X1∩X2)>q(X1)+q(X2), Nonlinear enhancement; q(X1∩X2)<min(q(X1), q(X2)), nonlinear weakening. Source: Same as Figure 1.
5.3. Institutional Differences Between UEBP and URRBP
The correlation structure also reveals important differences between the UEBP and URRBP. Economic and fiscal indicators show relatively weak associations with UEBP benefit adequacy compared with the relationships observed for the URRBP. This pattern is consistent with the role of broader pooling and interregional adjustment in the UEBP, which can weaken the correspondence between local economic conditions and the pension benefits received by retirees. In other words, pension outcomes under a more broadly pooled arrangement need not track the economic conditions of the province in which beneficiaries reside as closely as outcomes under more territorially embedded arrangements.
The URRBP displays a different spatial pattern. Its adequacy indicators show stronger positive associations with regional economic conditions, indicating that provinces with stronger local resource endowments tend also to have higher levels of resident pension provision. This association is consistent with the closer territorial embedding of URRBP financing and administration. It does not imply that local economic development is the sole determinant of URRBP adequacy, but it indicates that the spatial distribution of local resources corresponds more closely to the spatial distribution of pension outcomes in this program.
The contrast between the two programs is analytically important. The evidence suggests that the spatial relationship between ageing-related demand and pension provision is mediated by the scale at which pension resources are pooled and redistributed. Broader pooling can weaken the dependence of pension outcomes on local economic conditions, whereas more territorially embedded arrangements retain a stronger correspondence with regional resource endowments. Institutional scale thus provides an important context for understanding why similar demographic pressures can coexist with different spatial patterns of pension provision.
5.4. Implications for the Spatial Mismatch of Pension Security
Together, the correlation analysis strengthens the spatial mismatch argument developed in the preceding sections. Ageing-related pension demand is relatively widespread across the national territory, but the regions facing greater demographic pressure do not consistently correspond to those with stronger economic and fiscal capacity. The predominantly weak or negative cross-domain correlations indicate that the geography of pension need and the geography of pension resources follow partially different spatial logics.
At the same time, the correlation analysis should not be interpreted as demonstrating a causal process of “decoupling.” Spearman correlations identify spatial association in the ranking of provinces; they do not establish temporal causality, independent effects, or the direction of influence. Nor does a negative correlation by itself identify the institutional or demographic mechanism responsible for the observed pattern. These questions require analysis of the factors associated with spatial differentiation in pension provision, which is examined in Section 6 using the Geographic Detector approach.
The main empirical implication is relational rather than causal: the spatial distribution of ageing-related pension demand and that of pension provision are not closely aligned, and the degree of alignment differs across pension institutions. Nonetheless, this finding provides the basis for moving from the identification of spatial mismatch to an examination of the demographic, economic, fiscal, and institutional factors associated with the spatial differentiation of pension provision.
6. Factors Associated with Spatial Differentiation in Pension Provision
6.1. Spatial Heterogeneity in Pension Supply: Differentiated Drivers Across Pension Systems
The factor-detector results reveal distinct spatial drivers of pension provision across the two pension systems (Figure 2). Overall, employee pension benefits are more strongly associated with fiscal and pension-fund conditions, whereas resident pension benefits are more closely associated with local economic development and household income.
For the UEBP, fiscal and fund-related factors become particularly important in 2023. In 2015, the largest q values included those of resident disposable income (C3) for B4 (q = 0.413), the fiscal expenditure-to-revenue ratio (D1) for B4 (q = 0.400), and pension expenditure relative to tax revenue (D2) for B2 and B4 (q = 0.344 and 0.354). In 2023, C3 remained important for B4 (q = 0.525), while D1 and D2 reached 0.472 and 0.420, respectively. Pension-fund indicators also showed substantial explanatory power for some outcomes, including D5 for B1 (q = 0.397) and D4 for B2 (q = 0.336). These results indicate that the spatial differentiation of UEBP benefits is closely associated with fiscal capacity, fiscal pressure, and fund conditions.
The URRBP exhibits a different pattern. Economic development and income variables have consistently high explanatory power. In 2015, per-capita GDP (C1), per-capita tax revenue (C2), and resident disposable income (C3) generally recorded q values above 0.40 for B5 and B6. Their explanatory power remained strong in 2023, with q values of 0.460–0.523 for C1, 0.467–0.473 for C2, and 0.473–0.479 for C3. Fiscal and fund-related variables also contribute to the spatial differentiation of some benefit indicators, particularly B8, for which D5 and D6 reached q values of 0.457 and 0.309, respectively.
Thus, the two systems exhibit distinct spatial resource structures. The UEBP is more closely associated with fiscal and fund conditions, whereas the URRBP is more strongly embedded in local economic and income conditions. This contrast provides empirical evidence for examining how institutional scale shapes the spatial transmission of regional resource differences into pension provision. The results are interpreted as spatial explanatory associations rather than causal effects.
6.2. UEBP: Fiscal Capacity, Fund Conditions, and Spatial Redistribution
The UEBP results suggest that pension adequacy is associated more strongly with fiscal and fund conditions than with local economic performance alone. This pattern is consistent with the broader pooling and interregional adjustment mechanisms of the employee pension system. Because pension resources can be pooled and adjusted across territorial boundaries, benefit levels in a province need not closely mirror its own economic resource base.
This spatial organization helps explain why the UEBP shows relatively weak and sometimes negative correlations between local economic conditions and benefit levels, as reported in Section 4.2. The factor-detector results do not establish that redistribution causes greater spatial equalization. Rather, taken together with the correlation results, they suggest that broader pooling and fiscal adjustment weaken the direct correspondence between local economic conditions and pension outcomes.
6.3. URRBP: Stronger Embedding in Regional Development Conditions
The URRBP shows a closer spatial correspondence between pension provision and regional economic and income conditions. The relatively high explanatory power of per-capita GDP, tax revenue, and resident disposable income indicates that differences in local resource endowments are more closely associated with differences in resident pension benefits.
This pattern is relevant to the spatial mismatch identified in Section 4 and Section 5. Population ageing generates broadly distributed pension demand, whereas economic and fiscal resources remain unevenly distributed across regions. Where pension provision is more closely associated with local resource conditions, these differences can become reflected in the spatial distribution of pension adequacy. The Geodetector results therefore provide evidence that the resident pension system is more territorially embedded in the regional economic and fiscal environment.
6.4. Interaction Among Economic, Fiscal, and Fund Conditions
The interaction-detector results further show that pension provision is associated with the combined configuration of multiple spatial factors, rather than with any single economic or fiscal condition. Fiscal capacity, pension-fund conditions, economic development, and household income can jointly enhance the spatial explanatory power of the underlying factors.
This finding is important for understanding spatial mismatch. Pension demand is generated primarily by population ageing and pension dependency, whereas the capacity to respond to this demand depends on the spatial configuration of economic resources, fiscal capacity, fund conditions, and institutional arrangements. Their interaction therefore contributes to differentiated regional configurations of pension provision.
The results also caution against interpreting spatial differences in pension provision as a direct consequence of demographic ageing. The relatively limited spatial differentiation of ageing-related demand, compared with the greater differentiation of economic, fiscal, and pension-system conditions, suggests that pension provision reflects the interaction between demographic demand and unevenly distributed territorial resources.
6.5. Implications for Spatial Mismatch and Institutional Scale
Together, the results identify two institutionally differentiated pathways linking regional conditions to pension provision. In the UEBP, pension differentiation is more closely associated with fiscal capacity and fund operation, consistent with a stronger role for pooling and interregional adjustment. In the URRBP, pension provision is more strongly associated with local economic development and income conditions, indicating greater territorial embedding.
These differences help explain why spatial mismatch between pension demand and supply can persist even as population ageing becomes geographically widespread. The spatial distribution of demand is not sufficient to determine the spatial distribution of provision; the institutional scale at which resources are pooled, financed, and redistributed also matters. Where resources are organized and redistributed across broader territorial scales, the direct correspondence between local development and pension outcomes can be weakened. Where provision remains more territorially embedded, regional resource disparities are more readily reflected in pension adequacy.
The findings therefore complement the evidence from the preceding sections: the Gini analysis identifies stronger spatial differentiation in pension provision than in ageing-related demand, the Spearman analysis reveals limited and institutionally differentiated demand–supply correspondence, and the Geodetector analysis identifies the economic, fiscal, and fund-related conditions associated with differentiated provision. Together, these results support the argument that spatial mismatch emerges from the interaction between converging demographic demand, differentiated territorial resources, and institutional scale.
The findings should nevertheless be interpreted within the methodological limits of the Geodetector. The method identifies spatial explanatory relationships and interactions but does not establish causal direction, isolate independent effects, or demonstrate that a particular institutional mechanism produced the observed spatial pattern. The results therefore provide evidence on the spatial structure and associated factors of pension provision, while the causal mechanisms linking demographic change, regional development, and pension governance require further investigation.
7. Discussion
7.1. What the Findings Reveal About the Spatial Geography of Population Ageing
The findings suggest that the spatial geography of population ageing in China is becoming increasingly generalized, while the resources available to respond to ageing remain be more unevenly distributed. This distinction is important for understanding pension income security as a population and spatial issue. Ageing-related pension demand is generated by long-term demographic processes, including sustained low fertility, rising longevity, and the cumulative ageing of large cohorts. These processes increasingly affect provinces across the country rather than remaining concentrated in a limited set of regions. At the same time, the spatial distribution of pension provision continues to reflect substantial differences in regional economic foundations, fiscal capacity, and institutional conditions. The resulting asymmetry means that the geographical spread of demographic need does not automatically produce a corresponding geographical equalization of pension capacity.
This interpretation also places population mobility within a broader demographic process. Earlier migration concentrated working-age populations in economically dynamic destination regions, while many sending regions experienced population ageing in place. As migrants settle and age in destination regions, however, ageing pressures are no longer confined to traditional sending areas. Together with persistently low fertility, this contributes to the increasingly broad geographical reach of ageing. The implication is not that ageing has become spatially uniform: the demand indicators remain regionally differentiated. Rather, ageing-related pension pressure has become a more generalized demographic condition, whereas the capacity to finance and provide pensions remains considerably more territorially differentiated. This distinction helps explain why population ageing should be examined not only as a change in demographic composition but also as a transformation in the spatial distribution of social protection needs.
7.2. Why Demographic Need and Pension Capacity Diverge Spatially
The spatial mismatch identified in this study reflects the interaction between demographic need and the uneven distribution of resources available to meet that need. Regions experiencing stronger ageing-related pressure do not necessarily possess proportionately greater economic or fiscal capacity. Conversely, regions with stronger economic foundations may face relatively lower demographic pressure. The negative demand–supply associations identified in the analysis are therefore consistent with a spatial mismatch between the geography of ageing-related need and the geography of pension capacity. Because the analysis is based on spatial associations, however, these relationships should not be interpreted as evidence that ageing itself causes weaker pension provision or that regional development independently determines pension outcomes.
This pattern can be understood through the broader geography of uneven development. Demographic reproduction and economic accumulation are organized through different spatial processes. Fertility decline and population ageing diffuse across regions through demographic transition, while income generation, employment, tax bases, and fiscal resources remain strongly differentiated by regional development trajectories. Pension systems must therefore mediate between a relatively generalized demographic demand and a territorially uneven resource base. The findings suggest that pension security is shaped not simply by how many older people a region has, but by how the institutional system connects demographic needs to resources across space.
This perspective extends the interpretation of pension inequality beyond a simple distinction between high- and low-income regions. The central issue is the degree of spatial correspondence between demographic pressure and institutional capacity. Where redistribution operates across broader territorial boundaries, local differences in economic capacity can be partly compensated. Where financing remains more dependent on local fiscal and economic conditions, regional development differences can be transmitted more directly into pension outcomes. Spatial mismatch is therefore better understood as a relational property of the pension system than as a characteristic of individual provinces alone.
7.3. Institutional Scale and Differences Between UEBP and URRBP
The contrast between the Urban Employee Basic Pension (UEBP) and the Urban and Rural Resident Basic Pension (URRBP) demonstrates why governance scale matters for the spatial organization of pension security. The two programs address related demographic risks but operate through different institutional and redistributive configurations. The spatial associations observed for the UEBP are more closely connected to fiscal capacity and pension-fund conditions, while URRBP outcomes show stronger correspondence with regional economic and income conditions. These differences are consistent with the broader pooling and interregional adjustment mechanisms of the UEBP and the more territorially embedded financing structure of the URRBP.
The implication is not that one institutional arrangement eliminates spatial inequality. Rather, different scales of pooling and redistribution alter the extent to which local economic conditions are translated into pension outcomes. Broader pooling can spread demographic and financial risks across regions and weaken the correspondence between local economic capacity and pension provision. More localized financing can preserve a stronger connection between local fiscal and economic conditions and benefit adequacy. Governance scale thus operates as an important mediating dimension between uneven development and the spatial distribution of pension security.
This finding also refines the interpretation of spatial mismatch. A mismatch is not necessarily resolved simply by increasing the resources available within individual jurisdictions. It may also depend on whether the institutional scale of redistribution corresponds to the geographical scale at which demographic risks are distributed. As ageing becomes a more generalized national condition, the capacity of pension institutions to pool risks across regions becomes increasingly relevant to the spatial alignment between need and provision.
7.4. Implications for Population Policy and Ageing Societies
The findings have implications for how population ageing is incorporated into pension and population policy. First, demographic ageing should be treated as a spatially distributed policy demand rather than solely as a national aggregate. Indicators of ageing, pension dependency, and demographic vulnerability can help identify where pressures are emerging, but these indicators need to be considered together with regional fiscal and economic capacity. A province with a similar ageing burden may face very different pension constraints depending on its resource base and institutional arrangements.
Second, the spatial organization of redistribution matters for the effectiveness of responses to ageing. Higher-level pooling and interregional adjustment can provide mechanisms for sharing risks that are increasingly national in geographical reach. For resident-based pension arrangements, strengthening redistributive capacity may be particularly relevant where local fiscal and economic conditions are closely associated with benefit adequacy. More generally, intergovernmental transfers can incorporate demographic pressure alongside fiscal capacity when allocating resources for pension security. These implications follow from the spatial relationships identified in this study; they do not imply that any single institutional reform is sufficient to resolve regional pension disparities.
Third, the Chinese case has broader relevance for ageing societies experiencing uneven regional development. As population ageing spreads geographically, the key institutional question is increasingly how social protection systems connect geographically distributed demographic needs with unevenly distributed economic and fiscal resources. The issue is therefore not unique to China, although the institutional forms through which it appears will differ across welfare systems. A population-geographical perspective can help identify where demographic change and territorial capacity diverge and thereby complement analyses focused on aggregate pension adequacy.
7.5. Limitations
Several limitations should be acknowledged. First, the analysis focuses primarily on formal pension institutions and therefore does not capture other forms of support that shape the economic security of older people, including family transfers, migration-based support networks, and informal care. These mechanisms may partially compensate for or reinforce regional differences in formal pension provision. Second, the analysis is conducted at the provincial level. This scale is appropriate for examining interregional differences in pension administration and fiscal capacity, but it may conceal substantial variation among cities, counties, and rural communities. Third, the Spearman correlation analysis identifies spatial associations rather than causal relationships, while the Geographic Detector identifies spatial explanatory associations rather than causal effects or independent marginal effects. The results should therefore be interpreted as evidence of spatial differentiation and alignment rather than as causal estimates. Future research could combine finer spatial scales with longitudinal and causal approaches to examine how demographic change, migration, regional restructuring, and pension governance interact over time.
8. Conclusion and Implications
This study examined the spatial organization of pension income security in China from a population-geographical perspective. It focused on the relationship between ageing-related pension demand and pension provision and showed that the two are characterized by different spatial patterns. Ageing-related demand has become a broadly distributed demographic condition, although substantial regional differences remain. Pension provision, in contrast, continues to be more strongly differentiated across regions because economic foundations, fiscal capacity, and pension-system conditions vary geographically. The resulting negative spatial associations between demographic pressure and pension provision are consistent with a persistent spatial mismatch between the geography of ageing-related need and the geography of institutional capacity.
The comparison of the UEBP and URRBP further demonstrates that the spatial organization of redistribution matters. Broader pooling and interregional adjustment in the UEBP weaken the direct correspondence between local economic conditions and pension outcomes, whereas the more territorially embedded URRBP remains more closely associated with regional economic and income conditions. These differences indicate that pension institutions mediate the relationship between demographic change and uneven regional development rather than simply responding to population ageing. The scale at which resources are pooled and redistributed is therefore an important dimension of spatial pension security.
The study contributes to population research by linking population ageing to the spatial organization of social protection. It shows that the policy challenge associated with ageing is not only the aggregate growth of the older population but also the geographical alignment of demographic need and institutional capacity. For ageing societies characterized by uneven regional development, pension policy may therefore benefit from considering demographic pressure together with territorial differences in fiscal and economic capacity. Higher-level risk pooling, interregional adjustment, and transfer arrangements that explicitly account for ageing-related pressure are potential institutional mechanisms for improving this alignment, particularly where pension outcomes remain closely tied to local resource conditions.
The study does not establish causal effects, and its provincial-level analysis captures only part of the wider system of support for older people. Nevertheless, the findings demonstrate the value of treating pension security as a spatial demographic issue. As population ageing becomes an increasingly shared condition across regions, understanding how pension institutions connect geographically distributed needs with unevenly distributed resources will remain important for the long-term sustainability and equity of ageing societies.
Author Contributions
Li Zhang: Conceptualization, methodology, formal analysis, validation, writing – original draft, writing -- review & editing, final approval. Yi Yuan: Data curation, analysis, funding acquisition.
Funding
This study was supported by the National Social Science Foundation of China (23CRK014), and by the fund from Ministry of Education of the PRC (21YJA840016).
Data Availability Statement
The data that support the findings of this study are publicly available in the official website of the National Bureau of Statistics of China (https://stats.gov.cn/sj/ndsj).
Ethics Approval Statement
Not applicable as this study did not involve human subjects.
Conflicts of Interest
The authors declare no conflict of interests.
References
- Brenner, N. New State Spaces: Urban Governance and the Rescaling of Statehood; Oxford University Press, 2004. [Google Scholar]
- Cai, Y.; Cheng, Y. Pension reform in China: challenges and opportunities. J. Econ. Surv. 2014, 28, 636–651. [Google Scholar] [CrossRef]
- Chen, Q.; Chen, S. The affordability of China’s urban basic pension insurance: regional disparities and influencing factors – an empirical study based on multi-indicator measurement using the Theil index and provincial panel data. J. Hubei Univ. Econ. 2021, 19, 39–48. (in Chinese). [Google Scholar] [CrossRef]
- Dong, K.; Wang, G. China’s pension system: achievements, challenges and future developments. Econ. Political Stud. 2016, 4, 414–433. [Google Scholar] [CrossRef]
- Fang, H.; Feng, J. The Chinese pension system. National Bureau of Economic Research (NBER) Working Paper 25088. 2018. Available online: https://www.nber.org/system/files/working_papers/w25088/w25088.pdf.
- Ferguson, S. Women and Work: Feminism, Labor, and Social Reproduction; Pluto Press, 2019. [Google Scholar]
- Fraser, N. Contradictions of capital and care. New Left Rev. 2016, 100, 99–117. [Google Scholar] [CrossRef]
- Giles, J.; Lei, X.; Wang, G.; Wang, Y.; Zhao, Y. One country, two systems: evidence on retirement patterns in China. J. Pension Econ. Financ. 2023, 22, 188–210. [Google Scholar] [CrossRef] [PubMed]
- Hall, S. Geographies of money and finance II: financialization and financial subjects. Prog. Hum. Geogr. 2011, 36, 403–411. [Google Scholar] [CrossRef]
- Harvey, D. Social Justice and the City; Edward Arnold: London, 1973. [Google Scholar]
- Haughton, G.; Jones, M.; Peck, J.; Tickell, A.; White, A. Labor market policy as flexible welfare: prototype employment zones and the new workfarism. Reg. Stud. 2000, 34, 669–680. [Google Scholar] [CrossRef]
- Jessop, B. The Future of the Capitalist State; Polity, 2002. [Google Scholar]
- Li, M.; Zhang, L. Effects of public pensions on elderly poverty: insights from an ageing China. Post-Communist Econ. 2022, 34, 520–542. [Google Scholar] [CrossRef]
- Li, Q.; Zhou, Y.; Zhang, L.; Wu, X.N. Regional disparities and the influence mechanism within China’s urban employees’ basic endowment insurance funds. Acta Geogr. Sin. 2018, 73, 2409–2422. (in Chinese). [Google Scholar] [CrossRef]
- Liu, T.; Sun, L. Pension reform in China. J. Aging Soc. Policy 2016, 28, 15–28. [Google Scholar] [CrossRef] [PubMed]
- Macleod, G.; Jones, M. Renewing the geography of regions. Environ. Plan. D. Soc. Space 2001, 19, 669–695. [Google Scholar] [CrossRef]
- Macleod, G.; Jones, M. Territorial, scalar, networked, connected: in what sense a “regional world”? Reg. Stud. 2007, 41, 1177–1191. [Google Scholar] [CrossRef]
- Massey, D. Spatial Divisions of Labor; Routledge, 1995. [Google Scholar] [CrossRef]
- McCann, P. Perceptions of regional inequality and the geography of discontent: insights from the UK. Reg. Stud. 2020, 54, 256–267. [Google Scholar] [CrossRef]
- Morgan, K. The polycentric state: new spaces of empowerment and engagement? Reg. Stud. 2007, 41, 1237–1251. [Google Scholar] [CrossRef]
- Oates, W.E. On the evolution of fiscal federalism: theory and institutions. Natl. Tax J. 2008, 61, 313–334. [Google Scholar] [CrossRef]
- OECD. Pensions at A Glance 2021: OECD and G20 Indicators; OECD Publishing, 2021. [Google Scholar] [CrossRef]
- Peck, J.J. Geography and public policy: constructions of neoliberalism. Prog. Hum. Geogr. 2004, 28, 392–405. [Google Scholar] [CrossRef]
- Peck, J.J.; Tickell, A. Social regulation after Fordism: regulation theory, neo-liberalism and the global-local nexus. Econ. Soc. 1995, 24, 357–386. [Google Scholar] [CrossRef]
- Queisser, M.; Reilly, A.; Hu, Y. China’s pension system and reform: an OECD perspective. Econ. Political Stud. 2016, 4, 345–367. [Google Scholar] [CrossRef]
- Rodríguez-Pose, A. The revenge of the places that don’t matter (and what to do about it). Reg. Econ. Soc. 2018, 11, 189–209. [Google Scholar] [CrossRef]
- Schwarz, A.; Pallares-Miralles, M. Understanding Income Security for Older Adults; World Bank, 2024. Available online: https://thedocs.worldbank.org/en/doc/98421347706d9fecd936be71c0845479-0140022024/original/Understanding-income-security-for-older-adults.pdf.
- Scott, A.; Storper, M. Regions, globalization, development. Reg. Stud. 2003, 37, 579–593. [Google Scholar] [CrossRef]
- Smith, N. Uneven Development: Nature, Capital and the Production of Space; The University of Georgia Press, 1984. [Google Scholar]
- Soja, E.W. Seeking Spatial Justice; University of Minnesota Press, 2010. [Google Scholar]
- Swyngedouw, E. Neither global nor local. In Spaces of Globalization: Reasserting the Power of the Local (Perspectives on Economic Change; Cox, K.R., Ed.; The Guilford Press, 1997. [Google Scholar]
- Wang, B.; Loo, B.; Zhang, F. Aging in place: toward understanding momentary well-being and daily satisfaction of older people. Ann. Am. Assoc. Geogr. 2024, 114, 2044–2067. [Google Scholar] [CrossRef]
- Wang, H.; Huang, J. How can China’s recent pension reform reduce pension inequality? J. Aging Soc. Policy 2023, 35, 37–51. [Google Scholar] [CrossRef] [PubMed]
- Wang, J.; Li, X.; Christakos, G.; Liao, Y.; Zhang, T.; Gu, X.; Zheng, X. Geographical detectors-based health risk assessment and its application in the neural tube defects study of the Heshun region, China. Int. J. Geogr. Inf. Sci. 2010, 24, 107–127. [Google Scholar] [CrossRef]
- Wang, J.; Xu, C. Geodetector: principle and prospective. Acta Geogr. Sin. 2017, 72, 116–134. (in Chinese). [Google Scholar] [CrossRef]
- Wang, L.; Wu, R. A study on spatial-temporal pattern of population ageing and its factors in China: based on county-scale examination. Chin. J. Popul. Sci. 2016, 30, 74–84. (in Chinese). [Google Scholar]
- Wang, W.; Shi, H.; Li, Q. Pension gap between the Chinese public and nonpublic sectors: evidence in the context of the integration of dual-track pension schemes. Int. Rev. Econ. Financ. 2023, 85, 664–688. [Google Scholar] [CrossRef]
- Wolch, J.R. The shadow state: transformations in the voluntary sector. In The Power of Geography (RLE Social & Cultural Geography): How Territory Shapes Social Life; Wolch, J., Dear, M., Eds.; Routledge, 1989. [Google Scholar] [CrossRef]
- Xia, C.; He, Y.; Heng, Y.; Kang, K.; Shenchen, H.; Hao, Y.; Meng, Z. Pension system reform, financial security, and the well-being of the elderly population: an analysis based on CSS data. Int. Rev. Econ. Financ. 2025, 101, 104241. [Google Scholar] [CrossRef]
- Zhang, L.; Li, M. Acquired but unvested welfare rights: migration and entitlement barriers in reform-era China. China Q. 2018, 235, 669–692. [Google Scholar] [CrossRef]
- Zhang, S.; Wang, X.; Li, H.; Wang, H. The geographical pension gap: understanding the causes of inequality in China’s pension funds. PLoS ONE 2023, 18, e0288754. [Google Scholar] [CrossRef] [PubMed]
Figure 1.
Correlation of variables. Notes: (1) A positive correlation coefficient indicates that the two variables change in the same direction. A negative correlation coefficient indicates that they change in opposite directions. (2) Coefficient 0.8--1.0, extremely strong correlation; 0.4—0.6, a moderate correlation; 0.2—0.4, a weak correlation; 0—0.2, extremely weak or no correlation. Source: Author’s calculation.
Figure 1.
Correlation of variables. Notes: (1) A positive correlation coefficient indicates that the two variables change in the same direction. A negative correlation coefficient indicates that they change in opposite directions. (2) Coefficient 0.8--1.0, extremely strong correlation; 0.4—0.6, a moderate correlation; 0.2—0.4, a weak correlation; 0—0.2, extremely weak or no correlation. Source: Author’s calculation.
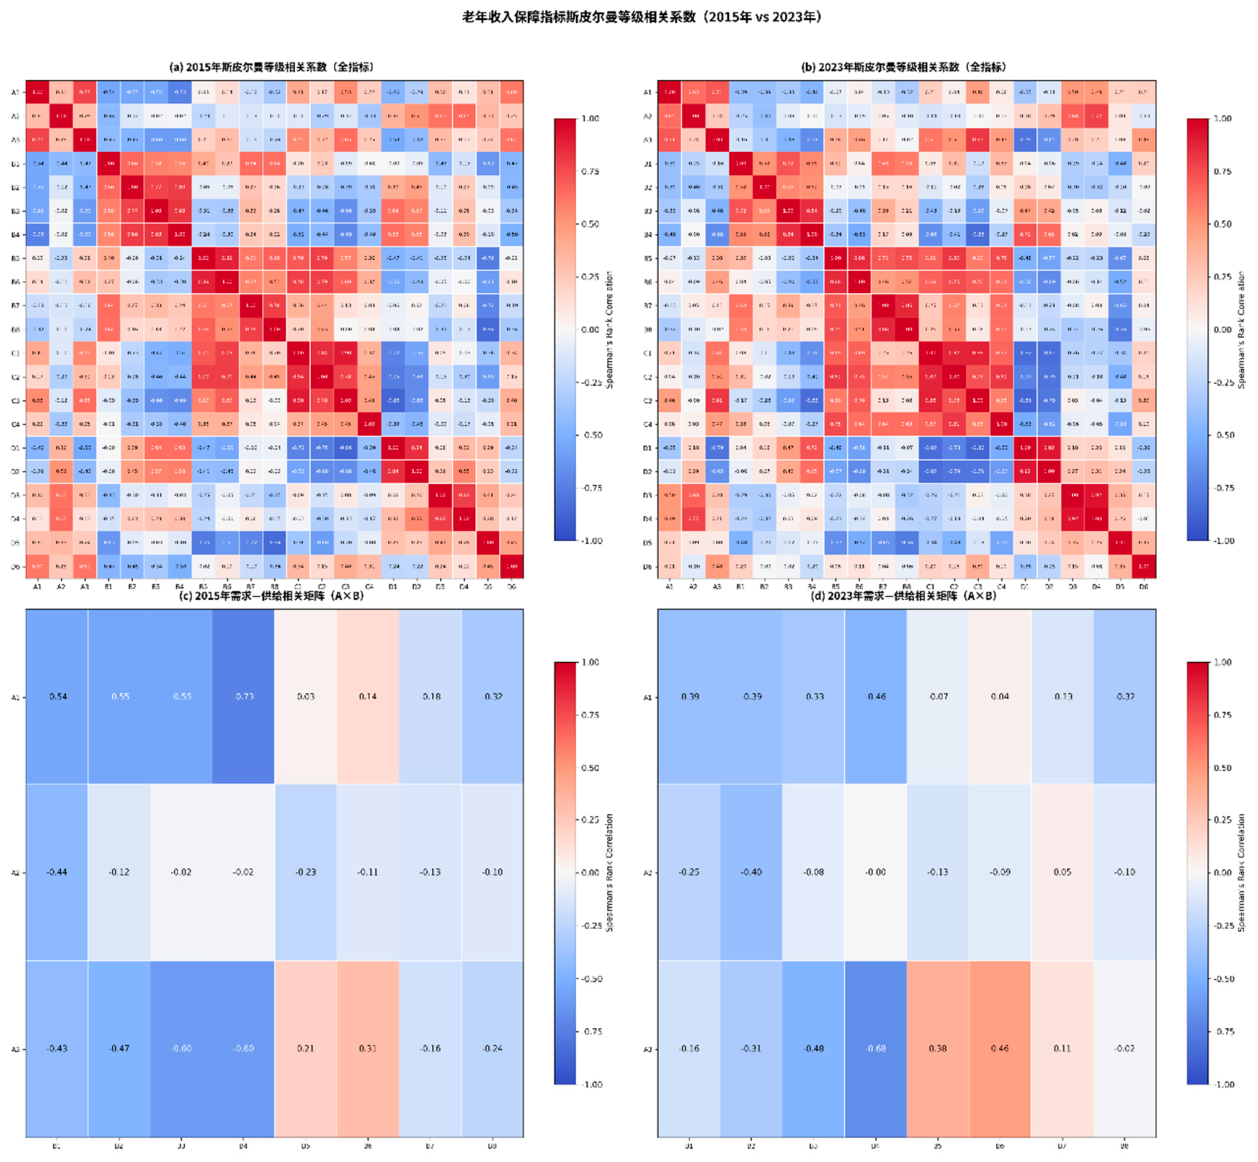
Figure 2.
Drivers of pension outcome. Notes: (1) The q statistic reflects the explanatory power of the independent variable (shown on the vertical axis) on the spatial differentiation of the dependent variable (shown on the horizontal axis) (ranging from 0 to 1). (2) The p value indicates the significance level. Source: Author’s calculation.
Figure 2.
Drivers of pension outcome. Notes: (1) The q statistic reflects the explanatory power of the independent variable (shown on the vertical axis) on the spatial differentiation of the dependent variable (shown on the horizontal axis) (ranging from 0 to 1). (2) The p value indicates the significance level. Source: Author’s calculation.
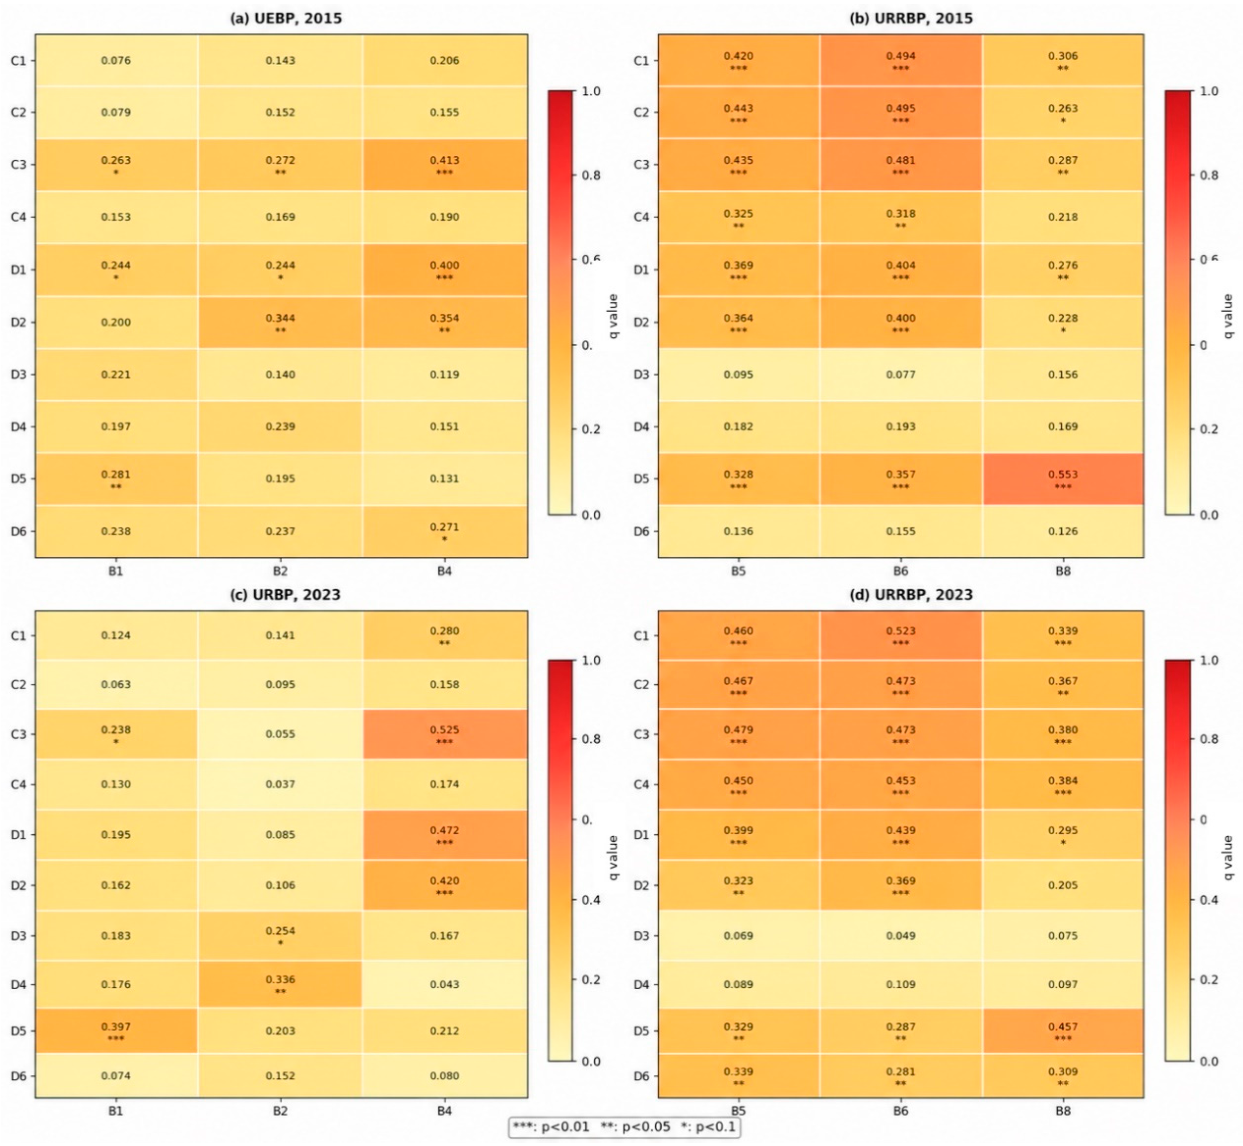
Table 1.
An evaluation index scheme of demand and supply in pension income.
| Category | Variable | Variable code | Measurement |
|---|---|---|---|
| Demand dimension | |||
| A. Pension pressure | Level of ageing | A1 | Population aged 65+ as % of the total population |
| UEBP dependency ratio | A2 | Pensioners as % of the total contributors of the UEBP | |
| URRBP dependency ratio | A3 | Beneficiaries as % of the total contributors of the URRBP | |
| Supply dimension | |||
| B. Pension adequacy | UEBP absolute level of pension benefit | B1 | UEBP pension expenditure per retiree |
| UEBP replacement level | B2 | UEBP pension benefit as % of the local urban average income | |
| UEBP relative level of pension benefit (1) | B3 | UEBP pension benefit as % of local urban food expenditure | |
| UEBP relative level of pension benefit (2) | B4 | UEBP pension benefit as % of urban disposable income | |
| URRBP absolute level of pension benefit | B5 | URRBP pension expenditure per retiree | |
| URRBP replacement level | B6 | URRBP pension benefit as % of local rural average income | |
| URRBP relative level of pension benefit (1) | B7 | URRBP pension benefit as % of rural food expenditure | |
| URRBP relative level of pension benefit (2) | B8 | URRBP pension benefit as % of rural disposable income | |
| C. Economic foundation | Level of economic capacity | C1 | GDP per capita (yuan) |
| Fiscal capacity | C2 | Tax revenue per capita (yuan) | |
| The standard of living | C3 | Disposable income per capita (yuan) | |
| Accountability of fiscal capacity | C4 | Tax revenue as % of total revenue | |
| D. Fiscal sustainability | Fiscal austerity | D1 | Public expenditure as % of total revenue |
| Burden of social protection | D2 | Social security expenditure as % of tax revenue | |
| Financial vulnerability of UEBP fund | D3 | No. of UEBP beneficiary supported by per unit of the cumulative UEBP fund balance (person per 10 thousand yuan) | |
| UEBP financial health | D4 | Annual UEBP expenditure as % of annual UEBP income | |
| Financial vulnerability of URRBP fund | D5 | No. of URRBP beneficiary supported by per unit of the cumulative URRBP fund balance (person per 10 thousand yuan) | |
| URRBP financial health | D6 | Annual URRBP expenditure as % of annual URRBP income | |
Note: UEBP refers to Urban Employee Basic Pension program; URRBP refers to Urban and Rural Resident Basic Pension program.
Table 2.
Gini Coefficient of Demand and Supply Indicators.
| Indicator | 2015 | 2023 |
|---|---|---|
| A1 | 0.107 | 0.130 |
| A2 | 0.178 | 0.201 |
| A3 | 0.173 | 0.181 |
| B1 | 0.144 | 0.133 |
| B2 | 0.110 | 0.119 |
| B3 | 0.161 | 0.164 |
| B4 | 0.175 | 0.156 |
| B5 | 0.333 | 0.376 |
| B6 | 0.249 | 0.343 |
| B7 | 0.225 | 0.284 |
| B8 | 0.208 | 0.234 |
| C1 | 0.228 | 0.214 |
| C2 | 0.361 | 0.366 |
| C3 | 0.410 | 0.379 |
| C4 | 0.059 | 0.060 |
| D1 | 0.059 | 0.060 |
| D2 | 0.293 | 0.304 |
| D3 | 0.423 | 0.516 |
| D4 | 0.082 | 0.099 |
| D5 | 0.261 | 0.300 |
| D6 | 0.082 | 0.094 |
Note: See Table 1 for definition of indicator codes. Source: Author’s calculation based on data from Chinese Statistical Yearbook (2015--2023).
Disclaimer/Publisher’s Note: The statements, opinions and data contained in all publications are solely those of the individual author(s) and contributor(s) and not of MDPI and/or the editor(s). MDPI and/or the editor(s) disclaim responsibility for any injury to people or property resulting from any ideas, methods, instructions or products referred to in the content. |
© 2026 by the authors. Licensee MDPI, Basel, Switzerland. This article is an open access article distributed under the terms and conditions of the Creative Commons Attribution (CC BY) license (http://creativecommons.org/licenses/by/4.0/).
Copyright: This open access article is published under a Creative Commons CC BY 4.0 license, which permit the free download, distribution, and reuse, provided that the author and preprint are cited in any reuse.