

Submitted:
05 October 2026
Posted:
08 October 2026
You are already at the latest version
Abstract
The response of a material to CO₂ snow cleaning is conditional on both the structure of the deposit and the morphology of the textile. To examine these two factors under controlled conditions, six model systems were compared, in which three natural fibre textiles (silk, cotton, and linen) were combined with two representative types of deposit: a particulate red clay deposit, and a gelatinised wheat starch film. Eighteen treated specimens were characterised before the application of the deposit (M0), after application and drying (M1), and after CO₂ snow treatment (M2), which was performed using predefined configurations ranging from 1.5 to 6 bar and from 1 to 4 min. Optical and surface measurements were taken over trajectories at the specimen level (M0–M1–M2). In parallel, attenuated total reflectance Fourier transform infrared spectroscopy (ATR-FTIR) provided local spectral characterisation at selected contact sites, while digital and field-emission scanning electron microscopy supplied complementary morphological evidence at different observation scales. The two types of deposit produced distinct response profiles, with visible and chromatic changes predominating in the clay systems and surface-sensitive measurements providing greater differentiation in the starch systems. After treatment, residual colour differences (ΔE*ab) ranged from 6.65 to 34.00 for the red clay specimens and from 0.21 to 2.88 for the starch. At 85°, post-treatment gloss was below the clean textile (M0) value in 16 of the 18 specimens. The two remaining specimens, both from the linen starch group, had M2 readings above M0. The 60° gloss response of the starch systems varied across textiles. Normalised ATR-FTIR band ratios reflected the attenuation of deposit-associated bands at selected contact sites, while the residual material and local surface morphology were examined via microscopy. This integrated analytical approach differentiated between particulate and film-forming deposits, and showed that each textile–deposit system was characterised by a specific combination of optical, surface, spectroscopic, and morphological indicators.
Keywords:
CO₂ snow cleaning
; textile conservation
; silk
; cotton
; linen
; red clay
; starch film
; attenuated total reflectance Fourier transform infrared spectroscopy (ATR-FTIR)
; field emission scanning electron microscopy (FESEM)
1. Introduction
Cleaning is one of the most important operations in textile conservation, as the process of removing unwanted material may also affect fibres, yarns, dyes, finishes, or the structural relationships within a fabric. The selection of a cleaning procedure therefore requires consideration not only of the amount of deposit removed, but also of any changes that may be induced in the textile surface. Achieving a suitable balance is particularly challenging when working with porous and heterogeneous materials, as deposited particles may penetrate between fibres and evolve through interactions with the atmosphere and substrate, while the cleaning interventions themselves may affect the optical, mechanical, or surface properties of the textile. Researchers in the area of historical textiles have therefore emphasised the need to assess the efficiency of cleaning and the material response together, rather than treating deposit removal as the sole criterion of suitability [1,2,3,4,5].
The behaviour of a deposit depends on its composition and its interaction with the textile substrate. Mineral particulate deposits may remain on the surface of the fibre or enter the inter-fibre and inter-yarn spaces of the fabric [5]. Starch-based materials behave differently, as they can form cohesive films, adhere to fibres, and alter the optical and surface properties of a fabric. Starch pastes have been used as adhesives or consolidants in textile conservation, and their removal has been investigated mainly through α-amylase-based treatments [6,7]. These studies have shown that the assessment of starch removal must also take into consideration the treatment conditions, residual material, colour, mechanical properties, and possible changes to the fibres [6,7,8]. Red clay and starch represent two deposits with distinct removal requirements: one mainly consists of particulates, whereas the other can form a continuous or discontinuous film around and between fibres.
Techniques such as mechanical dry cleaning, controlled aqueous treatments, suction-based procedures, and enzymatic methods have been applied to textile materials, according to the characteristics of the object and the deposit [1,2,6,7,9]. However, each procedure has a distinct profile in terms of the interaction with the textile, deposit, and associated materials. In mechanical dry cleaning, physical action may deform or abrade weakened fibres, and may displace particles further into a porous structure [5,10]. By contrast, the effectiveness of aqueous cleaning depends on the stability of the fibres, dyes, finishes, and associated materials [1,3]. Enzymatic treatments require careful control over the concentration, pH, temperature, application time, and subsequent removal of the enzyme and degradation products [6,7,11]. These characteristics support the assessment of cleaning processes in which a liquid phase is not directly introduced into the textile. Their evaluation still requires simultaneous documentation of the deposit response and the changes in the optical, surface, and morphological characteristics of the textile [2,3,4].
In this context, carbon dioxide snow cleaning represents a potentially suitable approach, as it involves passing a stream containing fine solid CO₂ particles generated by the controlled expansion of carbon dioxide through a nozzle [10,12,13]. It must be distinguished from dry ice blasting with macroscopic pellets, as these processes involve different forms of the CO₂ feed, equipment configurations, and operating ranges [14,15]. The smaller mass and dimensions of CO₂ snow particles mean they have a different impact energy from those produced by millimetre-scale pellets [12]. Particle detachment is associated principally with momentum transfer and aerodynamic drag, while the transient formation of liquid CO₂ at the interface may contribute to the removal of some organic residues [12]. The projected CO₂ subsequently sublimates, so the treatment does not leave particles of the cleaning media on the substrate. However, the mechanical action of the jet and the local decrease in temperature are important aspects when the technique is applied to sensitive fibrous materials [10].
Previous studies have established a basis for considering solid CO₂ cleaning in cultural heritage conservation. Mašková et al. examined the application of CO₂ snow cleaning to paper, and reported the removal of particles from smooth and rough cellulose surfaces, including particles embedded in the fibrous structure. In their evaluation, the cleaning efficiency was investigated via microscopic, optical, mechanical, and chemical observations, and the treatment was compared with nitrogen jet and mechanical dry-cleaning procedures [10]. Stoveland et al. evaluated the use of CO₂ snow blasting and other cleaning systems with artificially aged and soiled painting mock-ups, using visual examination, colour and gloss measurements, light microscopy, and SEM. Their results showed moderate removal of soiling with a comparatively low risk of abrasion, and indicated that surface cooling, condensation, and potential particle redeposition were operational considerations requiring control [16]. Grønlund investigated the use of solid CO₂ blasting for soot removal from fire-affected textiles, and determined its potential for use on less heat-damaged specimens, although that work involved blasting with solid CO₂ rather than the finer snow projection evaluated here [17]. More recently, Mašková et al. assessed the application of automated CO₂ snow microblasting to cellulose-based cultural heritage materials, including uncoated textile surfaces, and compared the response with traditional dry-cleaning methods [18]. Recent experimental work on coated metallic heritage has likewise shown that the cleaning performance of solid CO₂ varies with the target material and substrate–coating system, and that its environmental assessment requires explicit consideration of CO₂ consumption and energy demand [19]. These prior studies show that the technique has already been applied to fibrous heritage materials, but they also highlight that its performance depends on the substrate, contaminant, equipment, operating conditions, and criteria used to identify both cleaning efficacy and alteration.
In the extant literature, the response of CO₂ snow cleaning to deposits with markedly different physical behaviour across natural-fibre textiles remains insufficiently characterised. Heritage applications have focused mainly on particulate contamination of paper and other cellulose-based surfaces, or on the removal of soot from fire-affected textiles using coarser solid CO₂ blasting [17], with limited testing of uncoated textile surfaces [10,18]. Research on other non-contact cleaning techniques also indicates that paper and textile substrates cannot be assumed to behave equivalently, and that the response to a treatment may vary with the chemistry and morphology of the fibre, its age, and the operating parameters [4,20,21]. Few studies have involved direct comparison of a mineral particulate deposit and a film-forming starch deposit applied to silk, cotton, and linen and treated under different CO₂ snow projection conditions. A multi-analytical approach is therefore needed to determine whether apparently similar visual responses are supported by optical, surface, spectroscopic, and morphological evidence [2,3,4,20].
In this context, CO₂ snow cleaning responses were compared for six model textile–deposit systems, in which silk, cotton, and linen were treated with a particulate red clay deposit or a gelatinised wheat starch film. The treated specimens were examined at three stages: before application of the deposit (M0), after application and drying (M1), and after CO₂ snow treatment (M2). A combination of macroscopic observation and digital microscopy, colourimetry, gloss measurements, surface pH, wettability, attenuated total reflectance Fourier-transform infrared spectroscopy (ATR-FTIR), and field-emission scanning electron microscopy (FESEM) was used to construct specimen-level response profiles.
Given the contrasting physical behaviour of the two deposits, this study was conducted to evaluate whether particulate red clay and gelatinised starch generated distinguishable material response profiles under CO₂ snow treatment, and to assess how colourimetry, gloss measurements, surface pH, wettability, ATR-FTIR, and microscopy contributed to the characterisation of these responses across the textile–deposit systems. The objective was to compare these profiles for silk, cotton, and linen through the sequence M0–M1–M2. The scientific contribution of this study lies in the development of an analytical framework that distinguishes between the optical response at the specimen level, the surface descriptors of each textile–deposit system, the spectral response at the contact site, and the morphological features observed in each selected field.
2. Materials and Methods
2.1. Comparative Material-Response Design
This study involved a comparative matrix of material responses, comprising three textiles of natural fibres and two deposits applied in the laboratory. Silk was chosen to represent a proteinaceous substrate, while cotton and linen represented cellulosic substrates. Red clay was selected as a predominantly particulate deposit, and gelatinised wheat starch as a film-forming deposit capable of surrounding fibres and occupying weave interstices.
The basic matrix therefore consisted of six textile–deposit systems. One clean, untreated reference specimen was retained for each textile. Each textile–deposit system included one untreated as-deposited reference, consisting of the textile bearing the dried deposit without CO2 snow treatment, and the three specimens assigned to the predefined CO₂ snow configurations. The complete matrix comprised 27 specimens: three clean textile reference specimens, six untreated as-deposited reference specimens, and 18 treated specimens.
The codes SE, AL, and LN were used to represent silk, cotton, and linen, while BA denoted the red clay deposit, and AM denoted starch. The number following each code identified the treatment configuration.
Each treated specimen was characterised in three successive states: M0, corresponding to the clean textile before application of the deposit; M1, representing the same specimen after application and drying of the deposit; and M2, denoting the specimen after CO₂ snow treatment. The clean reference specimens for the textiles were used to establish the initial substrate morphology and spectral profile, while the untreated as-deposited references for the deposits supported the identification of features related to the deposit. The sequence M0–M1–M2 provided the specimen-level response trajectory for the longitudinal optical measurements. For ATR-FTIR comparisons, spectra from a clean textile reference, an untreated as-deposited reference, and selected treated specimens were used, as described in Section 2.4.
The complete experimental design, coding system, material states, and analytical levels are summarised in Figure 1.
Each treated specimen was considered as an analytical unit for assessing the responses specific to each textile–deposit pair. Colourimetric and gloss measurements were used to follow the trajectory M0–M1–M2 for each treated specimen. The surface pH and water-drop absorption response described the surface behaviour of each textile–deposit system, while ATR-FTIR band ratios provided local spectroscopic information for the selected areas under analysis. Digital microscopy and FESEM were used to document the morphological features of the selected observation fields. These complementary analytical levels were integrated based on the direction, magnitude, and spatial scale involved in each technique.
2.2. Preparation of Textile–Deposit Model Systems
The substrates were commercial undyed fabrics made of silk, cotton, and linen. Their suppliers and commercial references are given in Table 1.
Before preparation of the specimens, the fabrics were prewashed in an aqueous Teepol solution at 2 mL/L to remove manufacturing finishes that could interfere with the initial characterisation or subsequent measurements. The prewashed fabrics were subsequently air-dried horizontally at room temperature, and then cut along the thread directions into specimens measuring 75 × 100 mm. Each specimen was individually coded, and the same identifier was retained throughout preparation, treatment, and analysis.
The red clay deposit was prepared by dispersing SIO-2 Argila natural red clay in water at 100 g/L. Specimens were immersed in the dispersion for 5 min and then dried horizontally for approximately 24 h at room temperature, under ambient laboratory conditions. Drying was considered complete when the aqueous medium had visibly evaporated and the specimens had reached an apparently dry state.
The starch deposit was prepared using commercial wheat starch supplied by CTS Europe, Altavilla Vicentina, Italy. Two predefined material protocols were used: a 5% w/v formulation was applied to silk and cotton, while a 10% w/v formulation was applied to linen. During preparation, the recorded temperature ranged from approximately 60 to 75 °C. The starch dispersions were heated for 5–10 min with continuous manual stirring. Gelatinisation was considered complete when the paste took on a homogeneous, creamy, and translucent appearance after the maximum observed viscosity had been reached. The specimens were immersed in the prepared paste and immediately withdrawn, without an extended immersion period. They were subsequently dried on a rigid support to limit planar deformation during the water loss and film formation processes. Since the applied formulation differed between the linen fabric and the silk and cotton specimens, each textile–starch system was analysed within its own predefined conditions, and cross-system interpretation focused on analytical response patterns rather than on absolute magnitudes.
2.3. CO₂ Snow Treatment
CO₂ snow was applied using a CryoSnow SJ-5 system fitted with a flat nozzle (FN-5-10 × 1.5). The nozzle had a rectangular outlet measuring 10 × 1.5 mm [22]. The system was operated manually using the trigger, and the jet was moved across the surface of the specimen with a sweeping motion.
Treatments were applied in the cryogenic testing area of the CMT-Clean Mobility & Thermofluids Institute, Universitat Politècnica de València. The recorded environmental conditions were 25 °C and 50% relative humidity. The nozzle was held at an incident angle of 45°, and the working distance was maintained between 20 and 30 mm from the textile surface.
The equipment, nozzle, and application geometry are shown in Figure 2.
The treatment matrix comprised the predefined configurations listed in Table 2. For the red clay series, a fixed application time of 1 min was used with varying nominal pressure settings. The linen–starch series involved application times of 2, 3, and 4 min at a nominal setting of 6 bar. The silk–starch and cotton–starch series were analysed using the pressure–time configurations specified in Table 2. Each pressure–time combination was treated as a complete operational configuration. Treatment of each specimen ceased when the cumulative application time assigned in Table 2 had elapsed, which constituted the operational endpoint.
The pressure values given below correspond to nominal CryoSnow SJ-5 equipment settings, rather than to pressure measurements at the textile surface [22]. According to the manufacturer, the SJ-5 system has overall consumption rates of 0.10–0.25 m³ min⁻¹ for compressed air and 0.04–0.08 kg min⁻¹ for liquid CO₂. For the FN-5-10 × 1.5 nozzle used in this study, the manufacturer reports a compressed air consumption rate of 0.20 m³ min⁻¹ at 6 bar [23].
The treated area and general mode of application were kept constant across all treatment conditions. The jet was moved continuously in a manual sweeping motion across the full exposed face of each 75 × 100 mm specimen, corresponding to a treated area of 75 cm². Each operational treatment condition was defined by the nominal pressure setting and the cumulative application time, as shown in Table 2. Application was implemented as a continuous manual sweep over the full treated area for the cumulative application time specified in Table 2, rather than as a predefined sequence of discrete passes.
Surface temperature was monitored during treatment using a thermocouple in contact with the reverse side of the specimen and positioned within the area affected by the jet. The readings therefore represent the transmitted thermal response at the monitored location on the reverse side, rather than the temperature of the CO₂ stream or of the directly exposed textile surface. The temperature values recorded during treatment are reported in Section 3.1.
The tests were carried out in a ventilated room with local extraction operating throughout the session. Ambient CO₂ was monitored using a DioxCare sensor in addition to the detector incorporated into the equipment. Gloves for thermal protection and safety glasses were worn to reduce the risks associated with cold surfaces, accidental contact with the jet, and projected particles.
2.4. Analytical Characterisation
The specimens were examined using complementary optical, morphological, physicochemical, and spectroscopic techniques. The analytical methods, equipment, and measurement scope are summarised in Table 3.
Colour differences were calculated using the CIE76 formula given in Equation (1) [24]. The M1–M0 comparison described the chromatic change associated with the application of the deposit, while M2–M0 expressed the residual difference between the treated specimen and its initial clean state. Five colour readings were distributed across the defined measurement area in each state and were summarised as a specimen-level mean for the corresponding M0–M1–M2 trajectory.
Gloss measurements were obtained at 85° for all specimens and at 60° for the starch systems, with reference to the geometries defined in UNE-EN ISO 2813:2015 [27]. As this standard was developed for non-textured coatings on plane, opaque substrates, the resulting gloss units were interpreted as comparative surface measurements within the experimental sequence, rather than as fully standardised absolute gloss values for textiles.
The water droplet response was described through the initial apparent contact angle and total absorption time. Cases in which the droplet was absorbed before a stable apparent angle could be measured were recorded as immediate absorption (<1 s), and were not assigned an angle of 0°.
ATR-FTIR spectra were acquired without baseline correction. For each textile-deposit system, one spectrum was acquired from the central part of the test area of three specimens, namely the clean reference of the corresponding textile, the untreated as-deposited reference and the selected treated specimen. Absorbance values were read at the wavenumbers associated with the selected deposit and substrate. For the red clay systems, the deposit-associated band at 794 cm⁻¹ was normalised to the substrate-associated band at 1512 cm⁻¹ for silk and 2921 cm⁻¹ for linen and cotton. For the starch systems, the deposit-associated band at 930 cm⁻¹ was normalised to the substrate-associated band at 1512 cm⁻¹ for silk and 895 cm⁻¹ for linen and cotton. For each spectrum, the deposit-associated absorbance was divided by the corresponding substrate-associated absorbance to obtain the normalised ratio R. The ratios obtained for the clean-textile reference, untreated as-deposited reference and selected treated specimen were denoted RC, RD, and RT, respectively. Consistent with the reference-state normalisation used in multimetric cleaning assessments [28], a site-specific relative band-attenuation descriptor was calculated as follows:
where RD corresponds to the normalised ratio obtained from the untreated as-deposited reference, RT is the ratio obtained from the selected treated specimen after cleaning, and RC is the ratio obtained from the clean textile reference. These ratios were obtained from different reference and treated specimens, and do not represent successive M0–M1–M2 measurements for the same specimen. A decrease from RD to RT indicates relative attenuation of the band associated with the red clay or starch at the ATR contact site.
FESEM was used to complement the interpretation of the surface response with morphological evidence at the fibre scale, obtained from selected fields across the clean-textile, deposited, and treated states.
2.5. Specimen-Level Response Analysis
Data analysis was organised across four complementary analytical levels. Colourimetric and gloss measurements were summarised as arithmetic means of five readings for each treated specimen and state, while the surface pH and wetting behaviour were summarised from four readings for each textile–deposit state. ATR-FTIR results were expressed as normalised band ratios for the clean textile reference (RC), the untreated as-deposited reference (RD), and the selected treated specimen (RT), together with ATR-FTIR-derived relative band attenuation values calculated from these three ratios. Digital microscopy represented weave-level fields, while FESEM represented selected high-resolution fields corresponding to the material states shown in the figures.
Colour responses were expressed in terms of ΔE*ab for M1–M0 and M2–M0. The first comparison characterised the chromatic response associated with the application of the deposit, while the second expressed the residual chromatic difference after treatment. Each operational treatment condition applied to an individual specimen was interpreted as a specimen-level response profile by integrating optical, surface, spectroscopic, and morphological evidence. Instrumental readings acquired at multiple points were averaged to give the specimen-level responses represented in Table 4 and Table 5. Cross-technique synthesis was used to compare the direction, magnitude, and spatial correspondence of the evidence provided by each measurement.
3. Results
The results are presented here as specimen-level response trajectories across M0, M1, and M2. Table 4 and Table 5 give the optical and surface measurements for each configuration of the red clay and starch systems, respectively. ATR-FTIR results are reported as spectral responses at the contact site and are interpreted together with the corresponding microscopy observations.
3.1. Treatment Temperature Profile
The temperature was monitored on the reverse side of the jet-affected area, in order to characterise the thermal conditions during the treatment session. A minimum value of 0.7 °C was recorded under direct impact of the jet, while temperatures on the reverse side during manual sweeping remained between 8 and 10 °C. After jet application ceased, the temperature of the monitored area returned rapidly towards the ambient temperature. The resulting record describes the thermal response transmitted through the textile at the monitored position during the treatment session.
3.2. Red Clay
The responses for the red clay systems are described based on post-treatment digital microscopy, colourimetry, gloss measurements at 85°, ATR-FTIR band ratios, surface wetting behaviour, and surface pH. Digital microscopy was used to document the residual deposit distribution and local textile morphology after CO₂ snow cleaning, while the remaining measurements characterised the M0–M1–M2 response of each textile–deposit system.
In the post-treatment digital microscopy fields, SE-BA2 and SE-BA3 showed wider interthread spacing than SE-BA1, together with differences in the visible coverage of residual deposits. The LN-BA3 field showed larger interstices and less orthogonal weave alignment than the LN-BA1 and LN-BA2 fields. The three cotton fields showed differences in residual red clay coverage, without visible thread displacement. The digital microscopy fields recorded after treatment are shown in Figure 3.
The colourimetric measurements characterised the M0–M1–M2 responses for the clay systems, with colour differences expressed as ΔE*ab, as shown in Table 4. For silk, the M1–M0 ΔE*ab values associated with application of the red clay deposit ranged from 37.55 to 39.48. After treatment with CO₂ snow, the corresponding M2–M0 ΔE*ab values were 34.00 for SE-BA1, 30.05 for SE-BA2, and 20.53 for SE-BA3. For linen, the M1–M0 and M2–M0 ΔE*ab values were 25.05 and 27.34 for LN-BA1, 24.49 and 6.65 for LN-BA2, and 26.82 and 6.83 for LN-BA3, respectively. For cotton, the M1–M0 ΔE*ab values ranged from 43.92 to 45.46, whereas the M2–M0 ΔE*ab values ranged from 16.76 to 21.77. Overall, greater recovery in L* than a* and b* was found for silk and cotton, with residual shifts towards positive a* and b* values remaining after treatment.
Gloss measurements at 85° showed a decrease in the M2 values compared with both M0 and M1 for all clay-treated specimens. For the silk specimens, the gloss decreased from M0 values of 10.42–10.90 GU to 0.26–0.54 GU at M2, whereas for linen, the values decreased from 2.72–4.80 GU to 0.58–0.90 GU, and for cotton, they decreased from 4.02–5.10 GU to 0.68–0.82 GU.
ATR-FTIR analysis provided complementary spectroscopic information on selected contact sites, and the results are presented as normalised ATR-FTIR ratios in Table 6. In the red clay systems, the normalised deposit-associated band ratios were lower in the selected treated specimens (RT) than in the corresponding untreated as-deposited references (RD). The differences were interpreted relative to the clean-textile references (RC), yielding ATR-FTIR-derived relative band attenuation values of 97% and 99% for SE-BA2 and SE-BA3, 96% and 98% for LN-BA2 and LN-BA3, and 94% and 98% for AL-BA2 and AL-BA3. The principal fibroin- and cellulose-associated bands remained identifiable in the spectra for the treated specimens at the analysed contact sites. Spectra representing the three comparative categories are shown in Figure 4.
The surface wetting behaviour of the red clay systems also differed among the substrates. On silk, the clean textile produced an initial contact angle of 78.36° and absorbed the drop within 3 s. Both the M1 and M2 specimens absorbed the drop immediately, preventing the formation of a stable contact angle. For linen, the values changed from 81.38° and 9 s at M0 to immediate absorption at M1, and 73.31° and 3 s at M2. For cotton, the values changed from 98.23° and 300 s at M0 to immediate absorption at M1, followed by 79.43° and 5 s at M2.
Finally, surface pH measurements showed limited differences between the deposited and treated states. The mean values for the surface pH for M2 were 7.66 for silk, 7.85 for linen, and 7.78 for cotton. The corresponding values for M1 were 7.79, 7.83, and 7.79. The absolute differences between M1 and M2 were therefore between 0.01 and 0.13 pH units for the red clay systems. These measurements describe the tested surface locations, and do not characterise the complete treated area.
3.3. Starch
The response of the starch systems was evaluated by integrating the colour, gloss, wettability, surface pH, ATR-FTIR, and microscopy data. In contrast to the red clay systems, the gelatinised starch films produced limited visual and chromatic contrast with the textile substrates. Interpretation of these systems therefore relied not only on colour differences but also on surface-sensitive measurements, local spectroscopic information, and morphological observations of residual film distribution.
Colour difference and gloss values for the starch systems are reported in Table 5. The starch films generated low chromatic contrast: across the nine specimens, the results for ΔE*ab ranged from 0.33 to 1.81 for M1–M0 and from 0.21 to 2.88 for M2–M0.
Post-treatment digital microscopy was used to document the distribution of residual starch film and local textile morphology. In the silk–starch systems, the digital microscopy field at ×50 for SE-AM2 showed areas with variable interthread spacing, while the ×200 field showed material remaining on the yarn surfaces. The fields for LN-AM1, LN-AM2, and LN-AM3 displayed differences in the visible distribution of the surface film. For cotton, the fields showed aligned threads, without visible displacement. Post-treatment digital microscopy fields are shown in Figure 5.
Gloss measurements provided a more sensitive assessment of the application and partial removal of starch than colour measurements. At 85°, the M2 readings for all nine starch-treated specimens fell below their respective M1 values, indicating a reduction relative to the deposited state. The relationship between M2 and M0 varied by substrate. On silk, M2 values ranged from 1.18 to 2.20 GU, well below the M0 values of 10.38–11.42 GU. At 60°, M2 values ranged from 2.9 to 3.1 GU, close to the M0 values of 3.2–3.3 GU.
For the linen specimens, there was marked increase in gloss after the application of starch. At 85°, M1 values ranged from 17.70 to 24.14 GU, compared with M0 values of 3.24–3.78 GU. After treatment, the M2 results for LN-AM1 and LN-AM2 remained above their respective M0 values, at 8.42 and 7.70 GU, while for LN-AM3, this reached 3.26 GU. At 60°, M0 values ranged from 1.4 to 1.5 GU, M1 values from 8.6 to 17.5 GU, and M2 values from 3.5 to 6.5 GU. All three M2 readings therefore remained above their respective M0 values.
For cotton, heterogeneous M0 readings were obtained at 85°, particularly for AL-AM3. However, the M2 value for each specimen was lower than both M0 and M1. At 60°, the M2 value for AL-AM1 reached 3.8 GU, compared with 3.0 GU at M0, while for AL-AM2 and AL-AM3, M2 reached 2.6 GU, slightly below the M0 value of 3.0 GU.
ATR-FTIR analysis provided local spectroscopic information on selected contact sites, with normalised ATR-FTIR ratios as shown in Table 6. For the starch systems, the normalised deposit-associated ratios were lower for the selected treated specimens (RT) than for the corresponding untreated as-deposited references (RD). These differences were interpreted relative to the clean textile references (RC), yielding ATR-FTIR-derived relative band attenuation values of 96% and 93% for SE-AM2 and SE-AM3, 80% and 73% for LN-AM1 and LN-AM3, and 54% and 99% for AL-AM1 and AL-AM3. The principal fibroin- and cellulose-associated bands remained identifiable in the spectra for treated specimens at the analysed contact sites. Spectra representing the three comparative categories are shown in Figure 6.
Differences in the surface wetting behaviour were also found among the textile–starch systems. The silk–starch wettability results changed from 78.36° and 3 s at M0 to 78.38° and 9 s at M1, followed by 77.15° and 7 s at M2. For linen, these values changed from 81.38° and 9 s at M0 to 84.55° and 20 s at M1, followed by 78.54° and 3 s at M2. For cotton, the changes were from 98.23° and 300 s at M0 to 75.51° and 90 s at M1, followed by 83.28° and 150 s at M2.
Finally, surface pH measurements showed small differences between the deposited and treated states. The mean surface pH values at M2, calculated from four readings per textile-deposit stated, were 7.74 for silk, 7.86 for linen, and 7.76 for cotton. Their corresponding M1 values were 7.56, 7.64, and 7.60. The absolute M1–M2 differences ranged from 0.16 to 0.22 pH units.
3.4. Multiscale Surface Response Evidence
Digital microscopy and FESEM provided complementary morphological documentation of surface features and weave structure at different spatial scales. The digital microscopy results showed the deposit distribution and weave-level response in the red clay and starch systems (Figure 3 and Figure 5, respectively), whereas FESEM resolved the local surface morphology within selected fields corresponding to the reference, deposited, and treated states (Figure 7 and Figure 8, respectively).
In the SE-BA3 FESEM sequence, the field for the deposited state showed mineral material covering the weave (Figure 7b). After CO2 treatment, the field showed exposed filament bundles and irregular surface morphology (Figure 7c). No transverse filament discontinuities were visible in the field for the treated specimen. In the field for LN-BA3 in the treated state, separated fibre bundles and exposed fibrillar features were visible (Figure 7f). For the AL-BA3 sequence, the field for the deposited state contained mineral aggregates on the weave (Figure 7h), whereas after treatment, the field showed removal of the mineral material without visible alteration of the underlying fibre morphology relative to the clean textile reference (Figure 7i).
In the SE-AM3 FESEM sequence, the field for the deposited state showed film-like material over the weave (Figure 8b), whereas in the treated state, discontinuous surface deposits and longitudinal striations were seen on the exposed filament surfaces (Figure 8c). These striations were not visible in the corresponding reference field (Figure 8a). In the LN-AM3 sequence, the field for the treated state showed exposed fibre bundles and fibrillar surface features (Figure 8f). However, similar fibrillar features were also visible in the linen reference field (Figure 8d), meaning that they could not be attributed exclusively to the treatment. In the AL-AM3 sequence, the field for the deposited state showed film-like coverage (Figure 8h), while in the treated state, exposed yarn bundles, fibrillated surface features, and fibre discontinuities were observed (Figure 8i).
4. Discussion
This multi-analytical comparison experiment involved two contrasting response profiles within the tested configurations. The particulate red clay deposit was expressed primarily through visible deposit displacement, chromatic recovery, and residual mineral particles. Since the starch film produced lower chromatic contrast, its response was more effectively characterised through gloss measurements, wettability assessment, microscopic examination, and normalised ATR-FTIR band ratios. Responses varied across the six textile–deposit systems, highlighting the value of interpreting each treatment configuration through its complete material response profile.
4.1. Deposit-Specific Response Profiles
The red clay and starch systems were associated with distinct descriptive surface-response profiles under their respective treatment configurations. The clay systems showed pronounced visible and chromatic changes, consistent with the particulate nature of the mineral deposit and the detachment or displacement of particles and aggregates by the incident jet. The magnitude of the response differed among substrates: for the linen specimens LN-BA2 and LN-BA3, the initial colour was approached more closely than for LN-BA1, whereas for the silk and cotton specimens, visible chromatic differences from M0 remained. In silk and cotton, the recovery of L* was greater than the return of a* and b*, indicating that the reduction in surface darkening was accompanied by residual reddish and yellowish contributions associated with the mineral deposit.
The response for the red clay broadly supported the capacity of CO₂ snow jets to remove particulate matter from fibrous surfaces, as reported by Mašková et al. [10,18]. These authors found that particles could be displaced from exposed fibres and inter-fibre spaces in papers and uncoated cellulosic textiles. The observations presented here extend this line of enquiry, as they allow for a comparison of two cellulosic textiles with proteinaceous silk, and because they include a controlled mineral deposit that produced a marked chromatic response. They do not establish performance equivalent to that reported in prior studies, since the equipment, jet configuration, contaminants, substrates, and application procedures differed.
Starch produced a distinct analytical and visual response. Its low chromatic contrast was accompanied by clearer changes in the gloss, wetting behaviour, distribution of the residual film, local surface morphology and ATR-FTIR band ratios at the contact site. On linen, matte areas and gloss responses at 85° showed concordant surface changes, whereas ATR-FTIR characterised the relative attenuation of the selected starch-associated band at the analysed contact sites. Similarly, for the cotton systems, small colour variations were combined with differentiated surface and spectral responses at the contact site. This cross-technique pattern is consistent with the film-forming behaviour of starch and with differences in its distribution and interaction with the yarn surface across analytical scales.
The film-forming behaviour of starch observed here is consistent with the observation that surface-sensitive techniques provided greater differentiation than macroscopic colour change. The gloss and wetting behaviour reflected the interaction between the film and the textile surface, digital microscopy revealed its distribution across the weave, and the normalised ATR-FTIR ratios indicated changes in the selected starch-associated band at the analysed contact sites. The concordance among these complementary indicators supports the multi-analytical interpretation of the starch response, and is consistent with the approaches used in prior studies of enzymatic starch removal [6,7].
The starch formulations constituted distinct material systems, with values of 5% w/v for silk and cotton and 10% w/v for linen. Interpretation was therefore performed within each predefined textile–starch system, while the cross-system synthesis compared analytical response patterns.
4.2. Analytical Concordance Across Spatial Scales
At the macroscopic scale, visual observation and colourimetry showed concordant changes in the red clay systems. Areas with reduced visible clay coverage corresponded with chromatic alteration towards M0. In the starch systems, the smaller chromatic changes contrasted with a more differentiated surface response, consistent with the lower colour contrast and film-forming behaviour of this deposit. Recent work on soot-soiled silk has similarly shown that colourimetric estimates do not always correspond to the residual soiling visible in micrographs [29]. Colour measurements were therefore interpreted here as indicators of appearance change, rather than as direct measurements of the amount of deposit removed.
The gloss and wettability results characterised complementary aspects of the surface response. Gloss reflected the combined influence of fibre orientation, weave geometry, surface roughness, and deposit distribution [30], whereas wetting behaviour reflected the interaction of the treated surface with liquid water. The correspondence of these measurements with the digital microscopy observations supported the interpretation of changes in film continuity, surface exposure, and weave-level deposit distribution. The differences between these variables represented the distinct surface properties addressed by each measurement.
The normalised ATR-FTIR ratios provided spectroscopic evidence for the contact sites. At each contact site, the normalised deposit-associated ratio was lower for the selected treated specimens (RT) than for the corresponding untreated as-deposited references (RD). These differences were interpreted relative to the clean textile references (RC), using the ATR-FTIR-derived relative band attenuation calculation. The principal fibroin- and cellulose-associated bands remained identifiable in the spectra for the treated specimens. Agreement with the optical and microscopic observations was interpreted as convergence between complementary measurements rather than as evidence of deposit removal across the complete treated area.
Digital microscopy and FESEM were used to investigate the surface response at complementary spatial scales. Digital microscopy yielded information on the deposit distribution, weave spacing, interthread areas, and material remaining on yarn surfaces, which helped in relating these features to macroscopic and optical changes. FESEM was applied to resolve the local surface morphology at higher magnification, and provided morphological evidence on the selected fields, such as residual particles, film-like coverage, exposed filament bundles, fibrillar features, striations, and local fibre discontinuities. Concordant observations across both microscopy scales strengthened the material response profiles, whereas differences reflected the spatial scale and surface component represented by each technique.
Measurements of surface pH and temperature provided complementary context for the treatment response. The limited changes in surface pH were considered alongside the optical, spectroscopic, and morphological responses. The temperature records obtained on the reverse side of the specimen indicated transient cooling through the textile thickness during the direct impact from the jet and manual sweeping. Together, these measurements helped in relating the observed material response to the treatment application conditions.
The scale-dependent interpretation is consistent with previous studies of particulate removal from paper and uncoated cellulose textiles using automated CO₂ snow systems [10,18], and with research on soot removal from textiles through solid CO₂ blasting [17]. Together, these findings support the interpretation of CO₂-based cleaning responses at the level of the textile–deposit–treatment configuration rather than at the level of any single component.
4.3. Contribution to the Assessment of Textile Cleaning
The principal contribution of the study is the map of material responses generated across a particulate deposit and a film-forming deposit on three natural-fibre textiles. In the red clay systems, the concordance among the visual observation, colourimetry, digital microscopy, and ATR-FTIR results supported the interpretation of particulate displacement and the characterisation of residual mineral features. In the starch systems, gloss, wettability, digital microscopy, and ATR-FTIR at the contact site showed concordant changes associated with the film response, while colourimetry represented the smaller macroscopic chromatic variation. Divergences among techniques were analytically meaningful, because each method characterised a different material component or spatial scale of the textile–deposit system.
This multi-analytical approach provides a framework for selecting complementary indicators in laboratory evaluations of textile cleaning. It also enables deposit reduction to be distinguished from the optical and morphological response of the textile, thereby avoiding interpretation based on a single measurement.
4.4. Transferability of the Analytical Framework
The experimental design was structured as a comparative, specimen-level assessment of operationally defined CO₂ snow treatment conditions across six model textile–deposit systems. Repeated instrumental readings were taken to characterise the response of each specimen, while ATR-FTIR and FESEM provided targeted contact-site and field-specific evidence that was integrated with the broader analytical dataset. This multi-scale architecture enables complementary observations to be interpreted according to the material component and spatial scale represented by each technique.
The same architecture provides a structured basis for extending the analysis to defined nozzle trajectories, additional textile systems, mechanical characterisation, post-treatment ageing, and comparison with established cleaning procedures. In recent research into automated CO₂ snow cleaning of precision metallic surfaces, the pressure, traverse speed, and dwell time have been treated as explicitly programmed operational variables [31]. Future work should also incorporate reproducible protocols for deposit application and quantified deposit loads, consistent with recent approaches to the preparation of soiled heritage mock-ups for comparative cleaning studies [31]. These studies support the methodological feasibility of the proposed extensions, although the results obtained from different deposits and substrates cannot be transferred directly to fibrous heritage materials. Aged, dyed, finished, previously treated, and structurally modified textiles can be incorporated as differentiated material systems within the same specimen-level framework.
5. Conclusions
For the configurations tested here, the model systems with red clay and starch showed distinct material response profiles between silk, cotton, and linen. The clay systems were mainly characterised based on visible and chromatic changes, although residual colour shifts and mineral features remained in several specimens after treatment. In contrast, starch systems showed limited chromatic contrast, and required surface-sensitive, spectroscopic, and morphological indicators for effective characterisation, including gloss, wetting behaviour, distribution of the residual film, local surface morphology, and normalised ATR-FTIR band ratios. By integrating these complementary measurements, the response of each textile–deposit–treatment configuration could be characterised across multiple spatial and analytical scales.
Post-treatment gloss at 85° fell below the initial value for 16 of the 18 treated specimens. The two exceptions, LN-AM1 and LN-AM2, had M2 readings above their respective M0 values, and corresponded to the linen–starch configurations, with the response at 60° varying among the three textile–starch systems. ATR-FTIR responses, broader optical measurements, and microscopy at the contact site provided complementary assessments at different spatial scales. These complementary assessments reflect the different material properties and spatial scales represented by each technique, and support the need to avoid interpreting cleaning response from a single indicator.
The principal contribution of this study is the development of an analytical framework in which the optical trajectories M0–M1–M2 at the specimen level are integrated with surface descriptors, spectral comparisons at the contact site, and morphological evidence from the selected fields. The results show that particulate and film-forming deposits require different analytical combinations, and that the cleaning response should be characterised through complementary measurements rather than through deposit reduction alone. The configurations and response indicators reported here provide a structured basis for extending the analysis to additional textile systems, quantified deposit loads, controlled application procedures, mechanical characterisation, ageing, and comparative cleaning studies.
Author Contributions
Conceptualization, M.P.W.-C. and V.S-C.; methodology, M.P.W.-C., V.S-C. and L.O.-C.; formal analysis, L.O.-C., M.-P.W.-C. and V.S.-C.; investigation, M.-P.W.-C., V.S-C., L.O.-C., and S.V.-P; resources, M.-P.W.-C., V.S-C., L.O.-C., and S.V.-P; writing—original draft preparation, M.P.W.-C. and V.S-C.; writing—review and editing, M.P.W.-C., V.S-C., L.O.-C., and S.V.-P; supervision, V.S.-C. and L.O.-C.; project administration, V.S-C.; funding acquisition, V.S-C. All authors have read and agreed to the published version of the manuscript.
Funding
This research was funded by MICIU/AEI/10.13039/501100011033 and by ERDF/EU, grant number PID2023-148231OB-I00. The APC was funded by the Universitat Politècnica de València.
Institutional Review Board Statement
Not applicable.
Informed Consent Statement
Not applicable.
Data Availability Statement
The raw data supporting the conclusions of this article will be made available by the authors upon request.
Conflicts of Interest
The authors declare no conflicts of interest.
References
- Tímár-Balázsy, Á. Wet Cleaning of Historical Textiles: Surfactants and Other Wash Bath Additives. Stud. Conserv. 2000, 45, 46–64. [Google Scholar] [CrossRef]
- Guglielmi, V.; Comite, V.; Lombardi, C.A.; Bergomi, A.; Boanini, E.; Bonomi, R.; Monfasani, E.; Sassi, L.; Borelli, M.; Fermo, P. Restoration of a Textile Artefact: A Comparison of Cleaning Procedures Applied to a Historical Tapestry from the Quirinale Palace (Rome). Appl. Sci. 2023, 13, 2669. [Google Scholar] [CrossRef]
- Alván, M.J.; Candiotti, S.; Flores, E.; Charca, S. Impact of Washing and Aging Process on the Physical and Mechanical Properties of Pre-Hispanic Fabrics Found in the Museum of Site and Archeological Sanctuary of Pachacamac, Perú. J. Cult. Herit. 2024, 67, 360–367. [Google Scholar] [CrossRef]
- Brockmann, N.; Sicken, A.; Krüger, J. Effects of Laser Cleaning on the Condition of Different Silk Model Samples Using Varying Wavelengths and Pulse Durations. Herit. Sci. 2024, 12, 34. [Google Scholar] [CrossRef]
- Uring, P.; Chabas, A.; Alfaro, S. Dust Deposition on Textile and Its Evolution in Indoor Cultural Heritage. Eur. Phys. J. Plus 2019, 134, 255. [Google Scholar] [CrossRef]
- Ahmed, H.E.; Kolisis, F.N. An Investigation into the Removal of Starch Paste Adhesives from Historical Textiles by Using the Enzyme α-Amylase. J. Cult. Herit. 2011, 12, 169–179. [Google Scholar] [CrossRef]
- Tortora, M.; Gherardi, F.; Ferrari, E.; Colston, B. Biocleaning of Starch Glues from Textiles by Means of α-Amylase-Based Treatments. Appl. Microbiol. Biotechnol. 2020, 104, 5361–5370. [Google Scholar] [CrossRef] [PubMed]
- Šahinbaşkan, B.Y.; Kahraman, M.V. Desizing of Untreated Cotton Fabric with the Conventional and Ultrasonic Bath Procedures by Immobilized and Native α-Amylase. Starch/Staerke 2011, 63, 154–159. [Google Scholar] [CrossRef]
- Al-Emam, E.; Cremonesi, M.; Ortega Saez, N.; Soenen, H.; Janssens, K.; Van der Snickt, G. Exploring the Potential of Polyvinyl Alcohol–Borax-Based Gels for the Conservation of Historical Silk Fabrics by Comparative Cleaning Tests on Simplified Model Systems. Gels 2026, 12, 97. [Google Scholar] [CrossRef] [PubMed]
- Mašková, L.; Smolík, J.; Vávrová, P.; Neoralová, J.; Součková, M.; Novotná, D.; Jandová, V.; Ondráček, J.; Ondráčková, L.; Křížová, T.; et al. Carbon Dioxide Snow Cleaning of Paper. Herit. Sci. 2021, 9, 145. [Google Scholar] [CrossRef]
- Ferrari, M.; Mazzoli, R.; Morales, S.; Fedi, M.; Liccioli, L.; Piccirillo, A.; Cavaleri, T.; Oliva, C.; Gallo, P.; Borla, M.; et al. Enzymatic Laundry for Old Clothes: Immobilized Alpha-Amylase from Bacillus sp. for the Biocleaning of an Ancient Coptic Tunic. Appl. Microbiol. Biotechnol. 2017, 101, 7041–7052. [Google Scholar] [CrossRef] [PubMed]
- Sherman, R. Carbon Dioxide Snow Cleaning Applications. In Developments in Surface Contamination and Cleaning: Applications of Cleaning Techniques Volume 11; Kohli, R., Mittal, K.L., Eds.; Elsevier: Amsterdam, The Netherlands, 2019; Vol. 11, pp. 97–115. [Google Scholar] [CrossRef]
- Shockey, L.H., Jr. Blow It off: Moving beyond Compressed Air with Carbon Dioxide Snow. AIC Objects Spec. Group Postprints 2009, 320, 13–14. [Google Scholar]
- Vega-Bosch, A.; Santamarina-Campos, V.; Osete-Cortina, L.; Sánchez-Pons, M.; Bosch-Roig, P. Efficient and Sustainable Cleaning: A Comparative Analysis of Cryogenic Technology. Appl. Sci. 2024, 14, 6591. [Google Scholar] [CrossRef]
- Spur, G.; Uhlmann, E.; Elbing, F. Dry-Ice Blasting for Cleaning: Process, Optimization and Application. Wear 1999, 233–235, 402–411. [Google Scholar] [CrossRef]
- Stoveland, L.P.; Frøysaker, T.; Stols-Witlox, M.; Grøntoft, T.; Steindal, C.C.; Madden, O.; Ormsby, B. Evaluation of Novel Cleaning Systems on Mock-Ups of Unvarnished Oil Paint and Chalk-Glue Ground within the Munch Aula Paintings Project. Herit. Sci. 2021, 9, 144. [Google Scholar] [CrossRef]
- Grønlund, M. An Evaluation of Solid Carbon Dioxide (CO2) Blasting as a Cleaning Method to Remove Soot from Textiles after Smouldering Fire and Fire, with the Possibility to Transfer the Method to Historical Textiles within a Museum Context. CeROArt 2014, 2–5. [Google Scholar] [CrossRef]
- Mašková, L.; Smolík, J.; Vávrová, P.; Neoralová, J.; Novotná, D.; Jandová, V.; Ondráček, J.; Kocová, K.; Marešová, A.; Zedníková, M.; et al. CO2 Snow Microblasting of Submicron Particles from Cellulose-Based Cultural Heritage Objects: Comparison with Traditional Dry Cleaning Methods. J. Cult. Herit. 2024, 70, 1–11. [Google Scholar] [CrossRef]
- Vega-Bosch, A.; Osete-Cortina, L.; Santamarina-Campos, V.; Dolz-Ruiz, V. Effectiveness and Environmental Performance of Cryogenic CO₂ Cleaning for Graffiti Removal from Contemporary Outdoor Metallic Sculptures. J. Cult. Herit. 2026, 80, 291–301. [Google Scholar] [CrossRef]
- Chillè, C.; Rossignoli, G.; Nagasawa, T.; Osticioli, I.; Agresti, J.; Siano, S.; Ciofini, D. Laser Cleaning of Artificially Soiled Cotton Fabric: Assessment of Surface Chemical Effects. J. Cult. Herit. 2023, 64, 1–11. [Google Scholar] [CrossRef]
- Havlová, M.; Kocová, K.; Neoralová, J.; Novotná, D.; Vávrová, P.; Mašková, L. PVC Cleaning via Different Methods: Comparison of Laser and CO2 Snow. In Lasers in the Conservation of Artworks XIII: Proceedings of the International Conference on Lasers in the Conservation of Artworks XII (LACONA XIII), Florence, Italy; Siano, S., Ciofini, D., Eds.; CRC Press: London, UK, 12–16 September 2022; pp. 183–187. [Google Scholar] [CrossRef]
- CryoSnow GmbH. CO2 Snow Blasting Machine SJ-5. Available online: https://www.cryosnow.com/en/products/manual-blasting-machines/co2-snow-blasting-machine-sj-5/ (accessed on 29 July 2026).
- CryoSnow GmbH. Nozzles for Blasting Pistol JP-5: Flat Nozzle FN-5-10x1_5. Available online: https://www.cryosnow.com/en/accessories/nozzles/nozzles-for-blasting-pistol-jp-5/ (accessed on 29 July 2026).
- Conservation of Cultural Property. UNE-EN 15886:2011; Test Methods. Colour Measurement of Surfaces. AENOR: Madrid, 2011.
- Rota, E.; Bozzi, C.; Cremonesi, P.; Lucchini, A. Study of the Best Methodology for Measuring Surface pH of Linen Canvas. Stud.Conserv 2021, 66, 313–320. [Google Scholar] [CrossRef]
- Conservation of Cultural Property. UNE-EN 15802:2010; Test Methods. Determination of Static Contact Angle. AENOR: Madrid, 2010.
- UNE-EN ISO 2813 ISO 2813:2014; Paints and Varnishes. Determination of Gloss Value at 20o, 60o and 85o. AENOR: Madrid, 2015.
- Cutajar, J.D.; Steindal, C.C.; Caruso, F.; Joseph, E.; Frøysaker, T. Spectral- and Image-Based Metrics for Evaluating Cleaning Tests on Unvarnished Painted Surfaces. Coatings 2024, 14, 1040. [Google Scholar] [CrossRef]
- Cremonesi, M.; Pastorelli, G.; Yang, N.; Al-Emam, E.; Martinelli, E.; Comelli, D.; Dal Fovo, A.; Fontana, R.; Cicchi, R.; Ortega Saez, N.; et al. Evaluating Cleaning Efficacy by Image-Based Machine Learning: Case Study of Soot Removal from Silk. npj Herit. Sci. 2026, 14, 393. [Google Scholar] [CrossRef]
- Akgun, M.; Becerir, B.; Alpay, H.R. The Effect of Fabric Constructional Parameters on Percentage Reflectance and Surface Roughness of Polyester Fabrics. Text. Res. J. 2012, 82, 700–707. [Google Scholar] [CrossRef]
- Yang, N.; Cremonesi, M.; Markevicius, T.; Del Favo, A.; Shumikhin, K.; Ducoli, E.; Rocha Pires, C.; Fontana, R.; Van Der Voort, P.; Leus, K.; et al. The Reproduction of Fire-Born Soot for Comparative Cleaning Tests on Heritage Objects. npj Herit. Sci. 2025, 13, 593. [Google Scholar] [CrossRef] [PubMed]
Figure 1.
Design of the comparative material response experiment, specimen coding, material states, and analytical levels. In this experimental matrix, silk (SE), cotton (AL), and linen (LN) textiles were combined with either red clay (BA) or starch (AM). M0 denotes the clean textile before application of the deposit, M1 the same specimen after application and drying, and M2 the specimen after CO₂ snow treatment. Results were interpreted based on the specimen trajectory, textile-deposit system, local ATR-FTIR measurement area, and selected microscopy fields.
Figure 1.
Design of the comparative material response experiment, specimen coding, material states, and analytical levels. In this experimental matrix, silk (SE), cotton (AL), and linen (LN) textiles were combined with either red clay (BA) or starch (AM). M0 denotes the clean textile before application of the deposit, M1 the same specimen after application and drying, and M2 the specimen after CO₂ snow treatment. Results were interpreted based on the specimen trajectory, textile-deposit system, local ATR-FTIR measurement area, and selected microscopy fields.
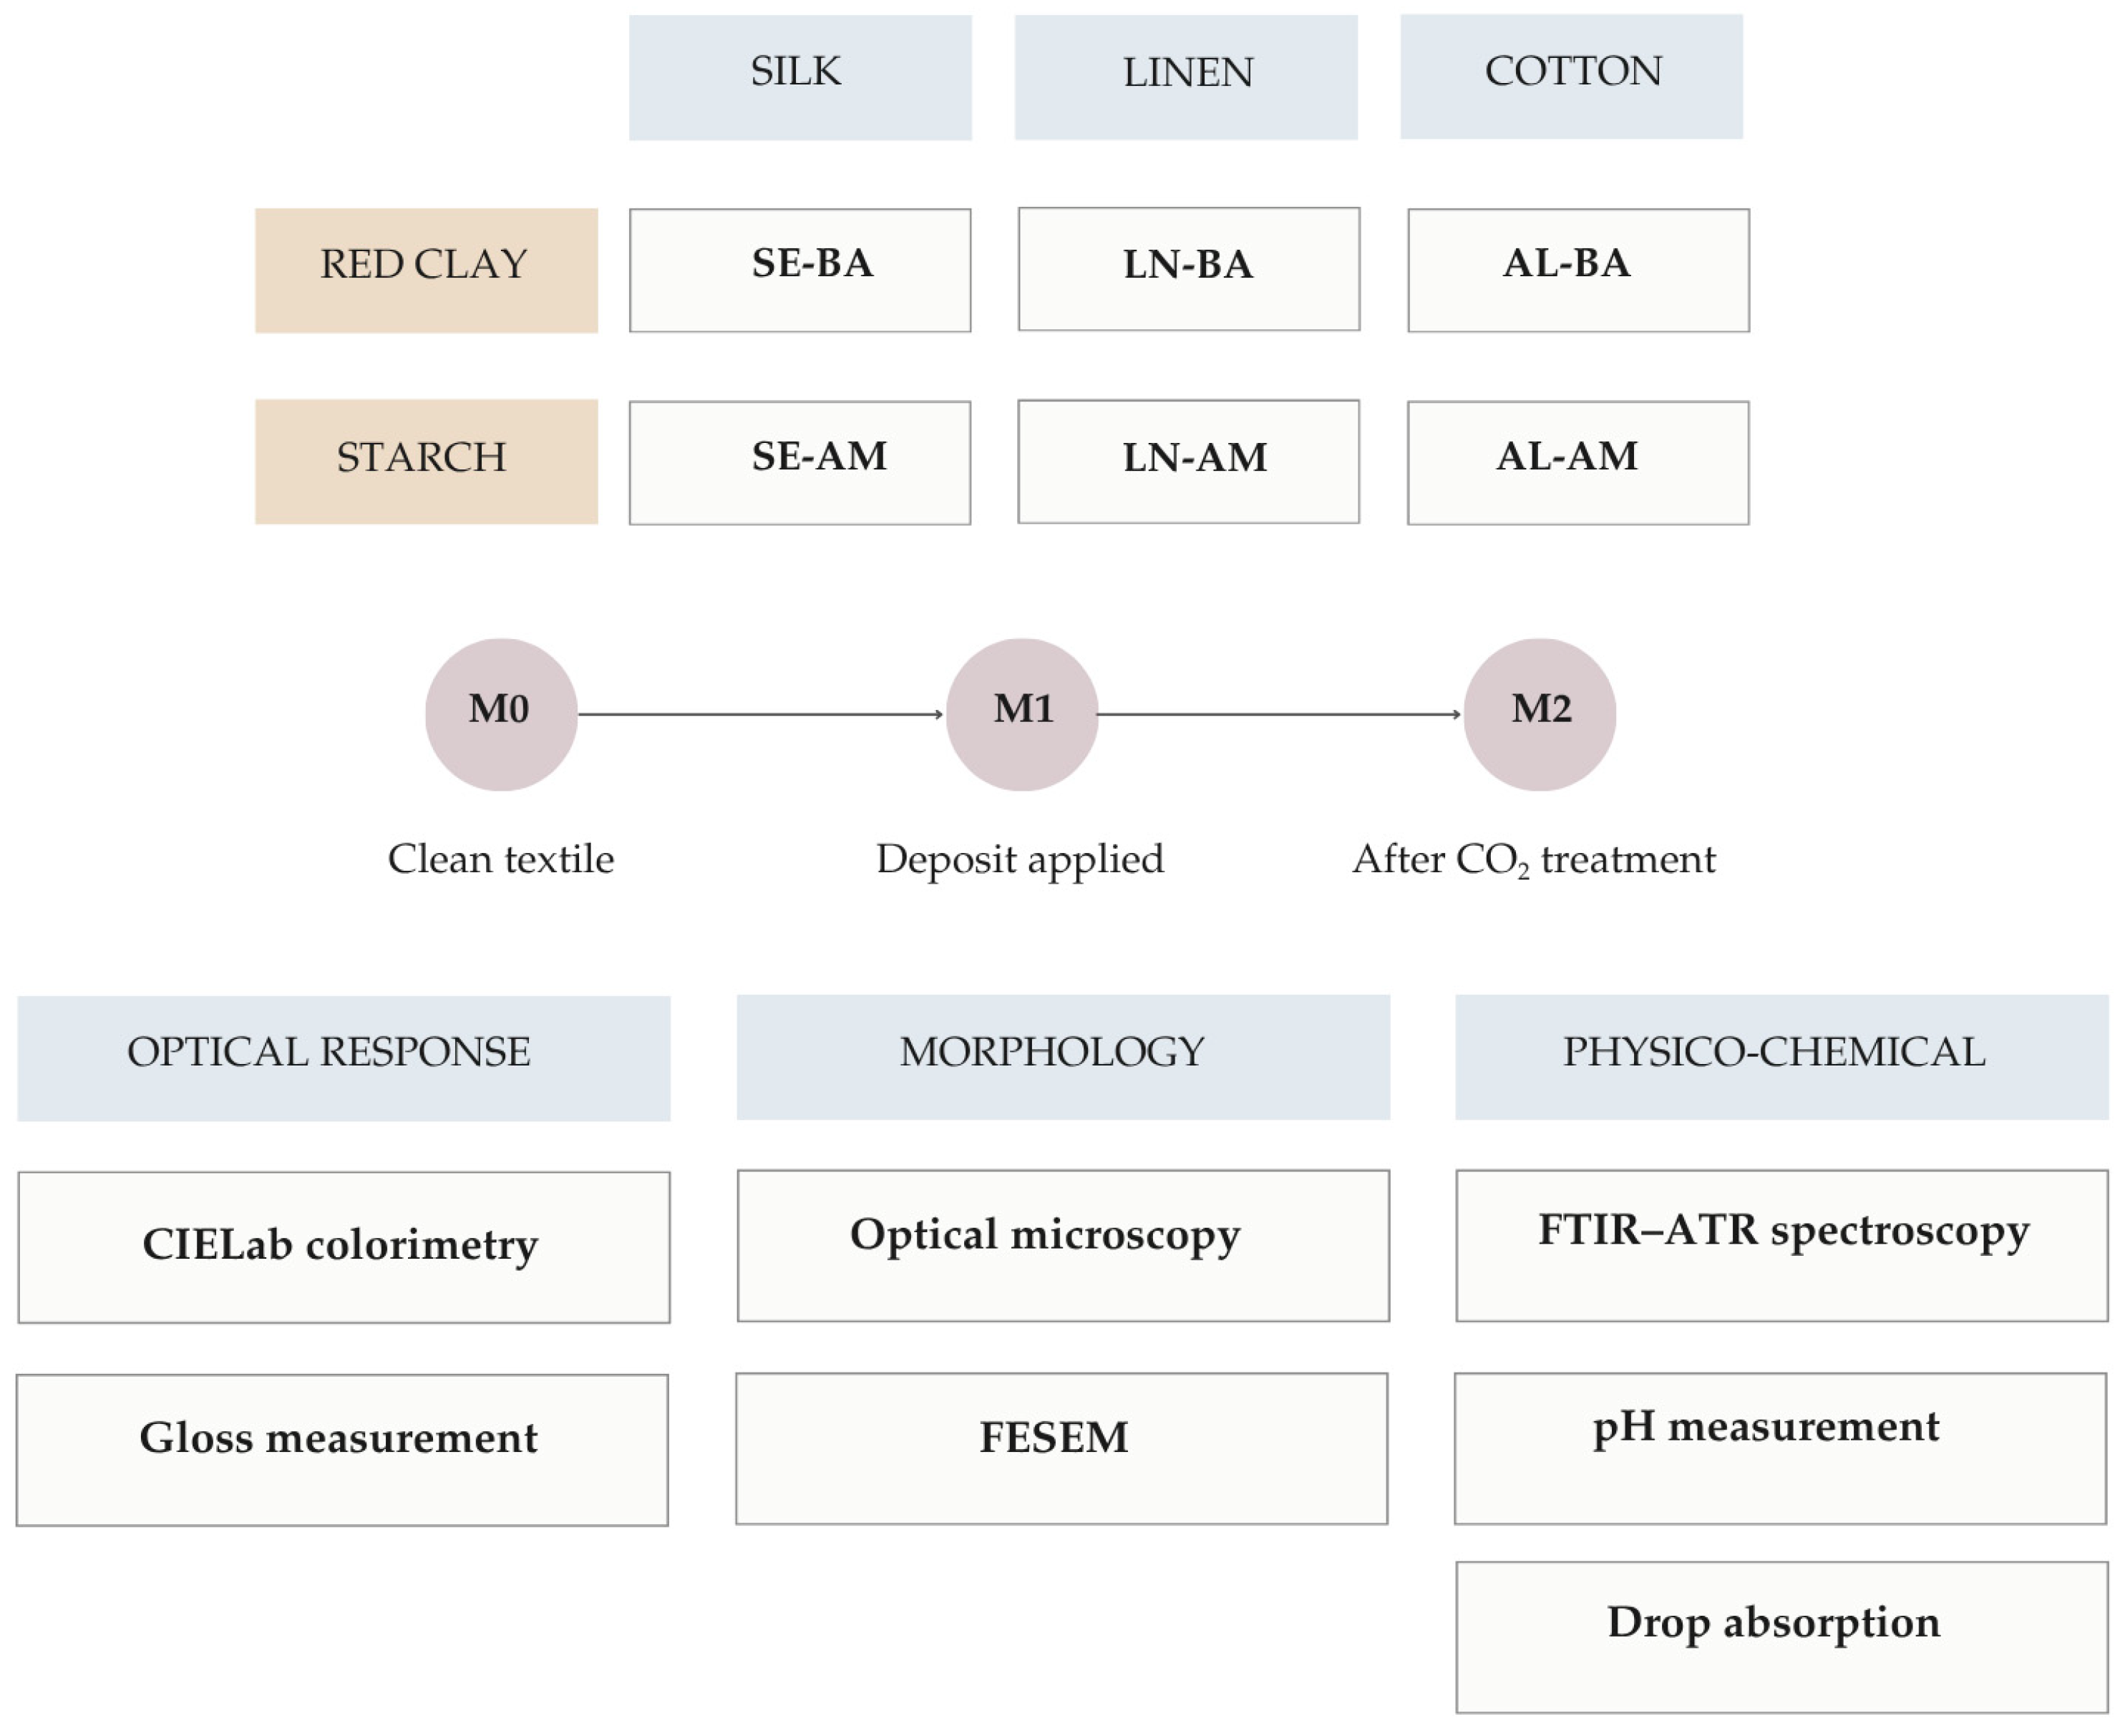
Figure 2.
CryoSnow SJ-5 system, flat nozzle, and geometry used to apply CO₂ snow. (a) CryoSnow SJ-5 equipment; (b) manual sweeping over the 75 × 100 mm specimen at an angle of incidence of 45° and a working distance of 20–30 mm; (c) FN-5-10 × 1.5 flat nozzle with a rectangular outlet measuring 10 × 1.5 mm [22,23].
Figure 2.
CryoSnow SJ-5 system, flat nozzle, and geometry used to apply CO₂ snow. (a) CryoSnow SJ-5 equipment; (b) manual sweeping over the 75 × 100 mm specimen at an angle of incidence of 45° and a working distance of 20–30 mm; (c) FN-5-10 × 1.5 flat nozzle with a rectangular outlet measuring 10 × 1.5 mm [22,23].
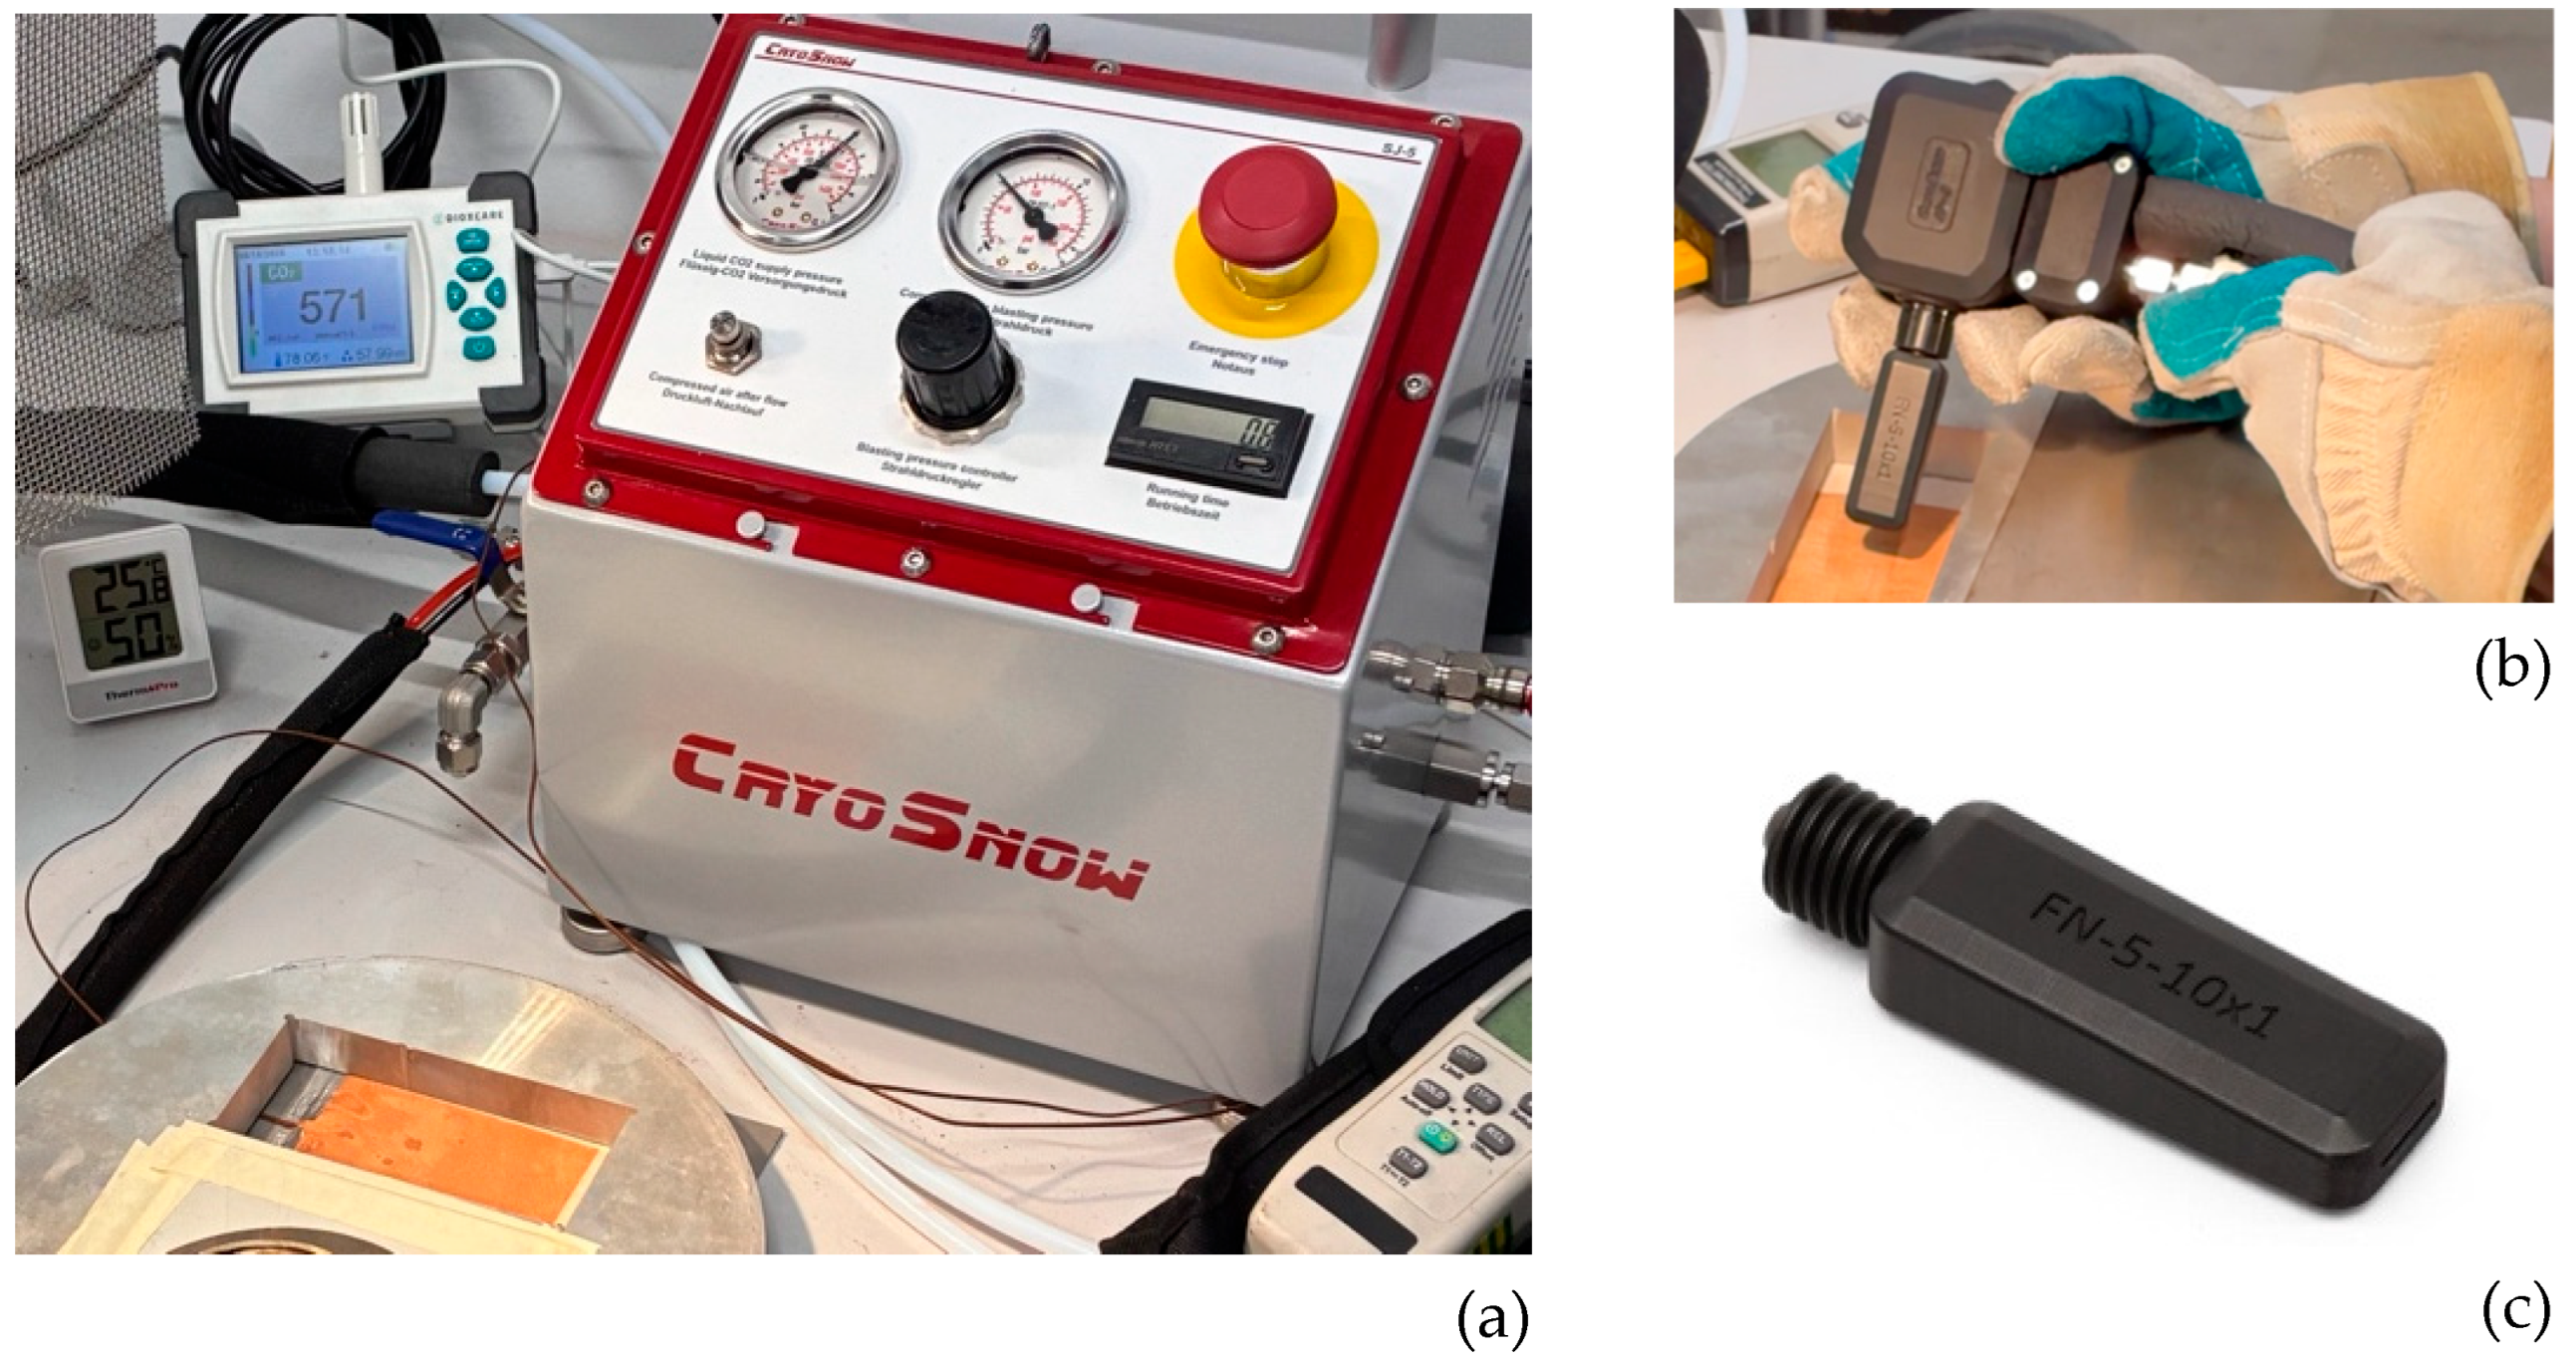
Figure 3.
Post-treatment (M2) digital microscopy fields for the red clay textile systems across the tested CO₂ snow configurations: (a–c) silk, SE-BA1, SE-BA2, and SE-BA3; (d–f) linen, LN-BA1, LN-BA2, and LN-BA3; (g–i) cotton, AL-BA1, AL-BA2, and AL-BA3. The corresponding treatment conditions are listed in Table 2.
Figure 3.
Post-treatment (M2) digital microscopy fields for the red clay textile systems across the tested CO₂ snow configurations: (a–c) silk, SE-BA1, SE-BA2, and SE-BA3; (d–f) linen, LN-BA1, LN-BA2, and LN-BA3; (g–i) cotton, AL-BA1, AL-BA2, and AL-BA3. The corresponding treatment conditions are listed in Table 2.
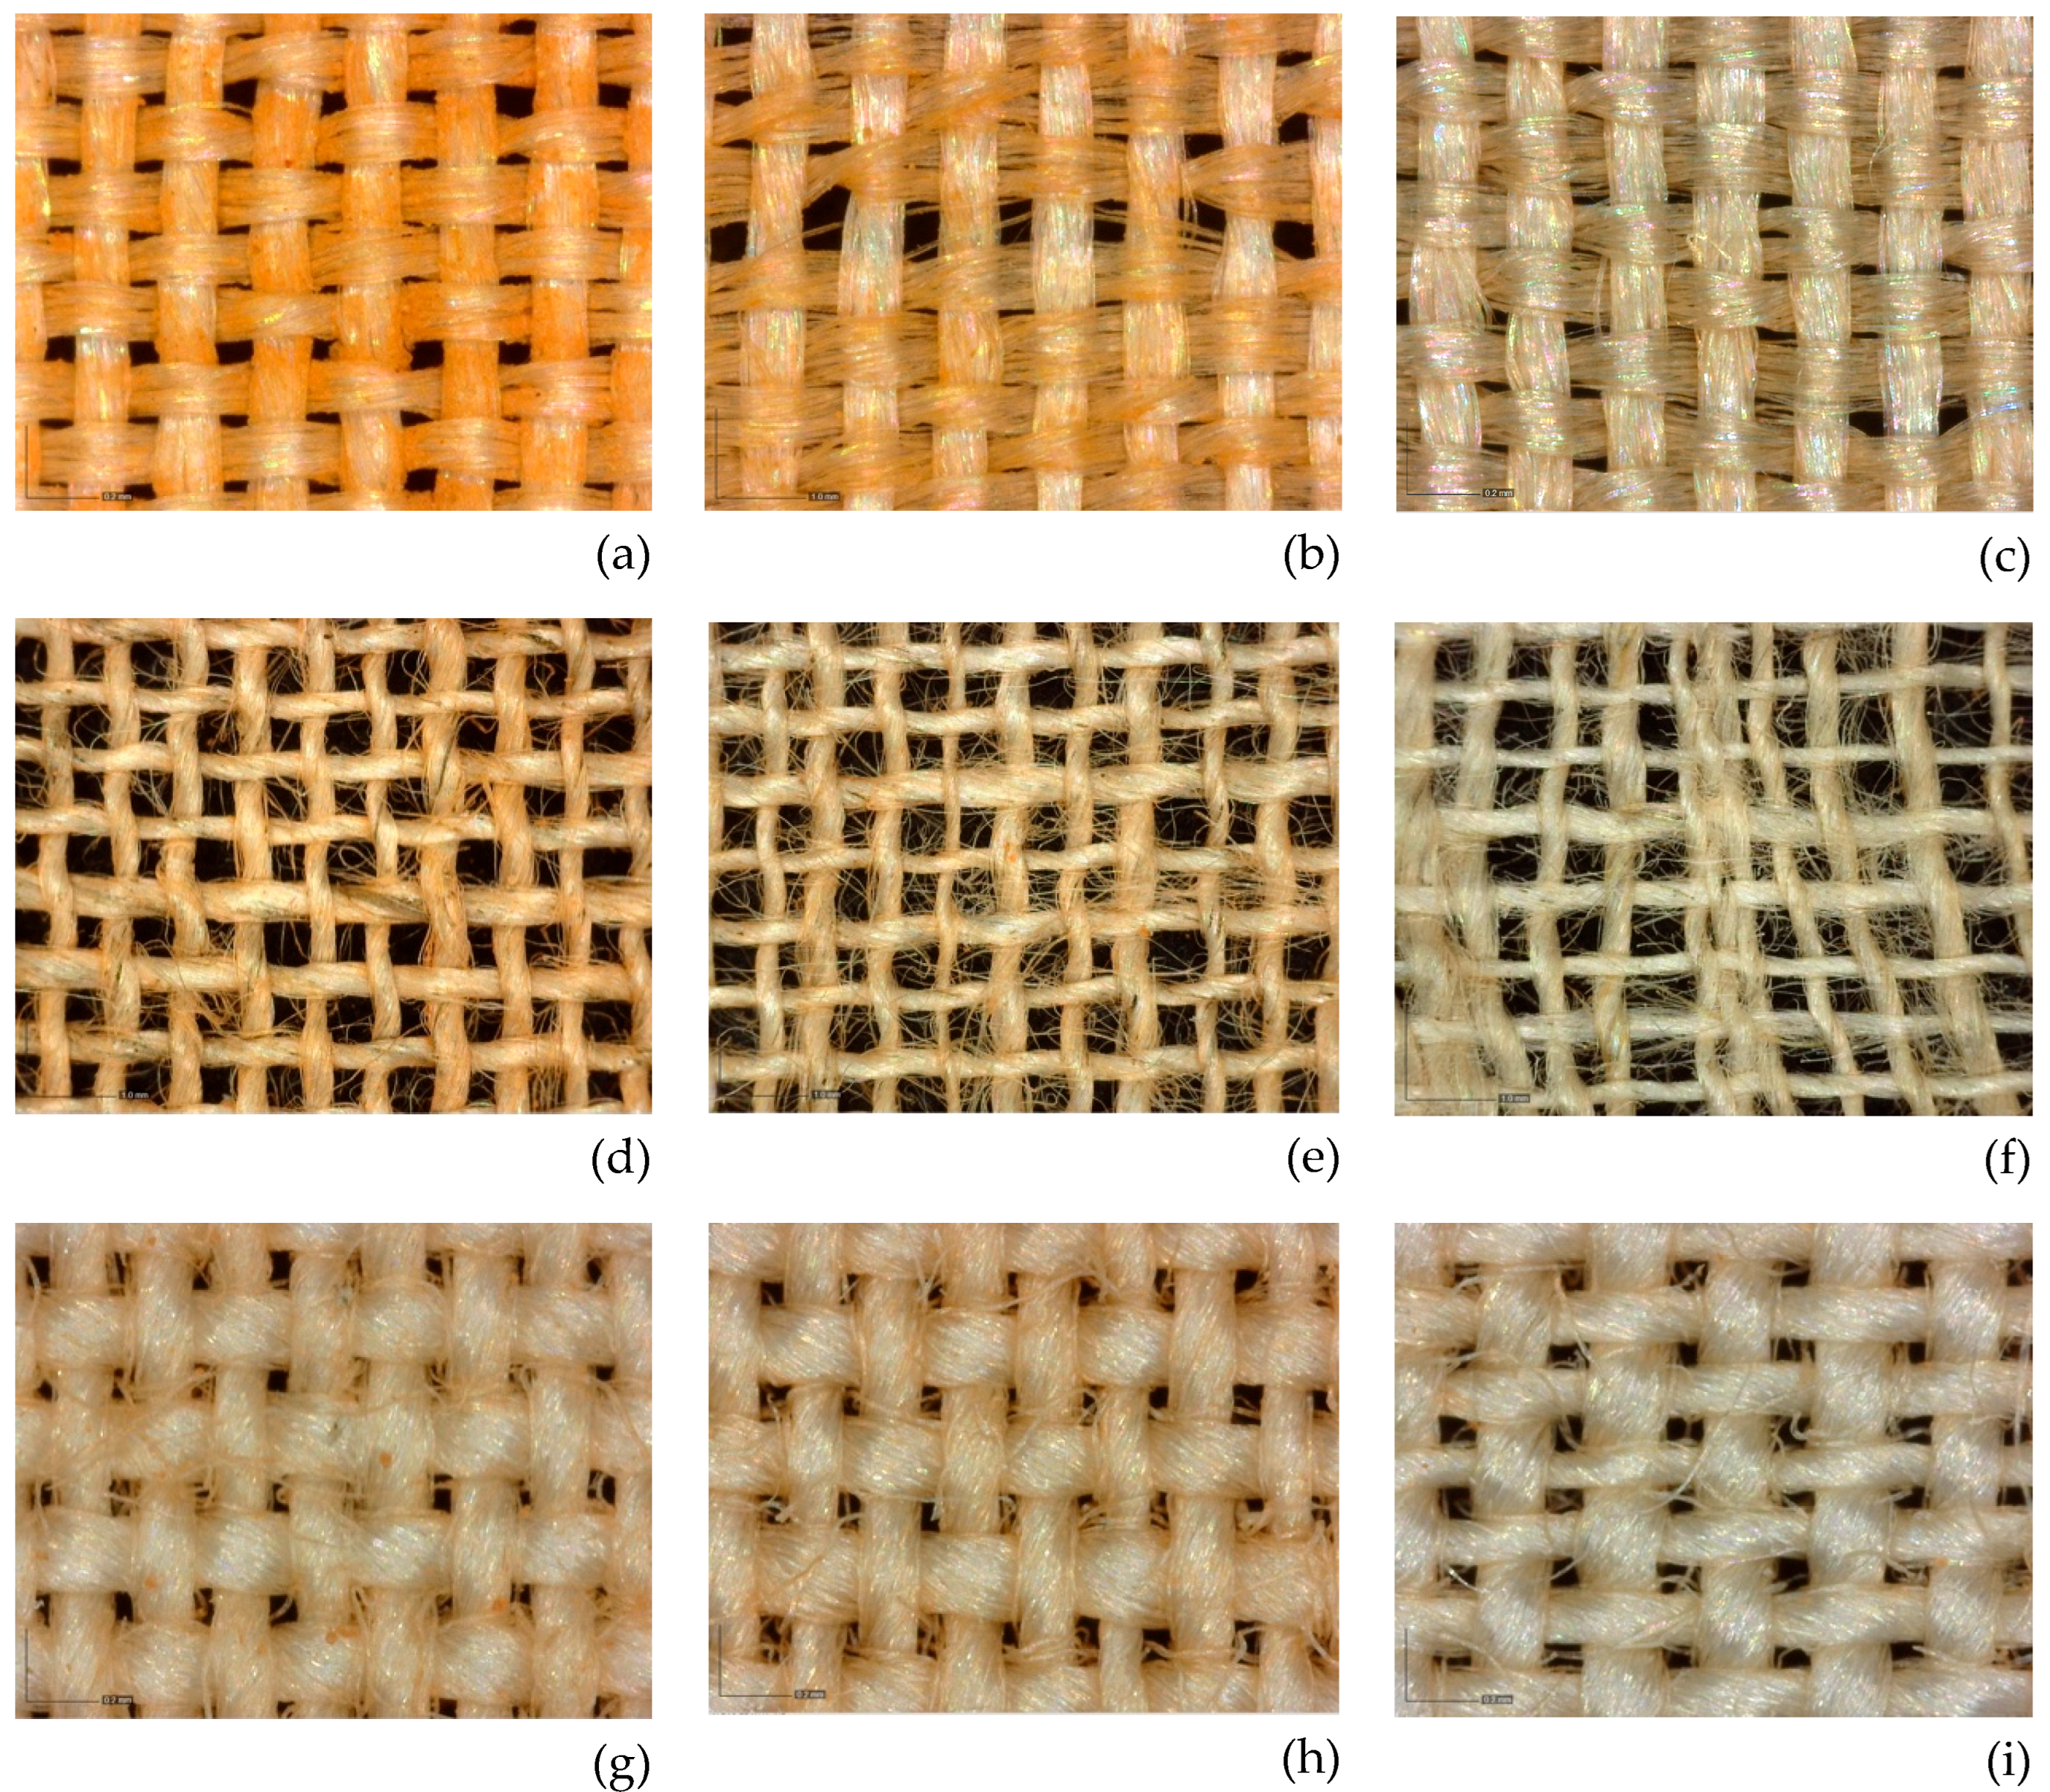
Figure 4.
ATR-FTIR spectra recorded at selected contact sites for the red clay–textile systems. Panels show (a) silk, (b) linen, and (c) cotton. The spectra correspond to the clean textile reference, untreated as-deposited reference, and treated specimens (identified by code in the curve labels). The band associated with red clay (near 794 cm⁻¹) and the normalisation bands (near 1512 cm⁻¹ for silk and 2921 cm⁻¹ for linen and cotton) are indicated.
Figure 4.
ATR-FTIR spectra recorded at selected contact sites for the red clay–textile systems. Panels show (a) silk, (b) linen, and (c) cotton. The spectra correspond to the clean textile reference, untreated as-deposited reference, and treated specimens (identified by code in the curve labels). The band associated with red clay (near 794 cm⁻¹) and the normalisation bands (near 1512 cm⁻¹ for silk and 2921 cm⁻¹ for linen and cotton) are indicated.

Figure 5.
Post-treatment (M2) digital microscopy fields of the starch textile systems across the tested CO₂ snow configurations. (a–c) silk, SE-AM1, SE-AM2, and SE-AM3; (d–f) linen, LN-AM1, LN-AM2, and LN-AM3; (g–i) cotton, AL-AM1, AL-AM2, and AL-AM3. The corresponding treatment conditions are reported in Table 2.
Figure 5.
Post-treatment (M2) digital microscopy fields of the starch textile systems across the tested CO₂ snow configurations. (a–c) silk, SE-AM1, SE-AM2, and SE-AM3; (d–f) linen, LN-AM1, LN-AM2, and LN-AM3; (g–i) cotton, AL-AM1, AL-AM2, and AL-AM3. The corresponding treatment conditions are reported in Table 2.
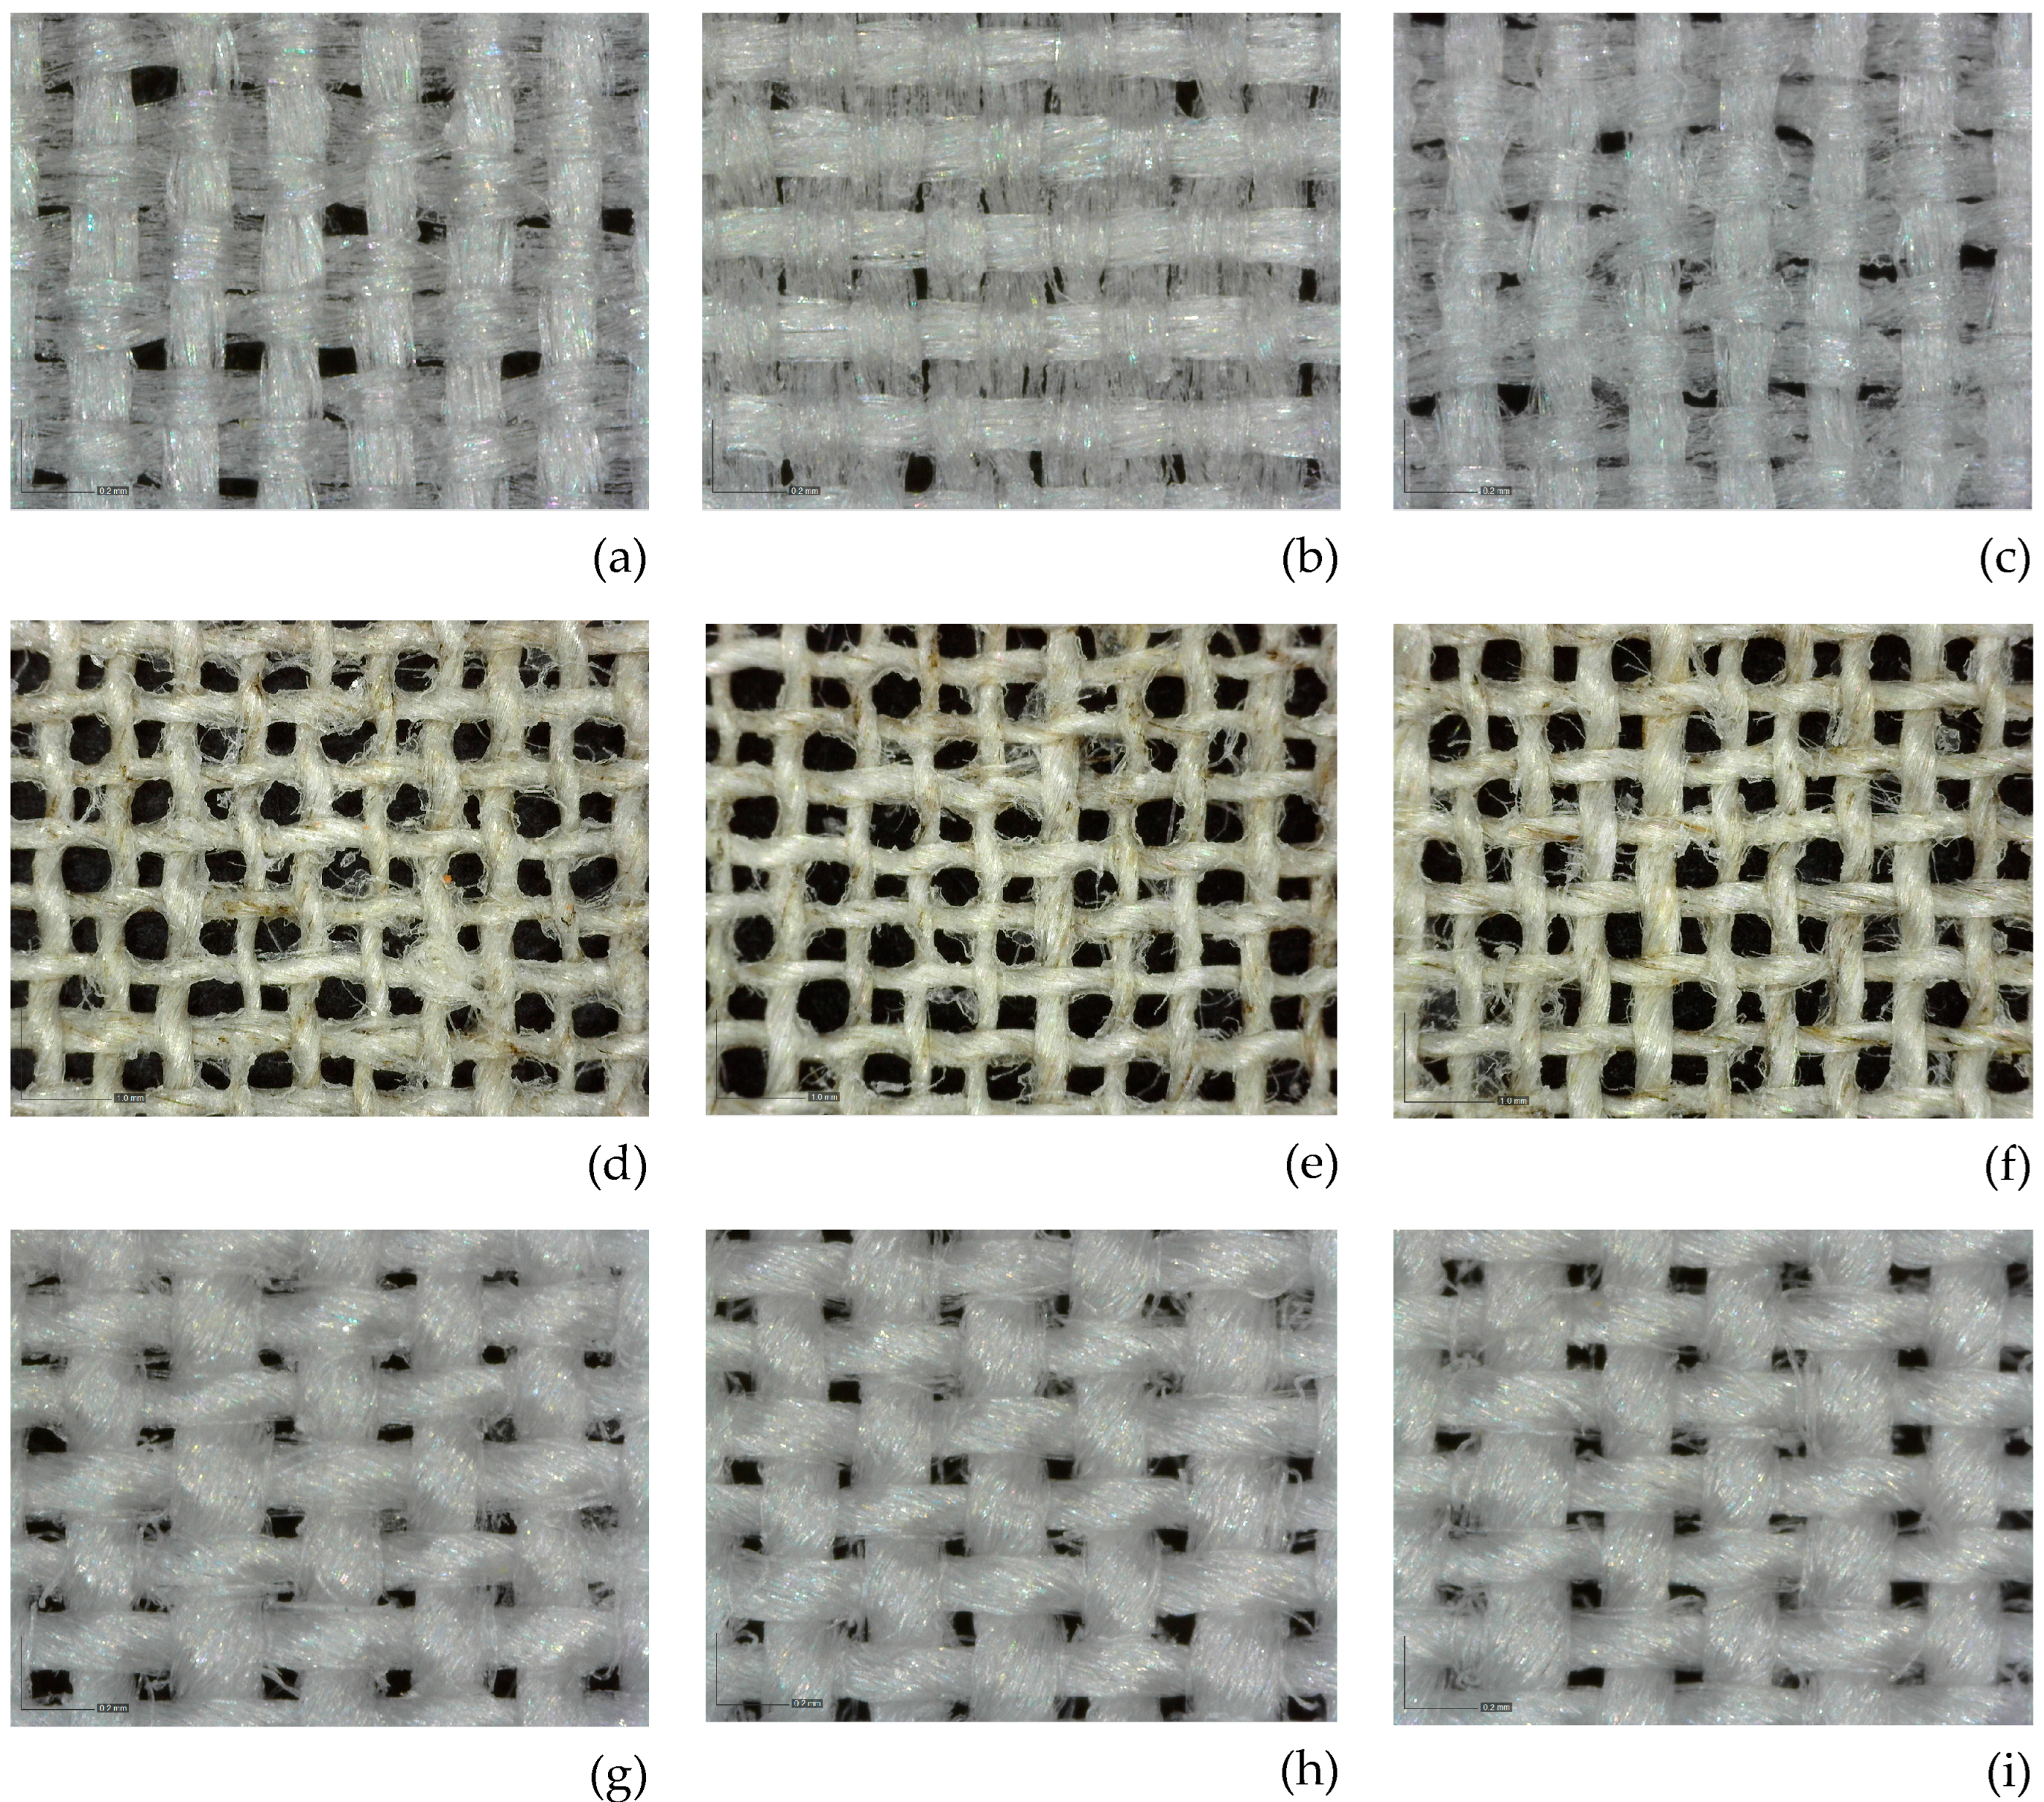
Figure 6.
ATR-FTIR spectra recorded at selected contact sites of the starch textile systems. Panels show results for (a) silk, (b) linen, and (c) cotton. The spectra correspond to the clean textile reference, untreated as-deposited reference, and treated specimens (identified by code in the curve labels). The starch-associated band (near 930 cm⁻¹) and the substrate normalisation bands (at 1512 cm⁻¹ for silk and 895 cm⁻¹ for linen and cotton) are indicated.
Figure 6.
ATR-FTIR spectra recorded at selected contact sites of the starch textile systems. Panels show results for (a) silk, (b) linen, and (c) cotton. The spectra correspond to the clean textile reference, untreated as-deposited reference, and treated specimens (identified by code in the curve labels). The starch-associated band (near 930 cm⁻¹) and the substrate normalisation bands (at 1512 cm⁻¹ for silk and 895 cm⁻¹ for linen and cotton) are indicated.

Figure 7.
Comparison of FESEM results for selected fields of the red clay textile systems across M0, M1, and M2. (a–c) silk, SE-BA3; (d–f) linen, LN-BA3; (g–i) cotton, AL-BA3. Within each row, M0 denotes the clean state, M1 the state after application and drying of red-clay, and M2 the state after CO₂ snow treatment. Uncoated specimens were examined at 1.00 kV using the SE2 detector, with working distances ranging from 3.1 to 3.5 mm according to the image.
Figure 7.
Comparison of FESEM results for selected fields of the red clay textile systems across M0, M1, and M2. (a–c) silk, SE-BA3; (d–f) linen, LN-BA3; (g–i) cotton, AL-BA3. Within each row, M0 denotes the clean state, M1 the state after application and drying of red-clay, and M2 the state after CO₂ snow treatment. Uncoated specimens were examined at 1.00 kV using the SE2 detector, with working distances ranging from 3.1 to 3.5 mm according to the image.
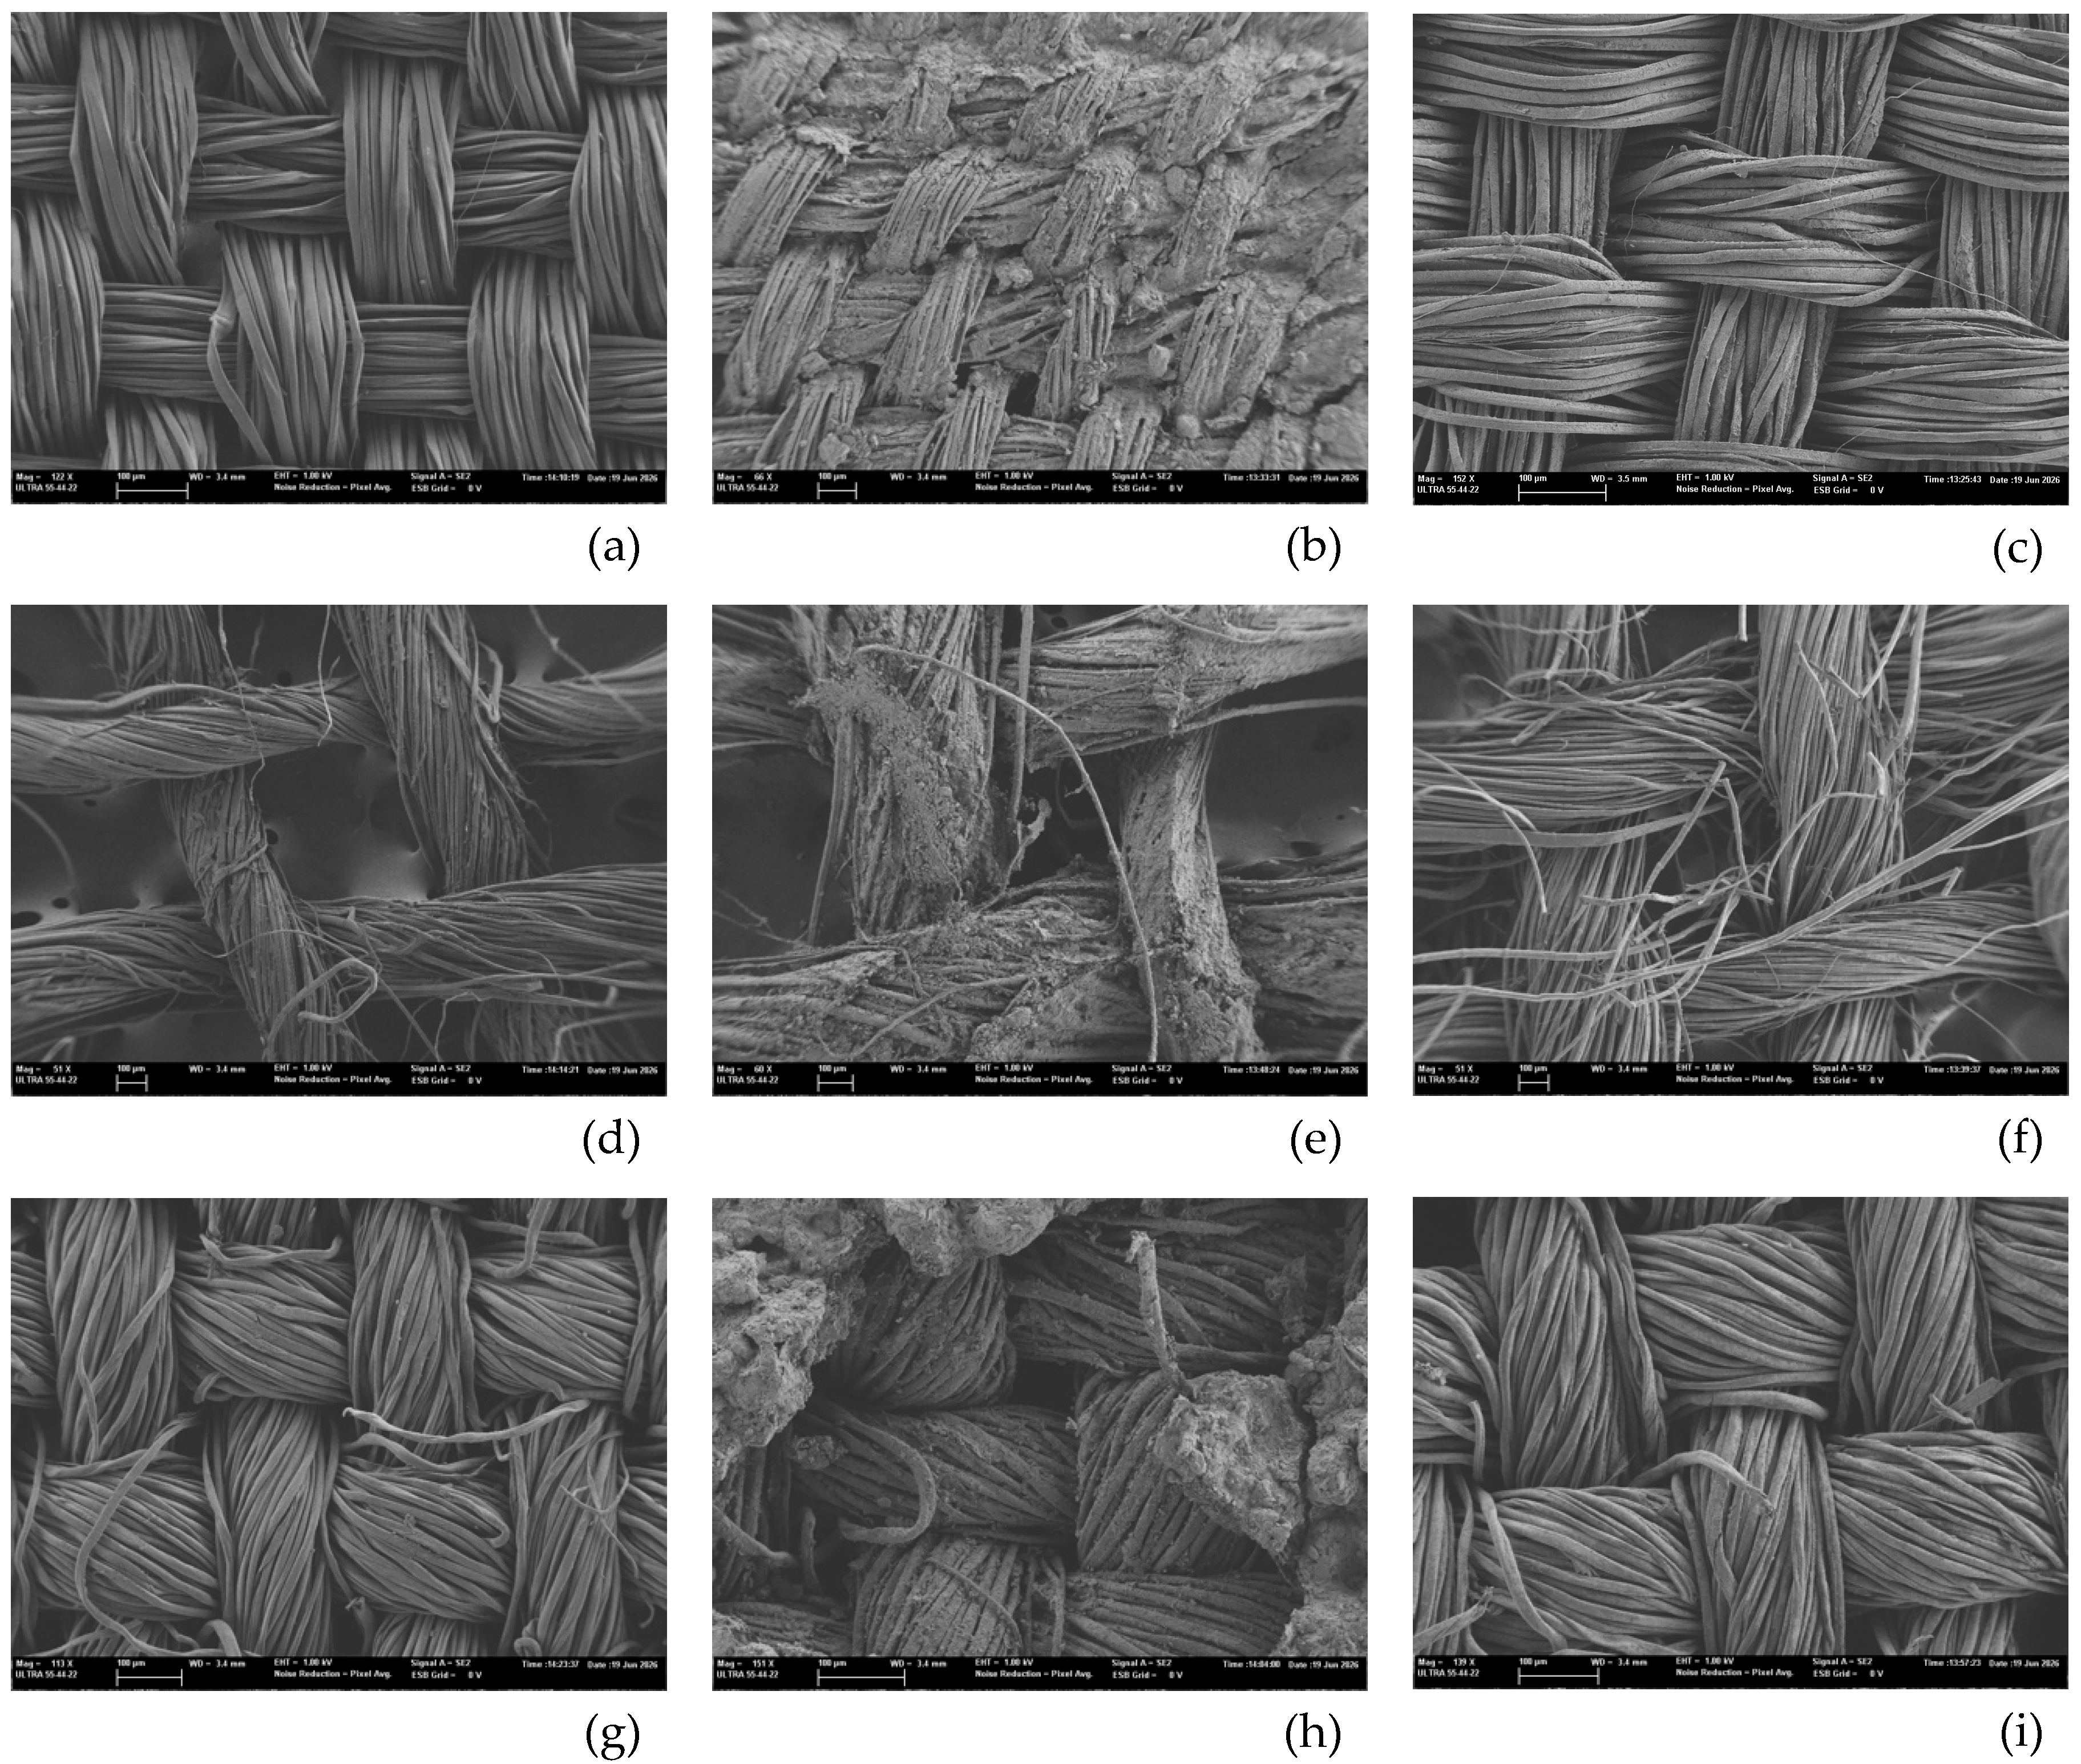
Figure 8.
FESEM results for selected fields of the starch textile systems, across M0, M1, and M2: (a–c) silk, SE-AM3; (d–f) linen, LN-AM3; (g–i) cotton, AL-AM3. Within each row, M0 denotes the clean state, M1 the state after application of starch and drying, and M2 the state after CO₂ snow treatment. Uncoated specimens were examined at 1.00 kV using the SE2 detector, with working distances ranging from 3.1 to 3.5 mm depending on the image. Panels (a), (d), and (g) reproduce the clean textile reference fields shown in Figure 7a, d, and g, respectively, since the same reference was used for each textile.
Figure 8.
FESEM results for selected fields of the starch textile systems, across M0, M1, and M2: (a–c) silk, SE-AM3; (d–f) linen, LN-AM3; (g–i) cotton, AL-AM3. Within each row, M0 denotes the clean state, M1 the state after application of starch and drying, and M2 the state after CO₂ snow treatment. Uncoated specimens were examined at 1.00 kV using the SE2 detector, with working distances ranging from 3.1 to 3.5 mm depending on the image. Panels (a), (d), and (g) reproduce the clean textile reference fields shown in Figure 7a, d, and g, respectively, since the same reference was used for each textile.
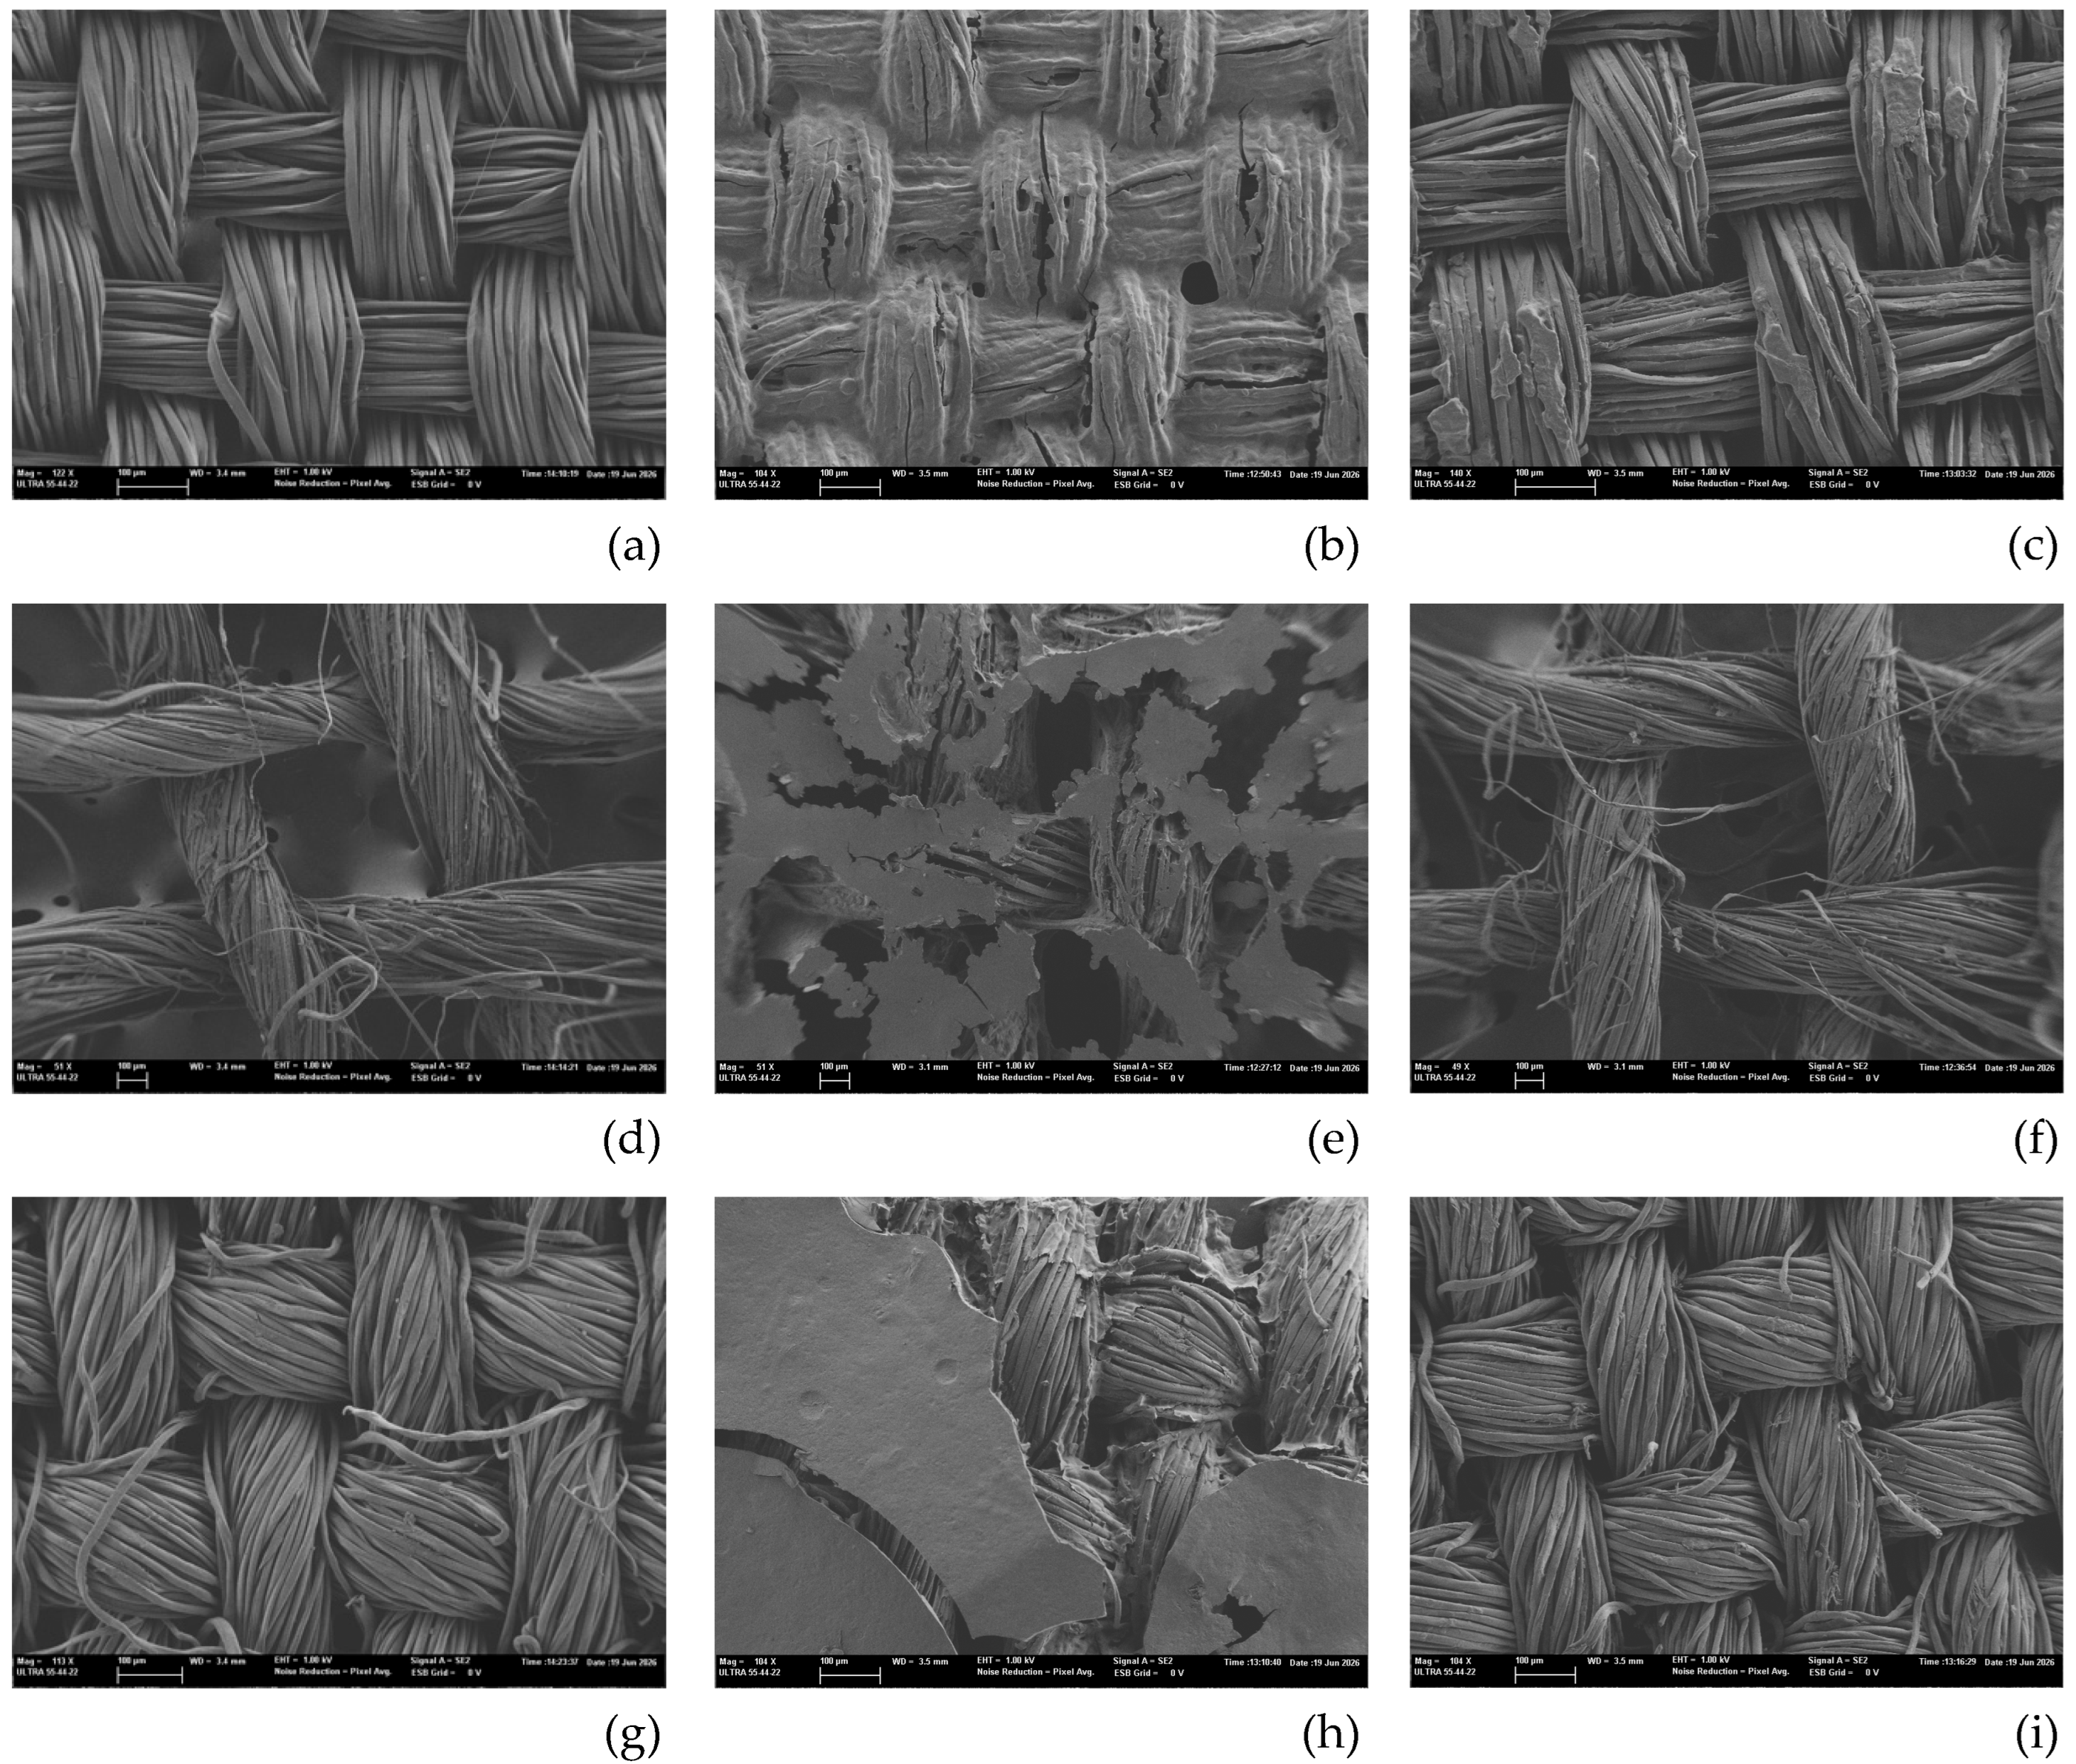

Table 1.
Characteristics of the textile substrates.
| Property | Silk Habotai 10 | Batista cotton | Linen CTS 2139 |
| Supplier | Sodintex® natural fibres | Productos de Conservación, S.A. | C.T.S. España S.L. |
| Commercial reference | Seda Habotai 10 | Batista de algodón 100%. Ref 00293 | TELA ART. CTS 2139 – 100% LINO |
| Composition | 100% silk | 100% cotton | 100% linen |
| Mass per unit area, (g/m²) | 45 | 127 | 115 |
| Weave | Plain weave | Plain weave | Plain weave |
| Thread density, warp × weft, (threads/cm) | 40 × 50 | 30 × 45 | 13 × 13 |
| Twist direction | n.a | Z | Z |
| Twist angle | n.a | 55° | 75° |
Note: n.a.: not applicable. The silk yarns were untwisted, and no twist angle or direction was therefore assigned.
Table 2.
CO₂ snow treatment conditions.
| Deposit | Textile | Specimen | Nominal pressure setting (bar) | Cumulative application time (min) |
| Red clay | Silk | SE-BA1 | 1.5 | 1 |
| Red clay | Silk | SE-BA2 | 2.5 | 1 |
| Red clay | Silk | SE-BA3 | 5 | 1 |
| Red clay | Cotton | AL-BA1 | 2 | 1 |
| Red clay | Cotton | AL-BA2 | 3 | 1 |
| Red clay | Cotton | AL-BA3 | 5 | 1 |
| Red clay | Linen | LN-BA1 | 2 | 1 |
| Red clay | Linen | LN-BA2 | 4 | 1 |
| Red clay | Linen | LN-BA3 | 5 | 1 |
| Starch | Silk | SE-AM1 | 6 | 2 |
| Starch | Silk | SE-AM2 | 5 | 2 |
| Starch | Silk | SE-AM3 | 3 | 3 |
| Starch | Cotton | AL-AM1 | 5 | 2 |
| Starch | Cotton | AL-AM2 | 6 | 2 |
| Starch | Cotton | AL-AM3 | 6 | 3 |
| Starch | Linen | LN-AM1 | 6 | 2 |
| Starch | Linen | LN-AM2 | 6 | 3 |
| Starch | Linen | LN-AM3 | 6 | 4 |
Note: Pressure values correspond to the nominal equipment settings used during treatment, and do not represent pressure measurements at the textile surface. Application time denotes the cumulative treatment time over the defined test area. The manual sweeping procedure is described in Section 2.3.
Table 3.
Analytical techniques used to characterise the specimens.
| Analytical technique/ test | Equipment | Analytical level | Procedure and analytical output |
| Digital microscopy | Dino-Lite Digital Microscope Premier | Selected microscopy field | Examination of textile morphology, weave, thread density, twist, deposit distribution, and local surface-response features in selected fields at M0, M1, and M2 |
| CIELAB Colourimetry | CHN Spec CS-10 | Specimen trajectory | Measurements in the CIE L*a*b* (CIELAB) colour space, with five readings per specimen at each state, following the principles of UNE-EN 15886:2011 [24] |
| Specular gloss measurement | Konica Minolta Multi Gloss 268A | Specimen trajectory | Measurements at 85° for all specimens and at 60° for the starch systems, consisting of five readings per specimen in each state, with the 85° geometry prioritised due to the low-gloss nature of the textile surfaces |
| Surface pH measurement | HORIBA LAQUAtwin-pH-22 | Textile–deposit system | Surface pH measured indirectly using a fragment of agarose gel placed in contact with the textile for 3 min [25]; four readings obtained for each reported textile–deposit state |
| Water drop wetting test | Labbox EASY 40 Elite micropipette for droplet dispensing | Textile–deposit system | Comparative assessment using 10 µL droplets of distilled water; initial apparent contact angle and total absorption time recorded to assess the wetting behaviour of each textile–deposit system across a series of four readings for each reported textile–deposit state, using a procedure informed by UNE-EN 15802:2010 [26] |
| Attenuated total reflectance Fourier-transform infrared spectroscopy (ATR-FTIR) | Bruker ALPHA II Compact FT-IR spectrometer with monolithic diamond ATR crystal | ATR contact site | Spectra recorded in absorbance mode over 4000–500 cm⁻¹ at 4 cm⁻¹ resolution, with 24 scans per spectrum; comparison at the contact site based on normalised ratios between the intensity of the deposit-associated band and that of the substrate-associated band across clean, deposited, and treated states |
| Field-emission scanning electron microscopy (FESEM) | Zeiss Ultra 55 with SE2 detector | Selected microscopy field | Uncoated specimens examined at an accelerating voltage of 1.00 kV and working distances ranging from 3.1 to 3.5 mm, depending on the image; comparative morphological documentation of selected reference, deposited, and treated fields at magnifications appropriate to the textile structure and the surface response features |
Note: Analytical level represents the scale at which the results from each technique were interpreted.
Table 4.
Specimen-level mean values for colour difference and gloss responses of the red clay specimens. Gloss values were measured at 85°. All red-clay specimens underwent CO₂ snow cleaning for 1 min.
Table 4.
Specimen-level mean values for colour difference and gloss responses of the red clay specimens. Gloss values were measured at 85°. All red-clay specimens underwent CO₂ snow cleaning for 1 min.
| Specimen | Nominal pressure setting (bar) |
ΔE*ab M1–M0 |
ΔE*ab M2–M0 |
Gloss at 85°, GU | ||
| M0 | M1 | M2 | ||||
| SE-BA1 | 1.5 | 37.55 | 34.00 | 10.90 | 3.54 | 0.54 |
| SE-BA2 | 2.5 | 39.48 | 30.05 | 10.42 | 2.44 | 0.54 |
| SE-BA3 | 5 | 37.55 | 20.53 | 10.58 | 2.62 | 0.26 |
| LN-BA1 | 2 | 25.05 | 27.34 | 2.80 | 3.02 | 0.90 |
| LN-BA2 | 4 | 24.49 | 6.65 | 4.80 | 2.24 | 0.70 |
| LN-BA3 | 5 | 26.82 | 6.83 | 2.72 | 2.76 | 0.58 |
| AL-BA1 | 2 | 43.92 | 20.49 | 4.02 | 2.94 | 0.68 |
| AL-BA2 | 3 | 45.46 | 21.77 | 4.28 | 3.18 | 0.80 |
| AL-BA3 | 5 | 44.39 | 16.76 | 5.10 | 3.68 | 0.82 |
Table 5.
Specimen-level mean values for the colour difference and gloss responses of the starch specimens at 85° and 60°.
Table 5.
Specimen-level mean values for the colour difference and gloss responses of the starch specimens at 85° and 60°.
| Specimen | Nominal pressure setting and application time | ΔE*ab M1–M0 | ΔE*ab M2–M0 | Gloss at 85°, (GU), M0 | Gloss at 85°, (GU), M1 | Gloss at 85°, (GU), M2 | Gloss at 60°, (GU), M0 | Gloss at 60°, (GU), M1 | Gloss at 60°, (GU), M2 |
| SE-AM1 | 6 bar, 2 min | 1.49 | 1.52 | 11.12 | 13.04 | 2.20 | 3.2 | 5.7 | 3.1 |
| SE-AM2 | 5 bar, 2 min | 0.98 | 1.70 | 10.38 | 12.54 | 1.18 | 3.2 | 5.0 | 2.9 |
| SE-AM3 | 3 bar, 3 min | 1.61 | 2.22 | 11.42 | 9.94 | 1.68 | 3.3 | 3.5 | 2.9 |
| LN-AM1 | 6 bar, 2 min | 1.81 | 1.81 | 3.24 | 24.14 | 8.42 | 1.4 | 17.5 | 6.4 |
| LN-AM2 | 6 bar, 3 min | 1.41 | 1.97 | 3.42 | 21.98 | 7.70 | 1.4 | 15.3 | 6.5 |
| LN-AM3 | 6 bar, 4 min | 1.37 | 2.88 | 3.78 | 17.70 | 3.26 | 1.5 | 8.6 | 3.5 |
| AL-AM1 | 5 bar, 2 min | 0.76 | 2.26 | 11.50 | 11.62 | 2.98 | 3.0 | 4.6 | 3.8 |
| AL-AM2 | 6 bar, 2 min | 0.69 | 0.21 | 10.96 | 9.88 | 0.98 | 3.0 | 4.2 | 2.6 |
| AL-AM3 | 6 bar, 3 min | 0.33 | 1.37 | 3.92 | 10.44 | 0.60 | 3.0 | 4.2 | 2.6 |
Table 6.
Normalised ATR-FTIR absorbance ratios and ATR-FTIR-derived relative band attenuation for selected treated specimens.
Table 6.
Normalised ATR-FTIR absorbance ratios and ATR-FTIR-derived relative band attenuation for selected treated specimens.
| Specimen | Deposit band(cm⁻¹) | Normalisation band(cm⁻¹) | RC | RD | RT |
ATR-FTIR-derived relative band attenuation (%) [(RD − RT)/(RD − RC)] × 100 |
| SE-BA2 | 794 | 1512 | 0.274 | 5.118 | 0.429 | 96.8 |
| SE-BA3 | 794 | 1512 | 0.274 | 5.118 | 0.347 | 98.5 |
| LN-BA2 | 794 | 2921 | 1.222 | 14.955 | 1.720 | 96.4 |
| LN-BA3 | 794 | 2921 | 1.222 | 14.955 | 1.563 | 97.5 |
| AL-BA2 | 794 | 2921 | 1.143 | 11.880 | 1.791 | 94.0 |
| AL-BA3 | 794 | 2921 | 1.143 | 11.880 | 1.329 | 98.3 |
| SE-AM2 | 930 | 1512 | 0.274 | 7.639 | 0.600 | 95.6 |
| SE-AM3 | 930 | 1512 | 0.274 | 7.639 | 0.773 | 93.2 |
| LN-AM1 | 930 | 895 | 1.000 | 1.482 | 1.096 | 80.1 |
| LN-AM3 | 930 | 895 | 1.000 | 1.482 | 1.132 | 72.6 |
| AL-AM1 | 930 | 895 | 1.061 | 1.535 | 1.278 | 54.2 |
| AL-AM3 | 930 | 895 | 1.061 | 1.535 | 1.064 | 99.3 |
Note: Absorbance values were read at the selected wavenumbers from spectra acquired without baseline correction. For each spectrum, R was calculated as the ratio between the absorbance of the selected deposit-associated band and that of the corresponding substrate-associated band. RC, RD, and RT denote the ratios obtained for the clean textile reference, untreated as-deposited reference, and selected treated specimen, respectively. ATR-FTIR-derived relative band attenuation was calculated as Arel(%) = [(RD − RT)/(RD − RC)] × 100. A decrease from RD to RT indicates relative attenuation of the deposit-associated band at the analysed ATR contact site. Arel values were calculated using unrounded ratios, and are reported to one decimal place. The spectra used to obtain RC, RD, and RT were acquired from separate specimens, with one central ATR contact site per specimen. Accordingly, Arel describes a local spectral response, and does not represent the percentage of the deposit removed from the complete treated area or successive M0–M1–M2 measurements of the same specimen. The selected treated variants differ among textile–deposit systems, and are identified by specimen code.
Disclaimer/Publisher’s Note: The statements, opinions and data contained in all publications are solely those of the individual author(s) and contributor(s) and not of MDPI and/or the editor(s). MDPI and/or the editor(s) disclaim responsibility for any injury to people or property resulting from any ideas, methods, instructions or products referred to in the content. |
© 2026 by the authors. Licensee MDPI, Basel, Switzerland. This article is an open access article distributed under the terms and conditions of the Creative Commons Attribution (CC BY) license (http://creativecommons.org/licenses/by/4.0/).
Copyright: This open access article is published under a Creative Commons CC BY 4.0 license, which permit the free download, distribution, and reuse, provided that the author and preprint are cited in any reuse.