
Submitted:
04 October 2026
Posted:
07 October 2026
You are already at the latest version
Abstract
Biomass cogeneration plants supplying district heating systems operate under variable thermal loads, which affect the fuel consumption attributable to electricity generation. This paper analyzes the net specific biomass consumption allocated to electricity generation in a wood biomass cogeneration plant in Suceava, Romania, with four 30 t/h steam boilers and a 29.65 MWe steam turbine. Six years of monthly operating data were used to assess the influence of the heat delivered to the district heating system and the biomass moisture content. The thermal load was the main influencing factor, since at low heat demand more steam is condensed without heat recovery. In winter months, with 1500–2500 toe of heat delivered monthly, the specific consumption ranged between 2.0 and 3.5 toe biomass/toe electricity (average ≈2.5), whereas in summer months, with 500–1500 toe delivered monthly, it ranged between 3.0 and 5.0 toe biomass/toe electricity (average ≈4.0). Biomass moisture content (30–45%) had a secondary influence. An empirical equation is proposed for the accepted limit of the annual average specific biomass consumption as a function of the average monthly thermal load, corrected by a moisture impact factor. The equation supports assessing the energy and economic efficiency of electricity generation in such plants
Keywords:
biomass cogeneration
; combined heat and power
; specific biomass consumption
; electricity generation
; district heating
; thermal load
; biomass moisture
; steam Rankine cycle
; energy economics
1. Introduction
Conventional power generation systems, which generate only electricity, waste a significant portion of the energy contained in the fuel as heat. Combined heat and power (CHP), also known as cogeneration, addresses this inefficiency by capturing waste heat for useful purposes, such as space heating or industrial processes [1]. Recovery of energy from biomass for distributed power generation provides substantial options not only for the management of biomass but also for energy security [2].
In the European Union, cogeneration qualifies as high-efficiency cogeneration when it provides primary energy savings compared with the separate production of heat and electricity, according to the recast Energy Efficiency Directive [3]. The calculation of these savings relies on harmonized efficiency reference values for the separate production of electricity and heat, which are differentiated by fuel type, including solid biomass [4]. Frangopoulos [5] showed that a correct determination of the power-to-heat ratio and of the electricity produced in cogeneration mode is essential for assessing the primary energy savings of cogeneration systems.
Since a cogeneration plant consumes a single fuel flow to deliver two products, the fuel consumption attributable to electricity generation cannot be measured directly and has to be obtained by an allocation method. Rosen [6] described several output-based methods for allocating the fuel use and the associated emissions of cogeneration systems between electricity and heat, based on energy, exergy or reference efficiencies, and showed that the results depend significantly on the method adopted.
Cimdina et al. [7] carried out a correlation analysis of the operating data of a wood-fuel CHP plant and obtained an equation linking the specific fuel consumption to changes in the power-to-heat ratio. The average specific fuel consumption of the plant in cogeneration mode was 1.19 ± 0.1 loose m3/MWh, and the power-to-heat ratio was 0.48 ± 0.03.
Solid biomass CHP plants of medium and large capacity are mostly based on the steam Rankine cycle, whereas organic Rankine cycles, Stirling engines, externally fired gas turbines and gasification-based systems are being developed for small- and micro-scale applications [8]. Salomón et al. [9] reviewed the technologies, performance and costs of small-scale biomass CHP plants operating in Sweden and Finland, where these plants are closely integrated with district heating networks. Because such plants are usually operated to follow the heat demand, their electricity output is limited by the thermal load, and Savola and Fogelholm [10] developed an optimization model aimed at increasing the power production of small-scale biomass CHP plants.
The quality of the fuel is another factor that affects plant performance. The moisture content of wood biomass lowers its heating value and combustion temperature and increases the flue gas volume and the associated heat losses [11]. Gebreegziabher et al. [12] proposed a modeling approach for determining the optimum degree of biomass drying prior to combustion, considering the trade-off between the gain in boiler efficiency and the energy required for drying. In addition, ash-related problems such as fouling, slagging, bed agglomeration and corrosion can reduce the availability and efficiency of biomass-fired boilers [13].
The operating regime of a biomass CHP plant also depends on the district heating (DH) system it supplies. The transition towards fourth-generation district heating (4GDH), with lower supply temperatures and buildings with reduced heat demand, changes the conditions under which CHP plants operate [14]. Consequently, biomass CHP plants may operate for long periods at partial thermal load, especially in summer, which influences the fuel consumption allocated to electricity generation. From a thermodynamic standpoint, when the heat demand decreases, a larger share of the exhaust steam of the turbine has to be condensed without useful heat recovery, and the operation of the plant approaches that of a condensing power plant, with a correspondingly lower overall efficiency.
Most of the studies mentioned above are based on design data, simulations or relatively short operating periods. Fewer studies analyze, based on long-term operating data, how the specific biomass consumption allocated to electricity generation varies with the thermal load delivered to the DH system and with the fuel moisture. The aim of this paper is to establish limits that allow the assessment of the energy and economic efficiency of electricity generation in a biomass cogeneration plant. Real data recorded during six years of operation of the biomass cogeneration plant in Suceava, Romania, were used to analyze the influence of the thermal load and of the biomass moisture content on the net specific biomass consumption allocated to electricity generation and to derive an empirical equation for its accepted limit.
2. Materials and Methods
2.1. Description of the Biomass Cogeneration Plant
The analyzed plant supplies electricity to the grid and heat to the DH system of Suceava, Romania. The energy flows and the metering points of the plant are shown in Figure 1. The plant consists of the following main components:
- four wood biomass-fired superheated steam boilers (4 × 30 t/h), with live steam parameters of 77 bar (7.7 MPa) and 540 °C;
- electrostatic precipitators;
- chimneys;
- a turbogenerator assembly consisting of a steam turbine (29.65 MWe), a speed reducer and an electric generator;
- steam, condensate and feed water piping systems;
- a steam–water heat exchanger for delivering thermal energy to the DH circuit;
- a closed-circuit steam–water heat exchanger acting as a condenser;
- one biomass-fired hot water boiler, CAF no. 9 (15 MWt);
- three natural gas-fired hot water boilers, CAF no. 6, CAF no. 7 and CAF no. 8 (14.7 MWt each).
The hot water boilers are used to cover the peak thermal load. Recently, the plant has operated only in cogeneration mode, and no natural gas consumption has been recorded.
Each 30 t/h biomass steam boiler is equipped with an electrostatic precipitator, in which the flue gases are distributed evenly throughout the flow cross-section. Under the action of a direct current, the discharge electrodes create a corona discharge that ionizes the gas. The dust particles are negatively charged and move in the electric field towards the positive, grounded collecting electrodes, where they are deposited. At the bottom of the precipitator, an auger system collects the dust; to avoid reaching the dew point, the system is electrically heated.
2.2. Data and Methodology
The net specific biomass consumption for electricity generation in cogeneration, cspel, represents the amount of biomass, allocated by calculation from the total biomass consumption of the plant, required to produce one unit of electricity. It is expressed in toe of biomass per toe of electricity (1 toe = 41.868 GJ ≈ 11.63 MWh). Since it is a ratio o f two energy quantities, the indicator has the same numerical value in SI units (GJ/GJ). The monthly thermal loads analyzed, of 500–2500 toe/month, correspond to approximately 20.9–104.7 TJ/month.
Monthly values of the biomass consumption, electricity generation, heat delivered to the DH system and biomass moisture content, recorded over six years of plant operation, were used in the analysis. The monthly values were grouped into winter and summer months, and their dependence on the biomass moisture content and on the average monthly thermal load was analyzed using linear trend lines. The values that deviated most from the trend were excluded when determining the average levels of the indicator.
3. Results
3.1. Influence of Biomass Moisture Content
Figure 2 shows the monthly values of the net specific biomass consumption allocated to electricity generation for several winter months as a function of the biomass moisture content. The values vary relatively little with the moisture content. If the values that deviate the most from the trend are excluded, the indicator can be considered to vary linearly with the moisture content, with an average level of about 2.50 toe biomass/toe electricity.
Figure 3 shows the corresponding values for several summer months. For the same reasons, the indicator can be considered to vary linearly with the moisture content, with an average level of about 4.0 toe biomass/toe electricity.
3.2. Influence of Thermal Load
Figure 4 shows the variation of the monthly values of the specific biomass consumption for electricity generation as a function of the thermal load delivered by the plant. The indicator depends strongly on the amount of heat that the plant delivers to the DH system.
In winter months, when the thermal load is higher (1500–2500 toe of heat delivered monthly), the specific biomass consumption for electricity generation is low, in the range of 2.0–3.5 toe biomass/toe electricity. Lower values occurred when the biomass moisture content was higher: more moisture requires more heat to be produced for drying, which results in more electricity generated in cogeneration and, consequently, in a lower specific consumption. Higher values occurred when the biomass moisture content was lower.
In summer months, when the thermal load is reduced (500–1500 toe of heat delivered monthly), the monthly values of the specific biomass consumption for electricity generation are high, in the range of 3.0–5.0 toe biomass/toe electricity. The results for the two seasons are summarized in Table 1. Consequently, the main factor influencing the specific biomass consumption allocated to electricity generation is the thermal load of the plant, while the biomass moisture content has a secondary influence.
3.3. Empirical Equation for the Accepted Limit of Specific Biomass Consumption
Based on the trend obtained in Figure 4, the following empirical equation is proposed for the accepted limit of the net specific biomass consumption for electricity generation, calculated as an annual average:
where cspel is expressed in toe biomass/toe electricity, Q is the average monthly thermal load delivered to the DH system (toe/month) and λ is the biomass moisture impact factor. The variation of the factor λ with the biomass moisture content can be expressed as follows:
where φ is the moisture content of the biomass expressed as a percentage, for values between 30% and 45%. According to Equation (2), λ = 1 for a moisture content of about 41.8%, and it varies from about 1.17 at 30% to about 0.95 at 45%.
Figure 5 shows the accepted limit cspel calculated with Equations (1) and (2) as a function of the average monthly thermal load, for the bounds of the analyzed moisture range (30% and 45%) and for λ = 1. For the same thermal load, the accepted limit at 30% moisture is about 22% higher than at 45% moisture.
4. Discussion
The results confirm that, in a heat-led biomass cogeneration plant, the thermal load is the decisive parameter for the efficiency of electricity generation. For λ = 1, Equation (1) gives about 2.5 toe biomass/toe electricity for a thermal load of 2000 toe/month and about 4.2 toe biomass/toe electricity for 500 toe/month, which is consistent with the average levels observed in winter and summer. In summer, a larger part of the steam is condensed in the closed-circuit heat exchanger acting as a condenser, without useful heat recovery, so that the fuel allocated to electricity generation increases by about 60% compared with winter. This behavior agrees with the dependence of the specific fuel consumption on the power-to-heat ratio reported by Cimdina et al. [7] and with the fact that the electricity output of heat-led biomass CHP plants is limited by the heat demand [9,10].
The influence of the biomass moisture content was smaller and opposite in sign to what might be expected from a purely combustion-based perspective. Higher moisture lowers the heating value of the fuel and increases the flue gas losses [11], and drying the biomass before combustion is generally beneficial for boiler efficiency [12]. However, in the analyzed plant, higher moisture was associated with lower values of the specific consumption allocated to electricity, because more heat is produced for drying and more electricity is generated in cogeneration. Since the results of any allocation between electricity and heat depend on the method adopted [6], the moisture impact factor λ should be regarded as an empirical correction specific to the analyzed plant and allocation procedure rather than as a direct measure of the effect of moisture on combustion efficiency.
The proposed equation can be used as a benchmark for monitoring the operation of the plant and for assessing the energy and economic efficiency of electricity generation, for example when evaluating the fuel costs attributable to electricity. The results also indicate that measures increasing the heat demand in the warm season, such as connecting new heat consumers or supplying process heat, as well as the future evolution of the DH system [14], will directly affect the specific biomass consumption for electricity generation. The main limitations of the study are the scatter of the monthly data, the exclusion of the values that deviated most from the trend and the fact that the equation was derived for a single plant. Its application to other biomass cogeneration plants requires validation with their own operating data, within the analyzed ranges of thermal load and biomass moisture content.
5. Conclusions
The analysis of real operating data recorded over six years in the biomass cogeneration plant in Suceava allowed the determination of the net specific biomass consumption allocated to electricity generation in cogeneration mode and the identification of the main factors influencing it.
The thermal load delivered to the DH system is the main factor that determines the specific biomass consumption allocated to electricity generation. In winter months, with 1500–2500 toe of heat delivered monthly, the indicator is in the range of 2.0–3.5 toe biomass/toe electricity, with an average of about 2.5. In summer months, with 500–1500 toe/month, it increases to 3.0–5.0 toe biomass/toe electricity, with an average of about 4.0, i.e., about 60% higher than in winter.
The biomass moisture content has a secondary influence. Within the analyzed range of 30–45%, higher moisture values were associated with lower values of the specific consumption allocated to electricity; the moisture impact factor λ decreases from about 1.17 at 30% to about 0.95 at 45%.
The proposed empirical equation expresses the accepted limit of the annual average specific biomass consumption for electricity generation as a function of the average monthly thermal load, corrected by the biomass moisture impact factor. It can be used by plant operators and regulatory bodies as a benchmark for assessing the energy and economic efficiency of electricity generation in biomass cogeneration plants, within the ranges of thermal load and moisture content for which it was derived.
Author Contributions
Conceptualization, I.B.-I.; methodology, I.B.-I. and M.N.; formal analysis, I.B.-I.; investigation, I.B.; data curation, I.B.; writing—original draft preparation, I.B.-I.; writing—review and editing, M.N.; visualization, I.B.-I.; supervision, M.N. All authors have read and agreed to the published version of the manuscript.
Funding
This research received no external funding. The APC was partially funded by the National University of Science and Technology Politehnica Bucharest.
Institutional Review Board Statement
Not applicable.
Informed Consent Statement
Not applicable.
Data Availability Statement
The data presented in this study are available on request from the corresponding author. The data are not publicly available due to commercial confidentiality of the plant operator.
Acknowledgments
The authors thank the management of the Suceava biomass cogeneration plant for providing access to the operating data. During the preparation of this manuscript, the authors used Claude (Anthropic, Claude Opus 5.5) for the purposes of bibliographic analysis, i.e., identifying and summarizing relevant literature. The authors have reviewed and edited the output and take full responsibility for the content of this publication.
Conflicts of Interest
Author Iulian Baciu is employed by the Bioenergy Cogeneration Plant, Suceava, Romania. The remaining authors declare no conflicts of interest.
Abbreviations
The following abbreviations are used in this manuscript:
CAF Hot water boiler (Romanian cazan de apă fierbinte)
CHP Combined heat and power
DH District heating
EU European Union
MWe Megawatt electrical
MWt Megawatt thermal
toe Tonne of oil equivalent (1 toe = 41.868 GJ)
References
- Malico, I. Biomass for Power Production and Cogeneration. In Forest Bioenergy;Green Energy and Technology; Gonçalves, A.C., Malico, I., Eds.; Springer: Cham, Switzerland, 2024; pp. 271–291. [Google Scholar] [CrossRef]
- Rehan, M.; Raza, M.A.; Abro, A.G.; Aman, M.M.; Ismail, I.M.I.; Nizami, A.S.; Rashid, M.I.; Summan, A.; Shahzad, K.; Ali, N. A sustainable use of biomass for electrical energy harvesting using distributed generation systems. Energy 2023, 278, 128036. [Google Scholar] [CrossRef]
- European Parliament and Council. Directive (EU) 2023/1791 of 13 September 2023 on Energy Efficiency and Amending Regulation (EU) 2023/955 (Recast). Off. J. Eur. Union 2023, L 231, 1–111. [Google Scholar]
- European Commission. Commission Delegated Regulation (EU) 2015/2402 of 12 October 2015 Reviewing Harmonised Efficiency Reference Values for Separate Production of Electricity and Heat in Application of Directive 2012/27/EU. Off. J. Eur. Union 2015, L 333, 54–61. [Google Scholar]
- Frangopoulos, C.A. A method to determine the power to heat ratio, the cogenerated electricity and the primary energy savings of cogeneration systems after the European Directive. Energy 2012, 45, 52–61. [Google Scholar] [CrossRef]
- Rosen, M.A. Allocating carbon dioxide emissions from cogeneration systems: Descriptions of selected output-based methods. J. Clean. Prod. 2008, 16, 171–177. [Google Scholar] [CrossRef]
- Cimdina, G.; Blumberga, D.; Veidenbergs, I. Analysis of wood fuel CHP operational experience. Energy Procedia 2015, 72, 263–269. [Google Scholar] [CrossRef]
- Dong, L.; Liu, H.; Riffat, S. Development of small-scale and micro-scale biomass-fuelled CHP systems—A literature review. Appl. Therm. Eng. 2009, 29, 2119–2126. [Google Scholar] [CrossRef]
- Salomón, M.; Savola, T.; Martin, A.; Fogelholm, C.-J.; Fransson, T. Small-scale biomass CHP plants in Sweden and Finland. Renew. Sustain. Energy Rev. 2011, 15, 4451–4465. [Google Scholar] [CrossRef]
- Savola, T.; Fogelholm, C.-J. MINLP optimisation model for increased power production in small-scale CHP plants. Appl. Therm. Eng. 2007, 27, 89–99. [Google Scholar] [CrossRef]
- Demirbas, A. Combustion characteristics of different biomass fuels. Prog. Energy Combust. Sci. 2004, 30, 219–230. [Google Scholar] [CrossRef]
- Gebreegziabher, T.; Oyedun, A.O.; Hui, C.W. Optimum biomass drying for combustion—A modeling approach. Energy 2013, 53, 67–73. [Google Scholar] [CrossRef]
- Khan, A.A.; de Jong, W.; Jansens, P.J.; Spliethoff, H. Biomass combustion in fluidized bed boilers: Potential problems and remedies. Fuel Process. Technol. 2009, 90, 21–50. [Google Scholar] [CrossRef]
- Lund, H.; Werner, S.; Wiltshire, R.; Svendsen, S.; Thorsen, J.E.; Hvelplund, F.; Mathiesen, B.V., 4th. Generation District Heating (4GDH): Integrating smart thermal grids into future sustainable energy systems. Energy 2014, 68, 1–11. [Google Scholar] [CrossRef]
Figure 1.
Energy flows and metering points of the biomass cogeneration plant in Suceava (Mi—fuel meters; Me.t—heat meters; Me.e—electricity meters).
Figure 1.
Energy flows and metering points of the biomass cogeneration plant in Suceava (Mi—fuel meters; Me.t—heat meters; Me.e—electricity meters).
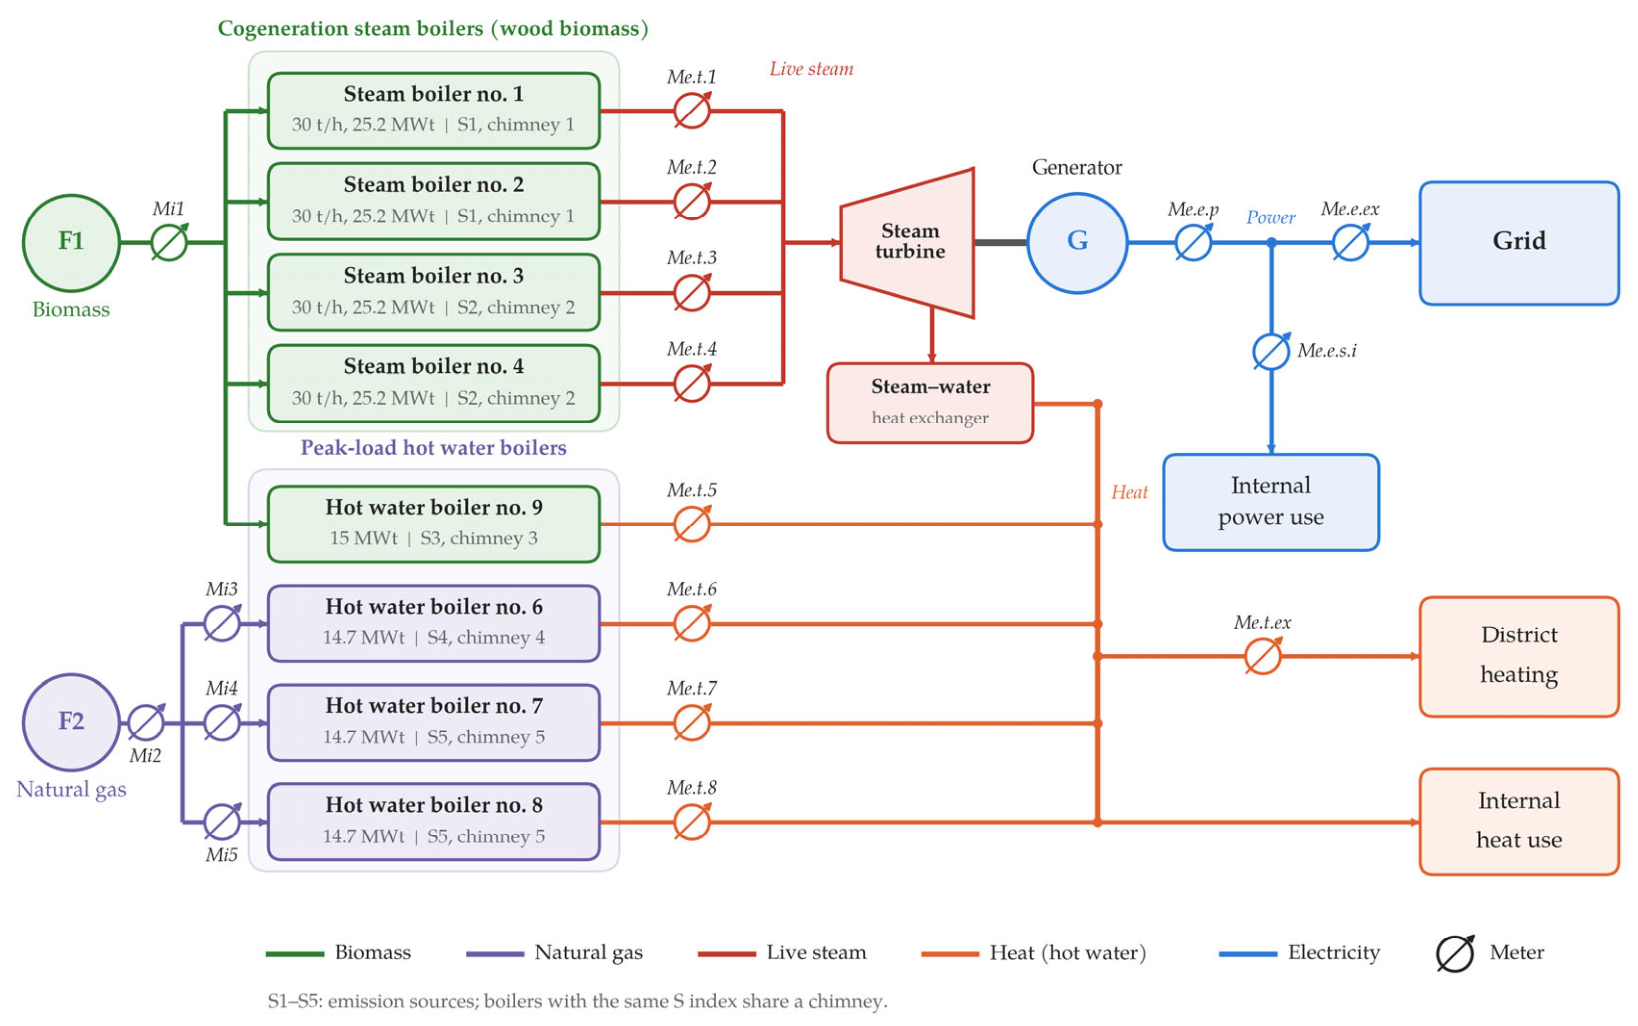
Figure 2.
Net specific biomass consumption allocated to electricity generation (toe biomass/toe electricity), monthly values for winter months, as a function of biomass moisture content.
Figure 2.
Net specific biomass consumption allocated to electricity generation (toe biomass/toe electricity), monthly values for winter months, as a function of biomass moisture content.
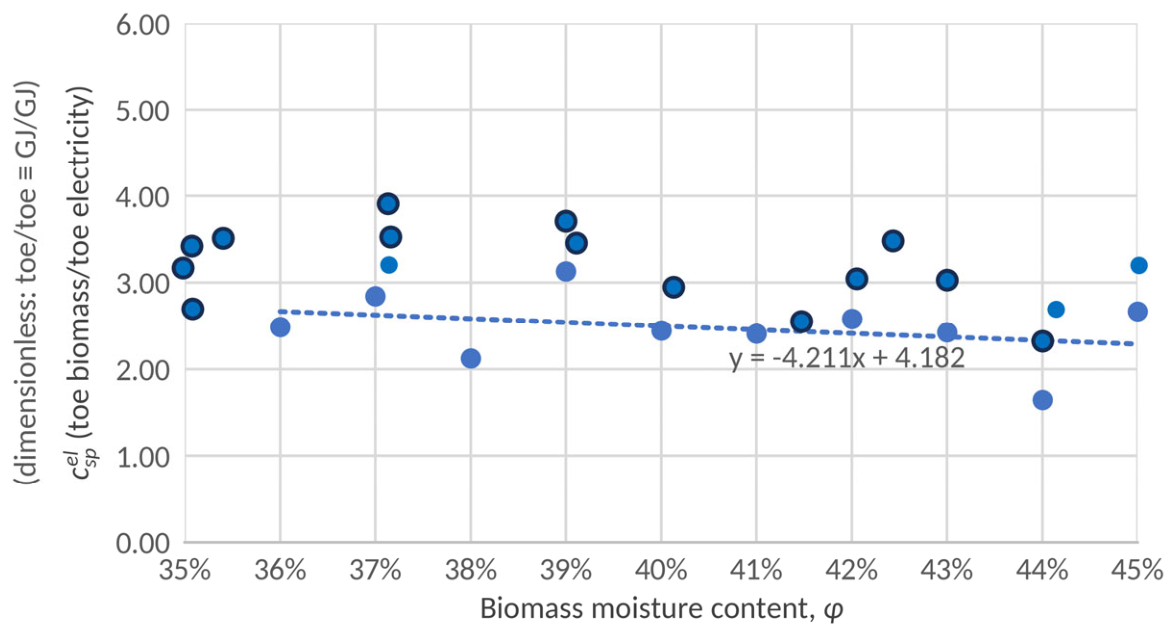
Figure 3.
Net specific biomass consumption allocated to electricity generation (toe biomass/toe electricity), monthly values for summer months, as a function of biomass moisture content.
Figure 3.
Net specific biomass consumption allocated to electricity generation (toe biomass/toe electricity), monthly values for summer months, as a function of biomass moisture content.
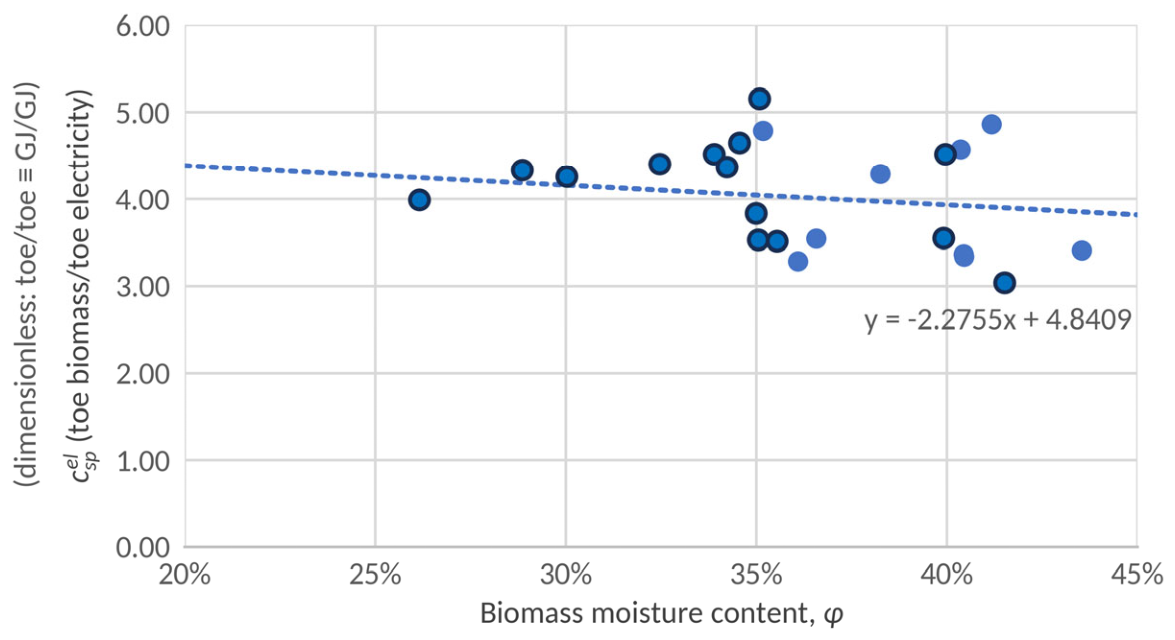
Figure 4.
Net specific biomass consumption allocated to electricity generation (toe biomass/toe electricity), monthly values, as a function of the average monthly thermal load delivered by the plant (toe/month). The upper horizontal axis gives the thermal load in SI units (TJ/month; 1 toe = 41.868 GJ); the specific consumption is dimensionless (toe/toe ≡ GJ/GJ).
Figure 4.
Net specific biomass consumption allocated to electricity generation (toe biomass/toe electricity), monthly values, as a function of the average monthly thermal load delivered by the plant (toe/month). The upper horizontal axis gives the thermal load in SI units (TJ/month; 1 toe = 41.868 GJ); the specific consumption is dimensionless (toe/toe ≡ GJ/GJ).
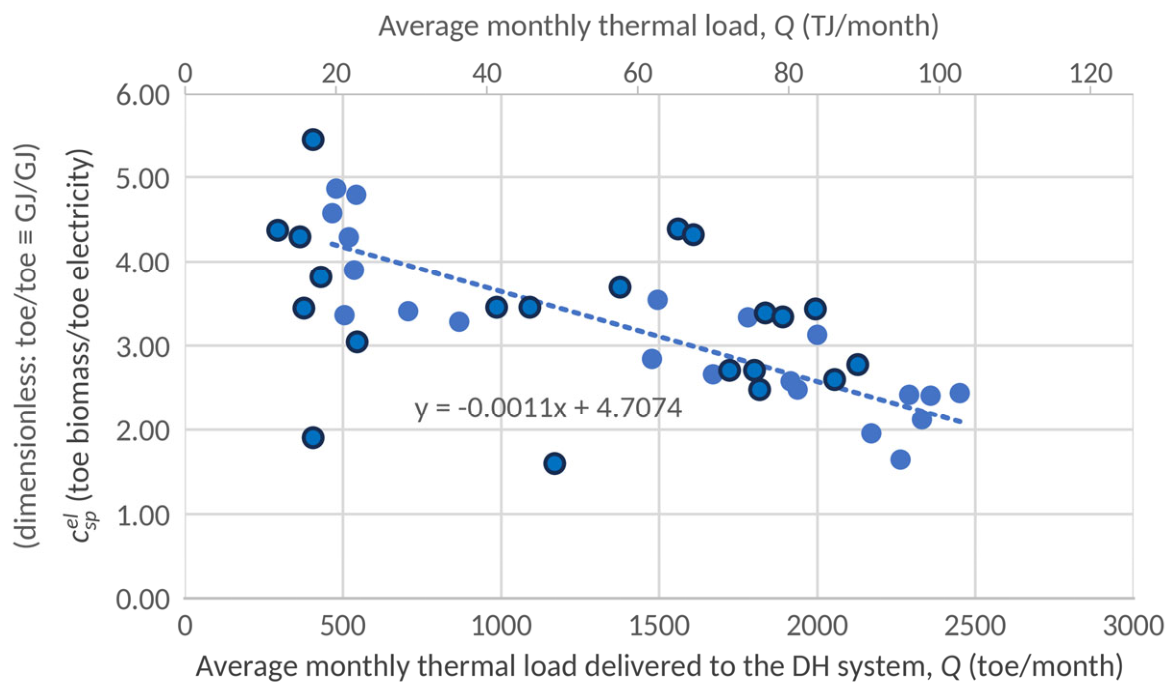
Figure 5.
Accepted limit of the net specific biomass consumption allocated to electricity generation, calculated with Equations (1) and (2), as a function of the average monthly thermal load, for biomass moisture contents of 30% and 45% and for λ = 1. The upper horizontal axis gives the thermal load in SI units (TJ/month; 1 toe = 41.868 GJ).
Figure 5.
Accepted limit of the net specific biomass consumption allocated to electricity generation, calculated with Equations (1) and (2), as a function of the average monthly thermal load, for biomass moisture contents of 30% and 45% and for λ = 1. The upper horizontal axis gives the thermal load in SI units (TJ/month; 1 toe = 41.868 GJ).
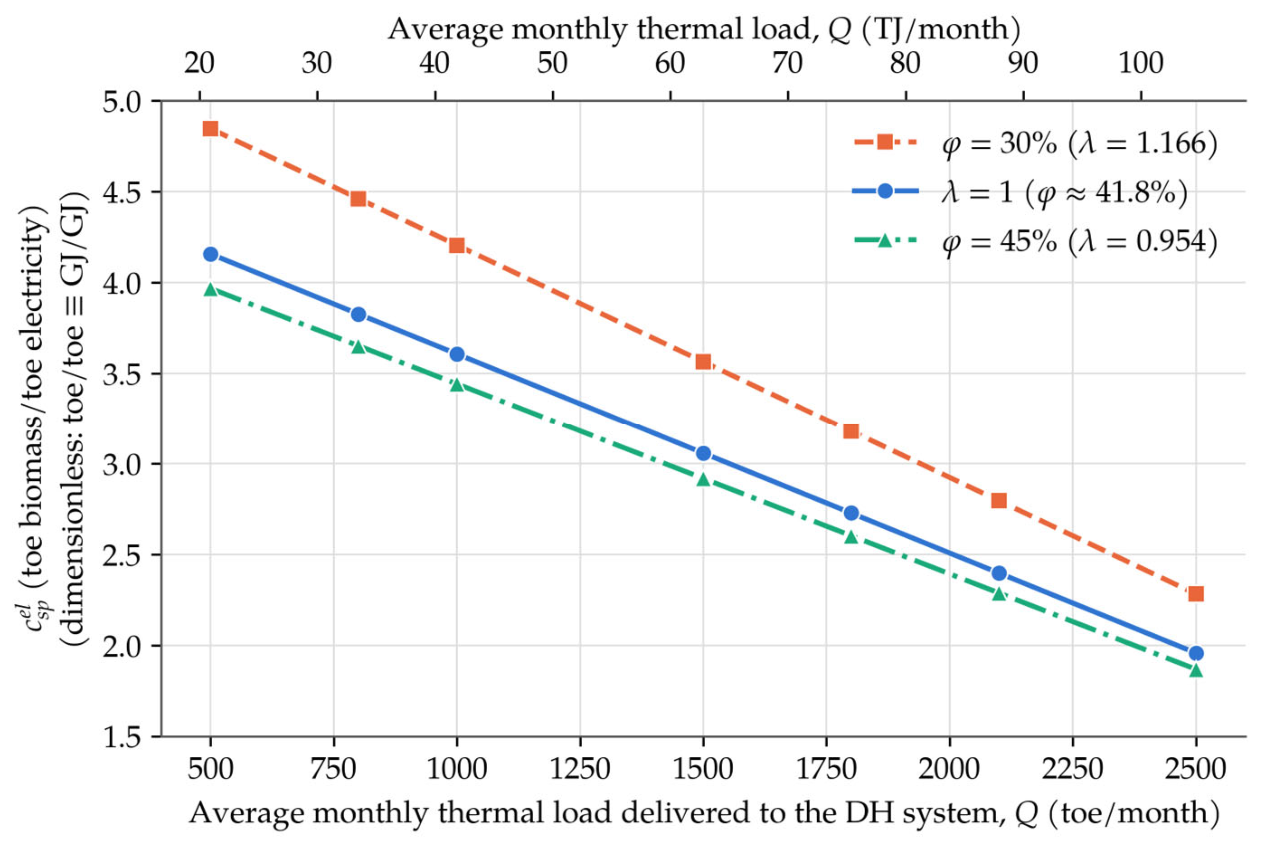

Table 1.
Net specific biomass consumption allocated to electricity generation in winter and summer months.
Table 1.
Net specific biomass consumption allocated to electricity generation in winter and summer months.
| Season | Heat delivered to DH (toe/month) | Specific consumption range (toe biomass/toe electricity) | Average level (toe biomass/toe electricity) |
|---|---|---|---|
| Winter | 1500–2500 | 2.0–3.5 | ≈2.5 |
| Summer | 500–1500 | 3.0–5.0 | ≈4.0 |
Disclaimer/Publisher’s Note: The statements, opinions and data contained in all publications are solely those of the individual author(s) and contributor(s) and not of MDPI and/or the editor(s). MDPI and/or the editor(s) disclaim responsibility for any injury to people or property resulting from any ideas, methods, instructions or products referred to in the content. |
© 2026 by the authors. Licensee MDPI, Basel, Switzerland. This article is an open access article distributed under the terms and conditions of the Creative Commons Attribution (CC BY) license (http://creativecommons.org/licenses/by/4.0/).
Copyright: This open access article is published under a Creative Commons CC BY 4.0 license, which permit the free download, distribution, and reuse, provided that the author and preprint are cited in any reuse.