

Submitted:
03 October 2026
Posted:
07 October 2026
You are already at the latest version
Abstract
The widespread presence of nanoplastics (NPs) of different sizes and polymer compositions in aquatic ecosystems has raised increasing concern. Yet, their quantification remains difficult due to analytical limitations. Metal-doped model NPs offer a useful approach in toxicological studies enabling more quantitative assessment of NPs occurrence in organisms. This study provides a novel link between quantitative NP uptake and their transcriptomic effects in Acartia tonsa, highlighting the influence of polymer composition and exposure route. This study examined transcriptional responses in the marine copepod following both waterborne and foodborne exposure to NPs of varying sizes and polymer types, including polystyrene (PS) with and without a palladium tracer (Pd-doped PS and PS) as well as gold-doped polyvinyl chloride (Au-doped PVC), polypropylene (Au-doped PP) and polyethylene (Au-doped PE) NPs. Accumulation of Pd or Au was measured as a proxy of NPs in microalgae, copepods and their feces. All studied NPs were found in the feces. In exposed copepods, Pd-doped PS NPs showed the highest accumulation within organisms, followed by Au-doped PP NPs. These differences in accumulation may be influenced by the physicochemical properties of the NPs. The presence of Au/Pd-doped PS NPs in copepods and the routes of exposure were linked to alterations of transcription levels of general and oxidative stress genes. In contrast, non-doped PS NPs of different sizes did not affect the transcription levels of the selected genes. Overall, this study demonstrates that NP accumulation and excretion, as well as the molecular mechanisms regulated in A. tonsa, vary depending on NP polymer chemistry as well as on the exposure route.
Keywords:
metal-doped nanoplastics
; copepods
; transcriptomics
; microalgae
1. Introduction
Plastic pollution is considered a threat to the marine environment since plastics are persistent and can take several years, even decades, to break down into smaller fragments that follow different transport and exposure routes [2]. The degradation of macro- and mesoplastics can release secondary microplastics (MPs < 1 mm) and nanoplastics (NPs < 1 µm) into natural environments [3]. MPs and NPs can contain a wide range of additives [4] and can adsorb other pollutants as well as pathogens, which may then become more bioavailable to target organisms [5,6,7]. Among plastic polymers, polyethylene (PE), polypropylene (PP), polystyrene (PS) and polyvinyl chloride (PVC) are the most frequently reported types in aquatic ecosystems [8].
Changes in the size of plastic particles influence their physicochemical properties and mobility, ultimately determining their potential biodistribution within organisms and cells and their effects [9,10]. It is generally considered that toxicity is inversely proportional to the particle size as smaller particles show greater potential to cross biological barriers than larger ones [11]. For example, exposure for 24 h to 50 nm PS NPs increased intracellular reactive oxygen species (ROS) compared to 10 µm PS NPs in adult Daphnia magna [12]. Similarly, the survival rate of 120 h post-hatching zebrafish larvae exposed to 50 nm PS NPs for 7 days was significantly lower compared to zebrafish larvae exposed to 1 µm PS NPs for 7 days [13]. Once inside the organism, cellular uptake of small NPs can occur through different endocytic mechanisms, whereas larger NPs and MPs are typically taken up through phagocytosis [6,14].
It has been demonstrated that ingestion of NPs and MPs by aquatic organisms, including zooplanktonic species, can lead to numerous alterations such as reduced food intake and impaired digestion, as well as physiological stress, including immune disruption, growth inhibition and reproductive and behavioral disturbances [15,16,17]. At the cellular level, exposure to MPs and NPs has mainly been associated with an increased production of ROS, leading to oxidative and general stress [18]. In this context, the use of molecular level biomarkers allows for an effective and rapid detection of early toxicological responses [19]. Indeed, transcriptome investigations can detect changes in gene transcription that conventional phenotypic and physiological studies are unable to reveal [20] , proving the value of determining changes in transcription of target genes for early detection and warning of toxicological damage [21]. Therefore, measuring changes in transcription levels of biomarker genes provides a suitable approach to understand early effects of NPs on relevant marine organisms, especially when combined with other endpoints at the individual level.
Studying the fate of NPs in aquatic organisms is challenging due to the lack of quantitative analytical detection methods for particles in this size range [22]. One of the most common methods to trace NPs is by labelling with fluorescent dyes, but the effectiveness and stability of this approach remain debatable. For example, it has been reported that fluorescent dyes can leach out from the NPs, leading to false positives [23,24]. Catarino et al. [23] demonstrated that commercial fluorescent PS NPs released their fluorophores, which accumulated in yolk and the gastrointestinal tract of zebrafish larvae. In contrast, [25] demonstrated the stability of the fluorescent dye in NPs after being incorporated into D. magna. Additionally, the detection limit for measuring fluorescently labelled NPs is often high and thus, exposure concentrations exceeding predicted environmental concentrations are frequently required [26].
Doping NPs with metal tracers that are scarcely present in the environment can be a more effective alternative for tracking plastic particles in environmental and biological systems [27]. Doping with rare metals can prevent the quenching of the tracer and background interference, thereby allowing more accurate detection through analytical methods such as Inductively Coupled Plasma Mass Spectrometry (ICP-MS) [28]. In addition, the high sensitivity of the metal doping approach has been demonstrated in several studies investigating NP accumulation in biological systems [24,29,30]
In tandem with the development of effective detection methods for NPs, the selection of suitable target species is crucial for accurately assessing the accumulation of NPs in biota. Choosing a representative species that is relevant to the ecosystem and exposure scenario of interest is essential for generating meaningful data and ensuring the validity of NP accumulation studies. The calanoid copepod Acartia tonsa is among the model species most recommended by the International Organization for Standardization (ISO) for assessing the acute toxicity of marine pollutants. A. tonsa is a cosmopolitan copepod commonly found in temperate coastal areas and estuaries. As a key component of zooplankton communities, it has a relevant role in marine food webs. Thus, through top-down and bottom-up controls, it has a great influence on phytoplankton, planktivorous fish and other secondary consumers [31,32]. The ecological importance, sensitivity and wide distribution of this copepod species make it highly suitable for studying the fate and effects of plastic particles in marine ecosystems.
Several species, including copepods, have been shown to be able to distinguish between MPs and food particles, consequently consuming fewer MPs under food availability regimes [33]. However, other studies have shown that microalgae can act as vectors for MPs and NPs accumulation in zooplankton [8,25]. For example, D. magna accumulated more fluorescent NPs when exposed through the foodborne route compared to the waterborne route [25]. Rodríguez-Torres et al. [34] demonstrated that the combination of food and MPs did not influence the dose-response uptake of MPs by the copepod Calanus hyperboreus.
In this context, the aim of this study was to investigate the transcriptional effects of waterborne and foodborne exposure to NPs of different sizes and polymer chemistries using the marine copepod Acartia tonsa as a model organism. The copepods were exposed to pristine PS NPs of different sizes, palladium-doped PS NPs, and gold-doped NPs composed of different polymers (PE, PP and PVC). Metals were used as proxies to track the presence of NPs within the organisms. Although several studies have investigated the distribution and accumulation of tracer-doped NPs in organisms, this study uniquely links the uptake and accumulation of different NPs with their transcriptomic effects in A. tonsa. Furthermore, understanding how the exposure route of these NPs can influence transcription patterns of selected target genes involved in detoxification pathways and general and oxidative stress of copepods can help decipher the effects of feeding on the toxicological profile of NPs.
2. Materials and Methods
2.1. Model Nanoplastics
Commercially available pristine PS NPs (Polysciences Europe GmbH, Hirschberg an der Bergstrasse, Germany) and a suite of metal-doped NPs synthesized in-house (palladium-doped PS NPs, Pd-doped PS) and gold-doped polyvinyl chloride (Au-doped PVC), polypropylene (Au-doped PP) and polyethylene (Au-doped PE) NPs)) were used in this study [10,35]. The size and polydispersity index (PdI) of NPs were measured using dynamic light scattering (DLS), while their net surface charge was measured by the zeta potential analysis using a Zetasizer Nano-ZS instrument (Malvern Panalytical Ltd., Malvern, United Kingdom). All measurements were carried out in ultrapure water (UPW, 18.2 MΩ.cm). The characteristics of the NPs, including nominal particle concentration, size, density, PdI and net surface charge are reported in Table S1.
2.2. Microalgae Culture
400 mL flasks of Tisochrysis lutea and Tetraselmis chuii from the Basque Microalgae Culture Collection (University of the Basque Country, EHU) were grown in the Plentzia Marine Station (PiE-EHU) microalgae culture room at 19°C and constant light (60 lux). The culture flasks were cleaned with 99% HCl (Sigma Aldrich) prior to use. Microalgae suspensions were diluted (1:4) with 0.2 µm filtered natural seawater pumped from the mouth of the Butroi estuary (Plentzia, Basque Country) (43°24'47.0"N, 2°56'52.8"W) and supplemented with 400 µL of F/2 nutrients (Fritz Pro Aquatics, Mesquite, Nevada). For each exposure experiment, T. lutea concentration was determined using a Neubauer cell-counting chamber. An aliquot of the microalgae stock culture was then diluted to obtain a final cell concentration of 5 x 10³ cells/mL to use in the foodborne experiments.
2.3. Acartia tonsa Culture
For all experiments, adult copepods were obtained from a laboratory culture maintained in the PiE-EHU research facility. A. tonsa egg cysts purchased from Algova aquarology company (Luneberg, Germany) were used to start the copepod culture. Egg cysts were incubated at a constant photoperiod of 16 h/8 h light/dark cycle for 48 h in 0.2 µm filtered natural seawater (Darlly PES filter), at 22ºC to allow hatching. Newly hatched nauplii were fed with the microalgae T. lutea up to 72 h post hatching, at a cell until reaching the copepodite stage. Then, temperature was gradually lowered to match the conditions of the experimental room (19ºC).
Copepodites and adult copepods were maintained in two tanks of 10-L filled with 0.2 µm filtered natural seawater at 19°C, 30 practical salinity units (PSU), and a constant photoperiod of 16 h/8 h light/dark cycle. Copepods were fed every two days with a 1:1 mixture of T. lutea and T. chuii at a cell concentration of 5 x 10³ cells/mL. To prevent potential cannibalism, newly hatched nauplii were transferred from the main tank into a smaller 5 L tank until reaching adulthood. Before the experimental exposure, copepods from one of the culture tanks were starved for 24 h to allow them to excrete most of the contents from their digestive tracts.
2.4. Experimental Set Up and Sample Collection
Intermediate NP suspensions at a nominal concentration of 1 x 10⁹ particles/mL were initially prepared in seawater from the NP stock solutions. Both the stocks and the intermediate suspensions were sonicated at 40 kHz for 6 min to ensure dispersion before pipetting.
The experiments were conducted in triplicate. In each replicate, 40 adult copepods were exposed in 250 mL of exposure medium. The experimental layout is illustrated in Figure S1. Briefly, replicate beakers were filled with 150 mL of filtered seawater and 40 adult copepods were transferred into the beakers. In the foodborne exposure replicates, T. lutea microalgae were added up to a final cell concentration of 5 x 10³ cells/mL. NPs were added up to a nominal concentration of 1 x 10⁸ particles/mL. This exposure concentration was selected because it was the lowest concentration at which NP aggregation did not occur and was within the limit of detection of the ICP-MS according to experiments carried out beforehand. In addition, a similar NP concentration has been used in a previous study on the copepod Tigriopus japonicus [36], highlighting the stability and dispersion of the NPs at this concentration during 40 hours of exposure.
Finally, filtered seawater was added to reach a final volume of 250 mL. In the PS NPs (PS and Pd-doped PS NPs) treatments, filtered seawater was added to the control replicates. In contrast, for the Au-doped NPs groups, sodium cholate (0.3 mg/mL) was used as the control solution, as it was used as a surfactant during the synthesis protocol [28]. Each beaker was covered with Parafilm® throughout the exposure period.
After 24 h of exposure, mortality, presence or absence of microalgae in the gut, and burst swimming were determined. Mortality was assessed by observing the bottom of the beaker under a light source. A copepod was considered dead if no movement was detected after a gentle stimulation using a pipette. The presence of microalgae inside the gut was observed by putting the beaker under a stereo microscope (Leica Mz16) and examining all individuals in the beaker. In addition, burst movements of each copepod were assessed under a stereo microscope. After measuring the different endpoints, to minimize interference from freely suspended NPs, copepods from each replicate were separated from the exposure medium using a 200 µm nylon mesh (Millipore), rinsed and immediately transferred to a 50 mm diameter Petri dish for sample processing before ICP-MS analysis. This separation step reduced potential carryover of free NPs from the surrounding medium during subsequent analyses. Using a pipette, from all replicates of each condition, five copepods from each condition were collected in 5 mL vials and frozen at -20 ºC for subsequent ICP-MS analysis. The remaining surviving copepods (up to 35 copepods per replicate) were transferred to a cryovial filled with RNAlater® (Sigma Aldrich) that was immediately frozen in liquid nitrogen and stored at -80 ºC. These samples were used for gene transcription analysis.
After copepod collection, 10 mL aliquots of the experimental media from all replicates and conditions were collected in glass vials under sterile conditions inside a laminar flow cabinet. Then, from waterborne and foodborne conditions, media was then filtered through a 60 µm mesh nylon filter (Merck Millipore) using a vacuum pump to collect fecal pellets for ICP-MS analysis. The sample filtration workflow is illustrated in Figure S1. After feces collection, media from the foodborne conditions and microalgae controls were further filtered through a 5 µm mesh nylon filter to collect microalgae for ICP-MS analysis. The filters were rolled, placed into 15 mL falcon tubes, and stored at -20ºC until further analysis.
2.5. Pd- and Au-Doped NP Synthesis and ICP-MS-Based Quantification
The Au metal-doped NPs were synthesized following the previously published oil-in-water emulsion protocol described by Cassano et al. [35]. In contrast, Pd-doped NPs were synthesized by chemically entrapping Pd within the NP core as described in Mitrano et al. [26]. These synthesis approaches result in a relatively uniform distribution of metal within the particle population, thereby minimizing particle-to-particle variability in metal content. Previous characterization of these materials has demonstrated that the metal signal scales proportionally with particle number and mass, supporting their suitability as quantitative tracers for ICP-MS-based quantification. Therefore, Au and Pd signals can be considered reliable proxies for NP accumulation in the exposed organisms.
Ultrapure water (UPW, 18.2 MΩ.cm) was obtained using a Milli-Q water purification system (Merck – Millipore, Molsheim, France). Standard solutions of gold (Au), palladium (Pd), cadmium (Cd), strontium (Sr), indium (In) and yttrium (Y) at 1000 mg/L for ICP-MS analysis as well as HNO3 (69 % Trace SELECT) and HCl (36 % Suprapur) were purchased from Sigma Aldrich – Merck (Darmstadt, Germany).
Au and Pd levels were quantified in the exposure media (10 mL), filters (60 µm and 5 µm) and copepods from all experimental conditions using ICP-MS. The collected media samples were transferred to 15 mL polypropylene (PP) tubes and lyophilized. In parallel, the material retained on the filters was re-suspended in 10 mL UPW (18.2 MΩ.cm), the filters removed, and the suspensions lyophilized. Subsequently, 1.55 mL of UPW and 400 µL of concentrated acid solution (HNO3:HCl 1:3 v/v and HNO3 for samples exposed to Au-doped NPs and Pd-doped NPs, respectively) were added, and the samples were digested in a heating block at 80 °C for 60 min. Copepods were manually transferred into 15 mL PP tubes. After addition of 1.55 mL of UPW and 400 µL of concentrated acid, samples were digested in a heating block at 80 °C for 3 h. Finally, all samples were diluted to 8 % aqua regia (HNO3:HCl 1:3 v/v) and 8 % HNO3 prior to ICP-MS analysis.
Due to the detection limits associated with individual copepod samples, all copepod replicates were pooled for ICP-MS analysis. All Au digests were analyzed against a 197Au calibration curve (0-25-50-100-500-1000-5000 ng/L) using 115In at 1 µg/L as an internal standard (ISTD) in 8 % aqua regia (HNO3:HCl 1:3 v/v). The limit of quantification (LoQ) was defined as the first positive calibration point, i.e., 25 ng/L in the injected solution. For validation and quality control (QC) the following criteria were systematically verified: calibration curve linearity (R2 ≥ 0.995); relative error < 30 % at the LoQ and < 10 % above the LoQ; ISTD recovery within 90 % - 110 % for standard solutions and 60 - 140 % for samples; Au concentration in blanks injected between samples < 50 ng/L (2*LoQ); and QCs (Au standard solutions at 50 and 500 ng/L) recoveries within the 80-120 % range. Pd digests were analyzed against a 106Pd calibration curve (0 -20 -100 -200 -1000 ng/L) using 115In at 1 µg/L as an internal standard in 8 % HNO3.
Total Pd and Au quantification was performed using an Agilent 7700x ICP-MS instrument (Agilent Technologies, Santa Clara, CA, USA) equipped with a Micromist nebulizer, a Scott double-pass spray chamber set at 2°C, a quartz torch with 2.5 mm internal-diameter injector, platinum sampling and skimmer cones and MassHunter 5.2 software version D.01.02 Build 708.1. The High Matrix Introduction (HMI) mode was used to accomodate with the elevated salt content of the samples (i.e., diluted seawater). Instrument performance parameters -including sensitivity, oxide-ion ratios and doubly charged-ion ratios- were verified daily after optimization of the measurement conditions using a standard built-in standard tuning procedure and a multi-elemental tuning solution. This ensured stable analytical conditions for ICP-MS measurements throughout the study.
2.6. Gene Transcription Analysis
The genes selected for this study are relevant biomarker genes in the A. tonsa defensome, representing different pathways related to stress responses and to well-established roles in detoxification mechanisms. Additionally, the selection of these biomarker genes was based on optimized primer performance and their rapid transcriptional response to contaminants, as reported in Hafez et al. [32] (Table S2). The gene catalase encodes an antioxidant enzyme involved in oxidative stress response; cytochrome p450 3026b (cyp3026b) participates in xenobiotic phase I metabolism, heat shock proteins 70 and 90 (hsp70 and hsp90) function as molecular chaperones associated with general stress; and ferritin encodes an iron storage protein linked to general stress responses.
RNA extraction was performed at room temperature using the RNeasy Mini Kit (Qiagen). RNAlater® (Sigma-Aldrich) was carefully removed from the cryovials without disturbing the copepods. RNA was then extracted following the manufacturer´s protocol and eluted in 30 μL of RNAse free water. RNA concentration and purity were assessed using a Nanodrop spectrophotometer (Thermo Scientific) and RNA integrity was evaluated with the Bioanalyzer 2100 (Agilent Technologies). Finally, all total RNA was reverse-transcribed into cDNA using the Affinity Script Multiple Temperature cDNA synthesis kit (Agilent Technologies) with random primers, following the manufacturer´s instructions.
Quantification of transcription levels of catalase, cyp3026b, hsp70, hsp90 and ferritin was optimized following [32]. Gene transcription levels were normalized using β-actin as the housekeeping gene, due to the low RNA yield β-actin showed a coefficient of variation below 5% across experimental groups. Each qPCR reaction contained (25 μL) 12.5 μL FastStart SYBR Green master mix with ROX passive dye (ROCHE Diagnostics), 0.3 μL forward primer, 0.3 μL reverse primer and 3 μL diluted cDNA template. qPCRs were run in 96 optical well plates (Applied Biosystems) using a 7300 Thermocycler (Applied Biosystems). The amplification program consisted of 50ºC for 2 min, 95ºC for 10 min, followed by 40 cycles of 95ºC for 15 s, and 1 min of annealing at the corresponding melting temperature (Tm, Table S2). A dissociation curve was included to verify the absence of nonspecific products. All qPCR assays were performed in triplicate, with a non-template control per plate. Amplification efficiency for each primer pair was determined using a 1:2 serial dilution curve generated from pooled experimental samples. All primer pairs showed amplification efficiencies above 80%. Relative gene transcription levels (RQ) were calculated using the Pfaffl method [37]. The average transcription level of all water control samples was used to normalize mRNA levels of samples exposed to PS NPs, whereas the average transcription level of sodium cholate controls was used for samples exposed to Au-doped NPs. Data were subsequently log 2 transformed.
2.7. Statistical Analysis
Data distribution was assessed using the Shapiro-Wilk test, and homogeneity of variances was evaluated with Levene’s test. Survival of exposed adults was compared to their respective controls using the unpaired Student’s t- test and subsequently then represented as percentages (Table S3). Gene transcription data followed a normal distribution and showed homogeneous variances; therefore, a one-way ANOVA followed by a Tukey-Kramer post hoc test was applied. To examine the differences in RQ between exposure conditions (waterborne or foodborne) within the same treatment, an unpaired t-test was conducted. Additionally, a two-way ANOVA was performed to analyze the effects of NP type/size and exposure route (foodborne or waterborne) as well as the interaction between these factors, on gene transcription levels. Statistically significant for all analyses was set at p < 0.05. All statistical analyses and graphs were generated using SPSS software (IBM V.28). A principal component analysis (PCA) based on the transcription patterns of all conditions was performed using the PAST statistical software version 4.03 [38].
3. Results and Discussion
Organism level responses and transcription levels of biomarker genes were measured in copepods after 24 h foodborne or waterborne exposure to the following NPs: PS NPs of different sizes (100, 200, 500 and 1000 nm), Pd-doped PS, Au-doped PP, Au-doped PE and Au-doped PVC NPs. Although the tested concentration (in terms of particles/mL) exceeds current estimates for marine environments, it was selected to ensure colloidal stability and analytical detectability and should therefore be interpreted as a mechanistic proof-of-concept exposure rather than an environmentally realistic scenario. However, when converted to mass unit, the selected concentrations can be considered as environmentally relevant [38]. This was complemented by assessing the presence of NPs in copepods, feces and microalgae at the end of the exposure period in terms of total NP content. This study investigated whether foodborne or waterborne exposure influenced the transcription levels of several biomarker genes.
3.1. Mortality and Organism Level Responses
Survival rate of copepods exposed to all conditions was high (>85%, Table S3). No significant differences were detected among treatments or between treatments and their respective control groups (marine water or sodium cholate). All surviving copepods exhibited burst-swimming and all individuals exposed to NPs via the foodborne route showed the presence microalgae in their guts. Previous studies have reported increased mortality in zooplankton species following exposure to higher nominal concentrations of MPs and NPs or to longer exposure durations. For example, Liu et al. [39] reported an LC50 of 80 mg/L in Daphnia pulex exposed to 75 nm PS NPs for 48 h. Similarly, Daphnia magna exposed to 20, 40, 60 and 100 nm amidine-functionalized PS NPs at concentrations ranging from 0.5 to 100 mg/L exhibited significant immobilization 20 and 40 nm NPs, highlighting that size as a key determinant of toxicity [40]. In the present study, the nominal concentrations tested (Table S1) were not high enough to induce significant effects on behavior or mortality after 24 h. This aligns with previous reports showing no acute toxicity effects of NPs in copepods [41].
3.2. ICP-MS Analysis of Au and Pd in Different Biomatrices
The total mass of NPs detected in copepods exposed to foodborne Au-doped PVC and Au-doped PP NPs was slightly higher than in copepods exposed through waterborne. In contrast, copepods exposed to foodborne Au-doped PE and Pd-doped PS NPs showed a lower total NP mass compared to those exposed through water (Figure 1).
The total mass of Au-doped PVC, PP and PE NPs detected in feces from copepods fed with microalgae was higher than in feces collected after the waterborne exposure, which may be related to the increased excretion rate of copepods fed with microalgae, as previously reported [33].
Copepods exposed to both foodborne and waterborne Au-doped PP NPs accumulated up to 1.971 and 2.015 μg of particles, respectively. This high accumulation and retention in copepods was further supported by the low levels detected in feces from both exposure routes [42]. Lee et al. [42] reported that 96 h post-hatch Danio rerio embryos exposed for 24 h to 550 nm fluorescent PP NPs accumulated particles in the gastrointestinal tract, but only 45% of them were excreted after 24 h of depuration. In addition, in the present study, microalgae in all foodborne replicates tended to accumulate lower amounts of NPs compared to the groups where microalgae in which microalgae were exposed directly to doped-NPs (without copepods). This pattern is particularly evident for Au-doped PE NPs (Figure 1c) which may indicate that part of these particles was incorporated through ingestion.
The total mass of NPs measured in microalgae and copepods exposed to Pd-doped PS NPs was the highest among all NPs polymers tested in this study. Copepods exposed to Pd-doped PS NPs (both foodborne or waterborne) accumulated and retained the particles, as further evidenced by the low total NPs mass detected in feces compared to the mass measured in copepods (Figure 1d). The average number of Pd-doped Ps particles detected per ng of Pd was (2.2 x 10⁸), whereas the average number of Au-doped particles detected per ng of Au range from 5.44 to 8.88 x 10⁶) (Table S1). Despite the colloidal stability of the Pd-doped PS NPs, as indicated by their surface charge of -36.2 mV in ultrapure water (Table S1), a combination of factors, such as the salinity of the exposure medium, the higher polydispersity index (0.289), the smaller particle size (144 nm) and the higher number of particles detected per metal weight may have contributed to the elevated accumulation of Pd-doped PS NPs in copepods compared to the other metal-doped NPs investigated in this study. Accumulation of Pd-doped NPs has previously been reported in several aquatic organisms. For example, D. magna adults exposed to 0.1 mg/L Pd-doped PS NPs accumulated NPs as little as 0.56 ng Pd-doped PS NPs/mg dry weight [43]. Accumulation of doped NPs was also observed in the freshwater benthic copepod Gammarus pulex after exposure to nominal Pd-doped PS NPs concentrations up to 30 g NPs/kg sediment [24]. Our findings in the marine copepod Acartia tonsa expand this knowledge by suggesting that the polymer composition of the metal-doped NPs may influence their retention and excretion rates. However, due to the detection associated with analyzing individual copepods, organisms were pooled prior to ICP MS analysis. Consequently, the lack of biological replication in the ICP-MS dataset severely limits the interpretation of accumulation patterns and the ability to link NP burden with transcriptional responses.
3.3. hsp70, hsp90, Catalase, Ferritin and cyp3026b Transcription Levels
The experimental design and the internal calibrators used to calculate RQ levels were based on two different controls: results obtained in marine water were used for PS NPs exposures, whereas sodium cholate was used for exposures to Au-doped NPs. Therefore, the two particle groups (PS NPs and Au-doped ones) were treated separately.
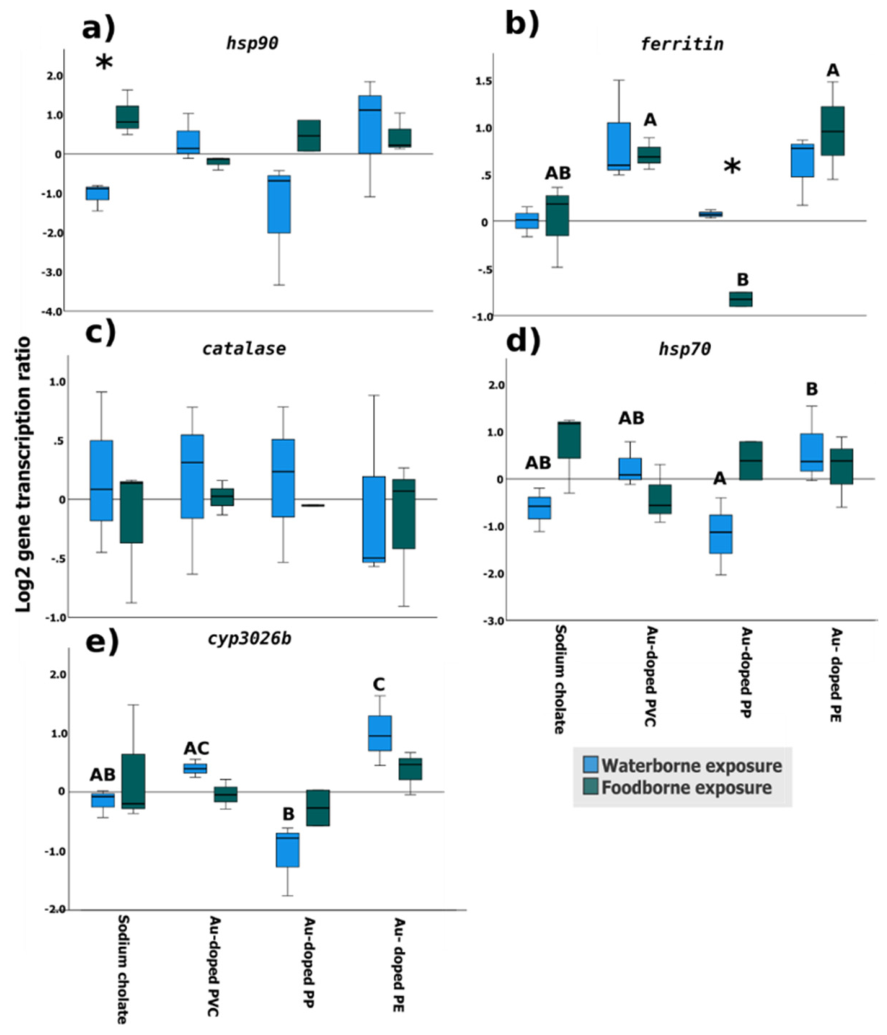
The unpaired t-test showed that hsp90 transcription was significantly higher in copepods foodborne exposed to sodium cholate than in non-exposed ones (waterborne control) (Figure 2a). This difference may be related to the electrophilic compounds present in microalgae, such as sesquiterpenes, which can activate heat shock transcription factor 1 (HSF1), and subsequently induce hsp90 transcription [44]. Katsuki et al. [45] also reported activation of this pathway in mice livers following dietary exposure. Additionally, ferritin levels were lower after foodborne exposure to Au-doped PP NPs than after waterborne exposure. At the same time, ferritin mRNA levels were lower in copepods foodborne exposed to Au-doped PP NPs than in those exposed to Au-doped PE and Au-doped PVC NPs (Figure 2b). Coupled with ICP-MS results, the retention of Au-doped PP NPs in copepods exposed through the foodborne route may have contributed to the reduced ferritin transcriptional levels and potentially decreased ferritin protein concentration. This may indicate an early stress-related transcriptional response in copepods as this globular protein complex plays an important role in cellular iron homeostasis [46] as well as in the detoxification pathways of several heavy metals [47]. Sun et al. [48] demonstrated that PP MPs (< 10 μm MPs at 100 MPs/mL) originating from surgical facemasks were found in the gut and the intestine of the marine copepod T. japonicus after foodborne exposure, resulting in reduced fecundity. However, adult copepods of this species were still capable of excreting high levels of PP in their feces, in contrast to the findings of our study. These differences may be primarily explained by variations in particle size [49]. Species-specific differences in zooplankton gut morphology and digestive processing may further influence particle retention and excretion.
In the present study, catalase transcription levels remained unaltered after exposure to the different Au-doped NPs, with no observable differences attributable to the polymer type among the Au-doped variants (Figure 2c). In contrast, Artemia salina juveniles exposed for 48 h to 100 μg/mL of PP MPs (11 μm to 44 μm) showed significant induction of antioxidant enzymes such as catalase, superoxide dismutase and glutathione S-transferase [50]. On the other hand, although quantitative analysis revealed a higher mass of PP-NPs than PE-NPs, hsp70 (Figure 2d) and cyp3026b (Figure 2e) mRNA levels were significantly higher in copepods waterborne exposed to Au-doped PE NPs than in those exposed to Au-doped PP NPs, the latter showing expression levels comparable to the control groups (sodium cholate).
Copepods exposed via water to Au-doped PE NPs showed significant upregulation of cyp3026b compared to both the control group and the group exposed to Au-doped PP NPs (Figure 2e), which may indicate activation of the phase 1 detoxification pathway [51]. Cytochrome P450 (cyp) family proteins are responsible for metabolizing a wide range of exogenous and lipophilic organic compounds [51] and exposure to different types of plastic particles has been reported to affect the regulation of several members of the cyp genes family [52]. For example, significant upregulation of cyp1a was observed in the intestine of zebrafish D. rerio exposed to 110 PE MPs/L [53]. In addition, D. magna exposed to up to 0.5 mg/L PS NPs showed upregulation of several CYP-coding genes, including cyp370b and cyp4 [51]. However, further data is needed to fully understand the role of cyp3026b in phase 1 detoxification in invertebrates, as the functions of cyp genes in these organisms remain less well characterized than in vertebrates [54].
To better understand the interactions between the polymer type of Au-doped NPs and the exposure route, a two-way ANOVA was conducted (Table S4). The results showed significant differences in the transcription levels of ferritin and cyp3026b, depending on the polymer of the Au-doped NPs. In addition, interactions between NPs polymer type and exposure route significantly affected hsp70 transcription levels in copepods exposed to these particles.
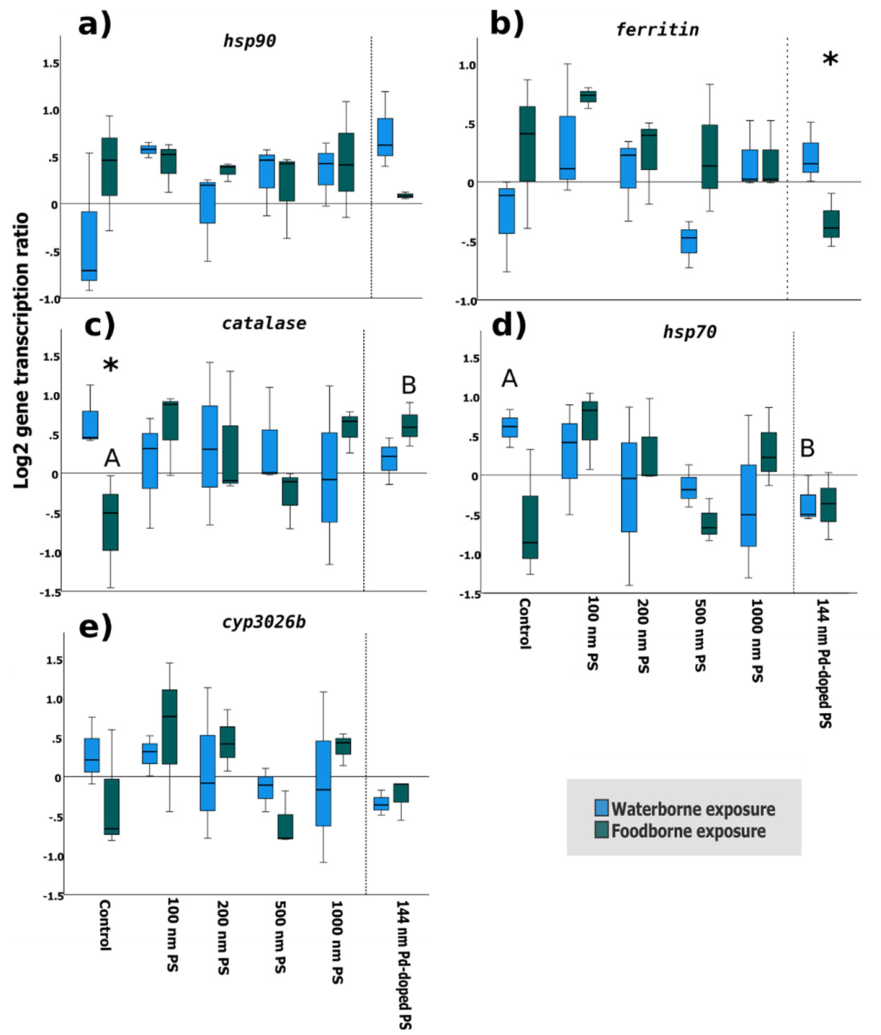
Transcriptomic analysis of genes in marine copepods exposed to PS NPs revealed that only ferritin showed significant differences between waterborne and foodborne exposures to Pd-doped PS NPs (Figure 3b). In addition, waterborne exposure to Pd-doped PS NPs significantly downregulated hsp70 in copepods compared to the control (Figure 3d), whereas catalase was upregulated in copepods foodborne exposed to Pd-doped PS NPs relative to the control (Figure 3c). The high accumulation and retention of Pd-doped NPs in copepods compared to microalgae and feces, as indicated by the NPs mass measurements, may therefore underlie these transcriptional changes. On the other hand, the significantly different catalase levels measured in the control groups of both foodborne versus waterborne exposures (Figure 3c) may also have contributed to the transcriptional responses observed in copepods exposed to Pd-doped NPs.
Figure 2.
Relative gene transcription levels in A. tonsa exposed to either waterborne or foodborne Au-doped NPs. a) heat shock protein 90 (hsp90), b) ferritin, c) catalase, d) heat shock protein 70 (hsp70) and e) cytochrome p450 3026b (cyp 3026b). Relative transcription levels are represented as log 2. Different letters denote significant differences according to the one-way ANOVA analysis followed by the Tukey Kramer post-hoc test (P < 0.05). Asterisks (*) denote significant differences within each treatment between exposure routes (foodborne, waterborne) using unpaired t-test (P < 0.05). Error bars denote standard deviations of the mean. n=3.
Figure 2.
Relative gene transcription levels in A. tonsa exposed to either waterborne or foodborne Au-doped NPs. a) heat shock protein 90 (hsp90), b) ferritin, c) catalase, d) heat shock protein 70 (hsp70) and e) cytochrome p450 3026b (cyp 3026b). Relative transcription levels are represented as log 2. Different letters denote significant differences according to the one-way ANOVA analysis followed by the Tukey Kramer post-hoc test (P < 0.05). Asterisks (*) denote significant differences within each treatment between exposure routes (foodborne, waterborne) using unpaired t-test (P < 0.05). Error bars denote standard deviations of the mean. n=3.
On the other hand, exposure to the model PS NPs of different nominal sizes (100, 200, 500, 1000 nm) did not influence the transcription levels of any target gene (Figure 3) under the studied conditions. Furthermore, the two-way ANOVA (Table S5) did not identify significant effects of PS NP size, exposure route or their interaction on the transcription levels of the studied genes in copepods. In agreement with these results, Kim et al. [55] reported no significant effects on the transcription levels of catalase and tumor necrosis factor (tnf) in T. japonicus foodborne exposed to 0.5 µg/L 50 nm PS NPs, whereas higher nominal concentrations (100 mg/L) significantly altered both catalase and tnf. Additionally, the F0 generation of D. pulex exposed to 1 µg/L of 75 nm PS NPs did not show any significant changes in the transcription levels of genes involved in oxidative stress (catalase, superoxide dismutase and glutathione peroxidase) [56].
Therefore, higher concentrations and/or longer exposure periods to pristine PS NPs may be required to observe transcriptional effects on the selected biomarker genes. However, it is important to note that post-translational modifications and other regulatory mechanisms can play vital roles in shaping the patterns observed at the protein level [57]. Consequently, a complementary study assessing the same biomarkers at the protein levels would provide a clearer understanding of the adverse effects associated with NPs exposure. Moreover, although the observed responses may be transient, our results demonstrate the rapid activation of biomarkers genes following stress, highlighting their suitability as early-warning indicators.
Figure 3.
Relative gene transcription levels in A. tonsa exposed to either waterborne or foodborne PS NPs and Pd-doped PS NPs. a) heat shock protein 90 (hsp90), b) ferritin, c) catalase, d) heat shock protein 70 (hsp70) and e) cytochrome p450 3026b (cyp 3026b). Relative transcription levels are represented as log 2. Different letters denote significant differences according to the one-way ANOVA analysis followed by the Tukey Kramer post-hoc test (P < 0.05). Asterisks (*) denote significant differences within each treatment between exposure routes (foodborne, waterborne) using unpaired t-test (P < 0.05). Error bars denote standard deviations of the mean. n=3.
Figure 3.
Relative gene transcription levels in A. tonsa exposed to either waterborne or foodborne PS NPs and Pd-doped PS NPs. a) heat shock protein 90 (hsp90), b) ferritin, c) catalase, d) heat shock protein 70 (hsp70) and e) cytochrome p450 3026b (cyp 3026b). Relative transcription levels are represented as log 2. Different letters denote significant differences according to the one-way ANOVA analysis followed by the Tukey Kramer post-hoc test (P < 0.05). Asterisks (*) denote significant differences within each treatment between exposure routes (foodborne, waterborne) using unpaired t-test (P < 0.05). Error bars denote standard deviations of the mean. n=3.
3.4. Principal Component Analysis
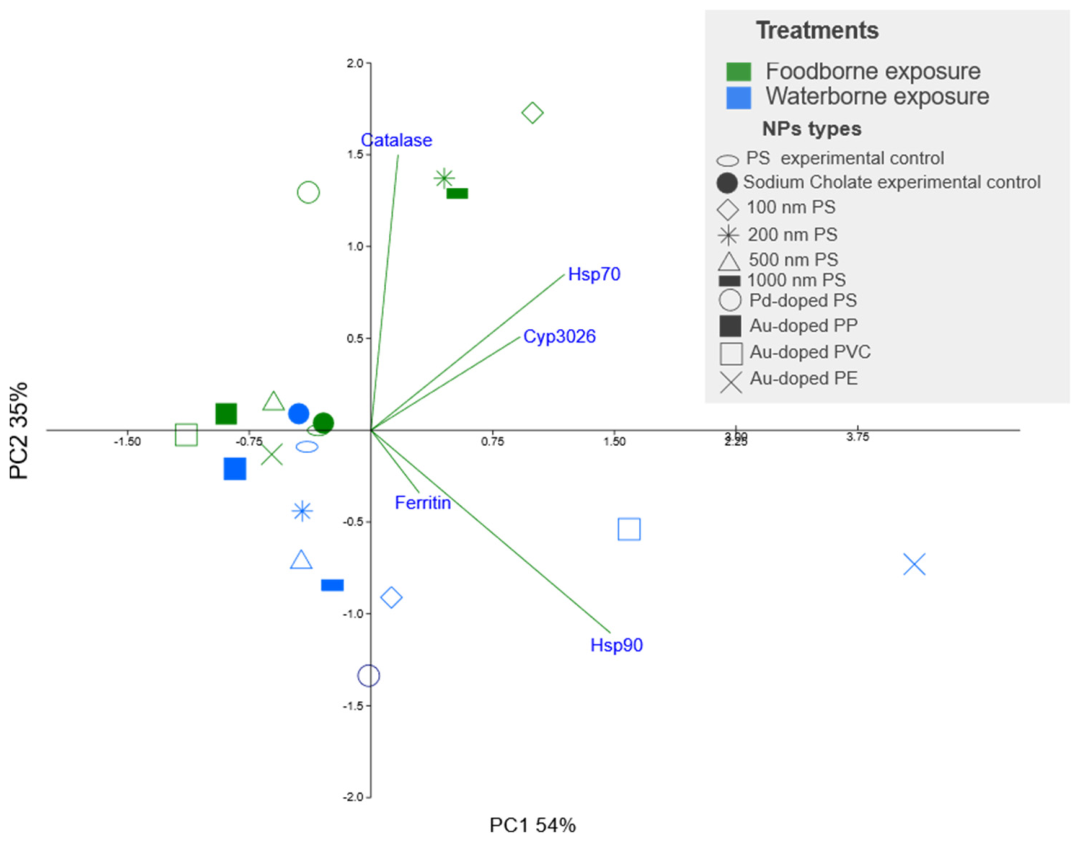
Principal component analysis (PCA) was used to compare the transcriptional patterns of the five genes studied in marine copepods exposed to the different NPs. The first two principal components explained a large proportion of the total variance (89%), indicating that the selected gene set captured the main axes of variation across experimental conditions. PC1 accounted for 54% of the total variability, while PC2 explained an additional 35% (Figure 4). PC1 was positively associated with the transcription levels of hsp70, hsp90, cyp3026b and ferritin, whereas PC2 primarily driven catalase expression. All PS NPs, including Pd-doped PS, clustered according to the route of exposure with the exception of PS 500 nm which fell outside the foodborne cluster. This suggests that the exposure route is a major driver of transcriptional responses, even when individual gene-level analyses do not reveal statistically significant differences.
Regarding Au-doped NPs, foodborne exposures Au-doped PVC, PE and PP NPs clustered together with waterborne exposure to Au-doped PP NPs, PS 500 nm (foodborne exposure), and the corresponding controls. Although no significant differences were detected in individual gene transcription for PS NPs, the PCA revealed distinct transcriptional patterns between foodborne and waterborne exposures across both doped and undoped PS NPs.
Overall, the PCA underscores the importance of considering exposure pathways when evaluating the biological effects of NPs and demonstrates the value of multivariate approaches for uncovering subtle yet biologically meaningful patterns in transcriptomic data.
4. Conclusions
This study demonstrated that the route of exposure (foodborne or waterborne) can influence the uptake, accumulation and excretion of NPs in marine copepods, as well as the transcription levels of the genes examined. It can also be highlighted that microalgae can act as vectors of NPs and modulate the extent of NP uptake and retention. Additionally, exposure to different metal-doped NPs affected marine copepods differently, likely due to differences in particle size and polymer chemistry, which influenced NP retention within the organism and depuration through feces. Au-doped PP NPs and Pd-doped PS NPs were highly retained in copepods, which may have contributed to the transcriptional changes observed after 24 h of exposure.
However, such transcriptional changes may be transient. Therefore, studies incorporating longer exposure periods as well as analyses at the protein and organismal levels, are needed to fully understand the impact of exposure pathways on marine organisms. In conclusion, this study provides novel insights into the fate and biological effects of NPs of different sizes and polymer types in an ecologically relevant zooplankton species, Acartia tonsa. Furthermore, it advances our understanding of the potential risks associated with NP entry into the marine food web through copepods, which represent one the most abundant organisms in the world´s oceans.
Supplementary Materials
The following supporting information can be downloaded at the website of this paper posted on Preprints.org.
Author Contributions
Tamer Hafez: Writing original draft, Methodology, Investigation, Data curation, Conceptualization, Editing and review. Gorka Yabar: Writing original draft, Methodology, Investigation, Data curation, Editing and review. Nagore Gonzalez-Soto: Methodology, Investigation, Editing and review. Marisa Sárria Pereira de Passos: Conceptualization, Methodology, Investigation, Editing and review. Gabriella F. Schirinzi: Methodology, Investigation, Data curation, Editing and review. Guillaume Bucher: Methodology, Investigation, Data curation, Editing and review. Douglas Gilliland: Editing and review, Conceptualization, Project administration, Funding acquisition. Miguel-Ángel Serra: Editing and review, Conceptualization, Project administration, Funding acquisition. Denise M. Mitrano: Editing and review, Conceptualization. Amaia Orbea: Editing and review, Conceptualization. Miren P. Cajaraville: Editing and review, Conceptualization, Funding acquisition, Project administration. Eider Bilbao: Writing original draft, Editing and review, Conceptualization, Data curation.
Funding
Work funded by the European Commission (project CAS6 “Towards a technological platform for nanoplastics detection”, ref. CAS 30602, DG JRC, S.4 Unit), the Spanish MCIU FIERA project (PID2021-128600OB-I00, MCIN/AEI/ 10.13039/501100011033 and “ERDF A way of making Europe”), Basque Government through a grant to consolidated research groups (IT1743-22), a postdoctoral grant to Nagore González-Soto and funding to the Laboratory for Transborder Cooperation LTC AquEus, Euskampus Fundazioa. Tamer Hafez was a holder of Margarita Salas postdoctoral fellowship funded by UPV/EHU through the European Union-Next Generation EU grants. Denise M. Mitrano was funded through the Swiss National Science Foundation, grant number PCEFP2_186856.
Data Availability Statement
The data that support the findings of this study are available from the corresponding author, Eider Bilbao, upon reasonable request.
Conflicts of Interest
The authors declare no conflicts of interest.
References
- P. R. Sutkar, R. D. Gadewar, and V. P. Dhulap, “Recent trends in degradation of microplastics in the environment: A state-of-the-art review,” Journal of Hazardous Materials Advances, vol. 11, p. 100343, Aug. 2023. [CrossRef]
- K. Ziani et al., “Microplastics: A Real Global Threat for Environment and Food Safety: A State of the Art Review,” Nutrients, vol. 15, no. 3, p. 617, Feb. 2023. [CrossRef]
- M. Wagner et al., “State of the science on plastic chemicals - Identifying and addressing chemicals and polymers of concern”. [CrossRef]
- N. González-Soto et al., “Impacts of dietary exposure to different sized polystyrene microplastics alone and with sorbed benzo[a]pyrene on biomarkers and whole organism responses in mussels Mytilus galloprovincialis,” Science of The Total Environment, vol. 684, pp. 548–566, Sep. 2019. [CrossRef]
- A. Katsumiti, M. P. Losada-Carrillo, M. Barros, and M. P. Cajaraville, “Polystyrene nanoplastics and microplastics can act as Trojan horse carriers of benzo(a)pyrene to mussel hemocytes in vitro,” Scientific Reports 2021 11:1, vol. 11, no. 1, pp. 1–17, Nov. 2021. [CrossRef]
- I. Martínez-Álvarez, K. Le Menach, M. P. Cajaraville, H. Budzinski, and A. Orbea, “Effects of polystyrene nano- and microplastics and of microplastics with sorbed polycyclic aromatic hydrocarbons in adult zebrafish,” Science of The Total Environment, vol. 927, p. 172380, Jun. 2024. [CrossRef]
- C. Kassotis et al., “Nanoplastics in Aquatic Environments: Impacts on Aquatic Species and Interactions with Environmental Factors and Pollutants,” Toxics 2022, Vol. 10, Page 326, vol. 10, no. 6, p. 326, Jun. 2022. [CrossRef]
- J. Gigault et al., “Nanoplastics are neither microplastics nor engineered nanoparticles,” Nature Nanotechnology 2021 16:5, vol. 16, no. 5, pp. 501–507, Apr. 2021. [CrossRef]
- D. M. Mitrano, P. Wick, and B. Nowack, “Placing nanoplastics in the context of global plastic pollution,” Nature Nanotechnology 2021 16:5, vol. 16, no. 5, pp. 491–500, Apr. 2021. [CrossRef]
- A. F. R. M. Ramsperger et al., “Nano- and microplastics: a comprehensive review on their exposure routes, translocation, and fate in humans,” NanoImpact, vol. 29, p. 100441, Jan. 2023. [CrossRef]
- J. S. Choi, S. H. Hong, and J. W. Park, “Evaluation of microplastic toxicity in accordance with different sizes and exposure times in the marine copepod Tigriopus japonicus,” Mar. Environ. Res., vol. 153, p. 104838, Jan. 2020. [CrossRef]
- M. Sendra, P. Pereiro, M. P. Yeste, L. Mercado, A. Figueras, and B. Novoa, “Size matters: Zebrafish (Danio rerio) as a model to study toxicity of nanoplastics from cells to the whole organism,” Environmental Pollution, vol. 268, p. 115769, Jan. 2021. [CrossRef]
- M. Sendra, A. Saco, M. P. Yeste, A. Romero, B. Novoa, and A. Figueras, “Nanoplastics: From tissue accumulation to cell translocation into Mytilus galloprovincialis hemocytes. resilience of immune cells exposed to nanoplastics and nanoplastics plus Vibrio splendidus combination,” J. Hazard. Mater., vol. 388, p. 121788, Apr. 2020. [CrossRef]
- Z. Bai, N. Wang, and M. Wang, “Effects of microplastics on marine copepods,” Ecotoxicol. Environ. Saf., vol. 217, p. 112243, Jul. 2021. [CrossRef]
- Y. Chae and Y. J. An, “Effects of micro- and nanoplastics on aquatic ecosystems: Current research trends and perspectives,” Mar. Pollut. Bull., vol. 124, no. 2, pp. 624–632, Nov. 2017. [CrossRef]
- Y. He, Y. Zhang, W. Zhou, R. Freitas, Y. Zhang, and Y. Zhang, “Combined exposure of polystyrene microplastics and carbamazepine induced transgenerational effects on the reproduction of Daphnia magna,” Environmental Science and Pollution Research 2023 30:25, vol. 30, no. 25, pp. 67596–67607, Apr. 2023. [CrossRef]
- T. Y. Suman et al., “Acute and chronic effects of polystyrene microplastics on brine shrimp: First evidence highlighting the molecular mechanism through transcriptome analysis,” J. Hazard. Mater., vol. 400, p. 123220, Dec. 2020. [CrossRef]
- S. Youssef and C. Mohammed, “A critical review of biomarkers in toxicology and risk assessment of environmental pollutants,” Annals of Environmental Science and Toxicology, vol. 8, no. 1, pp. 006–018, Mar. 2024. [CrossRef]
- T. M. Page and J. W. Lawley, “The Next Generation Is Here: A Review of Transcriptomic Approaches in Marine Ecology,” Front. Mar. Sci., vol. 9, p. 757921, May 2022. [CrossRef]
- A. B. Muñiz-González, F. Paoli, J. L. Martínez-Guitarte, and V. Lencioni, “Molecular biomarkers as tool for early warning by chlorpyrifos exposure on Alpine chironomids,” Environmental Pollution, vol. 290, p. 118061, Dec. 2021. [CrossRef]
- E. D. Okoffo and K. V. Thomas, “Quantitative analysis of nanoplastics in environmental and potable waters by pyrolysis-gas chromatography–mass spectrometry,” J. Hazard. Mater., vol. 464, p. 133013, Feb. 2024. [CrossRef]
- A. I. Catarino, A. Frutos, and T. B. Henry, “Use of fluorescent-labelled nanoplastics (NPs) to demonstrate NP absorption is inconclusive without adequate controls,” Science of The Total Environment, vol. 670, pp. 915–920, Jun. 2019. [CrossRef]
- P. E. Redondo-Hasselerharm, G. Vink, D. M. Mitrano, and A. A. Koelmans, “Metal-doping of nanoplastics enables accurate assessment of uptake and effects on Gammarus pulex,” Environ. Sci. Nano, vol. 8, no. 6, pp. 1761–1770, Jun. 2021. [CrossRef]
- M. Wang and W. X. Wang, “Infiltration of freshwater food chain by nanoplastics: An examination of trophic transfer and biological impact,” Chemosphere, vol. 345, p. 140541, Dec. 2023. [CrossRef]
- M. Al-Sid-Cheikh, S. J. Rowland, R. Kaegi, T. B. Henry, M. A. Cormier, and R. C. Thompson, “Synthesis of 14C-labelled polystyrene nanoplastics for environmental studies,” Communications Materials 2021 1:1, vol. 1, no. 1, pp. 1–8, Dec. 2020. [CrossRef]
- D. M. Mitrano, A. Beltzung, S. Frehland, M. Schmiedgruber, A. Cingolani, and F. Schmidt, “Synthesis of metal-doped nanoplastics and their utility to investigate fate and behaviour in complex environmental systems,” Nature Nanotechnology 2019 14:4, vol. 14, no. 4, pp. 362–368, Feb. 2019. [CrossRef]
- D. Cassano, R. La Spina, J. Ponti, I. Bianchi, and D. Gilliland, “Inorganic Species-Doped Polypropylene Nanoparticles for Multifunctional Detection,” ACS Appl. Nano Mater., vol. 4, no. 2, pp. 1551–1557, Feb. 2021. [CrossRef]
- N. J. Clark, F. R. Khan, D. M. Mitrano, D. Boyle, and R. C. Thompson, “Demonstrating the translocation of nanoplastics across the fish intestine using palladium-doped polystyrene in a salmon gut-sac,” Environ. Int., vol. 159, p. 106994, Jan. 2022. [CrossRef]
- S. He et al., “Distribution, bioaccumulation, and trophic transfer of palladium-doped nanoplastics in a constructed freshwater ecosystem,” Environ. Sci. Nano, vol. 9, no. 4, pp. 1353–1363, Apr. 2022. [CrossRef]
- G. Gorbi et al., “Standardized methods for acute and semichronic toxicity tests with the copepod Acartia tonsa,” Environ. Toxicol. Chem., 2012. [CrossRef]
- T. Hafez, D. Bilbao, N. Etxebarria, R. Duran, and M. Ortiz-Zarragoitia, “Application of a biological multilevel response approach in the copepod Acartia tonsa for toxicity testing of three oil Water Accommodated Fractions,” Mar. Environ. Res., vol. 169, p. 105378, Jul. 2021. [CrossRef]
- M. Cole et al., “Microplastics Alter the Properties and Sinking Rates of Zooplankton Faecal Pellets,” Environ. Sci. Technol., vol. 50, no. 6, pp. 3239–3246, Mar. 2016. [CrossRef]
- R. Rodríguez-Torres, R. Almeda, M. Kristiansen, S. Rist, M. S. Winding, and T. G. Nielsen, “Ingestion and impact of microplastics on arctic Calanus copepods,” Aquatic Toxicology, vol. 228, p. 105631, Nov. 2020. [CrossRef]
- D. Cassano, A. Bogni, R. La Spina, D. Gilliland, and J. Ponti, “Investigating the Cellular Uptake of Model Nanoplastics by Single-Cell ICP-MS,” Nanomaterials, vol. 13, no. 3, p. 594, Feb. 2023. [CrossRef]
- D. Xie, H. Wei, J. S. Lee, and M. Wang, “Mercury can be transported into marine copepod by polystyrene nanoplastics but is not bioaccumulated: An increased risk?,” Environmental Pollution, vol. 303, p. 119170, Jun. 2022. [CrossRef]
- M. W. Pfaffl, “A new mathematical model for relative quantification in real-time RT-PCR.,” Nucleic Acids Res., vol. 29, no. 9, 2001. [CrossRef]
- “Hammer, Ø., Harper, D. A. T., & Ryan, P. D. (2001). PAST Paleontological Statistics Software Package for Education and Data Analysis. Palaeontologia Electronica, 4, 9 p. - References - Scientific Research Publishing.” Accessed: Sep. 30, 2026. [Online]. Available: https://www.scirp.org/reference/referencespapers?referenceid=1540241.
- L. Smith and W. R. Turrell, “Monitoring Plastic Beach Litter by Number or by Weight: The Implications of Fragmentation,” Front. Mar. Sci., vol. 8, p. 702570, Sep. 2021. [CrossRef]
- Z. Liu et al., “Age-dependent survival, stress defense, and AMPK in Daphnia pulex after short-term exposure to a polystyrene nanoplastic,” Aquatic Toxicology, vol. 204, pp. 1–8, Nov. 2018. [CrossRef]
- A. Pochelon, S. Stoll, and V. I. Slaveykova, “Polystyrene nanoplastic behavior and toxicity on crustacean Daphnia magna: Media composition, size, and surface charge effects,” Environments - MDPI, vol. 8, no. 10, p. 101, Oct. 2021. [CrossRef]
- K. Kim, H. Yoon, J. S. Choi, Y. J. Jung, and J. W. Park, “Chronic effects of nano and microplastics on reproduction and development of marine copepod Tigriopus japonicus,” Ecotoxicol. Environ. Saf., vol. 243, p. 113962, Sep. 2022. [CrossRef]
- W. S. Lee, H. Kim, Y. Sim, T. Kang, and J. Jeong, “Fluorescent Polypropylene Nanoplastics for Studying Uptake, Biodistribution, and Excretion in Zebrafish Embryos,” ACS Omega, vol. 7, no. 2, pp. 2467–2473, Jan. 2022. [CrossRef]
- M. Heinlaan, K. Viljalo, J. Richter, A. Ingwersen, H. Vija, and D. M. Mitrano, “Multi-generation exposure to polystyrene nanoplastics showed no major adverse effects in Daphnia magna,” Environmental Pollution, vol. 323, p. 121213, Apr. 2023. [CrossRef]
- M. Li et al., “Efficient photoproduction of a high-value sesquiterpene pentalenene from the green microalga Chlamydomonas reinhardtii,” The Plant Journal, vol. 123, no. 2, p. e70354, Jul. 2025. [CrossRef]
- K. Katsuki et al., “Feeding induces expression of heat shock proteins that reduce oxidative stress,” FEBS Lett., vol. 571, no. 1–3, pp. 187–191, Jul. 2004. [CrossRef]
- V. Roncalli, M. Uttieri, and Y. Carotenuto, “The Distribution of Ferritins in Marine Copepods,” J. Mar. Sci. Eng., vol. 11, no. 6, p. 1187, Jun. 2023. [CrossRef]
- K. Si et al., “Heavy metal detoxification by recombinant ferritin from Apostichopus japonicus,” RSC Adv., vol. 7, no. 66, pp. 41909–41918, Aug. 2017. [CrossRef]
- J. Sun et al., “Release of Microplastics from Discarded Surgical Masks and Their Adverse Impacts on the Marine Copepod Tigriopus japonicus,” Environ. Sci. Technol. Lett., vol. 8, no. 12, pp. 1065–1070, Dec. 2021. [CrossRef]
- Z. L. R. Botterell et al., “Bioavailability of Microplastics to Marine Zooplankton: Effect of Shape and Infochemicals,” Environ. Sci. Technol., vol. 54, no. 19, pp. 12024–12033, Oct. 2020. [CrossRef]
- J. Jeyavani et al., “Toxicity evaluation of polypropylene microplastic on marine microcrustacean Artemia salina: An analysis of implications and vulnerability,” Chemosphere, vol. 296, p. 133990, Jun. 2022. [CrossRef]
- D. Wu et al., “Molecular characterisation of cytochrome P450 enzymes in waterflea (Daphnia pulex) and their expression regulation by polystyrene nanoplastics,” Aquatic Toxicology, vol. 217, p. 105350, Dec. 2019. [CrossRef]
- K. H. D. Tang, “Genotoxicity of Microplastics on Living Organisms: Effects on Chromosomes, DNA and Gene Expression,” Environments 2025, Vol. 12, Page 10, vol. 12, no. 1, p. 10, Jan. 2025. [CrossRef]
- C. W. Mak, K. Ching-Fong Yeung, and K. M. Chan, “Acute toxic effects of polyethylene microplastic on adult zebrafish,” Ecotoxicol. Environ. Saf., vol. 182, p. 109442, Oct. 2019. [CrossRef]
- J. Han, J. C. Park, A. Hagiwara, H. G. Park, and J. S. Lee, “Identification of the full 26 cytochrome P450 (CYP) genes and analysis of their expression in response to benzo[α]pyrene in the marine rotifer Brachionus rotundiformis,” Comp. Biochem. Physiol. Part D Genomics Proteomics, vol. 29, pp. 185–192, Mar. 2019. [CrossRef]
- K. Kim, H. Yoon, J. S. Choi, Y. J. Jung, and J. W. Park, “Chronic effects of nano and microplastics on reproduction and development of marine copepod Tigriopus japonicus,” Ecotoxicol. Environ. Saf., vol. 243, p. 113962, Sep. 2022. [CrossRef]
- Z. Liu et al., “Effects of nanoplastics at predicted environmental concentration on Daphnia pulex after exposure through multiple generations,” Environmental Pollution, vol. 256, p. 113506, Jan. 2020. [CrossRef]
- C. Glanemann et al., “Disparity between changes in mRNA abundance and enzyme activity in Corynebacterium glutamicum: Implications for DNA microarray analysis,” Appl. Microbiol. Biotechnol., vol. 61, no. 1, pp. 61–68, Dec. 2003. [CrossRef]
Figure 1.
Total mass (in µg) of Au-doped PVC (a), Au-doped PP (b), Au-doped PE (c) and Pd-doped PS (d) NPs measured in microalgae used for the foodborne exposures (microalgae+NPs+copepods) and in copepods and feces for the foodborne or waterborne exposures. In addition, the total mass of Au- and Pd-doped NPs was measured in microalgae exposed solely to the NPs (microalgae+NPs). The values presented for feces and microalgae are means of n = 2, fully independent replicates. Whereas for copepods one pool per treatment was analyzed n= 1.
Figure 1.
Total mass (in µg) of Au-doped PVC (a), Au-doped PP (b), Au-doped PE (c) and Pd-doped PS (d) NPs measured in microalgae used for the foodborne exposures (microalgae+NPs+copepods) and in copepods and feces for the foodborne or waterborne exposures. In addition, the total mass of Au- and Pd-doped NPs was measured in microalgae exposed solely to the NPs (microalgae+NPs). The values presented for feces and microalgae are means of n = 2, fully independent replicates. Whereas for copepods one pool per treatment was analyzed n= 1.
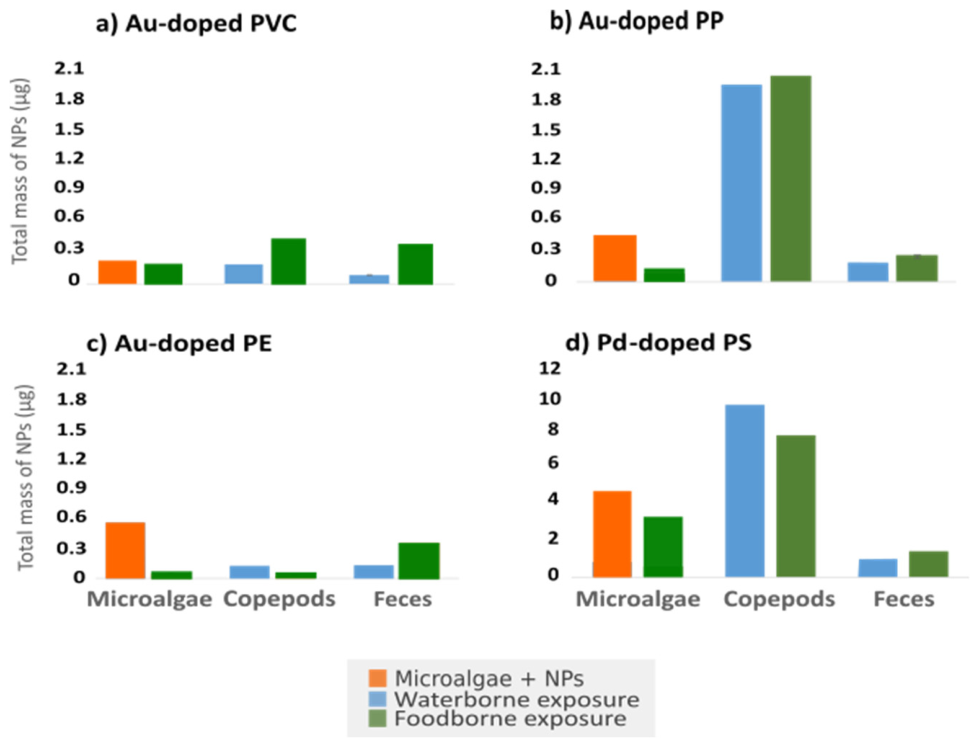
Figure 4.
Principal component analysis (PCA) based on the transcription levels of the target genes: heat shock protein 90 (hsp90), ferritin, catalase, heat shock protein 70 (hsp70) and cytochrome p450 3026b (cyp 3026b). Green symbols denote foodborne exposure treatments; blue symbols denote waterborne exposure treatments. PC1: Principal component 1, PC2: Principal component 2.
Figure 4.
Principal component analysis (PCA) based on the transcription levels of the target genes: heat shock protein 90 (hsp90), ferritin, catalase, heat shock protein 70 (hsp70) and cytochrome p450 3026b (cyp 3026b). Green symbols denote foodborne exposure treatments; blue symbols denote waterborne exposure treatments. PC1: Principal component 1, PC2: Principal component 2.
Disclaimer/Publisher’s Note: The statements, opinions and data contained in all publications are solely those of the individual author(s) and contributor(s) and not of MDPI and/or the editor(s). MDPI and/or the editor(s) disclaim responsibility for any injury to people or property resulting from any ideas, methods, instructions or products referred to in the content. |
© 2026 by the authors. Licensee MDPI, Basel, Switzerland. This article is an open access article distributed under the terms and conditions of the Creative Commons Attribution (CC BY) license (http://creativecommons.org/licenses/by/4.0/).
Copyright: This open access article is published under a Creative Commons CC BY 4.0 license, which permit the free download, distribution, and reuse, provided that the author and preprint are cited in any reuse.