

Submitted:
02 October 2026
Posted:
06 October 2026
You are already at the latest version
Abstract
This study tackles high power generation costs and emissions in power systems with Line Commutated Converter-based High Voltage Direct Current (LCC-HVDC) integration. Although LCC-HVDC reduces costs and emissions, it demands substantial reactive power support. To address this, three shunt capacitors (SCs) are added to lower costs and improve performance. An optimization model minimizes generation costs and emissions under varying load levels using the Backtracking Search Algorithm (BSA) for its robust global search and constraint-handling capabilities. The IEEE 30-bus system is used under three different load levels to evaluate performance. The study examines three cases: the base system, the system with HVDC, and the system with HVDC and SCs. Results show that integrating HVDC and SCs reduces generation costs and emissions considerably. For nominal load, the cost dropped by 15.28% with HVDC and SCs. The BSA was more efficient in optimization than the Artificial Bee Colony (ABC) algorithm.
Keywords:
generation cost
; emission
; voltage deviation
; shunt capacitor
; high voltage direct current
; load factor
1. Introduction
The increasing demand of electrical power systems due to urbanization and expansion of the cities, industrial growth, leads the recent researches to investigate how to meet the demand ,according to the IEA (The International Energy Agency) world energy outlook, during the next 20 years, there is expected to be a roughly 50% increase in the electricity demand [1], another challenge of the power systems is large distance between generation and distribution systems, this challenge also need to reconfigure and integrate the tradition power systems with techniques that can enhance the power grids [2].
The importance of this topic comes from combining two main techniques (SCs and HVDC) to enhance the overall performance of power system and reduce the cost with different load levels.
To emphasize the importance of this article and explain the contribution and research gap we investigated the other studies in the same area, for example in [3], integrate HVDC-LCC/VSC grids using optimization algorithm called Power Flow of the University of Padova (PFPD) to estimate power flow on Italian grid. In [4], Fitness-Distance Balance based Teaching-Learning-Based Artificial Bee Colony algorithm (FDB-TLABC) is demonstrated in a power network that incorporates stochastic Renewable Energy Sources (RESs).Voltage Source Converter-Multi Terminal DC (VSC-MTDC) systems proposed novel grid concept called Power Router (PR) for AC/DC hybrid power systems, it use IEEE-9 bus system added DC-line to reduce converter losses [5]. In [6] a deeply study is represented about Flexible AC Transmission Systems (FACTS) devices to demonstrate how the modern FACTS technology helps the transition of transmission networks to ‘’smart’’.
Many research focused last few years about how using optimization algorithm to enhance the power grid in terms cost, loss, emission..etc. For example in [7] Using a Symbiotic Organisms Search (SOS) algorithm, it focused on a solution to the security-constrained AC–DC OPF integrated with wind, solar sources using IEEE -30 and IEEE 57 bus test systems and comparing the (SOS) algorithm with others such as (ABC), Imperialist Competitive (ICA), Moth Swarm Algorithms (MSA), Shuffled Frog-Leaping(SFL), Genetic Algorithm (GA), and Particle Swarm Optimization Algorithms (PSO).In [8] examined the interaction between LCC-HVDC systems and the surrounding AC grid, their findings indicated that while SCs can assist in steady-state scenarios, but all these studies they did not deeply investigate under fluctuating load conditions. In [9] a complete picture of the existing literature based on the optimal placement and sizing of Static Synchronous Compensator (STATCOMs) as a reactive compensators represented, which is more complex system and expensive, these techniques don’t meet the research objectives in term of cost and emission.
In this article, two main technique are used HVDC and SCs, these two main techniques are integrated using BSA algorithm to optimize the (OPF) issues. The advantages of HVDC link are; cost effective in long distance power transmission, improved grid stability, ability to integrate renewable energy sources [10]. on another hand HVDC is expensive especially if the link is not long distance, there must be a balancing in the decision of choosing HVDC.
LCC and VSC represent two forms of HVDC systems employed for long-distance power transmission or connecting asynchronous AC systems [11], the LLC approached proposed in this research for cost effective factor while VSCs require large capacitors integrated within the converter valves to support their operations [12].
SCs is used in this article to get many advantages, its improving power factor, regulating voltage [13,14]. Shunt capacitors act in our case as a supplying reactive power source, which reduces the reactive power flow through transmission and distribution lines integrated with HVDC. Many articles are discussed the importance of using shunt capacitors in radial distribution systems in terms of sizing and locations with and without using optimization algorithms [15,16,17,18]. Other articles studied the impact of shunt capacitors on smart distribution grid, it was found that Capacitors bank mitigate the reactive power imbalance caused due to varying load [20].
The contributions of this study represent the integration of these components (HVDC,SCs) within OPF framework, also this study represents a comprehensive performance assessment across three loading scenarios (light, nominal, and heavy), which has not been thoroughly investigated in existing studies, joint minimization of generation costs, on the other hand this study considers the emission levels and voltage deviations. All these scenarios are implemented using BSA algorithm(detailed in the next section)for this category of hybrid AC/DC OPF problems. Although the IEEE 30-bus system is a medium-scale network rather than a long-distance transmission grid, it is extensively utilized in academic research for validating new methodologies.
The BSA is a population-based meta-heuristic that is well known for its strong global exploration ability. However, its application to OPF problems in hybrid AC/DC networks, which include LCC-HVDC links and multiple SCs under varying loading conditions, has received limited attention in the literature.
The key novelties and contributions of this study are summarized as follows:
- Development of a unified AC/DC OPF formulation for hybrid power systems that integrates LCC-HVDC links and multiple shunt capacitor banks.
- A complete performance assessment, across three loading scenarios—nominal and heavy—has not been fully explored in previous studies. There is a need to jointly minimize generation costs while taking into account emission levels and voltage deviations.
- Joint minimization of generation costs with consideration of emission levels and voltage deviations involves finding the balance between running power plants efficiently and keeping environmental impact low.
- Implementation of BSA for this category of hybrid AC/DC OPF problems, demonstrating its effectiveness and robustness.
- Benchmark comparison with the ABC algorithm to illustrate improvements in convergence behavior and solution reliability.
This work presents OPF strategy for hybrid AC/DC systems that incorporate LCC-HVDC link and multiple SCs. The BSA is employed to minimize generation costs while simultaneously evaluating the system’s performance in terms of emission levels and voltage deviations under various load conditions, including light, nominal, and heavy demand scenarios. While previous studies have investigated the BSA, LCC-HVDC systems, and SCs in isolation, the novelty of this research lies in the integration of these components within OPF framework. This allows for a comprehensive assessment of their combined effects on system performance across different load conditions.
The proposed approach is further validated by comparing the results of the proposed approach, with those obtained using the ABC.This comparison demonstrates the effectiveness of the BSA in enhancing both the quality of the solutions and the stability of the system.
In summary, this research helps the field by giving an OPF strategy that uses the strengths of BSA, LCC-HVDC and SCs, leading to improve operational efficiency and environmental performance in hybrid AC/DC power systems.
2. Problem Formulation
It is important to note that the fitness function of the optimization algorithms in-corporate only the OPF objective function. The emission and voltage deviation indices are subsequently calculated as performance metrics based on the resulting OPF solution and are not directly optimized.
Figure 1 illustrates the equivalent circuit of HVDC system, all the circuit parameters are deeply described in [20,21,22] where
Vdr is Rectifier DC voltage , Vdi is Inverter DC voltage , Vr and Vi are the AC bus voltages , αr and αi are the ignition angles of the rectifier and inverter and three resistances r'''cr, r''ci,, r''d .
The equations related to the operation of a converter’s rectifier are provided below, offering a clear and rigorous mathematical foundation for the study [22]:
Vdor =kVrtr ,() (1)
The reactive power on the rectifier side is calculated as follows:
Qdr = |Pdr tanɸr| (3)
The phase angle between the alternating current and voltage can be calculated using the following equation:
2.1. Generation Cost
The generation cost is a frequent objective function in optimizing power generation and distribution systems. The objective of generation cost is expressed mathematically by the following equation:
2.2. Emission
Considering emissions as an objective function in electric power system optimization attempts to reduce the negative environmental effects of electricity generation as in the following equation
The emission factors for grid power are NOx=5.06 lb/MWh, SO2=11.6 lb/MWh and CO2=2031 lb/MWh [23].
2.3. Voltage Deviation Index
This study employs the voltage deviation for each bus is computed as and the VDI, calculated using Equation (7) from reference [24].
VDI = (7)
2.4. Equality and Inequality Constraints
2.5. Fitness Function
The fitness function in (31) is then described using the augmented objective function, as detailed in reference [21].
Fitness = objective + error (8)
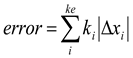
where ∆x is the difference between the state variable and its limit, ki is the penalty factor, and ke is the number of state variables (30 variables in our case ) expressed mathematically below:
3. Backtracking Search Algorithm
This study introduces the Backtracking Search Optimization Algorithm (BSA), an evolutionary algorithm (EA) designed to address numerical optimization problems [27]. EAs are renowned stochastic search methods that handle nonlinear, non-differentiable, and complex numerical optimization challenges [28,29,30].
The proposed algorithm’s five-step process is illustrated in Figure 2.
Although only ABC results are presented for comparison in this study, previous work [22] has already demonstrated a broader comparative evaluation involving GA, BSA, ABC, and other algorithms under identical test conditions, confirming the validity of the chosen benchmark. To ensure a fair comparison, all algorithms were evaluated using a fixed population size of 50 and a maximum of 200 iterations. The control parameters for the BSA were selected based on commonly reported values in the literature and subsequently refined through preliminary trial runs to achieve stable convergence performance. These parameter settings were consistently applied across all test cases under all loading conditions. The termination condition was met when either the maximum number of iterations was reached or the objective function exhibited no further improvement.
4. Simulation Results
This study utilizes the IEEE 30-bus system as the test model. The network includes two generators located at buses 1 and 2, along with four synchronous condensers positioned at buses 5, 8, 11, and 13. The system also contains 28 load buses, supplying a total demand of 283.4 MW of active power and 126.2 MVAr of reactive power. In addition, the grid consists of 41 transmission lines and four transformers. Comprehensive bus and line specifications for this test system are provided in Reference [31].
Load conditions are classified based on the load factor as follows:
Light Load: 80% of the nominal load.
Nominal Load: 100% of the rated load.
Heavy Load: 120% of the nominal load.
Three distinct scenarios are analyzed under varying load conditions to determine the optimal cost.
Case 1: The baseline system operating under light, nominal, and heavy load power flow conditions.
Case 2: The system with an HVDC link installed between buses 2 and 16, analyzed under light, nominal, and heavy load conditions.
Case 3: The system incorporating an HVDC link between buses 2 and 16 together with three SCs, evaluated under light, nominal, and heavy load conditions.
The constraints for the DC connection parameters and variables in Cases 2 and 3 are identical to those employed in the previous case, as detailed in reference [32].
The BSA was evaluated under both light and heavy load scenarios to assess its effectiveness in minimizing generation costs and reducing emissions as demonstrated in Table 1.
4.1. Light Load Scenario
In Case 1, with a light load, the cost to generate electricity was $536.08 per hour, and emissions were 493.29 klb/MW. Adding the LCC-HVDC link in Case 2 cut the cost by 13.35% and slightly lowered emissions by 0.92%. Case 3, which used SCs with the LCC-HVDC, showed even better results: the generation cost dropped by 15.60%, and emissions decreased by 14.26% compared to Case 1. This suggests that while the LCC-HVDC link on its own offers good cost savings, using both LCC-HVDC and SCs together really boosts both economic and environmental performance when the load is light.
4.2. Heavy Load Scenario
When the load was heavy, Case 1 had a generation cost of $589.60 per hour and emissions of 785.54 klb/MW. In Case 2, implementing the LCC-HVDC link reduced costs by 10.18% and emissions by 3.32%. Case 3, which included SCs, further lowered the cost by 15.14% and emissions by 12.90% compared to the initial setup. These results show that combining LCC-HVDC with reactive support improves how well the system works, especially when demand is high, leading to better voltage stability and less environmental impact.
4.3. Nominal Load
Case 1:
Under nominal loading conditions, the IEEE 30-bus system is analyzed using a Newton-Raphson (NR) power flow optimization technique designed to minimize both generation costs and emissions. The results indicate a generation cost of $597.26 per hour, an emission level of 827.36 lb/MW, and VDI of 0.5953 as shown in Table 2.
Case 2:
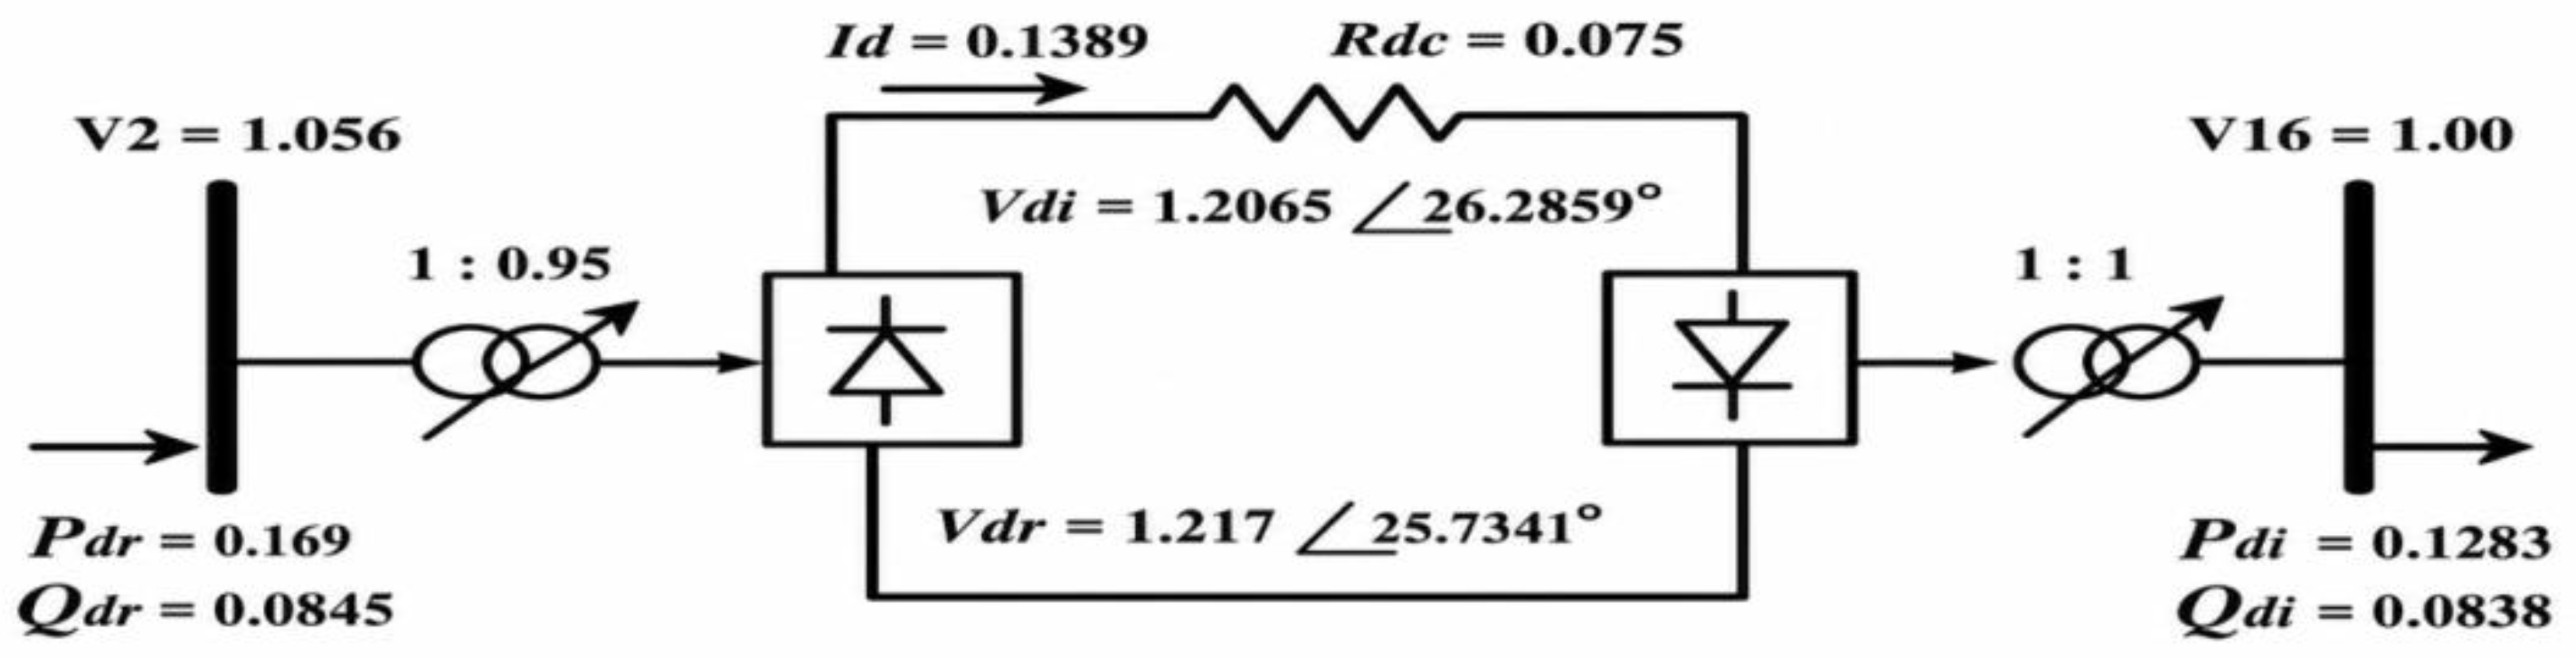
The test system has been enhanced to include HVDC link connecting buses 2 and 16. The BSA is subsequently applied to the modified system to address the optimization problem within the network. The results for the HVDC link are illustrated in Figure 3. Table 2 presents the BSA results for both the AC and DC systems, along with a comparison to the ABC algorithm. The table indicates that both the BSA and ABC methods yield results within acceptable limits for their respective approaches. The simulation showed that the BSA method worked better than the ABC algorithm.
Figure 3.
A two-terminal HVDC transmission link schematic illustration for Case 2.
Case 3:
The test system has been further modified to incorporate an HVDC link connecting buses 2 and 16, along with three SCs. The optimization problem associated with this updated configuration is addressed using the BSA. Figure 4 illustrates the outcomes of the HVDC link. Table 4 presents the BSA results for both the AC and DC systems, alongside a comparison with the ABC method. The simulation results indicate that the BSA method performs better than the ABC algorithm.
The placement of SCs is determined through an optimization procedure that targets buses exhibiting suboptimal voltage performance or significant reactive power deficits, with the objective of maximizing improvements in the VDI.
5. Results Discussion
5.1. Voltage Profile
Figure 5 demonstrates a significant improvement in bus voltage profiles for Cases 2 and 3 compared to Case 1. The enhancement in voltage levels is evident in both cases. In Case 2, the integration of the HVDC link contributes to this improvement, while in Case 3, the combined application of SCs with the HVDC link further enhances the voltage profiles. Importantly, all voltage levels depicted in the figure remain within acceptable limits.
5.2. Voltage Deviation
Figure 6 illustrates the voltage deviation at each bus under nominal load conditions, utilizing the BSA. The voltage deviation has greatly reduced from Case 1 to Case 2 and Case 3. Additional reduction in deviation obtained in Case 3 over that in Case 2 due to the addition of SCs in the network.
5.3. Statistical Performance Analysis
A comprehensive comparison between the BSA and the ABC was conducted under nominal loading conditions as shown in Table 3. In Case 2, the BSA achieved a reduction of 0.0965% in generation costs and a 0.4150% reduction in emissions compared to the ABC. In Case 3, the improvements were more pronounced, with the BSA reducing costs by 0.3693% and emissions by 1.7200%. Conversely, the ABC underperformed in all scenarios, exhibiting relative declines of −0.0966% and −0.4168% in costs and emissions, respectively, for Case 2, and −0.3707% and −1.7501% for Case 3. Although the numerical margins are small, the consistent superiority of the BSA underscores its robustness, efficiency, and superior convergence behavior in solving OPF problems involving LCC-HVDC integration and SCs.
To evaluate the robustness and reliability of the optimization algorithms, twenty independent runs were performed under the nominal operating condition of case3 as shown in Table 4. Since the objective is a minimization problem, lower objective function values indicate better performance. The statistical indicators considered include the best (minimum) value, mean value, and standard deviation (SD).

Table 4.
Statistical Performance Comparison of BSA and ABC under Nominal load of Case 3.
| Results | BSA | ABC | Results | BSA | ABC |
| 1 | 476.5254 | 478.7324 | 13 | 475.9341 | 478.0198 |
| 2 | 476.0800 | 478.5896 | 14 | 476.2470 | 478.2372 |
| 3 | 476.0782 | 480.6411 | 15 | 476.3598 | 477.8618 |
| 4 | 476.1565 | 480.5134 | 16 | 477.0126 | 478.0143 |
| 5 | 476.1184 | 477.9729 | 17 | 475.8822 | 477.5305 |
| 6 | 475.9092 | 478.0013 | 18 | 476.2181 | 478.0284 |
| 7 | 476.1218 | 479.2297 | 19 | 476.2487 | 477.5563 |
| 8 | 476.5103 | 478.4744 | 20 | 476.2852 | 477.9715 |
| 9 | 476.5767 | 479.7465 | Best Cost | 475.7667 | 477.5305 |
| 10 | 476.5640 | 478.5453 | Worst Cost | 477.0126 | 480.6411 |
| 11 | 475.7667 | 477.6941 | Mean Cost | 476.2185 | 478.4850 |
| 12 | 475.7749 | 478.3415 | SD | 0.3054 | 0.9716 |
The statistical results indicate that BSA outperforms ABC under nominal operating conditions for Case3. BSA achieved the lowest objective value (475.7667) and a lower mean value (476.2185) compared to ABC (477.5305 and 478.3971, respectively). In addition, BSA exhibited a substantially smaller standard deviation (0.3054) than ABC (0.9716), demonstrating greater consistency and robustness across multiple runs. These results confirm the superior convergence quality and robustness of the BSA algorithm.
6. Conclusion
This study examines the integration of HVDC systems with SCs and advanced optimization algorithms to enhance overall power system performance HVDC technology is important for making power transmission more efficient, helping to connect renewable energy sources, and keeping the power grid stable.When combined with HVDC systems, SCs provide vital reactive power support and contribute to cost-effective operations. More recently optimization methods, like the BSA are seen as capable of tackling important problem like cost and emission reductions, load variation management and others. Though real-time control, high computation cost and adaptability under varying operating conditions still represent significant problems.
The BSA features a simpler structure and fewer control parameters compared to ABC and other algorithms. While the ABC algorithm may achieve convergence in fewer iterations, the BSA consistently delivers superior final solution quality, particularly regarding generation cost.
This article delineates the advancements made in the field while identifying significant gaps, particularly in the optimization of generation costs under variable load conditions. Future study focuses on building up hybrid and real time optimization approaches toward the integration and reactive power compensation of HVDC systems. If these challenges are solved, it will enable a movement of the power industry towards more reliable, sustainable, and economical power system that fulfills the requirement of this dynamic energy world.
Although the IEEE 30-bus system is a widely adopted benchmark for comparative studies, it does not capture all the complexities of real transmission networks, such as renewable intermittency, N-1 security constraints, and dynamic load behavior. Future work will extend the proposed framework to larger-scale systems (e.g., IEEE 118-bus and Polish 2383-bus networks) and incorporate stochastic renewable generation and contingency analysis.
References
- Saleh, A. M.; István, V.; Khan, M. A.; Waseem, M.; Ahmed, A. N. A. Power system stability in the Era of energy Transition: Importance, Opportunities, Challenges, and future directions. Energy Convers. Manag. X 2024, 24, 100820. [Google Scholar] [CrossRef]
- Hadzimuratovic, S.; Fickert, L. Impact of gradually replacing old transmission lines with advanced composite conductors. In 2018 IEEE PES Innovative Smart Grid Technologies Conference Europe (ISGT-Europe); IEEE, October 2018; pp. 1–5. [Google Scholar]
- Benato, R.; Gardan, G. A novel ac/dc power flow: Hvdc-lcc/vsc inclusion into the pfpd bus admittance matrix. IEEE Access 2022, 10, 38123–38136. [Google Scholar] [CrossRef]
- Bakır, H.; Guvenc, U.; Duman, S.; Kahraman, H.T. Optimal power flow for hybrid AC/DC electrical networks configured with VSC-MTDC transmission lines and renewable energy sources. IEEE Syst. J. 2023. [Google Scholar] [CrossRef]
- Zhao, Q.; García-González, J.; Gomis-Bellmunt, O.; Prieto-Araujo, E.; Echavarren, F.M. Impact of converter losses on the optimal power flow solution of hybrid networks based on VSC-MTDC. Electr. Power Syst. Res. 2017, 151, 395–403. [Google Scholar] [CrossRef]
- Peng, F. Z. Flexible AC transmission systems (FACTS) and resilient AC distribution systems (RACDS) in smart grid. Proc. IEEE 2017, 105(11), 2099–2115. [Google Scholar] [CrossRef]
- Duman, S.; Li, J.; Wu, L.; Yorukeren, N. Symbiotic organisms search algorithm-based security-constrained AC–DC OPF regarding uncertainty of wind, PV and PEV systems. Soft Comput. 2021, 25(14), 9389–9426. [Google Scholar] [CrossRef]
- Xie, Qi; et al. An improved reactive power control strategy for LCC-HVDC to mitigate sending end transient voltage disturbance caused by commutation failures. Int. J. Electr. Power Energy Syst. 2023, 146, 108706. [Google Scholar] [CrossRef]
- Mumtahina, U.; Alahakoon, S.; Wolfs, P. A Literature Review on the Optimal Placement of Static Synchronous Compensator (STATCOM) in Distribution Networks. Energies 2023, 16, 6122. [Google Scholar] [CrossRef]
- Abedin, T.; Lipu, M.S.H.; Hannan, M.A.; Ker, P.J.; Rahman, S.A.; Yaw, C.T.; Tiong, S.K.; Muttaqi, K.M. Dynamic modeling of hvdc for power system stability assessment: A review, issues, and recommendations. Energies 2021, 14, 4829. [Google Scholar] [CrossRef]
- Beig, A. R.; Asghar, M. S. J. Performance evaluation and reliability of flexible asynchronous AC link and LCC–HVDC link under fault conditions. IEEE Access 2020, 8, 120562–120574. [Google Scholar] [CrossRef]
- Bermudez, J. L.; Nilsson, S. Capacitors for lcc and vschvdc converter stations. In High Voltage DC Transmission Systems: HVDC; Springer Nature Switzerland: Cham, 2025; pp. 523–551. [Google Scholar]
- Pamuk, N.; Uzun, U.E. Optimal Allocation of Distributed Generations and Capacitor Banks in Distribution Systems Using Arithmetic Optimization Algorithm. Appl. Sci. 2024, 14(2), 831. [Google Scholar] [CrossRef]
- Ivanov, O.; Neagu, B.C.; Grigoras, G.; Gavrilas, M. Optimal capacitor bank allocation in electricity distribution networks using metaheuristic algorithms. Energies 2019, 12(22), 4239. [Google Scholar] [CrossRef]
- Selim, A.; Kamel, S.; Mohamed, A. A.; Yu, J. Placement and sizing of distributed generations and shunt capacitors in radial distribution systems using hybrid optimization technique. Electr. Power Compon. Syst. 2023, 51(5), 421–437. [Google Scholar] [CrossRef]
- Kumar Injeti, S.; Shareef, Sd. M.; Kumar, T. V. Optimal Allocation of DGs and Capacitor Banks in Radial Distribution Systems. Distrib. Gener. Altern. Energy J. 2018, 33(3), 6–34. [Google Scholar] [CrossRef]
- El-Fergany, A. A.; Abdelaziz, A. Y. Artificial bee colony algorithm to allocate fixed and switched static shunt capacitors in radial distribution networks. Electr. Power Compon. Syst. 2014, 42(5), 427–438. [Google Scholar] [CrossRef]
- Syed, M. S.; Injeti, S. K. Simultaneous optimal placement of DGs and fixed capacitor banks in radial distribution systems using BSA optimization. Int. J. Comput. Appl. 2014, 108(5). [Google Scholar] [CrossRef]
- Nanibabu, S.; Shakila, B.; Prakash, M. Reactive power compensation using shunt compensation technique in the smart distribution grid. In 2021 6th International Conference on Computing, Communication and Security (ICCCS); IEEE, October 2021; pp. 1–6. [Google Scholar]
- Eidiani, M. A new hybrid method to assess available transfer capability in AC–DC networks using the wind power plant interconnection. IEEE Syst. J. 2022, 17(1), 1375–1382. [Google Scholar] [CrossRef]
- Arab, M.; Fadel, W. Optimal reactive power flow of ac-dc power system with shunt capacitors using backtracking search algorithm. Energies 2024, 17(3), 749. [Google Scholar] [CrossRef]
- Fadel, W.; Kilic, U.; Ayan, K. Optimal reactive power flow of power systems with two-terminal HVDC and multi distributed generations using backtracking search. 2021. [Google Scholar] [CrossRef]
- Abou El-Ela, A.A.; El-Sehiemy, R.A.; Abbas, A.S. Optimal placement and sizing of distributed generation and capacitor banks in distribution systems using water cycle algorithm. IEEE Syst. J. 2018, 12(4), 3629–3636. [Google Scholar] [CrossRef]
- Moradi, M.H.; Zeinalzadeh, A.; Mohammadi, Y.; Abedini, M. An efficient hybrid method for solving the optimal sitting and sizing problem of DG and shunt capacitor banks simultaneously based on imperialist competitive algorithm and genetic algorithm. Int. J. Electr. Power Energy Syst. 2014, 54, 101–111. [Google Scholar] [CrossRef]
- Kılıç, U.; Ayan, K.; Arifoğlu, U. Optimizing reactive power flow of HVDC systems using genetic algorithm. Int. J. Electr. Power Energy Syst. 2014, 55, 1–12. [Google Scholar] [CrossRef]
- Krishna, K.H.; Sekhar, K.C. Simplified PSO based controller design for AGC in deregulted power systems with TCSC, HVDC and SMES. J. Electr. Eng. 2016, 16(3), 13–13. [Google Scholar]
- Available online: http://www.pinarcivicioglu.com/bsa.html (accessed on Feb. 13 2024).
- Fadel, W.; Kilic, U.; Taskin, S. Placement of DG, CB, and TCSC in radial distribution system for power loss minimization using backtracking search algorithm. ElectrEng 2017, 99, 791–802. [Google Scholar] [CrossRef]
- Civicioglu, P. Backtracking search optimization algorithm for numerical optimization problems. Appl. Math. Comput 2013, 219(15), 8121–8144. [Google Scholar] [CrossRef]
- Mandal, J.K.; Ghosh, S.; Saha, S. Comparative performance analysis of evolutionary optimization algorithms. Procedia Comput Sci. 2015, 57, 395–404. [Google Scholar] [CrossRef]
- Arrillaga, J.; Liu, Y.H.; Watson, N.R. Flexible power transmission: the HVDC options; John Wiley & Sons: Chichester, 2007. [Google Scholar]
- Arrillaga, J.; Liu, Y. H.; Watson, N. R. Flexible power transmission: The HVDC options; John Wiley & Sons: Chichester, UK, 2007. [Google Scholar]
Figure 1.
Equivalent circuit of HVDC system [21].
Figure 1.
Equivalent circuit of HVDC system [21].
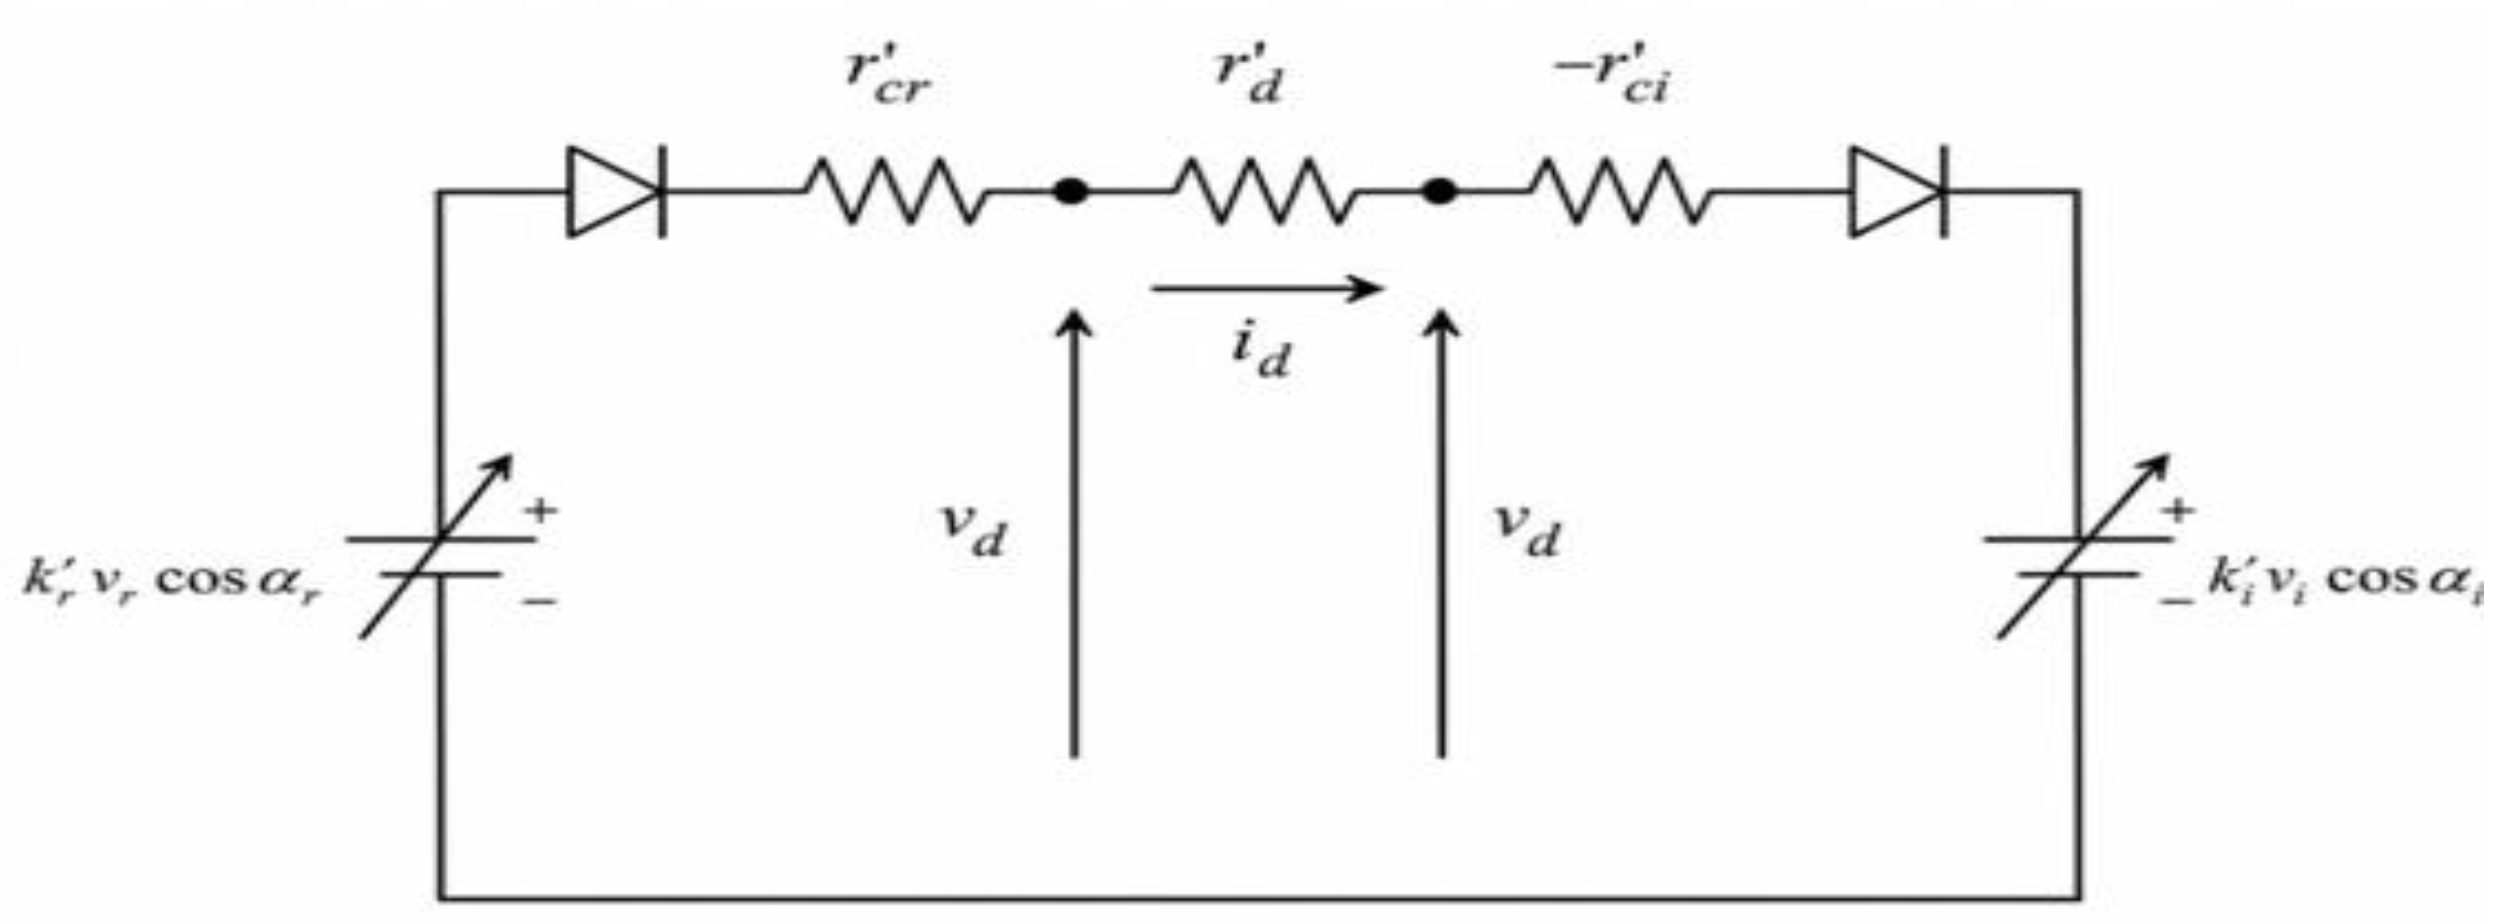
Figure 2.
Flowchart of the BSA [27].
Figure 2.
Flowchart of the BSA [27].
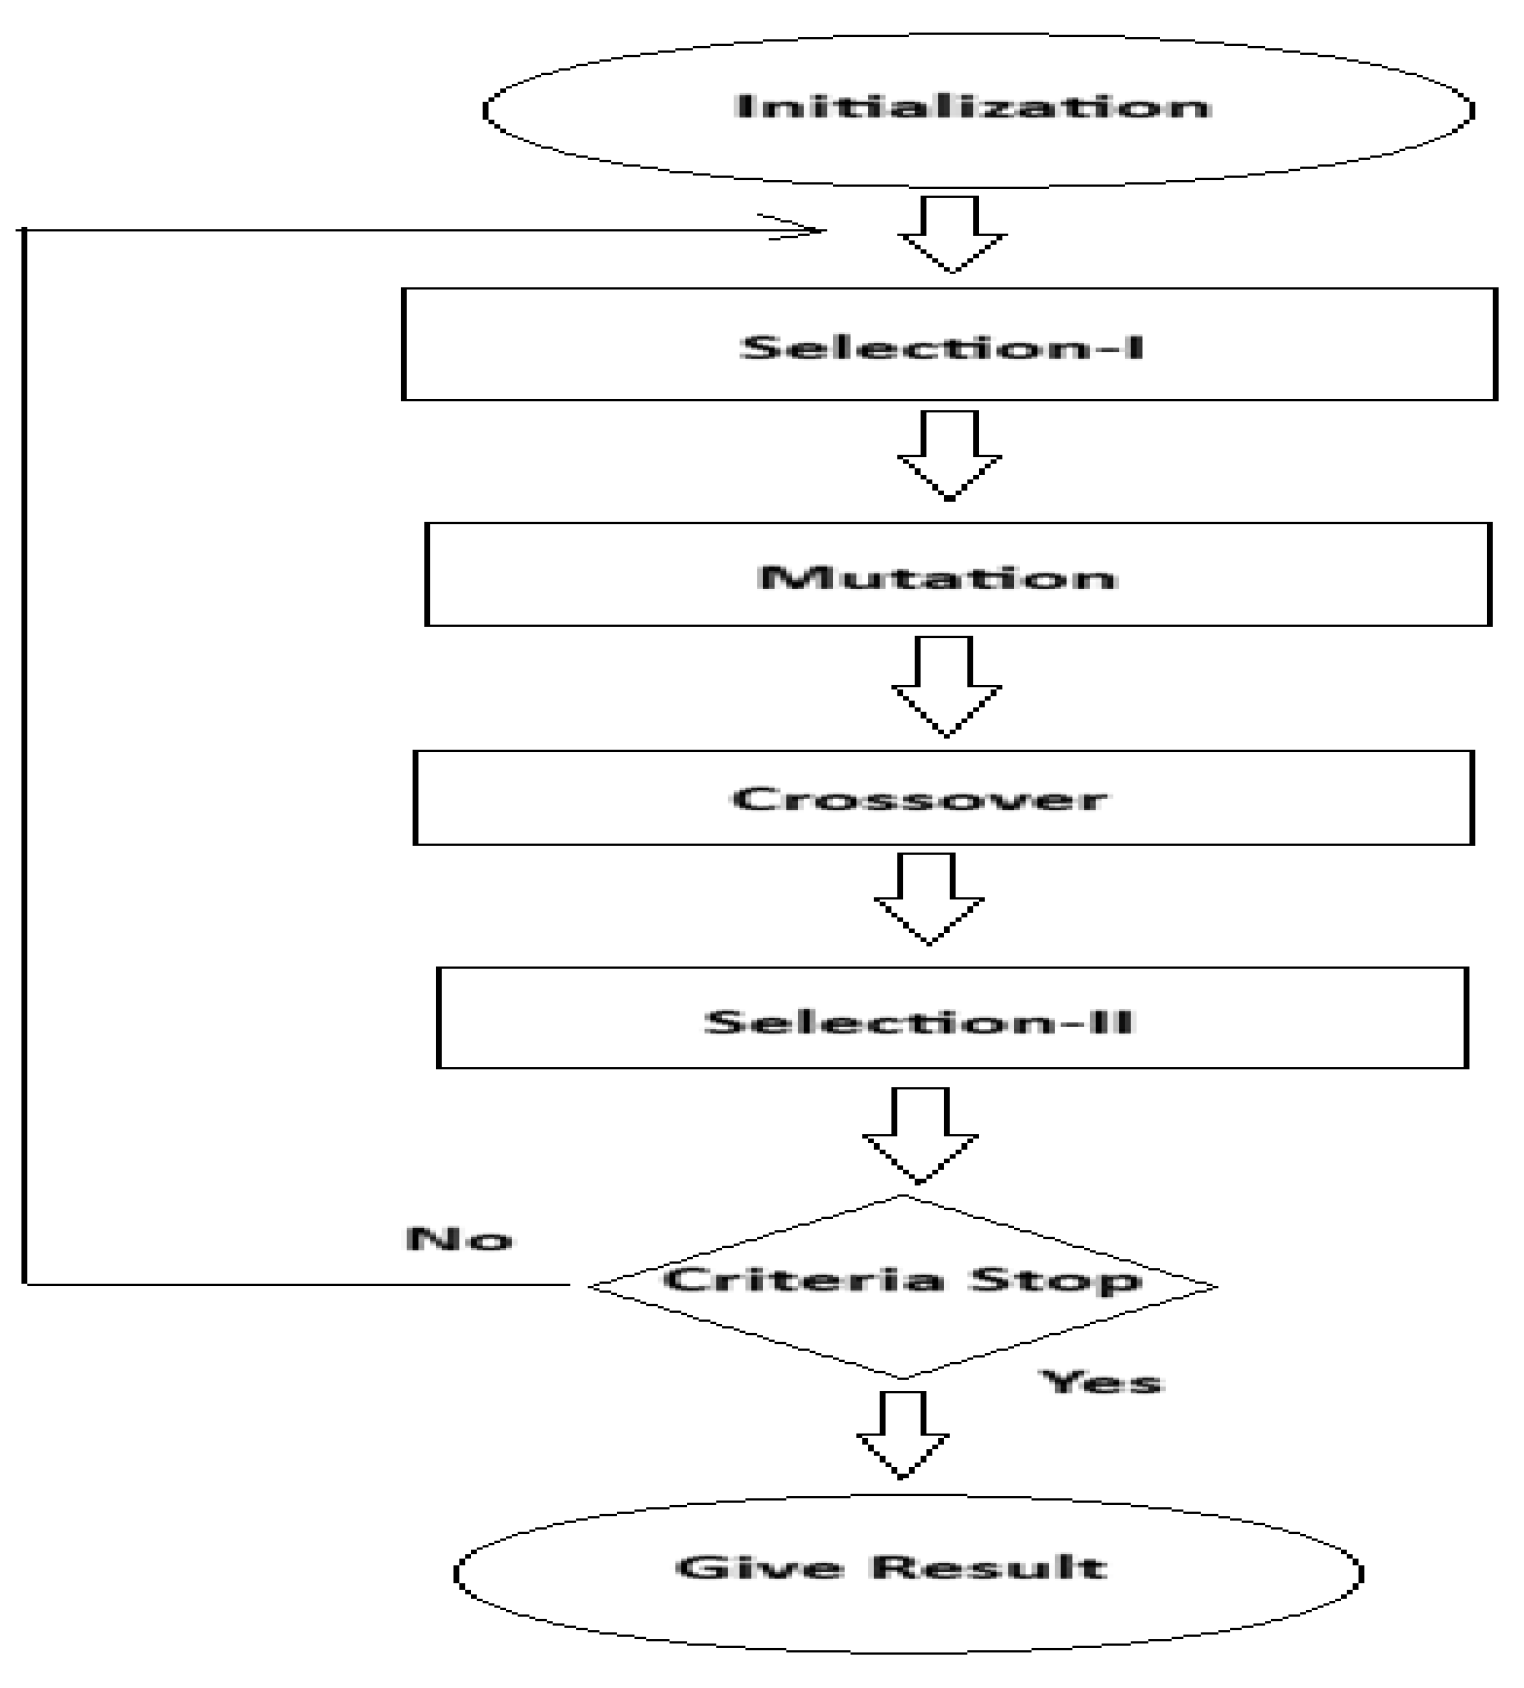
Figure 4.
A two-terminal HVDC transmission link schematic illustration for Case 3.
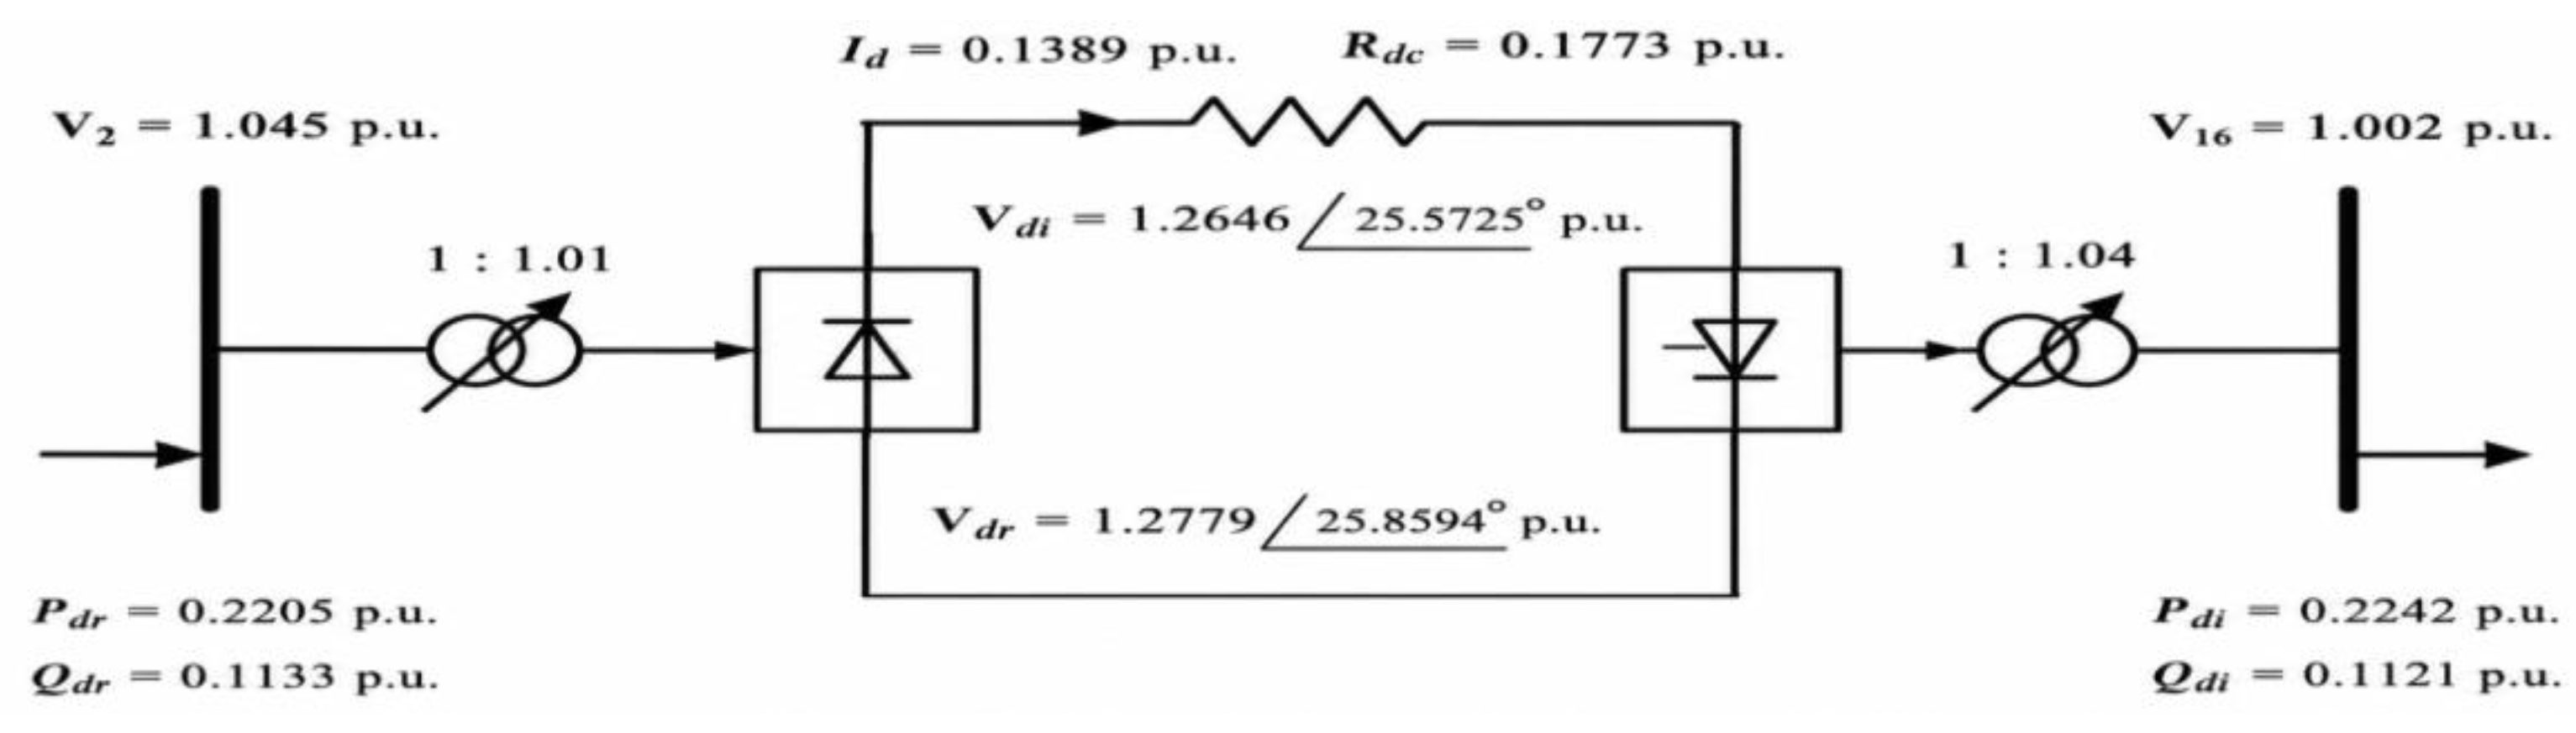
Figure 5.
Bus Voltage Profiles for All Cases at Nominal Load Using BSA.
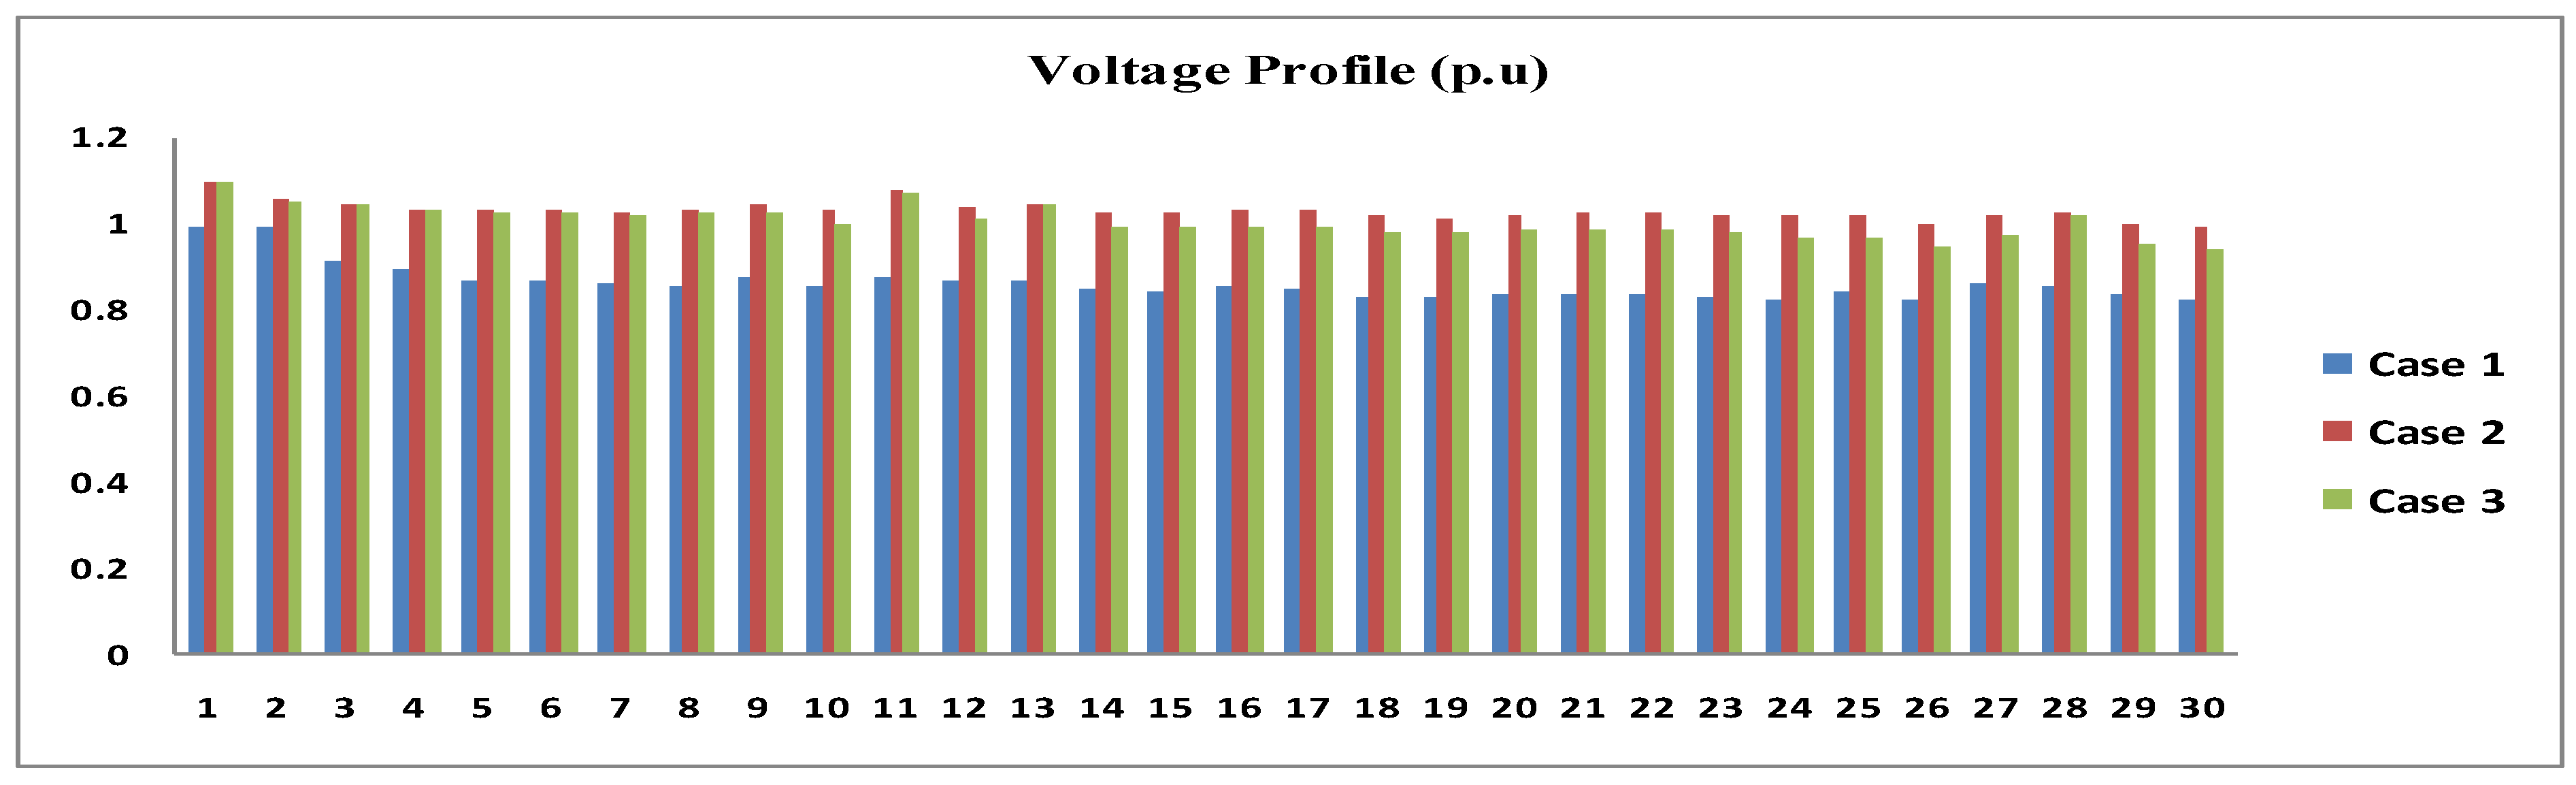
Figure 6.
Voltage Deviation at Nominal Load for All Cases Using BSA.
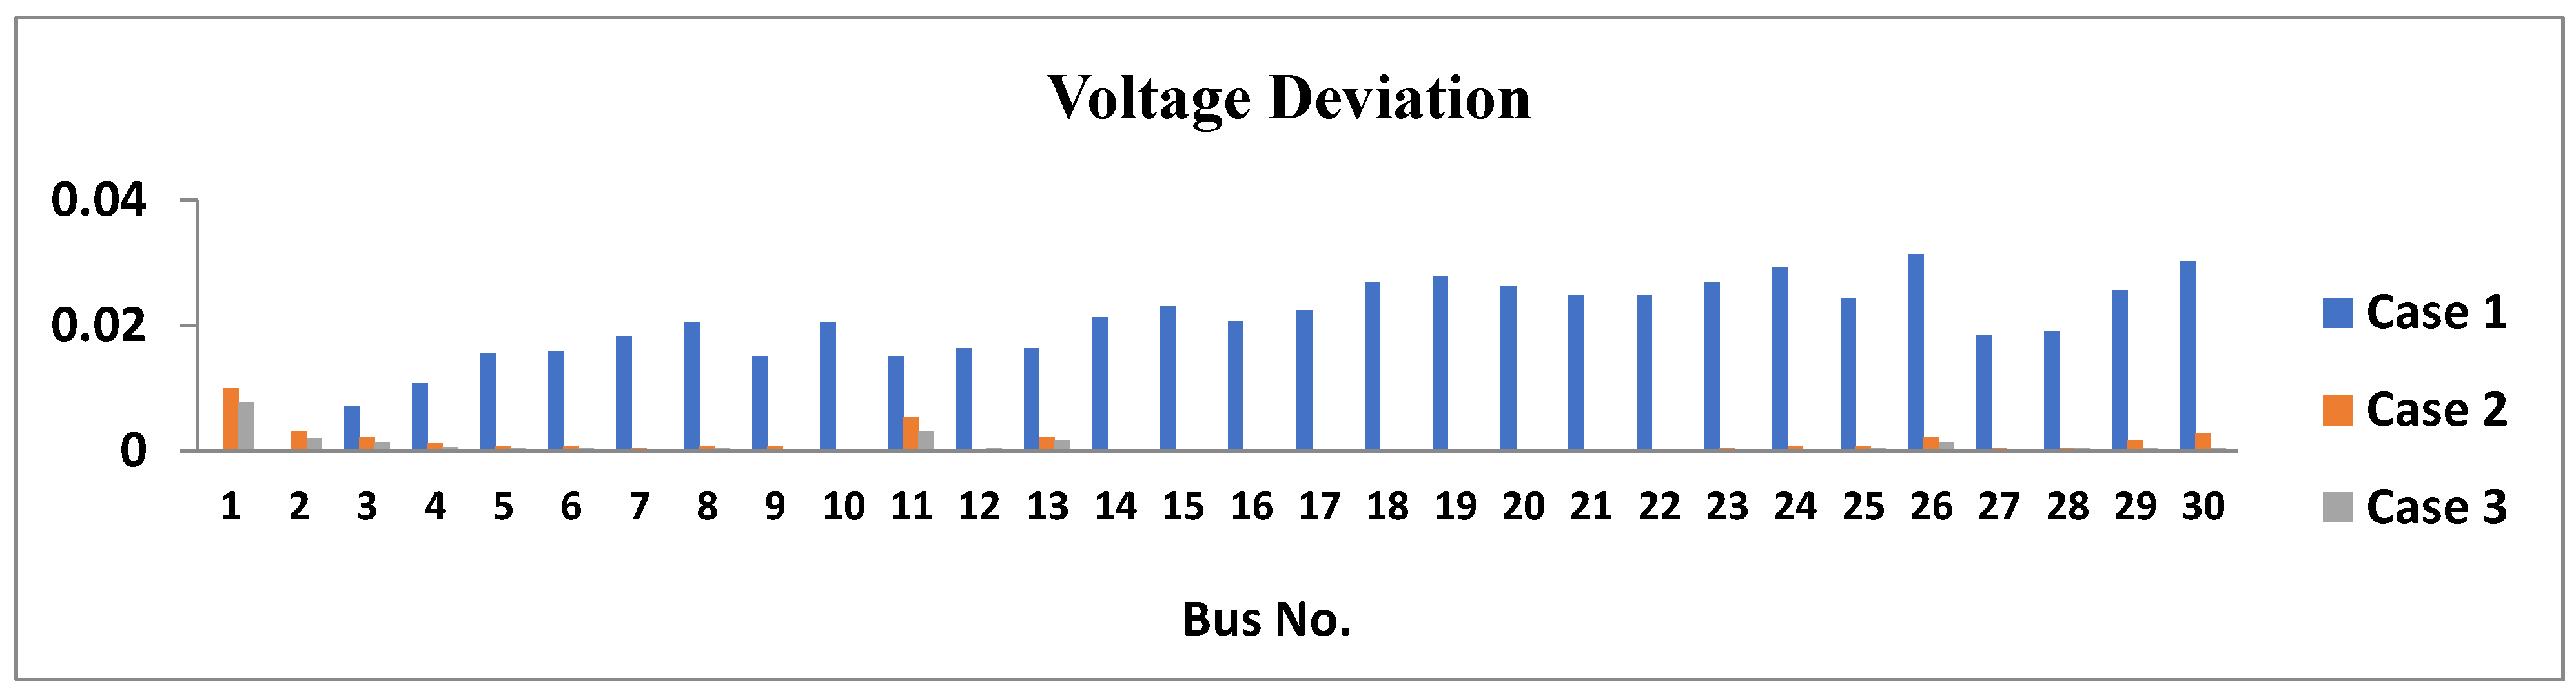
Table 1.
Results obtained by BSA of Light/ Heavy load for all cases.
| Limits | Case 1 | Case 2 | Case 3 | |||||
| Load level | Min | Max | Light | Heavy | Light | Heavy | Light | Heavy |
| Cost ($/h) | 536.08 | 589.60 | 464.50 | 529.55 | 452.44 | 500.30 | ||
| Ems (klb/MW) | 493.29 | 785.54 | 488.74 | 759.44 | 422.91 | 684.19 | ||
| SC size(loc) | 0 | 10 | - | - | - | - | 10(14) | 10(5) |
| SC size(loc) | 0 | 10 | - | - | - | - | 10(19) | 10(15) |
| SC size(loc) | 0 | 10 | - | - | - | - | 10(30) | 10(30) |
Table 2.
Comparative result by BSA and ABC of nominal load for all cases.
| Limits | Case 1 | Case 2 | Case 3 | ||||
| Min | Max | N-R | BSA | ABC | BSA | ABC | |
| Cost ($/h) | 597.26 | 488.36 | 488.83 | 475.76 | 477.53 | ||
| Ems (klb/MW) | 827.36 | 619.00 | 621.58 | 550.23 | 559.86 | ||
| VDI | 0.5953 | ||||||
| SC size(loc) | 0 | 10 | - | - | 10(14) | 10(20) | 10 (5) |
| SC size(loc) | 0 | 10 | - | - | 10(19) | 10(24) | 8.65(19) |
| SC size(loc) | 0 | 10 | - | - | 10(30) | 10(30) | 10 (30) |
Table 3.
Comparison of BSA and ABC Performance under Nominal Load Conditions.
| Metric | Case | BSA | ABC | Improvement of BSA over ABC |
Improvement of ABC over BSA |
| Cost | 2 | 488.36 | 488.83 | 0.0965% | -0.0966% |
| Cost | 3 | 475.76 | 477.53 | 0.3693% | -0.3707% |
| Emission | 2 | 619.00 | 621.58 | 0.4150% | -0.4168% |
| Emission | 3 | 550.23 | 559.86 | 1.7200% | -1.7501% |
Disclaimer/Publisher’s Note: The statements, opinions and data contained in all publications are solely those of the individual author(s) and contributor(s) and not of MDPI and/or the editor(s). MDPI and/or the editor(s) disclaim responsibility for any injury to people or property resulting from any ideas, methods, instructions or products referred to in the content. |
© 2026 by the authors. Licensee MDPI, Basel, Switzerland. This article is an open access article distributed under the terms and conditions of the Creative Commons Attribution (CC BY) license (http://creativecommons.org/licenses/by/4.0/).
Copyright: This open access article is published under a Creative Commons CC BY 4.0 license, which permit the free download, distribution, and reuse, provided that the author and preprint are cited in any reuse.