

Submitted:
01 October 2026
Posted:
06 October 2026
You are already at the latest version
Abstract
A novel biocomposite denoted Ns-AGS was synthesized from Alaeis guineensis Shells and nanosilica extracted from rice husk through a sol-gel method. The final product was applied in the adsorption of an azo dye namely Azocarmin G in synthetic aqueous solution. The characterization of the biocomposite by X-ray diffraction (XRD), Scanning Electron Microscopy, Fourier transform infrared spectroscopy (FTIR) and FTIR/TGA Analysis revealed an amorphous and porous microstructure with a random distribution of nanosilica particles in the lignocellulosic matrix evidencing several functional groups. The influence of contact time (0-120min), adsorbent dose (0.1-0.3g), initial dye concentration (25-100mg/L) and initial pH (3.5-6.5) were investigated at different temperatures (298°K, 316°K and 327°K). This study showed that adsorption of Azocarmin G onto Ns-AGS is favored by acidic pH values leading to more than 90% removal under optimal conditions of pH = 3.5; 60 min; 327°K for an adsorbent dose of 0.3g/25mL. The experimental kinetics data preferentially fitted the Hô model with a correlation coefficient R2 = 0.9992, indicating that adsorption is the determining step of the process illustrating adsorbate-adsorbent affinity. The equilibrium models demonstrated competitiveness, which may be related to the complex nature of the biocomposite. However, the Redlich-Paterson model, which combines Langmuir and Freundlich models, was more suitable at 327°K. The thermodynamic parameters demonstrated the spontaneity of the adsorption process (ΔG < 0) and the endothermic nature of the reaction (ΔH > 0). The low activation energy value (2.92 kJ/mol < 20 kJ/mol) calculated using the Arrhenius equation reflects a physical adsorption that would involve weak Van der Waals and hydrogen bond interactions which combined to Hô model evolved competitivity between chemical and physical processes.
Keywords:
biocomposite
; Alaeis guineensis shells
; nanosilica
; biosorption
; Azocarmin G
1. Introduction
Technological advances in recent decades have led to a significant increase in the quantity and diversity of pollutants present in the environment. Contaminated waters often result from mixtures of water and dyes during industrial processes and that turn into wastewater at the end of the production cycle. Such wastes contain various dyes, like anthraquinone dyes, triarylmethane dyes, azo dyes and so on.[1]. Aromatic dyes like Azocarmin G are not evident to eliminate naturally due to their complex aromatic structures which confers them physicochemical, thermal and optical stability [2]. It is largely reported that those dyes represent a major environmental concern on a global scale for their deleterious effects on the health of all living organisms, whether humans, animals or plants. This situation pours interest on the development of sustainable and innovative material for the treatment of wastewater [3,4]. Many technologies have been developed for the treatment of wastewater, including biological, chemical and physical methods such as chemical precipitation, solvent extraction, oxidation, reduction, electrowinning, ozonation, reverse osmosis, ion exchange, filtration and adsorption [5,6,7]. However, depending on the method used, these techniques are either expensive, energy-intensive, and generate large quantities of sludge or generate by-products that are sometimes more toxic than the initial pollutants [8,9,10,11,12]. Among these techniques, adsorption stands out as one of the most effective techniques for the removal of pollutants from wastewater. It is widely preferred due to its simplicity of implementation, convenience and ease of design of the corresponding devices [13]. Activated carbon remains the most commonly used adsorbent, but its production and regeneration costs remain high, which limits its profitability [14,15,16].
In response to the aforementioned challenges, research is increasingly turning to alternative adsorbents that are effective, inexpensive, abundant and derived from natural resources, including geomaterials such as clays, agro-industrial waste and lignocellulosic or starchy by-products. Biomass such as walnut or peanut shells, olive waste, sugarcane bagasse, banana and orange peels, tea leaves, corn cobs, as well as rice and wheat husks have demonstrated their effectiveness depending on the nature of the targeted pollutant [17,18,19]. Palm kernel shells, rich in lignocellulosic fibers, and rice husk, rich in amorphous silica, are particularly interesting biomasses given their local availability and cost-effectiveness. It is relevant to this research, on economic and environmental base, to investigate their potential synergy in a biocomposite. Then, this study explores, for the first time, the potential of a novel, eco-friendly biocomposite made up of nano-SiO2 and AGS in AG removal from water. Some processing parameters such as contact time, pH effect, adsorbent dosage, dye initial concentration, and temperature will be investigated in order to enlighten the adsorption equilibrium, kinetics, thermodynamic and mechanism of the process.
2. Materials and Methods
2.1. Synthesis of Ns-AGS
The adsorbent used in this work has been synthesized using two biomasses namely Palm kernel (Alaeis guineensis) shells (AGS) and rice husk (Oryza sativa). The biocomposite was prepared by in-situ hydroxylation and polymerization of sodium silicate in a slightly acidified water suspension containing acid leached AGS powder: A homogeneous suspension consisting of 10 g of AGS powder in 100 mL of acidified water solution with 50 mL of 30% H2SO4 was prepared and stirred at 27 °C for 1h. The acid hydrolysis allows a partial demineralization and biopolymer enrichment following a well-known method [20]. After filtration, the residue was mixed to the sodium silicate solution and the whole was kept stirring at a temperature of 27 °C for 60 minutes. The pH of the mixture is set between 3-4 to provoke the in-situ formation of silica gel by condensation of silicic acid. The gel is then left to stand for 48 hours for continue condensation. This gel is then recovered and dispersed in ethanol and after successive washing/centrifugation cycles until complete elimination of sulfate ions (BaCl2 test), the gelled residue is oven dried at 110 °C for 24 hours and the dry residue obtained was grounded in a porcelain moctar, sieved to complete passage through a 75µm mesh and denoted Ns-AGS. The final Product was investigated by XRD, FT-IR, TGA/FT-IR and MEB.
2.2. Preparation of Solutions
All chemicals were used as received without further purification. Azocarmin G was purchased from Sigma (99.9% pure) and used as received. 500 mL of 200 mg/L stock solution was prepared by dissolving 0.1 g of crystals in water. Solutions of desire concentrations were prepared by simple dilutions with the suitable quantities of water. The deep red color of the solution was stable in a large pH range. The chemical structure of Azocarmin G is shown in Figure 1. For pH adjustments, sodium hydroxide (NaOH, 97.0%) and hydrochloric acid (HCl, 96.0%) were sourced from FINAR.
2.3. Adsorption Experiments
The removal of Azocarmin G from synthetic water was performed through batch adsorption. For kinetics studies, the effect of contact time (ranging from 0 to 120 minutes) was studied considering 0.1g of adsorbent and 25 mL of 50 mg/L solution of pH = 3.5 at 27 °C; the temperatures values were 27 °C, 40 °C, and 55 °C. For equilibrium studies, the influence of initial concentration was performed for values ranging from 25 to 100 mg/L, 25 mL solution of the dye was mixed with 0.1g of adsorbent with an initial pH adjusted to 3.5 and stirred for 60 minutes for temperatures of 27 °C, 40 °C, and 55 °C. The influence of adsorbent dose ranging from 0.1 to 0.3g for a contact time of 60 min and temperature of 27 °C. For the influence of the initial pH of the solution, 50 mg/L dye solution was used for each test with pH values of 3.5; 5 and 6.5, mixtures stirred during 60 min at 27 °C.
At each turn, the adsorbent was separated from solution and the residual concentration of AG in the solution was determined by UV Vis spectrophotometry (Spectro Direct AQUALYTIC) at a maximum wavelength previously determined by drawing the absorbance spectrum of Azocarmin G in water.
Adsorption spectrum and maximum adsorption wavelength of Azocarmin G
From the stock solution, a 10 mg/L daughter solution was obtained after suitable dissolution to be used to measure absorbances A at wavelengths λ ranging from 190 to 800 nm using a JENWAY 6305 spectrophotometer and distilled water as reference solution. The plot of the curve A = f (λ) was used to determine the maximum absorption wavelength λmax. The absorbances A of a series of solutions with different concentrations C, ranging from 10 to 100 mg/L, were measured at the maximum wavelength λmax, and the results were used to plot the curve A = f (C).
The linear curve which equation can be written as Y = aX + b or X = (Y - b)/a where X is the residual concentration; Y is the absorbance; a is the slope of the line; b is the y-intercept, which represents the absorbance of the infinitely dilute solution (X = 0) corresponding to the reference solution (distilled water).
2.4. Theoretical and Mathematical Studies
The adsorption capacity at time t (Qt) and the removal yield (R (%)) were calculated using Equations (1) and (2) respectively. Duplicate experiments were carried out for all the operating variables studied and only the average values were taken into consideration.
where C0 and Ct are the initial and time t (min dye concentrations (mg/L), respectively. V is the volume of solution (L), m the adsorbent mass(g). Q0 and Qt are amount of AG at initial time and adsorbed at time t.
The controlling mechanism was investigated by modelling the experimental data using three different kinetics models (Lagergreen, Hô and Weber-Morris models) commonly used in the adsorption of dyes [21,22,23,24]. The activation energy (Ea in kJ/mol) was calculated through Arrhenius equation given in Equation (3). The logarithmic form of the latter is given by Equation (4) where Ea is calculated from the slope of the line.
where k2 is the Hô model rate constant, A is the pre-exponential factor, R (J.K-1.mol-1) the gas constant, and T (°K) is the operating temperature.
Four well-known models, the Langmuir, Freundlich, Dubinin-kaganer-Radushkevic and Redlich-Peterson isotherms, were selected to explain interactions. The data obtained will provide a better understanding of the adsorption mechanism and its characteristics.
All the kinetics and equilibrium models adopted in this work and their parameters are presented in Table 1
k1 (min-1), k2 (g/mg min) and kid (mg/gmin0.5) are the kinetic rate constants of the Lagergreen , Hô and Weber Morris models respectively, t (min) is the time; Qe and Qt (mg/g) represent the amounts adsorbed at equilibrium and at time t respectively. γ (mg/g) is associated to the boundary thickness. KF is the constant reflecting the measurement of the capacity of adsorption, and n the empirical parameter representing the energetic heterogeneity of the adsorption sites (dimensionless) and reflecting the affinity of the adsorbate for the adsorbent; Ce the concentration of dye at equilibrium. KL, Langmuir constant (L.mg-1) corresponding to and β coefficient between 0 and 1. Qm is the maximum sorption capacity, βDKR is the activity coefficient related to the mean sorption energy, and ε is the Polanyi potential. R is the gas constant (kJ/kmol). The slope of the plot of lnQe versus ε2 allows the calculation of βDKR (mol2/J2). Finally, the value of the adsorption energy, E, can be obtained using Equation (5).
Thermodynamics of the adsorption of AG onto Ns-AGS surface have been investigated by calculating the change in free energy (ΔG°), enthalpy (ΔH°), and entropy (ΔS°) Equations (6) and (7). The free energy change was calculated using the following relationship.
where R (8.314 J/(mol K)) is the ideal gas constant and T (°K) is temperature.
∆G = −RTlnKd
The equilibrium constant (Kd) is temperature dependency and can be used to forecast thermodynamic characteristics of the adsorption process. It is not dimensionless but offers insights into the spontaneity of the process.
The plot of lnKd against gives a straight line from which ΔH and ΔS can be calculated from the slope and the intercept respectively.
3. Results
3.1. Characteristics of the Raw Materials (RHA and AGS)
The X-ray patterns of AGS and RHA are presented on Figure 2a. Both spectra are dominated by a broad diffuse band centered around 2θ = 22.5°, characteristic feature of an amorphous structure evidencing a lack of long-range order in the materials [25,26]. However, AGS X-ray patterns exhibits a less intense dome, which would reflect a lower content of amorphous component compared to that of RHA. A peak is revealed at 2θ = 26.84° and is attributed to a residual crystalline phase, probably due to the presence of mineral impurities such as quartz.
The FTIR spectra of RHA and AGS are presented in Figure 2b. That of RHA highlights bands in the region of 700-1100 cm-1 mainly attributed to Si-O groups showing that it is an interesting source of silica. For instance, the bands at 1060 cm-1 and 788 cm-1 correspond to the symmetric and antisymmetric vibrations of the Si–O bond respectively. The band around 500 cm-1 is attributed to the absorption band of the Si-O-Si bond vibration. The spectrum of AGS shows characteristic bands especially those observed near 1630 cm-l to 1450 cm-l which correspond to the fingerprint region of C=O, C-O bonded to cellulose/hemicellulose. In addition, a band of C=H stretching vibrations related to the aromatic cycle of biopolymers is revealed.
3.2. Characteristics of the Hydrid-Biocomposite Ns-AGS
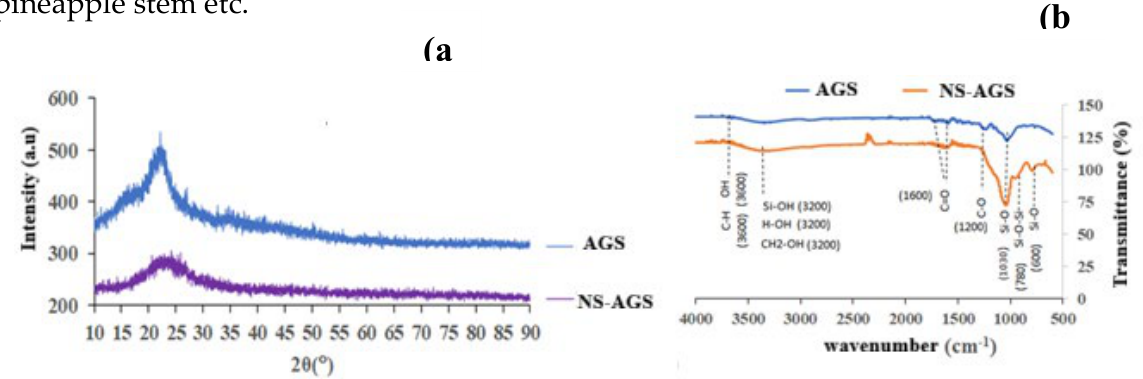
Figure (3) shows a comparative study of the XRD patterns and FTIR spectra of AGS and the biocomposite Ns-AGS. In both cases, no well-built XRD peaks are exhibited, evidencing an amorphous or partially organized system in the biocomposite. Also, the Ns-AGS structure is disordered and this is demonstrated by the presence of a dome which demonstrates the amorphous nature of the synthesized product and therefore a significant reactivity. However, it is clearly observed that the dome of the biocomposite is larger and more rounded reflecting an accumulated amorphous phase which would be due to the silica formed in-situ. This explanation corroborates the remarks referenced on the FTIR spectrum of the biocomposite which exhibits broader bands in the area of the Si-O groups.
The FTIR spectra of AGS and Ns-AGS are similar in their general appearance. However, they present some particularities, particularly in the intensities of the bands. Indeed, the absorption bands concentrated around 800-1100 cm-1 relating to the Si-O and Si-O-Si groups [26] are more intense on the spectrum of the Ns-AGS biocomposite compared to that AGS: This difference is directly linked to an increase in the concentration of these Si-O groups in the biocomposite. This is well explained by the formation of silica in situ by polycondensation of silicic acid. Similarly, there is a slight increase in the intensity of the bands of the C-O groups which would be due to the formation of C-O-Si bonds resulting from a condensation reaction between the alcohol functions -CH2OH of cellulose and silanol (SiOH) of silicic acid. This bond will be explained in a mechanism presented later. The results generally agree with those of other agricultural by-products such as cashew nut shell, jute fiber, corn stalk, pineapple stem etc.
Figure 3.
Comparative X-ray patterns (a) and FTIR spectra (b) of AGS and the Biocomposite (Ns-AGS).
3.3. TGA-FTIR Analysis and Gram-Schmidt Method
The degradation of several polymeric or copolymer and additives systems was investigated by Thermogravimetric Analysis hyphenated to Fourier transform infrared spectroscopy (TGA/FTIR) [27,28,29,30]. The so-called technique has been used in this work to probe the thermal degradation of NS-AGS. The thermogram (a), the Gram-Schmidt graphs (b and c) and the FTIR spectra of the evolved gases at 47 min (d) and 83 min (e) are illustrated in Figure 4. The evolution of mass loss as well as gases evolved at distinct temperatures intervals are summarized in Table 2. The Gram-Schmidt curve revealed four thermal events, at 5min, 41 min, 43min and around 105min denoted (1), (2), (3) and (4) respectively. Only the ones at 41 min and 43min are well defined. The evolved gases, detected by FT-IR namely N2O (1250-1300 cm-1), H2O (1600 cm-1 and 3500 cm-1), CH3OH (1000-1100 cm-1), CO2 (2200-2400 cm-1), CH4(3000 cm-1)) and CO (1750 cm-1). They are mainly related to water adsorbed, structural water and organic compounds in the biocomposite.
3.4. SEM Analysis
Scanning electron macroscopy (SEM) was carried out to assess to provide more insights in adsorbent’s surface morphology, porosity and chemical composition. Figure 5 presents the SEM micrographs of AGS (a) and NS-AGS biocomposite (b). As organic based materials, the two structures exhibit a homogeneous carbonaceous matrix where the particles are grouped into homogeneously organized agglomerates, revealing interparticle spaces. The image of AGS shows a group of irregular, coarse particles with numerous spherical or hemispherical protrusions. The background shows a smoother surface with fine cracks or striations, indicating an organic matter. The micrograph of Ns-AGS shows a more homogeneous and compact appearance compared to that of AGS. It also suggests that the material is brittle or porous, and the spherical bumps that might be related to the presence of in-situ formed silica which occupying the interstices and some pores. These microstructures which does not present any particular order at long distance, reflect their amorphicity and evidence internal spaces that can be interpreted significant porosity. Such a porous structuring is particularly advantageous for particle trapping applications, especially in adsorption.
3.5. Mechanistic Modelling of the Formation of NS-AGS Biocomposite
Considering, on one hand, that the palm kernel shell powder (AGS) is mainly made up of cellulose, hemicellulose, and lignin as majors organic co-components, and on the other hand, the similar functionnal groups revealed by FTIR data, the complex mechanism of the formation of the silica-based biocomposite from its biopolymers could be described according in three main steps, namely: 1)Formation of silicic acid from sodium silicate solution: In the usual protocol for silica synthesis from biomasses such as rice husks, prototonation of the silicate solution at a pH between 2-3 causes the formation of silicic acid and subsequent polycondensation of the latter into nanosilica. 2) Hydrolysis of the biopolymer: Indeed, acid hydrolysis catalyzes the breaking of glycosidic bonds, releasing simple oligomers. The latter are lighter and more accessible during potential reactions with the silicic acid formed in step 1) 3) condensation between the hydroxyl groups (-OH) of the hydrolyzed biopolymer and the silanol groups (-Si-OH) of the silicic acid to form a “trapped” silica. It is also possible that free nanosilica is formed in the reaction medium by polycondensation between Si(OH)4 molecules to form reactive silica. Given the similarity between the main functional groups of cellulose, hemicellulose, and lignin, the interactions between these functions and the silanol groups will be similar. Therefore, the mechanism suggested in Figure 6 is modelled on the basis of cellulose. The oligomers thus obtained by acid hydrolysis of cellulose react with protonated silicate in an acid medium following a condensation reaction.
3.6. Characterization of the Biocomposite After Adsorption
The XRD patterns of the biocomposite (Ns-AGS) and that of the AG loaded-NS-AGS (NS-AGS-AG) shown in Figure 7a have a similar appearance, and are both dominated by the centered dome 2θ=22°. This is explained by the fact that the biocomposite is an amorphous material as well as Azocarmin G. A peak observed at 2θ=50° or d=3.98 Å appeared and would correspond to quartz, constituting a circumstantial impurity, hence its absence in the Ns-AGS patterns.
The FTIR spectra of the composite alone (NS-AGS) and the AG loaded-NS-AGS (Figure 7b) show that the vibrational bands around 1100-1000 cm-l (C-O, Si-O) have not changed because these functions are absent on azocarmin G. The bands observed around 1050 cm-l and 3400 cm-l might correspond to S=O- and N-H respectively, characteristic of the functions of Azocarmin G. On one hand, new bands related to those S=O- and N-H groups on the NS-AGS-AG spectra are expected. Their absence might be due to the fact that the vibration frequencies of these groups overlap with the related bands of the composite, namely the Si-O and C=O and OH groups. On the other hand, the potential increase in the intensities of the so-called bands which was expected from the cumulative effect of the vibrations is very lightly observed due to small quantities of Azocarmin G adsorbed, to some attenuating effects during the adsorption process or also to steric hindrance of the aromatic nuclei of Azocamin G.
Adsorption Characteristics
- Determination of the pH at the Zero Point Charge of NS-AGS
The plot of ΔpH versus initial pH pHi is shown in Figure 8, its intersection with the x-axis indicating the pH value at the zero charge point (pHZPC), i.e., the pH at which the surface charge of the adsorbent is electrically null. This value is approximately 6.7.
Below this pH, the surface charge of the adsorbent is positively charged (favorable for the adsorption of anions) and above, the surface charge tends to be negatively charged (favorable for the adsorption of cations). Indeed, when the pH is lower than pHZPC, the oxygenated surface sites of the adsorbent are protonated is positively charged. On the other hand, for a pH higher, the surface of the adsorbent is negatively charged. These statements are described by the following chemical equations [31]:
A pH ≤ 6,7 S-OH + H3O+ → S-OH2+ + H2O
A pH = 6,7 S-OH2+ → S-OH + H+
A pH ≥ 6,7 S-OH + OH- → S-O- + H2O
S stands for the surface of the biosorbent
The Azocarmin molecules dissociate in solution, and organic ions (negatively charged) appear.
This dissociation is represented by the following equilibrium:
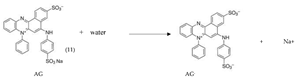
The adsorbate (Azocarmin G) and the adsorbent (NS-AGS) are electricaly charged and depending on the pH of the medium, the first interactions between these two entities are likely to be governed by electrostatic forces. Thus, the pH of the solution plays a determining role in the adsorption mechanism, influencing the speciation of the adsorbate (ionic form) as well as the surface charge of the adsorbent.
- Influence of Contact Time and Temperature
Figure 9a represents the absorption capacity Qt as a function of time at different temperatures. The results show that fixation of AG ions onto Ns-AGS biocomposite consists of two distinct phases: one rapid and the other progressive until saturation of the sites, where steady state is reached. Indeed, the three curves for the three temperatures follow a similar trend, first a curvature reflecting a rapid increase in adsorption capacity in the first 20 minutes, followed by a slow increase until reaching equilibrium at 12.34 mg/L for 327°K, 11.14 mg/g for 312°K, and 10.64 mg/g for 298°K. This maximum value increasing with temperature. The rapid increase in adsorption capacity in the first few minutes is due to the availability of free adsorption sites on the bioadsorbent surface. These sites gradually saturate until they reach equilibrium [32].
- Influence of the initial concentration of the solution
The plot of the absorption capacity Qe as a function of the initial concentration Co of the AG solution is given in Figure 9b below. For the different temperatures studied, the absorption capacity increases progressively with the concentration, where for the concentration of 100 mg/L, the adsorbed quantity reaches 18.54 mg/g for 298°K; 20.04 mg/g for 312°K and 21.29 mg/g for 327°K. This result therefore shows that the adsorption capacity increases for high dye concentrations. This could be explained by the fact that as the concentration increases, the diffusion of adsorbates towards the active sites of the biocomposite is greater, thus promoting interactions. A similar result is observed for the adsorption of methylene blue by corn stem parenchymal tissue with embedded vascular bundles [33].
- Influence of the adsorbent dose
Figure 9c illustrates the effect of adsorbent dosage on the adsorption capacity Qe and the removal percentage %R of AG by NS-AGS. When the adsorbent dose increases from 0.05 g to 0.3 g per 25mL solution, a significant decrease in Qe is observed, from approximately 18.19 mg/g to 4.09 mg/g, and the removal percentage %R gradually increases, reaching 98.35% at the maximum dose of 0.3 g/25mL. On one hand, the observed increase in %R is due to the multiplication of active adsorption sites, which increasing amount of adsorbent. On the other hand, for the same pollutant concentration, as the adsorbent dose increases, the amount of pollutant adsorbed per unit mass of NS-AGS decreases. Similar behavior has been reported for the adsorption of dyes on different adsorbents such as papaya seeds, pineapple stem, pumpkin seed shell etc. [34,35].
- Influence of Initial Solution pH
The influence of initial solution pH on adsorption is shown in Figure 9d. At pH below 6, the removal rate is high, reaching over 90%. Thus, ion adsorption is affected by the initial solution pH, confirming the hypotheses stated above. Indeed, for a pHi ≥ pHPZC (6.7), the surface of NS-AGS is negatively charged, leading to repulsive interactions between the biocomposite and the AG anions in solution, hence the decrease in the adsorption percentage to less than 50%. Revesersly, there are attractive electrostatic interactions between the positively charged surface of the adsorbent and the AG anions of for pHi ≤ 6.7, explaining the increase in the adsorption percentage [36]. The adsorption of AG onto Ns-AGS is therefore better in acidic medium than in basic medium. The pH of 3.5 is retained as the optimum pH for the adsorption of AG onto NS-AGS since at this pH value, the elimination rate is close to 100%.
- Study of the fitting of the kinetic models
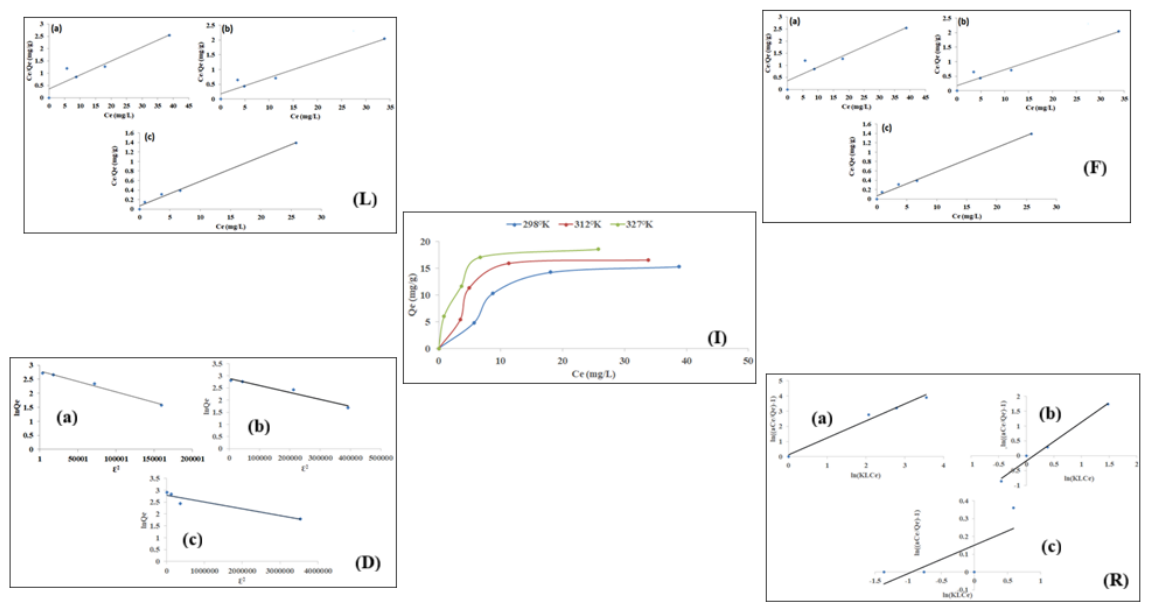
Linear regression modeling of the experimental data using Lagergreen, Hô, and Weber Morris kinetic models at 298°K, 312°K, and 327°K was performed to better understand the adsorption kinetic mechanism. The data are then presented in Figure 10.
For a better interpretation of the kinetic model from the experimental data, the kinetic constants k1, k2 and k3 as well as the regression coefficients R2corresponding to Lagergreen, Hô and Weber Morris respectively are calculated from plots and recorded in Table 3.
From these results, it appears that the R2 values of the Hô model are higher and are all of the order of unity, i.e., 0.991; 0.9985 and 0.9992 at 298°K; 312°K and 327°K respectively. These findings lead to the conclusion that the adsorption process fitted well Hô model and that adsorption is the determining step of the process. Similar results were found by Hellal et al., Vučurović et al., for the adsorption of AG and methylene blue respectively [33,37]. Regardless of the model, the rate constants increase with temperature, corroborating the fact that increasing temperature is favorable for the process and also makes it faster.
Activation Energy
Considering k2 at 298°K, 312°K, and 327°K, the plot of lnk=f(1/T) shown in Figure 11, was used to determine the activation energy Ea and the pre-exponential constant A using the Arrhenius Equation.
The value of the pre-exponential constant A and that of activation energy Ea were found to be 0.05 and 2.92 kJ/mol respectively. Several authors have reported in similar studies that activation energies lower or equal to 20 kJ/mol are quite low and correspond to a physical process. suggesting weak hydrogen bond and Wan der Waals interactions in some cases [38,39]
- Study of equilibrium models
Figure 12 exhibits that at each temperature, the amount of adsorbed Azocarmin G Qe increases with equilibrium concentration Ce and with temperature following a two-slope evolution. The first slope reflects rapid adsorption, while the second reflects slower adsorption that tends to steady step with Qe values of 15.30, 16.50, and 18.55 mg/g, respectively, for 298°K, 312°K, and 327°K. It is also observed that equilibrium is quickly reached as the temperature increases. The equilibrium might be due to the saturation of the sites accommodating Azocamin G. On the one hand, when the temperature increases, the kinetic energy of the particles increases, allowing a greater frequency of collision between the adsorbate and adsorbent molecules [39,40,41,42]. On the other hand, higher heat could lead to the activation of new sites on the adsorbent surface, hence the observed increase in Qe with temperature. These results show that the adsorption process of Azocamin G on the biocomposite might endothermic. However, this conclusion still to be demonstrated using thermodynamic data. Linear regression modeling of the experimental equilibrium data using the Langmuir, Freundlich, Dubinin-Radushkevitch, and Redlich-Paterson models at 298°K, 312°K, and 327°K was performed to better understand the adsorption mechanism. The data are shown in Figure 11 (L-R), and the related constants are listed in Table 4.
Langmuir and Freundlich isotherms, widely used in dye adsorption, were compared with experimental equilibrium data. Some complementary isotherms, precisely Dubinin-Kagamer-Raduskevich and Redlich-Peterson isotherms, were used to fill in the gaps related to the first two, which generally have an empirical tendency.
For Langmuir isotherm, the KL constants increase with temperature, reflecting an increasing affinity between the interacting species. This would also explain the larger values of the adsorption capacity Qm ranging from 17.68 to 19.46 mg/g for temperatures ranging from 298 to 327°K. Indeed, RL is an essential characteristic of the Langmuir model, which proves here that the AG adsorption process on the biocomposite is favorable for the Langmuir model, although it could be less favorable in certain concentration ranges. The RL values, all between 0 and 1, are in accordance with Langmuir predictions and reflect a high affinity. Furthermore, Langmuir gave a better fit compared to other models and this was demonstrated by its highest correlation coefficient (0.992) at 327°K. This implies that adsorption occur in a single layer of molecules on the adsorbent surface and that the adsorbed molecules would not interact with each other and with neighboring sites significantly. Similar results were observed in the study of adsorption of Basic Red dye on sawdust [43]. However, the KL constants and adsorption capacities following this mechanism remain low.
For the Freundlich isotherm, there is an increase in KF constants with temperature, reflecting a greater capacity of the biocomposite to bind AG as the temperature increases. Furthermore, the observed 1/n values explain the non-linearity of the relationship between the amount of AG adsorbed Qe and its equilibrium concentration Ce. Furthermore, the 1/n values are between 0 and 1 and meet the expectations of the model. However, the Freundlich model poses limitations for a complete understanding of the process; for example, it does not provide the maximum adsorption capacity. The Dubinin-Kagamer-Radushkevitch (KDR) constants are low and support the hypothesis that the interactions between the AG and the biocomposite occur much more on external sites and the tendency to diffuse preferentially and previously into the micropores of the adsorbent is unlikely. The KDR values were used to determine the average adsorption energies E at each temperature. It can be concluded from the low values of E (0,267; 0.408 and 1.293 kJ/mol) that the process tends towards physical adsorption involving weak interactions. The constants of the Redlich-Peterson isotherm are and combine those of Langmuir and Freundlich. As the temperature increases, the isotherm tends towards that of Freundlich. The value of β at 327°K is more consistent (between 0 and 1) and clearly demonstrates this hypothesis.
Indeed, the affinity of the adsorption of AG with a given isotherm depends on the fixed temperature. For example, at 298°K, the Dubinin-Kagamer-Radushkevitch and Redlich-Peterson models seem to be more favourable with respective correlation coefficients of 0.991 and 0.981 compared to 0.882 for Langmuir and 0.761 for Freundlich. This suggests at this temperature weak interactions of the Van Der Waals type and a tendency to diffuse in the micropores of the biocomposite. When the temperature increases (312°K and 327°K), the Dubinin-Kagamer-Radushkevitch isotherm sees its correlation coefficient decreasing to 0.898 and also a lower KDR constant. This shows that the interactions at these temperatures take place mostly on the surface of the biocomposite. The nuances in fitting equilibrium models might also lie in the complexity of the adsorbent material: The biocomposite is a material based on an inorganic component, silica, which can be functionalized, and an organic part due to the use of biomass; the biocomposite has on its surface functional groups such as hydroxides (-OH), carbonyls (-C=0), carboxyls (-COOH), epoxides (-C-O-C) [44] due to the presence of substances such as proteins, fats, sugar, lignin, cellulose and its derivatives [45]. These groups have non-bonding electrons that could interact with the specific sites of Azocarmin G. In addition to these interactions which generally occur on the surface on the external sites, there is, especially at low temperature, diffusion towards the internal sites followed by weak interactions like hydrogen bonds and Van Der Waals interactions.
- Study of thermodynamics parameters
The thermodynamic parameters were determined by plotting ln(KF) = f(1/T) using Freundlich equilibrium constants KF at different temperatures (298°K, 312°K, and 327°K) was used (Figure 13). The resulting straight line and the Gibbs equation permit to determine the values of free energy ΔG, and to deduce the enthalpy ΔH and entropy ΔS from the slope and the y-intercept, respectively.
Figure 12.
Plot of lnKF= f(1/T).
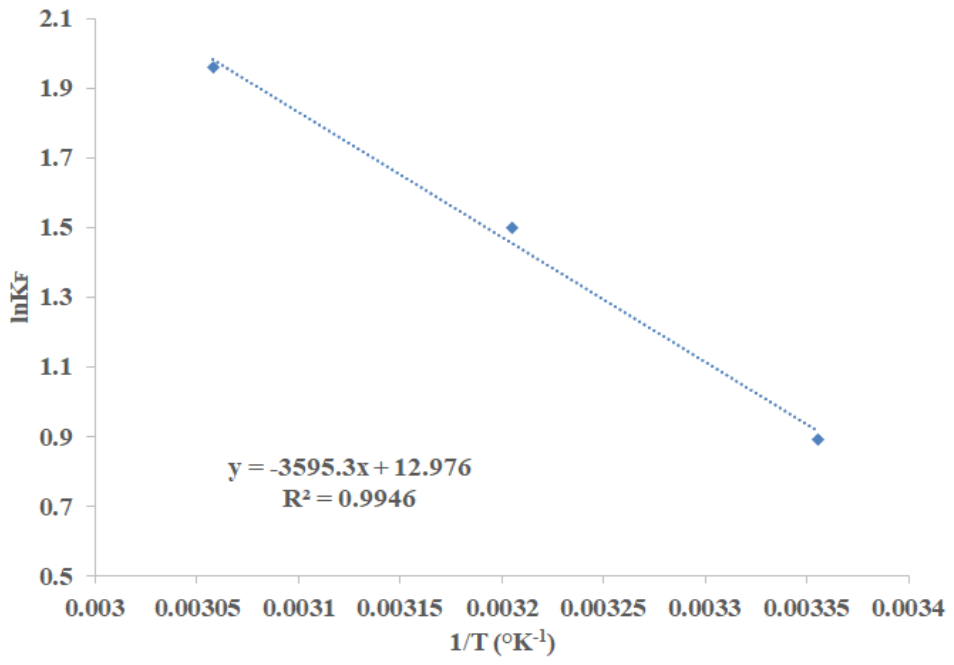
The Gibbs free energy ∆G of AG adsorption on Ns-PKS decreased from -2202.871 to -5324.651 kJ/mol with the increase of temperature from 298°K to 327°K. This indicates that the AG adsorption process on the biocomposite is spontaneous even at low temperature and is more so when the temperature increases. The ∆H value of 29.891 kJ/mol, this positive value means that the adsorption process is endothermic and therefore an increase of temperature of the system may favorable to the process. It also seen that ∆S is equal to 107.882 J/mol.K. This positive value could be due on the one hand to the increasing disorder in the system at the Adsorbent-solution interface and on the other hand to the redistribution of energy between the AG ions and the adsorbent [42].

Table 5.
Thermodynamics Constants of the adsorption of AG onto Ns-AGS.
| Temperature (°K) | ΔG (kJ/mol) |
ΔH (KJ/mol) |
ΔS (J/mol.K) |
|---|---|---|---|
| 298 | -2202.871 | 29,891 | 107,1882 |
| 312 | -3887.078 | ||
| 327 | -5324.651 |
Suggested mechanism of the adsorption of AG onto Ns-AGS.
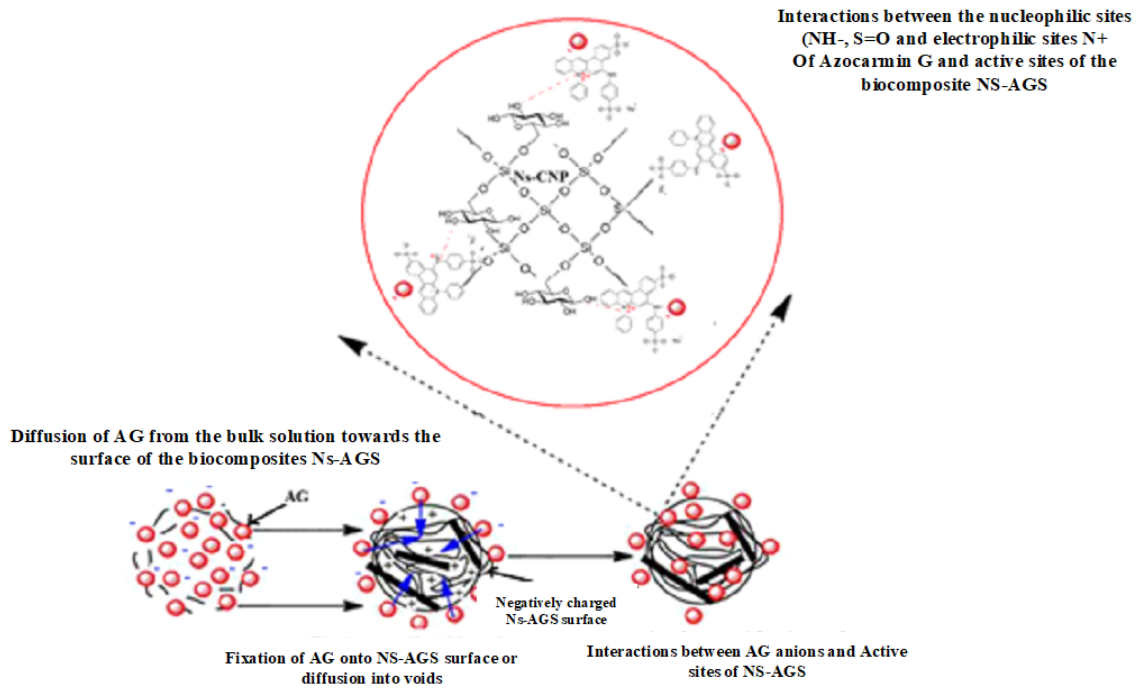
Experimental data from the kinetic studies of Azocamin G adsorption on Ns-AGS composite align well with the Hô model, indicating that adsorption is the rate-determining step of the adsorption process. The mechanism could be described by two steps: firstly, the negatively charged AG- ions migrate from the bulk solution to the negatively charged surface (pH < 6.5 = pHzpc) of the biocomposite under the effect of attractive electrical forces and concentration. Secondly, the AG- ions attach directly to the surface through interactions between the nucleophilic sites of the AG and the surface functional groups of the biocomposite. The fixation of dye molecules occurs through interactions between the nucleophilic sites (NH-, S=O-...) of the dye and the electrophilic sites of the adsorbent. This mechanism is illustrated in Figure 13. A similar mechanism for the adsorption of heavy metals on a biocomposite was described by Njimou et al.[46,47]. Moreover, washing the adsorbent with pure water after adsorption desorbed almost all of the adsorbate, which confirms the idea of weak interactions in the majority. Nevertheless, some competitive chemical interactions are possible.
Figure 13.
Suggested mechanism of Azocamin G adsorption onto Ns-AGS biocomposite.
4. Conclusion
The aim of this study was to synthesize a biocomposite based on palm kernel shells (AGS) and nanosilica for its application in Azocarmin G (Acid red 101) remediation from water. The microstructural characterization of the obtained composite (NS-AGS), shows an amorphous and porous structure with a distribution of amorphous silica in the carbonaceous organic matrix. The parameters influencing the adsorption process, such as contact time, adsorbent dose, dye concentration and pH of the medium were investigated and the experimental data obtained were compared with different kinetic and equilibrium models. The Ho model fitted well the kinetics data and the Redlich-Paterson model for equilibrium. The thermodynamic parameters demonstrated that the adsorption of AG onto NS-AGS was spontaneous and endothermic process. The removal efficiency under optimal conditions is greater than 90%. This suggests that the NS-AGS biocomposite is effective for the adsorption of Azocarmin G in aqueous solution and probably for other similar dyes. In addition, the biocomposite used in this study proved efficient adsorption with a relatively short contact time. The composite is therefore promising in terms of economic viability because it is derived from readily available and inexpensive biomaterials. Water pollution is one of the major concerns in terms of the environment and therefore quality of life. It is therefore interesting to further characterize the biocomposite in order to further explore its behavior with other dyes and even heavy metals. In summary, the Ns-AGS biocomposite is presented as a simple and sustainable synthesis mode bioderived, porous and functionalized material, suitable for high added value environmental applications.
Author Contributions
Investigation, Roles/Writing - original draft, Data curation, Jean Marie Kepdieu.; methodology; writing - review & editing, visualization: validation; supervision, Njiomou Djangang Chantale.; conceptualization, investigation, Marie Joseph Onana Amougou.; writing - review & editing, Sofia Faina, Paolo Valagussa, and Tatiana Rodriguez-Flores.
Funding
This work was carried out with the aid of a grant from UNESCO-TWAS financed by the German Federal Ministry of Education and Research (BMBF). The views expressed herein do not necessarily represent those of UNESCO-TWAS, BMBF or its Board of Governors.
Institutional Review Board Statement
Not applicable.
Informed Consent Statement
Not applicable.
Data Availability Statement
Date available on request.
Acknowledgments
The authors are very thankfull to Professors Roberto Nisticò and Massimiliano D’Arienzo for their assistance in conducting some analyses in their Institution and for the manuscript revision.
Conflicts of Interest
All authors have read and agreed to the published version of the manuscript. No conflict of interest.
References
- Bafana, A.; Devi, S.S.; Chakrabarti, T. Azo dyes: past, present and the future. Environ. Rev. 2011, 19(NA), 350–371. [Google Scholar] [CrossRef]
- Forgacs, E.; Cserháti, T.; Oros, G. Removal of synthetic dyes from wastewaters: a review. Environ. Int. 2004, 30(7), 953–971. [Google Scholar] [CrossRef] [PubMed]
- Organization WH; Fund, U.N.C. Progress on household drinking water, sanitation and hygiene 2000-2020: five years into the SDGs; World Health Organization, 2021. [Google Scholar]
- Ramaswami, A.; Weible, C.; Main, D.; Heikkila, T.; Siddiki, S.; Duvall, A.; Pattison, A.; Bernard, M. A Social-Ecological-Infrastructural Systems Framework for Interdisciplinary Study of Sustainable City Systems: An Integrative Curriculum Across Seven Major Disciplines. J. Ind. Ecol. 2012, 16(6), 801–813. [Google Scholar] [CrossRef]
- Michelan DC de, G.S.; dos Santos, B.F.S.; Menezes, B.L.O.; da Rocha Júnior, F.R.; Menezes, M.S.; Pedral, V.U.P. Osmose Reversa no Tratamento de Água para o Consumo Humano: Revisão Sistemática: Osmose Reversa no tratamento de água para consumo humano. RCT-Rev. De Ciência E Tecnol. 2023, 9. [Google Scholar] [CrossRef]
- Shen, Q.; Wang, F.; Liao, K.; Liu, Y.; Mei, Z.; Zhang, S.; Wang, H.; Ma, S.; Wang, L. Self-powered electroassisted photocatalysis for wastewater treatment. Nano Energy 2025, 133, 110463. [Google Scholar] [CrossRef]
- Sukmana, H.; Bellahsen, N.; Pantoja, F.; Hodur, C. Adsorption and coagulation in wastewater treatment–Review. Prog. Agric. Eng. Sci. 2021, 17(1), 49–68. [Google Scholar] [CrossRef]
- Allahkarami, E.; Allahkarami, E. A mini-review on nano-enabled solutions for wastewater treatment: addressing disinfection by-products. Curr. Opin. Environ. Sci. Health 2024, 38, 100545. [Google Scholar] [CrossRef]
- Bilińska, L.; Gmurek, M. Novel trends in AOPs for textile wastewater treatment. Enhanced dye by-products removal by catalytic and synergistic actions. Water Resour. Ind. 2021, 26, 100160. [Google Scholar] [CrossRef]
- Hu, M.; Ye, Z.; Zhang, H.; Chen, B.; Pan, Z.; Wang, J. Thermochemical conversion of sewage sludge for energy and resource recovery: technical challenges and prospects. Environ. Pollut. Bioavailab. 2021, 33(1), 145–163. [Google Scholar] [CrossRef]
- Sandre, F.; Huynh, N.; Caupos, E.; El-Mrabet, L.; Partibane, C.; Lachaise, I.; Pommier, C.; Rivard, M.; Morin, C.; Moilleron, R. Occurrence and fate of an emerging drug pollutant and its by-products during conventional and advanced wastewater treatment: Case study of furosemide. Chemosphere 2023, 322, 138212. [Google Scholar] [CrossRef] [PubMed]
- Singh, S.; Sharma, P.; Pandey, A.; Garg, M.C.; Lo, S.-L.; Kumar, P. Challenges and contribution of electrochemical driven by-products in tannery wastewater treatment: Optimization, detection and distribution of reactive oxidation species. J. Environ. Manag. 2025, 376, 124381. [Google Scholar] [CrossRef] [PubMed]
- Fuadi, N.A.B.; Ibrahim, A.S.; Ismail, K.N. Review study for activated carbon from palm shell used for treatment of waste water. J. Purity Util. React. Environ. 2012, 1, 222–236. [Google Scholar]
- Rathi, B.S.; S, M. T.; R G, K.S. V. R. Recent research progress on modified activated carbon from biomass for the treatment of wastewater: A critical review. Environ. Qual. Manag. 2024, 33(4), 907–928. [Google Scholar] [CrossRef]
- Senthil Kumar, P.; Ramalingam, S.; Senthamarai, C.; Niranjanaa, M.; Vijayalakshmi, P.; Sivanesan, S. Adsorption of dye from aqueous solution by cashew nut shell: Studies on equilibrium isotherm, kinetics and thermodynamics of interactions. Desalination 2010, 261(1–2), 52–60. [Google Scholar] [CrossRef]
- Shah, H.H.; Amin, M.; Pepe, F.; Mancusi, E.; Fareed, A.G. Overview of environmental and economic viability of activated carbons derived from waste biomass for adsorptive water treatment applications. Environ. Sci. Pollut. Res. 2023, 1–26. [Google Scholar] [CrossRef] [PubMed]
- Atangana, A. Étude de la porosité de matériaux composites géopolymère-sciure de bois par adsorption du bleu de méthylène. In Universite de Yaounde I; 2023; pp. 10–38. [Google Scholar]
- Kouotou, Y.M.; Njoya, A.; Mountapbeme, I.C.; Njuhou, S.; Kamgang, P.S.; Mouafon, M.; Njoya, D.; Njopwouo, D. Properties of ceramic membranes obtained from kaolinitic clay mixed with palm and mango wastes from Cameroon: Application to wastewater treatment from breweries. Int. J. Ceram. Eng. Sci. 2024, 6(5), e10229. [Google Scholar] [CrossRef]
- NGA. Synthèse et caractérisation des silices obtenues à partir des balles de riz et étude de l’adsorption du nickel (II). In Universite de Yaounde I; 2019; pp. 5–64. [Google Scholar]
- Tabish, A.N.; Irfan, M.; Irshad, M.; Hussain, M.A.; Zeb, H.; Jahangir, S.; Shahzad, A.; Siddiqi, M.H.; Mujtaba, M.; Fouad, Y. Optimization of waste biomass demineralization through response surface methodology and enhancement of thermochemical and fusion properties. Sci. Rep. 2024, 14(1), 27246. [Google Scholar] [CrossRef] [PubMed]
- Vidoca, L.P.; de Almeida, E.S.; Cardoso, M.F.; Otavio, L.; Valadares, L.F.; Monteiro, S. Extraction of carotene from crude hybrid palm oil using polymeric resin. J. Food Eng. 2020, 278, 109944. [Google Scholar] [CrossRef]
- Al-Ghouti, M.A.; Da’ana, D.A. Guidelines for the use and interpretation of adsorption isotherm models: A review. J. Hazard. Mater. 2020, 393, 122383. [Google Scholar] [CrossRef] [PubMed]
- Kepdieu, J.M.; Djangang, C.N.; Tchanang, G.; Mache, J.R.; Abi, C.F.; Blanchart, P. Kinetic and Mechanism of the Adsorption of ß-Carotene Rich-Palm Oil onto Smectite Clay Activated by Fe (II) Lewis Acid Ion. J. Chem. 2022, 1(2), 1–21. [Google Scholar] [CrossRef]
- Nga, J.; Avom, J.; Tonga Limbe, J.; Ndinteh, D.; Assonfack, H.L.; Kede, C.M. Kinetics and Thermodynamics of β-Carotene Adsorption onto Acid-Activated Clays Modified by Zero Valent Iron Rehman R, editor. J. Chem. 2022, 2022, 1–15. [Google Scholar] [CrossRef]
- Girgis, B.S.; Temerk, Y.M.; Gadelrab, M.M.; Abdullah, I.D. X-ray diffraction patterns of activated carbons prepared under various conditions. Carbon Sci. 2007, 8(2), 95–100. [Google Scholar] [CrossRef]
- Kamari, S.; Ghorbani, F. Extraction of highly pure silica from rice husk as an agricultural by-product and its application in the production of magnetic mesoporous silica MCM–41. Biomass Convers. Biorefinery 2021, 11(6), 3001–3009. [Google Scholar] [CrossRef]
- Apaydın Varol, E.; Ü., Mutlu. TGA-FTIR analysis of biomass samples based on the thermal decomposition behavior of hemicellulose, cellulose, and lignin. Energies 2023, 16(9), 3674. [Google Scholar] [CrossRef]
- Materazzi, S. Thermogravimetry – Infrared Spectroscopy (TG-FTIR) Coupled Analysis. Appl. Spectrosc. Rev. 1997, 32(4), 385–404. [Google Scholar] [CrossRef]
- Risoluti, R.; Fabiano, M.A.; Gullifa, G.; Vecchio Ciprioti, S.; Materazzi, S. FTIR-evolved gas analysis in recent thermoanalytical investigations. Appl. Spectrosc. Rev. 2017, 52(1), 39–72. [Google Scholar] [CrossRef]
- Wilkie, C.A. TGA/FTIR: an extremely useful technique for studying polymer degradation. Polym. Degrad. Stab. 1999, 66(3), 301–306. [Google Scholar] [CrossRef]
- Kifuani, K.M.; Kifuani Kia Mayeko, A.; Noki Vesituluta, P.; Ilinga Lopaka, B.; Ekoko Bakambo, G.; Mbala Mavinga, B.; Muswema Lunguya, J. Adsorption d’un colorant basique, Bleu de Méthylène, en solution aqueuse, sur un bioadsorbant issu de déchets agricoles de Cucumeropsis mannii Naudin. Int. J. Biol. Chem. Sci. 2018, 12(1), 558. [Google Scholar] [CrossRef]
- Sedira, N. Etude de l’adsorption des métaux lourds sur un charbon actif issu de noyaux de dattes. In University of Souk Ahras; 2013. [Google Scholar]
- Vučurović, V.M.; Razmovski, R.N.; Miljić, U.D.; Puškaš, V.S. Removal of cationic and anionic azo dyes from aqueous solutions by adsorption on maize stem tissue. J. Taiwan Inst. Chem. Eng. 2014, 45(4), 1700–1708. [Google Scholar] [CrossRef]
- Hameed, B.H. Evaluation of papaya seeds as a novel non-conventional low-cost adsorbent for removal of methylene blue. J. Hazard. Mater. 2009, 162(2–3), 939–944. [Google Scholar] [CrossRef] [PubMed]
- Hameed, B.H.; Krishni, R.R.; Sata, S.A. A novel agricultural waste adsorbent for the removal of cationic dye from aqueous solutions. J. Hazard. Mater. 2009, 162(1), 305–311. [Google Scholar] [CrossRef] [PubMed]
- Jin, J.; Li, Y. Research on TiO2/UV-Fenton Catalytic Oxidation of Azocarmine G Dye Wastewater. In 2010 4th International Conference on Bioinformatics and Biomedical Engineering; IEEE: Chengdu, China, 2010; pp. 1–4. Available online: http://ieeexplore.ieee.org/document/5517598/. [CrossRef]
- Hellal, M.S.; Attia, S.K.; Kadimpati, K.K.; Gnida, A.; Rashad, A.M. Preparation and characterization of an algal-based magnetic biochar nanocomposite for the removal of azocarmine G2 dye from aqueous solutions. BMC Chem. 2025, 19(1), 123. [Google Scholar] [CrossRef] [PubMed]
- Pohndorf, R.; Cadaval, Jr T; Pinto, L. Kinetics and thermodynamics adsorption of carotenoids and chlorophylls in rice bran oil bleaching. J. Food Eng. 2016, 185, 9–16. [Google Scholar] [CrossRef]
- Silva, S.M.; Sampaio, K.A.; Ceriani, R.; Verhé, R.; Stevens, C.; De Greyt, W.; Meirelles, A.J. Adsorption of carotenes and phosphorus from palm oil onto acid activated bleaching earth: Equilibrium, kinetics and thermodynamics. J. Food Eng. 2013, 118(4), 341–349. [Google Scholar] [CrossRef]
- Saleh, T.A. Protocols for synthesis of nanomaterials, polymers, and green materials as adsorbents for water treatment technologies. Environ. Technol. Innov. 2021, 24, 101821. [Google Scholar] [CrossRef]
- Binwie Joy, N.-A.; Richard, K.; Pierre, N.J. Adsorption of palm oil carotene and free fatty acids onto acid activated Cameroonian clays. J. Appl. Sci. 2007, 7(17), 2462–2467. Available online: https://ui.adsabs.harvard.edu/link_gateway/2007JApSc...7.2462B/doi:10.3923/jas.2007.2462.2467. [CrossRef]
- Baptiste, B.M.J.; Daniele, B.K.; Charlène, E.M.; Canuala, T.T.L.; Antoine, E.; Richard, K. Adsorption mechanisms of pigments and free fatty acids in the discoloration of shea butter and palm oil by an acid-activated Cameroonian smectite. Sci. Afr. 2020, 9, e00498. [Google Scholar] [CrossRef]
- Belaid, K.D.; Kacha, S. Étude cinétique et thermodynamique de l’adsorption d’un colorant basique sur la sciure de bois. Rev. Des. Sci. De L’eau 2011, 24(2), 131–144. [Google Scholar] [CrossRef]
- Baby, R.; Saifullah, B.; Hussein, M.Z. Palm Kernel Shell as an effective adsorbent for the treatment of heavy metal contaminated water. Sci. Rep. 2019, 9(1), 18955. [Google Scholar] [CrossRef] [PubMed]
- Saki, S.; Mosso, K.; Sea, T.; Diopoh, K. Détermination de quelques composants essentiels d\’amandes de Akpi (Ricinodendron heudelotii) en Côte d\’Ivoire. Agron. Afr. 2009, 17(2), 137–142. [Google Scholar] [CrossRef]
- Njimou, J.R.; Godwin, J.; Pahimi, H.; Maicaneanu, S.A.; Kouatchie-Njeutcha, F.; Tripathy, B.C.; Talla, A.; Watanabe, T.; Elambo, N.G. Biocomposite spheres based on aluminum oxide dispersed with orange-peel powder for adsorption of phenol from batch membrane fraction of olive mill wastewater. Colloid Interface Sci. Commun. 2021, 42, 100402. [Google Scholar] [CrossRef]
- Njimou, J.R.; Njike, R.M.T.; Kepdieu, J.M.; Djangang, C.N.; Talla, A.; Elambo, N.G.; Fritsky, J.W.; Maicaneanu, S.A.; Rosso, D. Eco-friendly chitin-MnO2-alginate nanobiocomposite spheres for enhanced heavy metal removal from wastewater. Inorg. Chem. Commun. 2025, 172, 113719. [Google Scholar] [CrossRef]
Figure 1.
Azocarmin G molecular structure (a), Adsorbance Spectrum (b) and calibration curve (c).
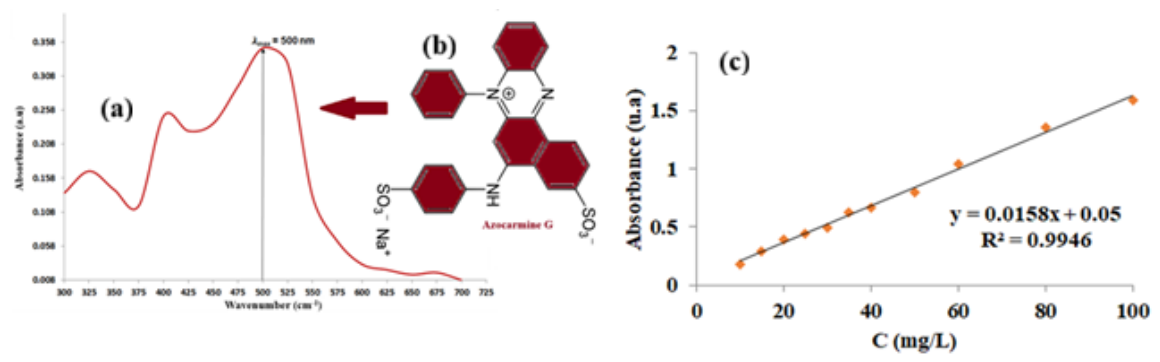
Figure 2.
X-ray patterns (a) and FTIR spectra (b) of AGS and RHA.
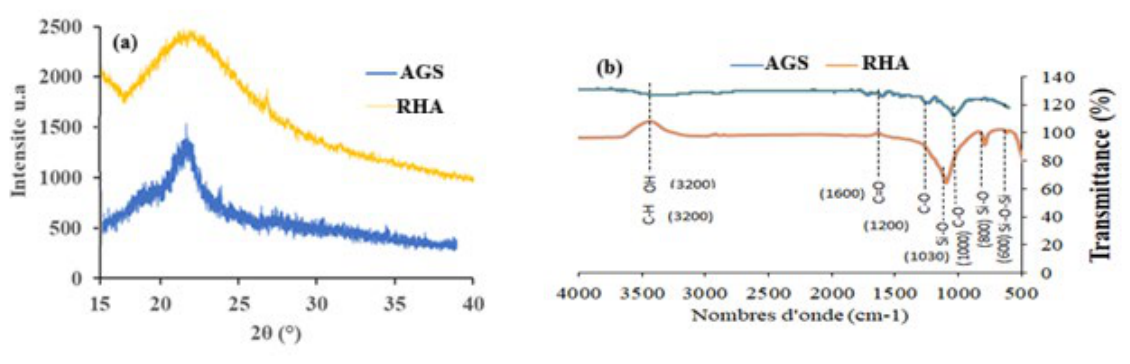
Figure 4.
TGA curve (a), Gram-Schmidt curve (b) and FTIR detection at 41min (d) and 47 min (d) of evolved gases for composite NS-AGS.
Figure 4.
TGA curve (a), Gram-Schmidt curve (b) and FTIR detection at 41min (d) and 47 min (d) of evolved gases for composite NS-AGS.
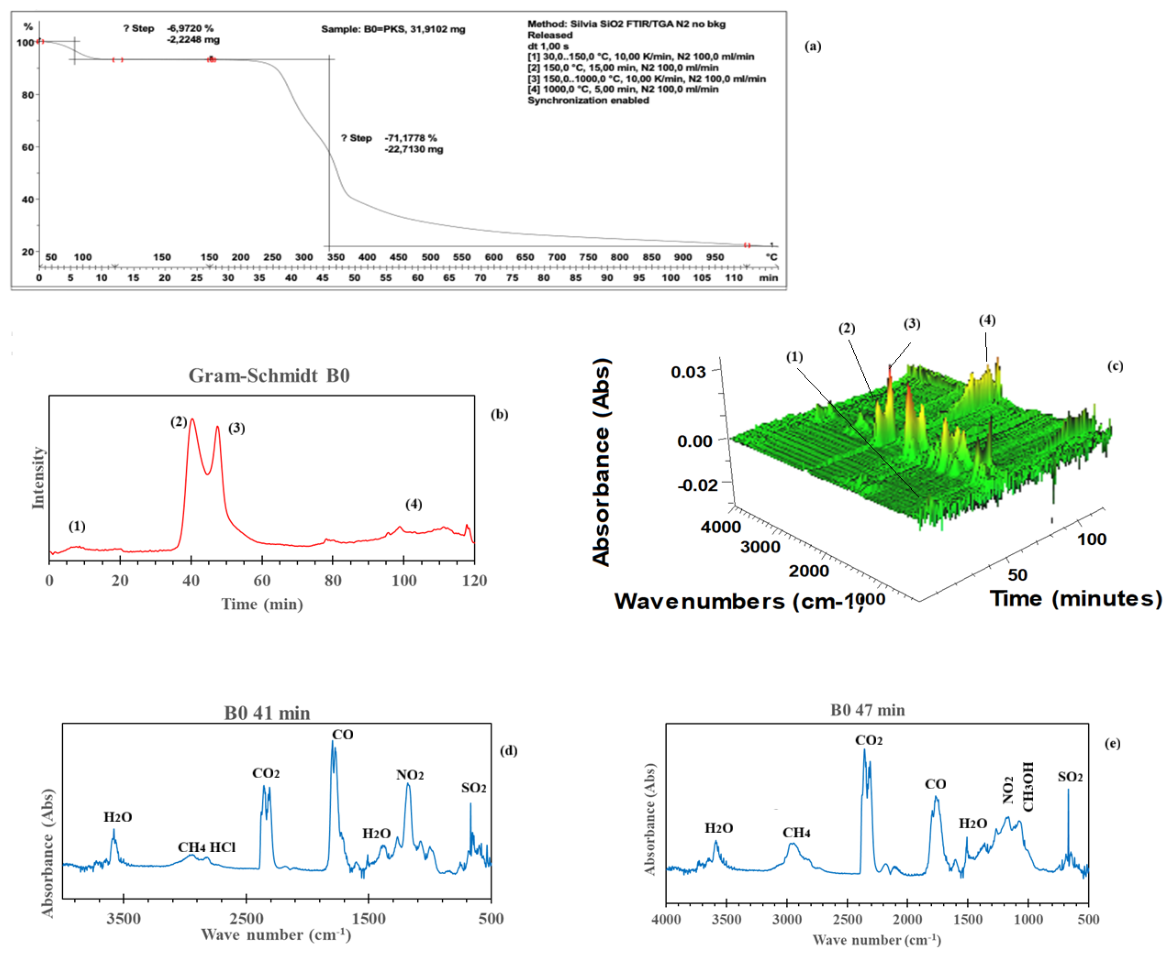
Figure 5.
SEM images for (a) AGS and (b) Ns-AGS.
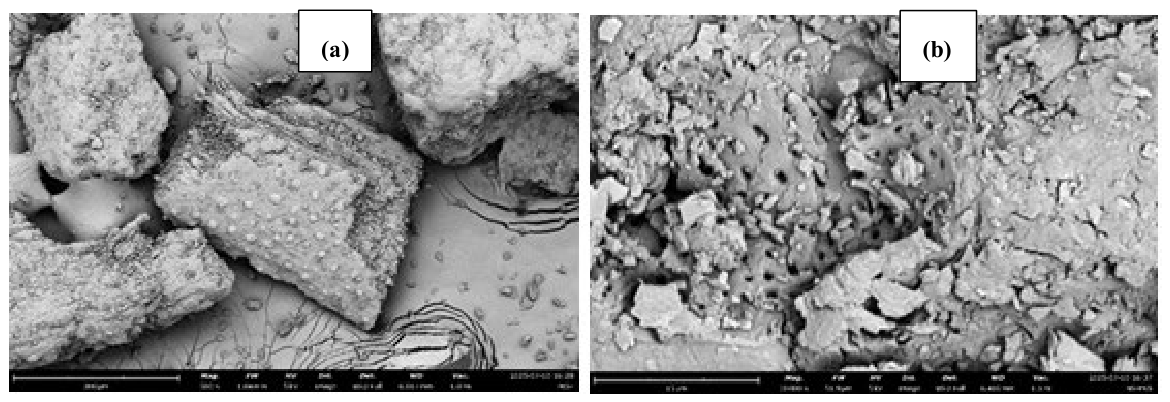
Figure 6.
Mechanism of the formation of Ns-AGS.
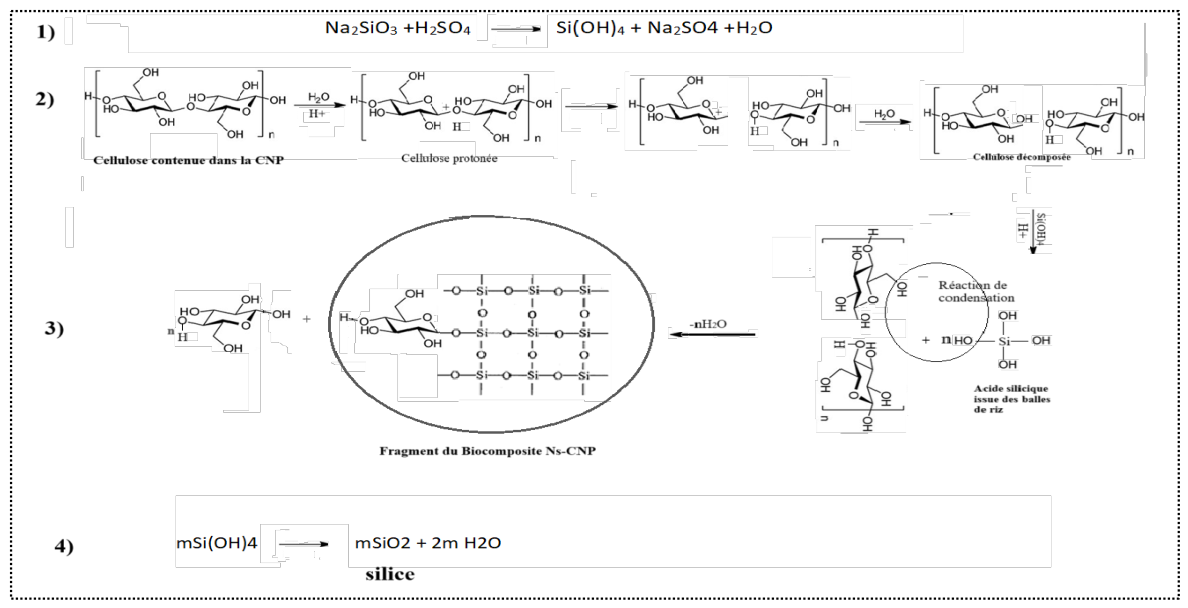
Figure 7.
XRD patterns (a) and FTIR spectra (b) of NS-AGS and AG loaded–NS-AGS.
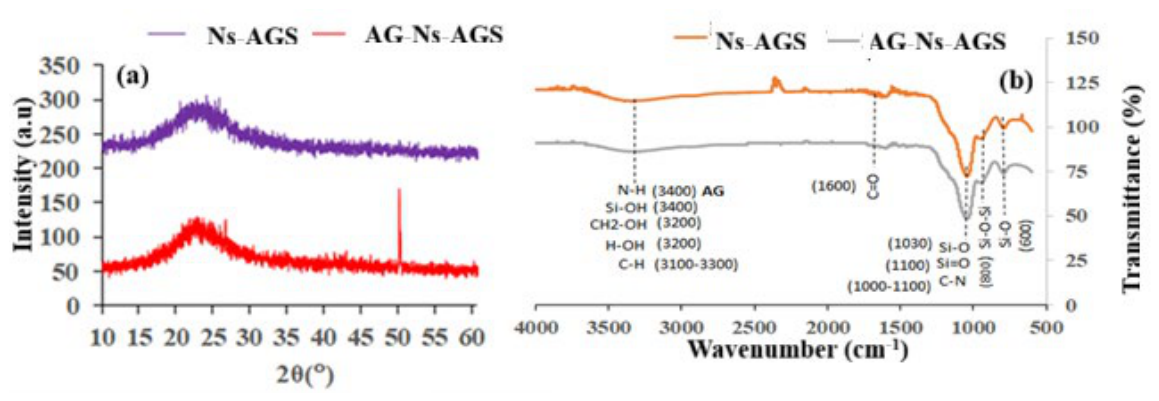
Figure 8.
Plot of ∆pH against pHi and zero point charge (pHZPC).
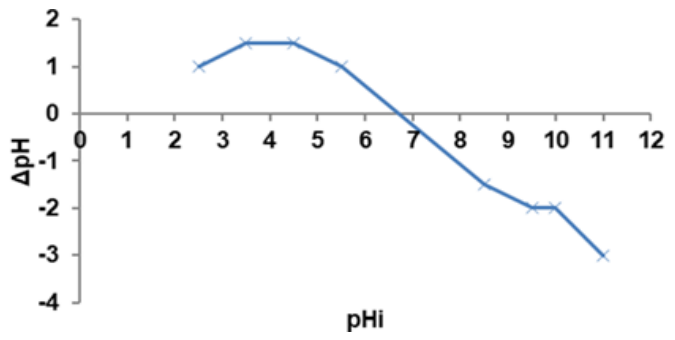
Figure 9.
Plots of the effect of (a) temperature and time, (b) temperature and concentration, (c) adsorbent dose and (d) initial pH of the solution on the adsorption capacity of AG.
Figure 9.
Plots of the effect of (a) temperature and time, (b) temperature and concentration, (c) adsorbent dose and (d) initial pH of the solution on the adsorption capacity of AG.
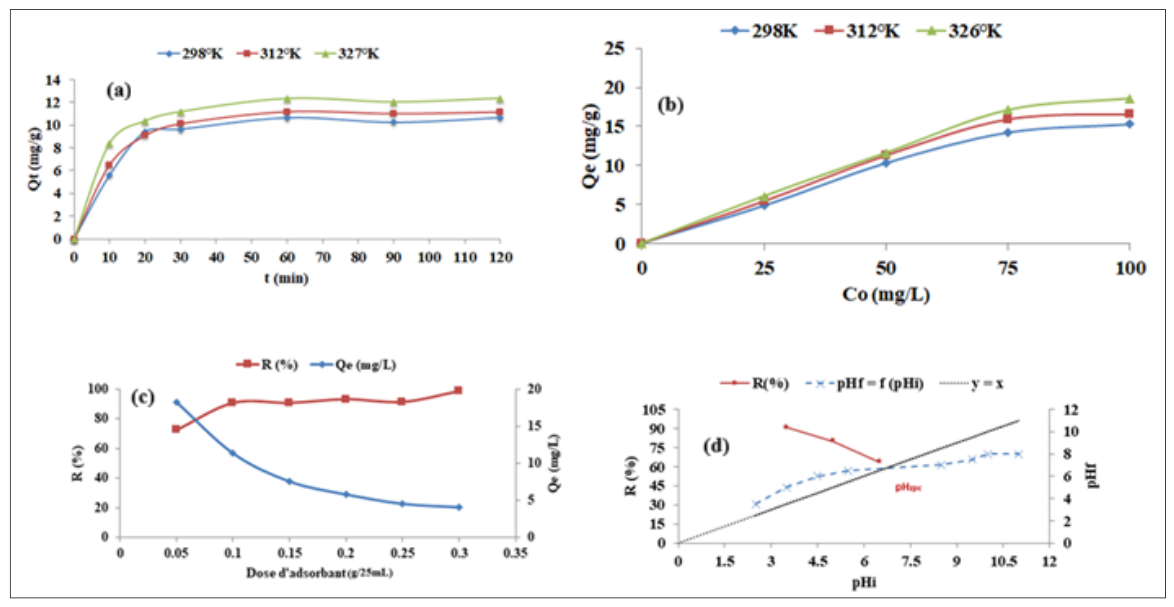
Figure 10.
Plots of the linear regression of kinetics data for Lagergreen (L), Hô (H) and Werber Morris (W) models at 298°K(a), 312°K (b) and 327°K (c).
Figure 10.
Plots of the linear regression of kinetics data for Lagergreen (L), Hô (H) and Werber Morris (W) models at 298°K(a), 312°K (b) and 327°K (c).
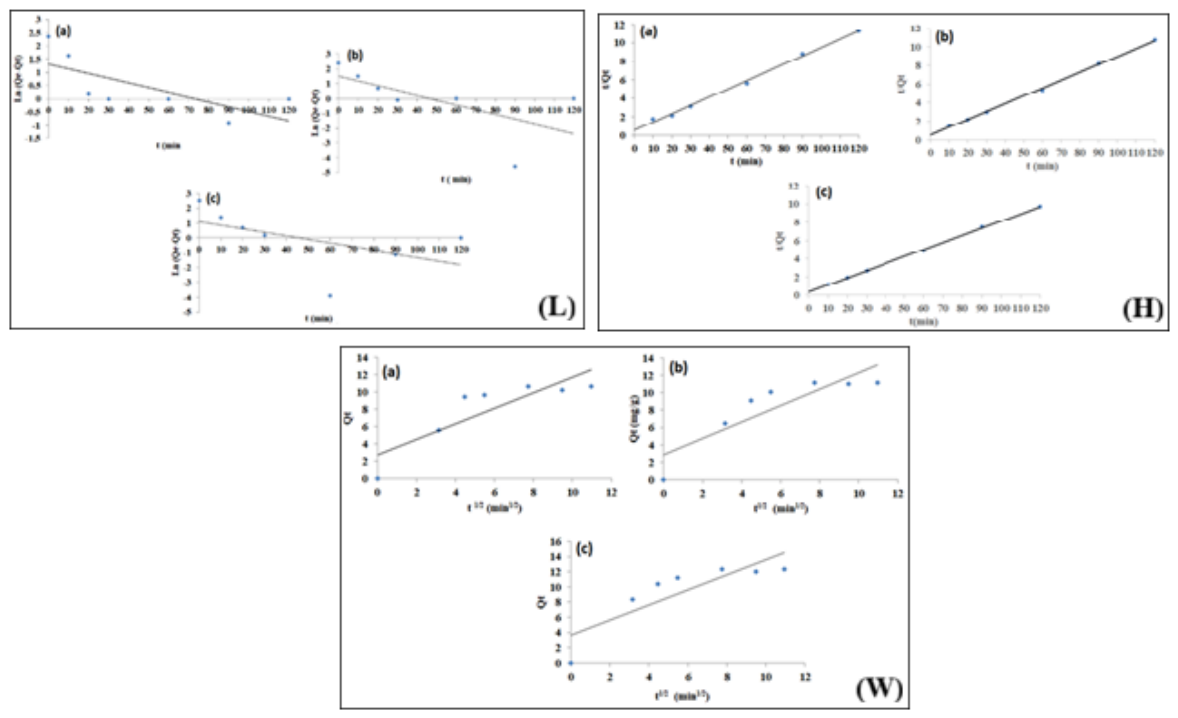
Figure 11.
Plot of lnK2 = f(1/T) for the determination of Ea.
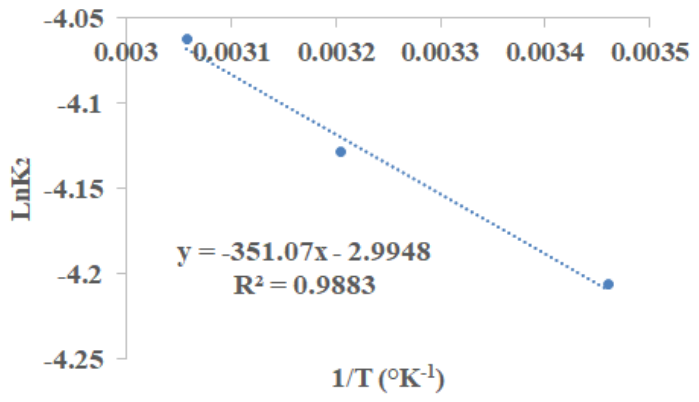
Figure 12.
Plots of isotherms (I) and of the linear modelling of Langmuir (L), Freundlich (F), Dubinin-kagamer-Raduskevith (D) and Redlich-Peterson (R) at 298°K (a), 311°K(b) and 326°K(c).
Figure 12.
Plots of isotherms (I) and of the linear modelling of Langmuir (L), Freundlich (F), Dubinin-kagamer-Raduskevith (D) and Redlich-Peterson (R) at 298°K (a), 311°K(b) and 326°K(c).
| Model | Equations |
|---|---|
| Lagergreen | ) |
| Ln(qe − qt) = −k1t + Lnqe | |
| Hô | |
| Weber-Morris | Qt= kidt1/2 + γ |
| Langmuir | Qe = |
| Freundlich | |
| Redlich-Peterson | |
| = βLn(KLCe) | |
| Dubinin-Kagamer-Radushkevich | |
| LnQe = LnQm − βDKRε2 | |
Table 2.
Evolved gases as a function of mass loss in the distinct temperature regions of the degradation of RHS.
Table 2.
Evolved gases as a function of mass loss in the distinct temperature regions of the degradation of RHS.
| Temperature region, °C | Mass loss in this region (%) | Evolved gases and related wavelengths |
|---|---|---|
| 0-150 | 6.97 | H2O (3500 Cm-1) |
| 200-500 | 71.18 | H2O (1600 Cm-1), CH3OH (1000-1100 cm-1), CO2 (2200-2400 cm-1),CH4(3000 cm-1), CO (1750 cm-1), N2O (1250-1300 cm-1) |
| Residue | 21.85 | / |
Table 3.
Kinetics Constants of Lagergreen, de Hô et Weber-Morris.
| Kinetic model | Constants | Units | 298°K | 312°K | 327°K |
|---|---|---|---|---|---|
| Lagergreen | Qe1 | mg/g | 3.7430 | 4.4158 | 3.0071 |
| k1 | min-1 | 0.0181 | 0.032 | 0.0542 | |
| R2 | / | 0.5175 | 0.4122 | 0.277 | |
| Hô | k2 | mg-1/g.min | 0.0149 | 0.0161 | 0.0172 |
| Qe2 | mg/g | 11.1857 | 11.7925 | 12.8205 | |
| R2 | / | 0.9961 | 0.9985 | 0.9992 | |
| Weber-Morris |
kind | mg/gmin0.5 | 0.8959 | 0.942 | 0.994 |
| Qe3 | mg/g | 10.65 | 11.14 | 12.35 | |
| γ | mg/g | 2.7417 | 2.8681 | 3.6528 | |
| R2 | / | 0.7414 | 0.7706 | 0.7261 |
Table 4.
Equilibrium constants of the isotherm models à 298°K; 312°K et 327°K.
| Isother model | Constante/ Unité | 298°K | 312°K | 327°K |
|---|---|---|---|---|
| Langmuir | Qexp/ mg/g | 16.351 | 18.009 | 16.281 |
| KL/ L.mg-1 | 0.157 | 0.309 | 0.759 | |
| Qm/mg/g | 17.668 | 18.149 | 19.455 | |
| RL | 0.113 | 0.060 | 0.026 | |
| R2 | 0.882 | 0.950 | 0.992 | |
| Freundlich | KF/ mg(1-n).Ln.g-1 | 2.433 | 4.475 | 7.089 |
| 1/n | 0.548 | 0.419 | 0.344 | |
| R2 | 0.761 | 0.665 | 0.884 | |
| Redlich-Peterson |
aR/ L.g.mg-2 | 2.770 | 5.621 | 14.770 |
| β | 1.109 | 1.303 | 0.159 | |
| KR/(L.mg-1) β | 0.128 | 0.217 | 0.957 | |
| R2 | 0.981 | 0988 | 0.575 | |
| Dubinin-Kagamer-Raduschkevich | KDR/ mol2/J2 | 7.10-6 | 3.10-6 | 3.10-7 |
| E/kJ/mol | 0.267 | 0.408 | 1.291 | |
| R2 | 0.991 | 0.962 | 0.898 |
Disclaimer/Publisher’s Note: The statements, opinions and data contained in all publications are solely those of the individual author(s) and contributor(s) and not of MDPI and/or the editor(s). MDPI and/or the editor(s) disclaim responsibility for any injury to people or property resulting from any ideas, methods, instructions or products referred to in the content. |
© 2026 by the authors. Licensee MDPI, Basel, Switzerland. This article is an open access article distributed under the terms and conditions of the Creative Commons Attribution (CC BY) license (http://creativecommons.org/licenses/by/4.0/).
Copyright: This open access article is published under a Creative Commons CC BY 4.0 license, which permit the free download, distribution, and reuse, provided that the author and preprint are cited in any reuse.