

Submitted:
01 October 2026
Posted:
06 October 2026
You are already at the latest version
Abstract
To characterize the distribution of IgA-producing plasma cells across the human ocular surface and to assess alterations in tear IgA subclass profiles in Schirmer strip extracts from patients with dry eye disease (DED) and primary Sjögren’s syndrome (pSS).
Immunofluorescence staining was performed on paraffin-embedded lacrimal gland, conjunctival, and corneal tissues to identify IgA- and subclass-producing B/plasma cells. Samples were collected from controls (n = 18), patients with DED (n = 75), and patients with pSS (n = 10). Total protein concentrations in Schirmer strip extracts were deter-mined using a bicinchoninic acid assay. Total IgA, IgA1 and IgA2 were quantified by ELISA and normalized to total protein.
IgA-producing plasma cells were abundant in the lacrimal gland and conjunctival stroma but absent from the corneal sections. In both tissues, IgA1-producing cells predominated over IgA2-producing cells. Total protein concentrations in Schirmer strip extracts were significantly lower in pSS than in DED. The most consistent change was reduced normalized IgA2 abundance in Schirmer strip extracts, whereas changes in IgA1 were less consistent across the analyzed disease groups.
IgA-producing plasma cells are prominent in the lacrimal gland and conjunctiva. DED and pSS are associated with reduced normalized IgA2 abundance and altered IgA sub-class profiles.
Keywords:
ocular surface immunity
; immunoglobulin A (IgA)
; IgA subclasses (IgA1/IgA2)
; dry eye disease (DED)
; Primary Sjögren’s syndrome (pSS)
1. Introduction
The ocular surface represents a highly integrated functional unit composed of the cornea, conjunctiva, eyelid glands, and lacrimal apparatus [1]. Together, these structures maintain tear film stability, provide optical quality, and protect the eye from environmental and microbial challenges. The tear film, which covers the ocular surface, is classically described as consisting of three functional layers: an outer lipid layer, an aqueous layer, and an inner mucin layer. The lipid layer, produced primarily by the meibomian glands, limits evaporation of the underlying aqueous phase [2]. The aqueous component is secreted mainly by the main and accessory lacrimal glands and contains oxygen, nutrients, antimicrobial peptides, and immunoglobulins that contribute to ocular surface defense [3]. The innermost mucin layer, generated predominantly by conjunctival goblet cells and epithelial cells, consists of membrane-bound and secreted mucins that promote tear film adhesion to the ocular surface and ensure uniform tear film distribution [4,5,6].
Disruption of tear film homeostasis can lead to dry eye disease (DED), a multifactorial disorder with an estimated prevalence ranging from 5% to 50% worldwide [7,8]. Clinically, patients experience symptoms such as ocular dryness, burning, irritation, and pain [8,9]. Pathophysiologically, DED is commonly categorized into evaporative dry eye (EDE), which is primarily associated with meibomian gland dysfunction and increased tear evaporation [6,10], and aqueous-deficient dry eye disease (ADDE), which arises from impaired lacrimal gland secretion. In many patients, both mechanisms coexist, leading to a mixed form of disease (MDE) [7,11].
In addition, DED frequently occurs in association with systemic autoimmune diseases, such as primary Sjögren’s syndrome (pSS), a chronic inflammatory disease characterized by lymphocytic infiltration and progressive dysfunction of the lacrimal and salivary glands [2,12].
The immunopathology of pSS and ocular surface inflammation has long been attributed primarily to T cell-mediated mechanisms. However, increasing evidence highlights a central role for B cells in disease initiation and progression [12,13]. Beyond their role as producers of antibodies and autoantibodies, B cells and their terminally differentiated counterparts, plasma cells, contribute to immune regulation through cytokine production and immunoglobulin secretion. This has raised growing interest in B cell-mediated immune responses at the ocular surface in health and disease [14].
Immunoglobulin A (IgA) is the predominant antibody class in mucosal secretions, including the tear film. Secretory IgA plays a critical role in ocular surface immunity by binding and neutralizing pathogens and preventing microbial adherence to epithelial surfaces [3,15]. In humans, IgA occurs in two subclasses, IgA1 and IgA2, which differ in their structural and glycosylation patterns and may exert distinct immunological functions; thus IgA2 may have a pro-inflammatory effect on neutrophils, macrophages or dendritic cells [15,16,17]. IgA produced by plasmablasts and plasma cells in the lacrimal glands and conjunctival subepithelium is transported into the tear film via epithelial cells through the polymeric immunoglobulin receptor (pIgR), resulting in release of secretory IgA at the mucosal surface [18,19,20].
Previous studies have demonstrated local IgA production within human ocular tissues and have identified IgA-producing plasma cells in the lacrimal gland and other eye-associated lymphoid tissues. Moreover, the distribution of IgA subclasses in the human lacrimal gland has previously been investigated [21,22]. However, the distribution and relative abundance of IgA1- and IgA2-producing plasma cells across different ocular surface-associated tissues remain incompletely characterized. Furthermore, in contrast to other mucosal tissues such as the gastrointestinal tract in which plasma cells are localized in survival niches in the lamina propria, little is known about the relative abundance and localization of IgA plasma cells within the ocular surface tissues [19,20,23]. In the gastrointestinal tract IgA plasma cells are generated in Peyer’s patches and mesenteric lymph nodes after sampling of intestinal antigens by M cells and dendritic cells, which activate naive B cells. With T cell help via CD40-CD40L and cytokines such as TGF-β, IL-21, and retinoic acid, B cells undergo class-switch recombination to IgA, differentiate into plasmablasts, and then migrate to the intestinal lamina propria, where they mature into IgA-secreting plasma cells [24]. Survival niches provide plasma cells with a microenvironment that supplies the cells with cytokines, survival factors, cell-cell contacts, and nutrients [25]. Whether comparable patterns of IgA-producing plasma cell localization occur across human ocular surface-associated tissues remains less well defined.
Alterations in IgA-mediated mucosal immunity may also be relevant to DED and pSS. Chronic ocular surface inflammation, tear film dysfunction, and, particularly in pSS, lacrimal gland pathology could be associated with changes in the amount or composition of IgA recovered from tears. However, comparatively little is known about IgA subclass profiles in tears from patients with DED and pSS. Importantly, alterations in tear IgA abundance may reflect several processes, including changes in IgA production, secretion, epithelial transport, degradation, or tear production, and therefore cannot by themselves identify the underlying mechanism.
Therefore, the present study aimed (1) to systematically map the distribution of IgA-, IgA1-, and IgA2-producing cells within human ocular surface tissues and (2) to determine whether the abundance of total IgA and its subclasses in Schirmer strip extracts differs between controls, patients with DED, and patients with pSS. By integrating tissue-based analyses with tear sample analyses, this study provides complementary information on IgA-mediated ocular surface immunity and its alterations in DED and pSS.
2. Materials and Methods
2.1. Collection and Fixation of Human Samples
Human lacrimal glands, eyelids, and corneas were obtained from body donors (Table 1) who had donated their bodies to the body donation program of the Institute of Anatomy, Friedrich-Alexander-Universität Erlangen-Nürnberg (FAU), Germany. All procedures involving human tissues were conducted in accordance with the principles of the Declaration of Helsinki. Written informed consent for the use of tissues for research purposes had been obtained from all body donors prior to death through the body donation program of the Institute of Anatomy, FAU, Germany. Donors with a history of recent trauma, ocular or nasal infection, or known diseases affecting lacrimal gland, eyelid, or corneal function were excluded. However, a prior history of dry eye disease (DED) in these donors cannot be completely excluded.
The tissues were carefully dissected within 24h of death under anatomical guidance to avoid contamination with adjacent structures. Following excision, samples were fixed in paraformaldehyde (PFA) for 48 hours, embedded in paraffin, and sectioned into 5-µm slices using a sliding microtome (Microm HM 430, Thermo Scientific, USA). Sections were mounted on microscope slides, and tissue morphology and structural integrity were confirmed by hematoxylin and eosin staining.
2.2. Immunofluorescence Staining
Paraffin sections were deparaffinized by incubation in xylene twice for 10 min, followed by rehydration through a descending ethanol series (100%, 100%, 100%, 96%, 96%, 80%, and 70%) for 3 min each. Sections were subsequently rinsed in deionized water for 5 min.
For antigen retrieval, slides were incubated in citrate buffer (pH 6.0) at 80 °C for 10 min and allowed to cool at room temperature for 3 hours. Sections were then treated with trypsin (1 mg/mL; Sigma-Aldrich, USA) diluted in Tris-buffered saline (TBS; 0.05 M Tris, 0.015 M NaCl, pH 7.3) for 10 min at 37 °C in a humidified chamber.
To reduce nonspecific antibody binding, sections were blocked for 1 hour with skim milk powder (10 mg/mL; Merck, Germany) in TBS containing Tween-20 (TBS-T; 1 µL/mL; Roth, Germany). Slides were then incubated overnight at 4 °C in a humidified chamber with primary antibodies against CD38, IgA, IgA1, and IgA2. Primary antibodies were diluted in TBS-T supplemented with bovine serum albumin (BSA; 20 mg/mL; Roth, Germany) and Triton X-100 (2 µL/mL; Roth, Germany).
After incubation with the primary antibodies, sections were washed three times in TBS-T and subsequently incubated with Alexa Fluor 488- or Alexa Fluor 555-conjugated secondary antibodies for 1 hour at room temperature. Slides were then washed three times in TBS-T and nuclei were counterstained with 4’,6-diamidino-2-phenylindole (DAPI; D9664, Merck, Germany; 1:1000 dilution) for 3 min at room temperature.
Finally, sections were washed once with TBS-T, mounted with a fluorescent mounting medium (S3023; Dako, USA) and covered with coverslips. Images were acquired using an inverted fluorescence phase-contrast microscope (Keyence BZ-X810, Keyence, Germany).
Negative controls, in which primary antibodies were omitted or replaced with isotype-matched control antibodies, were included in each staining run to assess nonspecific binding. For each donor and tissue, one tissue section was analyzed. For quantification, three fields per tissue section were imaged using a 4x objective, and IgA-, IgA1-, and IgA2-producing cells were counted manually. Counting was performed by an observer blinded to sample identity to reduce bias. For corneal tissue, the entire corneal section was systematically examined for the presence of IgA-producing cells. Details of the primary and secondary antibodies are provided in Table 2 and Table 3.
2.3. Tear Fluid Samples
The collection and analysis of human tear fluid were approved by the local ethics committee of Friedrich-Alexander-Universität Erlangen-Nürnberg (FAU application number 25-273-B) and Medizinische Universität Graz (application number 32-015 ex 19/20) and conducted in accordance with the Declaration of Helsinki and good clinical practice. Written informed consent was obtained from all participants.
All participants completed the Ocular Surface Disease Index (OSDI) questionnaire and underwent a comprehensive ophthalmologic examination according to the guidelines of the Professional Association of Ophthalmologists in Germany (BVA). Control participants had no symptoms of DED, did not use artificial tears or ocular lubricants, had no autoimmune disorders or ocular diseases other than cataract or refractive errors, and had an OSDI score ≤ 12. Participants were classified as having DED if they had a documented diagnosis of DED for ≥ 6 months and an OSDI score ≥ 13. All DED patients were consecutively recruited during specialized dry eye consultation hours at the University Eye Clinic Graz.
DED patients were further categorized based on the Schirmer type 1 test and the presence of meibomian gland dysfunction (MGD) into aqueous-deficient dry eye (ADDE), evaporative dry eye (EDE), and mixed dry eye (MDE). Aqueous deficiency was defined as a Schirmer type 1 result <10 mm/5 min in at least one eye. MGD was diagnosed based on slit-lamp examination, meibography, lipid layer analysis, and assessment of meibomian gland expressibility, as previously described [26]. MDE was defined by the presence of both aqueous deficiency and MGD. ADDE was defined as aqueous deficiency in the absence of MGD, whereas EDE was defined as MGD in the absence of aqueous deficiency. Ocular surface integrity was additionally assessed by tear film break-up time (BUT), National Eye Institute (NEI) corneal fluorescein staining, and Lissamine green staining of the conjunctiva.
The diagnosis of pSS was confirmed by the Department of Rheumatology and Immunology at the University Hospital in Graz according to the classification criteria described in [27]. Patients with allergic conjunctivitis, including atopic or vernal keratoconjunctivitis, rheumatoid arthritis, secondary Sjögren’s syndrome, facial nerve palsy, graft-versus-host disease, or other autoimmune diseases, including myasthenia gravis and vitiligo, were excluded to minimize potential confounding effects of concomitant inflammatory or autoimmune diseases on IgA and IgA subclass measurements.
Tear samples were collected from 103 participants (18 healthy, 75 DED, 10 pSS) using Schirmer strips without anesthetic (Schirmer type 1; Clement Clarke, Clement Clarke International Ltd, UK for DED and pSS patients; Optitech Mark Blu, Optitech Eyecare, India for controls). The resulting Schirmer strip extracts were used for subsequent protein and IgA analyses.
Following collection, Schirmer strips were immediately stored at -20 °C until extraction. Tear components were extracted from the Schirmer strips with 60 µL of 1x PBS by centrifugation at 13,000 rpm for 5 min at 4 °C, according to an adapted previously published protocol [28]. No protease inhibitors were added during extraction. Following extraction, samples were aliquoted and stored at -20 °C until analysis. Aliquots were thawed once and subsequently used for total protein and IgA analyses, thereby avoiding repeated freeze-thaw cycles.
For the present study, only samples obtained from the right eye of each participant were analyzed. DED classification, however, was based on the clinical criteria described above. Clinical and demographic characteristics of the study cohorts are summarized in Table 4.
2.4. Total Protein Concentration in Schirmer Strip Extracts
Total protein concentrations in Schirmer strip extracts were measured using the Pierce BCA Protein Assay Kit (23227, Thermo Fisher, USA) following the manufacturer’s instructions. Standards (bovine serum albumin) and samples were loaded in duplicate (25 µL per well) on a 96-well F plate (82.1581, Sarstedt, Germany). A total of 200 µL working reagent (reagent A:B, 50:1) was added per well, and the plate was shaken for 30 s and incubated at 37 °C for 30 min in the dark. After cooling to room temperature, absorbance was recorded at 562 nm using a CLARIOstar ELISA reader (BMG Labtech, Germany). Total protein concentrations were determined from the BSA standard curve.
2.5. Quantification of Total IgA, IgA1 and IgA2 in Schirmer Strip Extracts
Total IgA, IgA1, and IgA2 in Schirmer strip extracts were quantified using in-house ELISAs. Briefly, 96-well F plates (82.1581, Sarstedt, Germany) were coated overnight at 4 °C with F(ab')₂ anti-IgA antibody diluted in carbonate-bicarbonate coating buffer containing 15 mM Na₂CO₃ and 35 mM NaHCO₃. Plates were washed three times with washing buffer containing 10% PBS and 0.05% Tween-20 and blocked with PBS containing 2% FCS for 1 hour at room temperature. Human IgA subclass serum (5691554, antibodies-online, USA) was used as reference material for the standard curves. Standards and samples were applied in duplicate (100 µL per well), with PBS containing 2% FCS serving as blank, and incubated for 1.5 hours at room temperature. After three washing steps, bound IgA was detected using HRP-conjugated anti-human IgA, IgA1, or IgA2 antibodies for 1 hour at room temperature. Antibody details and working concentrations are provided in Table 5. Following three additional washing steps, 100 µL of TMB substrate (555214, BD, USA) was added to each well. The reaction was stopped by addition of 100 µL of 0.5 M sulfuric acid, and absorbance was measured at 450 nm using a CLARIOstar ELISA reader (BMG Labtech, Germany). Concentrations were calculated from the respective standard curves using four-parameter logistic (4PL) regression. For all 103 samples included in the study, concentrations of total IgA, IgA1, and IgA2 were within the respective standard curve ranges; therefore, no extrapolation beyond the standard curves was required. Total IgA, IgA1, and IgA2 measurements were subsequently normalized to the total protein concentration determined in the corresponding Schirmer strip extract and are reported as µg of the respective IgA analyte per mg total protein.
2.6. Statistics
Data are presented as mean ± standard error of the mean (SEM). Statistical analyses were performed using GraphPad Prism 11 (version 11.0.0; GraphPad Software, San Diego, CA, USA). Outliers were identified using the ROUT method with a Q value of 1% and excluded from the respective analyses. Group comparisons were performed using one-way analysis of variance (ANOVA) followed by Tukey’s multiple-comparison test. To explore potential associations of demographic factors with total protein and IgA measurements, additional stratified analyses were performed according to sex and age (≤50 years and >50 years). These analyses included total protein as well as total IgA, IgA1, and IgA2 measurements normalized to total protein. Given the unequal group sizes and demographic composition of the study cohorts, these analyses were considered exploratory. Associations between clinical parameters (OSDI, Schirmer test, tear film break-up time [BUT], National Eye Institute [NEI] score, and Lissamine green staining score) and normalized total IgA, IgA1, and IgA2 measurements were assessed using Spearman’s rank correlation coefficient. These correlation analyses were considered exploratory, and no adjustment for multiple testing across the correlation analyses was performed. Statistical significance was defined as P ≤ 0.05. Significance levels are indicated as follows: *P < 0.05, **P < 0.01, ***P < 0.001, and ****P < 0.0001.
3. Results
3.1. Occurrence and Spatial Distribution of IgA and IgA Subclass-Producing B/Plasma Cells in Tissues of the Ocular Surface
Immunofluorescence staining was performed on PFA-fixed, paraffin-embedded tissues from human body donors (Table 1) to detect CD38-+IgA+ B cells and CD38++IgA+ plasmablasts and plasma cells in the lacrimal gland, conjunctiva and cornea. Both CD38++IgA1+- and CD38++IgA2+- plasmablasts and plasma cells, as well as CD38-+IgA1+- and CD38-+IgA2+- B cells, were observed in the connective tissue of the lacrimal gland in close proximity to the acini (Figure 1, A1-A3) and in the eyelid connective tissue beneath the conjunctiva (Figure 1, A4-A6). In contrast, no IgA-producing cells were detected in the examined corneal sections (Figure 1, A7-A9). Quantification revealed significantly higher numbers of CD38++IgA+ plasmablasts and plasma cells in the lacrimal gland compared to the eyelid connective tissue (Figure 1A). Moreover, CD38++IgA1+ plasmablasts and plasma cells significantly outnumbered CD38++IgA2+ cells in both the lacrimal gland (IgA1/IgA2 ratio: 1.3) and the eyelid connective tissue (IgA1/IgA2 ratio: 2.7; Figure 1D). IgA2-produing cells were detected only rarely in the eyelid connective tissue beneath the conjunctiva (Figure 1D).
3.2. Reduced Protein, and IgA Abundance in Schirmer Strip Extracts from Patients with Primary Sjögren’s Syndrome
Schirmer strip samples were collected from controls and patients with DED and pSS. Total protein concentrations in Schirmer strip extracts measured by BCA assay were slightly higher in DED patients than in controls, whereas pSS patients showed reduced protein concentrations, which were significantly lower than in DED patients (Figure 2A). Within DED subgroups, patients with EDE and MDE also exhibited significantly higher protein concentrations than pSS patients (Figure 2B).
Exploratory stratified analyses according to sex showed significantly higher protein concentrations in Schirmer strip extracts from female patients with DED than from female patients with pSS. This difference was consistently observed across all DED subgroups (ADDE, EDE, and MDE), with the most pronounced elevations detected in EDE and MDE (Figure S1).
In the exploratory age-stratified analyses, individuals with DED aged >50 years, showed significantly higher protein concentrations than patients with pSS in the same age group. Within this age group, pSS patients displayed lower protein concentrations than patients with EDE and MDE. Notably, individuals ≤50 years with MDE exhibited higher protein concentrations than both age-matched controls and patients with MDE >50 years (Figure S2).
Quantification of total IgA, IgA1, and IgA2 by ELISA revealed lower normalized abundance of all three analytes in patients with DED and pSS compared with controls. The most pronounced reductions were observed in pSS, where normalized total IgA and IgA1 abundance was significantly decreased. In contrast, normalized IgA2 abundance was significantly reduced in both DED and pSS, indicating that IgA2 is particularly affected in ocular surface disease (Figure 3A-C). Furthermore, normalized total IgA abundance was significantly lower in pSS than in DED patients. While the IgA1/IgA2 ratio remained largely unchanged in DED, it was moderately increased in pSS, suggesting a relative depletion of IgA2 in this disease entity (Figure 3D).
Analysis of DED subgroups revealed reduced normalized IgA subclass abundance across all clinical subgroups, with the most consistent changes observed for IgA2 (Figure 3E–G). Moreover, pSS patients exhibited significantly lower normalized total IgA abundance than patients with EDE and MDE. Although only modest alterations were observed in the IgA1/IgA2 ratio among DED subtypes, a tendency toward an increased ratio was evident in MDE and pSS (Figure 3H).
Exploratory sex-stratified analyses further highlighted distinct disease-associated patterns. Female patients with pSS and male patients with DED exhibited significantly reduced normalized IgA2 abundance compared with sex-matched controls. In addition, female pSS patients showed a significantly increased IgA1/IgA2 ratio (Figure 4C–D).
Exploratory age-stratified analyses showed differences in normalized total IgA and IgA2 abundance and in the IgA1/IgA2 ratio between controls and disease groups. Among individuals aged >50 years, patients with DED or pSS showed reduced normalized total IgA and IgA2 abundance compared with age-matched controls, accompanied by higher IgA1/IgA2 ratios. In contrast, healthy controls >50 years exhibited higher normalized total IgA and IgA2 abundance and lower IgA1/IgA2 ratios than controls ≤50 years (Figure 5A–D).
Further exploratory subgroup analyses confirmed that female patients with pSS had lower normalized total IgA abundance than female controls and female patients with EDE or MDE (Figure 4E). Furthermore, individuals with MDE aged ≤50 years showed higher normalized total IgA abundance than age-matched controls and patients with ADDE, whereas all disease groups aged >50 years showed lower values than age-matched controls (Figure 5E). A similar pattern was observed for normalized IgA2 abundance, which was significantly reduced in male patients with all DED subgroups, female patients with pSS, and all disease groups >50 years (Figure 4G and Figure 5G). Conversely, controls >50 years exhibited markedly increased normalized IgA2 abundance compared with controls ≤50 years (Figure 5G).
The IgA1/IgA2 ratio further underscored disease-specific alterations. Higher ratios were detected in male patients with MDE and female patients with pSS, as well as in patients with EDE aged ≤50 years and patients with MDE or pSS aged >50 years in the respective comparisons (Figure 4H and Figure 5H).
Exploratory correlation analyses between normalized IgA measurements and clinical parameters revealed several subgroup-specific associations (Figures S3–S7). In controls, age-dependent correlations between OSDI, Schirmer test results, and IgA and IgA subclass abundance were observed. Additional associations were detected between IgA parameters and tear film break-up time (BUT), NEI score, and Lissamine green staining in selected patient subgroups. However, these correlations were generally modest and not uniformly present across disease entities.
Overall, patients with DED showed slightly higher total protein concentrations in Schirmer strip extracts than controls, whereas patients with pSS showed lower protein concentrations than patients with DED. Normalized total IgA, IgA1, and IgA2 abundance differed between controls and disease groups, with reduced normalized IgA2 abundance observed in both DED and pSS. Additional differences were observed in exploratory analyses stratified by DED subtype, sex, and age. Notably, older controls displayed increased normalized IgA2 abundance and lower IgA1/IgA2 ratios, whereas this physiological pattern was absent in DED and pSS, suggesting impaired mucosal immune homeostasis at the ocular surface.
4. Discussion
The present study provides a comprehensive characterization of IgA+ B cells and IgA producing plasmablasts and plasma cells across the human ocular surface and examines IgA subclass profiles in Schirmer strip extracts from controls and patients with DED and pSS. Our findings demonstrate that IgA-producing plasma cells in human subjects are unevenly distributed across ocular surface tissues, being present in the lacrimal gland and conjunctiva, whereas no IgA-producing cells were detected in the examined corneal sections. No evidence of germinal center formation or isolated B cell follicles were observed. CD38++IgA+ plasmablasts and plasma cells were significantly more abundant in the lacrimal gland than in the conjunctiva (ratio: 1.7). In parallel, analysis of Schirmer strip extracts revealed disease-associated alterations in normalized IgA abundance, with normalized IgA2 abundance being significantly reduced in both DED and pSS. These findings provide complementary information on the tissue distribution of IgA-producing cells and alterations in ocular surface IgA profiles in DED and pSS.
Immunofluorescence analysis demonstrated that IgA1- and IgA2-producing B/plasma cells are primarily located in the connective tissue surrounding the acini of the human lacrimal gland and in the subconjunctival connective tissue of the eyelid, whereas such cells were absent in the cornea. This lack of IgA-producing cells in the cornea is consistent with the well-established concept of corneal immune privilege, which restricts local immune cell infiltration to preserve corneal transparency and visual function [29]. Instead, immune surveillance at the ocular surface appears to rely mainly on secretory components of the tear film rather than resident antibody-producing cells within the cornea, similar to mechanisms described in the intestinal mucosa [23].
Within the human lacrimal gland and conjunctiva, CD38++IgA1+ plasmablasts and plasma cells were considerably more abundant than CD38++IgA2+ cells. This distribution closely resembles the systemic pattern observed in blood and in the respiratory mucosa, where IgA1 represents the predominant subtype [30,31]. In contrast, mucosal tissues exposed to high microbial loads, such as the intestinal tract, show a relative enrichment of IgA2 [32,33]. This difference has been attributed to the ability of many intestinal bacteria to produce IgA1-specific proteases that selectively degrade IgA1 while leaving IgA2 intact. As a consequence, IgA2 becomes the dominant protective antibody in environments with intense microbial pressure [32]. The predominance of IgA1 on the ocular surface therefore likely reflects the comparatively low microbial burden of the tear film and ocular surface, as supported by recent microbiome analyses demonstrating sparse commensal populations [34]. Together, these findings suggest that the ocular surface immune system is adapted to a low-microbial-load environment in which IgA1 is sufficient to maintain mucosal defense.
Total protein concentrations measured in Schirmer strip extracts differed between the study groups. Patients with pSS showed lower extract protein concentrations than patients with DED, including the EDE and MDE subgroups. These findings are consistent with the pathophysiology of pSS, in which autoimmune-mediated lymphocytic infiltration progressively damages the lacrimal gland and impairs its secretory function [35,36,37]. In contrast, DED represents a heterogeneous disease in which tear film instability, increased evaporation, and inflammatory processes contribute to ocular surface damage but do not necessarily cause the same degree of lacrimal gland destruction [38]. The markedly reduced protein levels observed in pSS therefore likely reflect severe impairment of lacrimal gland secretion and may contribute to the profound ocular surface pathology characteristic of this condition which is manifested by tissue damage in the lacrimal glands, including damage to the epithelium and lymphocytic infiltration [39].
In addition to differences in total protein, ELISA analysis revealed alterations in normalized total IgA, IgA1, and IgA2 abundance in patients with DED and pSS. Normalized total IgA and IgA1 abundance was significantly reduced in pSS compared with controls, whereas normalized IgA2 abundance was significantly reduced in both DED and pSS. Thus, reduced IgA2 abundance represents a common alteration observed in both disease groups, while pSS was associated with broader changes affecting total IgA and IgA1 as well. These findings indicate that DED and pSS are associated with alterations in the IgA composition of ocular surface samples and suggest that IgA-mediated mucosal immunity may be affected in these diseases.
The reduction in IgA2 is particularly notable, as this immunoglobulin subclass has been associated with pro-inflammatory immune responses and enhanced interaction with immune effector cells [40,41]. In systemic autoimmune diseases such as rheumatoid arthritis, elevated serum IgA2 levels have been reported and are thought to reflect chronic inflammatory activation [42]. Given that both DED and pSS involve inflammatory processes at the ocular surface, one might therefore expect increased rather than decreased IgA2 levels in tear fluid [38,43].
Exploratory analyses stratified by age revealed additional differences in normalized IgA abundance. Controls aged >50 years showed higher normalized total IgA and IgA2 abundance than younger controls, whereas older individuals with DED and pSS showed lower values compared with age-matched controls. This pattern raises the possibility that ocular surface IgA profiles change with age and that these changes may differ in the presence of ocular surface disease. Age-related changes in mucosal immunity have been described in other tissues and may involve alterations in immune cell composition, epithelial function, and antibody production. Further investigation of age-related changes in ocular IgA immunity may therefore provide insight into the increasing prevalence of ocular surface disease with advancing age.
Several biological processes could contribute to the reduced normalized IgA abundance observed in DED and pSS. One possibility is that changes in the local abundance or activity of IgA-producing plasma cells affect the amount of IgA reaching the ocular surface. In particular, a reduced number of IgA2-producing cells or decreased antibody secretion by individual cells could contribute to the lower IgA2 abundance observed in Schirmer strip extracts (Figure 6). Alternatively, locally produced IgA may interact with immune cells within lacrimal gland or conjunctival tissues. IgA can bind to FcαRI expressed by immune cells such as neutrophils and macrophages and thereby modulate inflammatory responses [40]. Such local interactions could potentially influence the distribution and availability of IgA during ocular surface inflammation, although their relevance to the observed IgA subclass profiles remains to be determined.
Another potential mechanism involves epithelial transport of IgA. Polymeric IgA produced by plasma cells is transported across epithelial barriers by the polymeric immunoglobulin receptor (pIgR) and subsequently released as secretory IgA. pIgR expression is regulated by inflammatory cytokines, including IFN-γ, TNF-α, and IL-4 [44,45,46], which are altered in the tear film and ocular surface tissues of patients with DED and pSS [47,48,49]. Changes in pIgR expression, localization, or function, as well as alterations in epithelial integrity, could therefore affect IgA transcytosis and the amount of IgA reaching the tear film. In addition, increased degradation or reduced stability of IgA may contribute to lower IgA abundance. Elevated cathepsin S activity, as reported in Sjögren’s syndrome[50], may promote degradation of secretory IgA and thus represents another potential mechanism. Finally, chronic inflammation and tissue damage within the lacrimal gland could affect local plasma cell survival niches and thereby alter the maintenance of IgA-producing plasma cells (Figure 6). Together, changes in plasma cell abundance or secretion, local IgA interactions, epithelial transport, and extracellular stability represent potential mechanisms that may contribute to altered IgA homeostasis in DED and pSS.
Alterations in IgA abundance may have functional consequences for ocular surface immunity. Secretory IgA plays a central role in mucosal defense by neutralizing pathogens, preventing microbial adhesion to epithelial surfaces, and facilitating immune exclusion [32]. Changes in the amount or subclass composition of IgA reaching the ocular surface could therefore affect the protective capacity of the tear film and modify interactions between microorganisms, epithelial cells, and the local immune system. Reduced IgA-mediated protection may be particularly relevant in conditions characterized by impaired epithelial barrier function and chronic inflammation, such as DED and pSS. Understanding how IgA production, transport, and stability are regulated at the ocular surface may therefore provide further insight into mucosal immune alterations associated with these diseases.
From a translational perspective, these findings highlight the potential importance of restoring mucosal immune balance in ocular surface disease. Therapeutic strategies aimed at enhancing IgA secretion or restoring pIgR-mediated transport could represent novel approaches for treating DED and pSS. Similar strategies have been explored in other mucosal tissues, where modulation of IgA responses has shown promise in restoring immune homeostasis [51,52]. Whether comparable approaches could be applied to the ocular surface remains an intriguing question for future research.
The present findings extend previous studies demonstrating local IgA production and IgA-producing B/plasma cells in human ocular tissues by combining tissue-based characterization of IgA subclasses with the analysis of disease-associated IgA profiles in Schirmer strip extracts. Previous studies have established the presence of IgA1- and IgA2-producing cells within the lacrimal gland and the contribution of ocular-associated lymphoid tissues to local secretory IgA immunity[21,22]. The present study adds to this knowledge by characterizing the relative distribution of IgA subclass-producing cells across several ocular surface-associated tissues and by demonstrating reduced normalized IgA2 abundance in Schirmer strip extracts from patients with both DED and pSS. Rather than indicating an isolated alteration of a single IgA subclass, the findings suggest broader changes in ocular surface IgA homeostasis, particularly in pSS. Future studies addressing the mechanisms controlling IgA production, epithelial transport, and extracellular stability may therefore improve our understanding of mucosal immune regulation in ocular surface disease.
Our findings therefore provide new insights into the immunopathophysiology of DED and pSS and highlight the ocular surface IgA system as a potentially relevant target for future diagnostic and therapeutic strategies.
Several limitations should be acknowledged. Direct quantification and phenotypic characterization of IgA-producing B/plasma cells in lacrimal gland tissue from patients with DED or pSS would further strengthen the mechanistic interpretation of our findings and provide valuable information regarding disease-associated changes in B cell distribution as well as the balance between IgA1- and IgA2-producing cells. However, access to human lacrimal gland tissue from well-characterized patients is highly limited, and tissues obtained from body donors are often unsuitable for detailed immunological analyses. Furthermore, ocular tissue and tear samples were obtained from different individuals, preventing a direct association between tissue IgA-producing cell populations and tear IgA profiles. Different Schirmer strip manufacturers were used for controls and patients with DED and pSS, which may have influenced protein and IgA recovery despite normalization to total protein. In addition, the ELISAs quantified total IgA and its subclasses but did not distinguish secretory from serum-derived IgA. Finally, differences in age and sex distribution and the relatively small size of some subgroups limit the interpretation of the stratified analyses, which should therefore be considered exploratory. Future advances in human lacrimal gland organoid technology, ex vivo tissue culture systems, and single-cell approaches, together with larger and more standardized clinical studies, may help overcome these limitations and provide a more comprehensive understanding of IgA regulation and mucosal immune dysfunction at the ocular surface[53,54,55,56,57].
5. Conclusions
This study demonstrates the presence of IgA-producing plasma cells in human lacrimal gland and conjunctival tissues, with IgA1-producing cells predominating over IgA2-producing cells. In Schirmer strip extracts, patients with DED and pSS showed altered normalized IgA subclass profiles, with reduced normalized IgA2 abundance representing the most consistent finding across the analyzed disease groups. Together, these findings provide further insight into local IgA-mediated mucosal immunity at the ocular surface and suggest that IgA homeostasis may be altered in DED and pSS. Further studies are needed to determine whether these changes result from alterations in plasma cell abundance or function, epithelial IgA transport, or IgA stability and degradation.
Supplementary Materials
The following supporting information can be downloaded at the website of this paper posted on Preprints.org, Figure S1: Total protein concentrations in Schirmer strip extracts from controls and patients with DED and pSS, stratified by sex; Figure S2: Total protein concentrations in Schirmer strip extracts from controls and patients with DED and pSS, stratified by age; Figure S3: Correlation analyses of normalized IgA parameters in Schirmer strip extracts and OSDI scores, stratified by age; Figure S4: Correlation analyses of normalized IgA parameters in Schirmer strip extracts and Schirmer test values, stratified by age; Figure S5: Correlation analyses of normalized IgA parameters in Schirmer strip extracts and tear film break-up time (BUT), stratified by age; Figure S6: Correlation analyses of normalized IgA parameters in Schirmer strip extracts and NEI corneal staining scores, stratified by age; Figure S7: Correlation analyses of normalized IgA parameters in Schirmer strip extracts and Lissamine green staining scores, stratified by age.
Author Contributions
Conceptualization, N.S. and F.P.; methodology, N.S.; validation, N.S.; formal analysis, N.S.; investigation, N.S.; resources, F.P. and J.H-W.; data curation, N.S.; writing—original draft preparation, N.S. and F.P.; writing—review and editing, all authors; visualization, N.S.; supervision, F.P. and W.S.; project administration, F.P. and K.J.; funding acquisition, F.P. All authors have read and agreed to the published version of the manuscript.
Funding
This research was funded by Deutsche Forschungsgemeinschaft (DFG, German Research Foundation), grant number PA738/15-2.
Institutional Review Board Statement
The study was conducted in accordance with the Declaration of Helsinki, and approved by the Ethics Committee of Friedrich-Alexander-Universität Erlangen-Nürnberg (protocol code: 25-273-B; date of approval: 01.09.2025) and Medizinische Universität Graz (protocol code: 32-015 ex 19/20; date of approval: 04.08.2023).
Informed Consent Statement
Informed consent was obtained from all subjects involved in the study.Data Availability Statement: The raw data supporting the conclusion of this article will be made available by the authors, without undue reservation.
Acknowledgments
The authors wish to sincerely thank those who donated their bodies to science so that anatomical research could be performed. Results from such research can potentially improve patient care and increase mankind’s overall knowledge. Therefore, these donors and their families deserve our highest gratitude. In addition, the authors gratefully acknowledge the valuable support provided by Hong Nguyen, Maike Hemmerlein and Jörg Pekarsky (Figure 6). The present work was performed in fulfillment of the requirements of obtaining the degree Dr. rer. nat. (N.S.).
Conflicts of Interest
The authors declare no conflicts of interest.
Abbreviations
The following abbreviations are used in this manuscript:
| DED | Dry eye disease |
| pSS | Primary Sjögrens’s syndrome |
| IgA | Immunoglobulin A |
| EDE | Evaporative dry eye |
| ADDE | Aqueous-deficient dry eye |
| MDE | Mixed form of dry eye |
| pIgR | Polymeric immunoglobulin receptor |
| PFA | Paraformaldehyde |
| TBS-T | Tris-buffered saline containing Tween 20 |
| OSDI | Ocular surface disease index |
| MGD | Meibomian gland dysfunction |
| BUT | Break-up time |
| NEI | National eye institute corneal fluorescein staining score |
| LG | Lacrimal gland |
| Conj. | Conjunctiva |
| C | Cornea |
| IFN- γ | Interferon- γ |
| TNF- α | Tumor necrosis factor- α |
| IL-4 | Interleukin-4 |
References
- Messmer, E. Diagnose und Therapie des trockenen Auges. 3. Aufl; UNI-MED Verlag AG: Bremen, London, Boston, 2021. [Google Scholar]
- Bjordal, O.; Norheim, K.B.; Rødahl, E.; Jonsson, R.; Omdal, R. Primary Sjögren's syndrome and the eye. Surv. Ophthalmol. 2020, 65(2), 119–32. [Google Scholar] [CrossRef] [PubMed]
- Balasubramanian, S.A.; Pye, D.C.; Willcox, M.D.P. Levels of lactoferrin, secretory IgA and serum albumin in the tear film of people with keratoconus. Exp. Eye Res. 2012, 96(1), 132–7. [Google Scholar] [CrossRef] [PubMed]
- Martinez-Carrasco, R.; Argüeso, P.; Fini, M.E. Membrane-associated mucins of the human ocular surface in health and disease. Ocul. Surf. 2021, 21, 313–30. [Google Scholar] [CrossRef] [PubMed]
- Paulsen, F.P.; Berry, M.S. Mucins and TFF peptides of the tear film and lacrimal apparatus. Prog. Histochem. Cytochem. 2006, 41(1), 1–53. [Google Scholar] [CrossRef] [PubMed]
- Singh, S.; Donthineni, P.R.; Srivastav, S.; Jacobi, C.; Basu, S.; Paulsen, F. Lacrimal and meibomian gland evaluation in dry eye disease: A mini-review. Indian J. Ophthalmol. 2023, 71(4), 1090–8. [Google Scholar] [CrossRef] [PubMed]
- Craig, J.P.; Nichols, K.K.; Akpek, E.K.; Caffery, B.; Dua, H.S.; Joo, C.-K.; Liu, Z.; Nelson, J.D.; Nichols, J.J.; Tsubota, K.; Stapleton, F. TFOS DEWS II Definition and Classification Report. Ocul. Surf. 2017, 15(3), 276–83. [Google Scholar] [CrossRef] [PubMed]
- Grubbs, J.R.; Tolleson-Rinehart, S.; Huynh, K.; Davis, R.M. A review of quality of life measures in dry eye questionnaires. Cornea 2014, 33(2), 215–8. [Google Scholar] [CrossRef] [PubMed]
- Liu, Y.; Butovich, I.A.; Garreis, F.; Zahn, I.; Scholz, M.; Gaffling, S.; Jabari, S.; Dietrich, J.; Paulsen, F. Comparative Characterization of Human Meibomian Glands, Free Sebaceous Glands, and Hair-Associated Sebaceous Glands Based on Biomarkers, Analysis of Secretion Composition, and Gland Morphology. Int. J. Mol. Sci. 2024, 25(6). [Google Scholar] [CrossRef] [PubMed]
- Rolando, M.; Merayo-Lloves, J. Management Strategies for Evaporative Dry Eye Disease and Future Perspective. Curr. Eye Res. 2022, 47(6), 813–23. [Google Scholar] [CrossRef] [PubMed]
- Vidal-Rohr, M.; Craig, J.P.; Davies, L.N.; Wolffsohn, J.S. Classification of dry eye disease subtypes. Contact lens & anterior eye the journal of the British Contact Lens Association 2024, 47(5), 102257. [Google Scholar] [CrossRef] [PubMed]
- Cornec, D.; Devauchelle-Pensec, V.; Tobón, G.J.; Pers, J.-O.; Jousse-Joulin, S.; Saraux, A. B cells in Sjögren's syndrome: from pathophysiology to diagnosis and treatment. J. Autoimmun. 2012, 39(3), 161–7. [Google Scholar] [CrossRef] [PubMed]
- Chang, L.; Zheng, Z.; Zhou, Y.; Liu, K.; Li, Y.; Zhong, B.; Zhao, Z.; Chen, C.; Qian, C.; Ni, Q.; Zou, Q.; Wu, Y.; Li, J.; Zou, L. B cell receptor repertoire analysis in primary Sjogren's syndrome salivary glands identifies repertoire features associated with clinical activity. Arthritis Res. Ther. 2024, 26(1), 62. [Google Scholar] [CrossRef] [PubMed]
- de Paiva, C.S.; St Leger, A.J.; Caspi, R.R. Mucosal immunology of the ocular surface. Mucosal Immunol. 2022, 15(6), 1143–57. [Google Scholar] [CrossRef] [PubMed]
- de, Sousa-Pereira P; Woof, J.M. IgA: Structure, Function, and Developability. Antibodies 2019, 8(4). [Google Scholar] [CrossRef] [PubMed]
- Mes, L.; Steffen, U.; Chen, H.-J.; Veth, J.; Hoepel, W.; Griffith, G.R.; Schett, G.; den , Dunnen J. IgA2 immune complexes selectively promote inflammation by human CD103+ dendritic cells. Front. Immunol. 2023, 14, 1116435. [Google Scholar] [CrossRef] [PubMed]
- Steffen, U.; Koeleman, C.A.; Sokolova, M.V.; Bang, H.; Kleyer, A.; Rech, J.; Unterweger, H.; Schicht, M.; Garreis, F.; Hahn, J.; Andes, F.T.; Hartmann, F.; Hahn, M.; Mahajan, A.; Paulsen, F.; Hoffmann, M.; Lochnit, G.; Muñoz, L.E.; Wuhrer, M.; Falck, D.; Herrmann, M.; Schett, G. IgA subclasses have different effector functions associated with distinct glycosylation profiles. Nat. Commun. 2020, 11(1), 120. [Google Scholar] [CrossRef] [PubMed]
- Bertrand, Y.; Sánchez-Montalvo, A.; Hox, V.; Froidure, A.; Pilette, C. IgA-producing B cells in lung homeostasis and disease. Front. Immunol. 2023, 14, 1117749. [Google Scholar] [CrossRef] [PubMed]
- Chiba, M.; Ohta, H.; Yagisawa, H.; Masamune, O. IgA1 & IgA2 distribution in the intestine. Gastroenterol. Jpn. 1987, 22(1), 18–23. [Google Scholar] [CrossRef]
- Franklin, R.M.; McGee, D.W.; Shepard, K.F. Lacrimal gland-directed B cell responses. J. Immunol. 1985, 135(1), 95–9. [Google Scholar] [CrossRef]
- Knop, E.; Knop, N.; Claus, P. Local production of secretory IgA in the eye-associated lymphoid tissue (EALT) of the normal human ocular surface. Investig. Ophthalmol. Vis. Sci. 2008, 49(6), 2322–9. [Google Scholar] [CrossRef] [PubMed]
- Ono, M.; Yoshino, K.; Tsubota, K.; Saito, I. Subclass expression of IgA in lacrimal glands of patients with Sjögren's syndrome. Adv. Exp. Med. Biol. 1994, 350, 185–8. [Google Scholar] [CrossRef] [PubMed]
- Pracht, K.; Wittner, J.; Kagerer, F.; Jäck, H.-M.; Schuh, W. The intestine: A highly dynamic microenvironment for IgA plasma cells. Front. Immunol. 2023, 14, 1114348. [Google Scholar] [CrossRef] [PubMed]
- Seikrit, C.; Pabst, O. The immune landscape of IgA induction in the gut. Semin. Immunopathol. 2021, 43(5), 627–37. [Google Scholar] [CrossRef] [PubMed]
- Schuh, W.; Mielenz, D.; Jäck, H.-M. Unraveling the mysteries of plasma cells. Adv. Immunol. 2020, 146, 57–107. [Google Scholar] [CrossRef] [PubMed]
- Wolffsohn, J.S.; Arita, R.; Chalmers, R.; Djalilian, A.; Dogru, M.; Dumbleton, K.; Gupta, P.K.; Karpecki, P.; Lazreg, S.; Pult, H.; Sullivan, B.D.; Tomlinson, A.; Tong, L.; Villani, E.; Yoon, K.C.; Jones, L.; Craig, J.P. TFOS DEWS II Diagnostic Methodology report. Ocul. Surf. 2017, 15(3), 539–74. [Google Scholar] [CrossRef] [PubMed]
- Shiboski, C.H.; Shiboski, S.C.; Seror, R.; Criswell, L.A.; Labetoulle, M.; Lietman, T.M.; Rasmussen, A.; Scofield, H.; Vitali, C.; Bowman, S.J.; Mariette, X. 2016 American College of Rheumatology/European League Against Rheumatism Classification Criteria for Primary Sjögren's Syndrome: A Consensus and Data-Driven Methodology Involving Three International Patient Cohorts. Arthritis Rheumatol. 2017, 69(1), 35–45. [Google Scholar] [CrossRef] [PubMed]
- Posa, A.; Bräuer, L.; Schicht, M.; Garreis, F.; Beileke, S.; Paulsen, F. Schirmer strip vs. capillary tube method: non-invasive methods of obtaining proteins from tear fluid. Ann. Anat. Anat. Anz. Off. Organ Anat. Ges. 2013, 195(2), 137–42. [Google Scholar] [CrossRef] [PubMed]
- Niederkorn, J.Y. Immune privilege in the anterior chamber of the eye. Crit. Rev. Immunol. 2002, 22(1), 13–46. [Google Scholar] [CrossRef]
- Woof, J.M.; Russell, M.W. Structure and function relationships in IgA. Mucosal Immunol. 2011, 4(6), 590–7. [Google Scholar] [CrossRef] [PubMed]
- Cerutti, A.; Rescigno, M. The biology of intestinal immunoglobulin A responses. Immunity 2008, 28(6), 740–50. [Google Scholar] [CrossRef] [PubMed]
- Brandtzaeg, P. Secretory IgA: Designed for Anti-Microbial Defense. Front. Immunol. 2013, 4, 222. [Google Scholar] [CrossRef] [PubMed]
- Macpherson, A.J.; McCoy, K.D.; Johansen, F.-E.; Brandtzaeg, P. The immune geography of IgA induction and function. Mucosal Immunol. 2008, 1(1), 11–22. [Google Scholar] [CrossRef] [PubMed]
- Dong, Q.; Brulc, J.M.; Iovieno, A.; Bates, B.; Garoutte, A.; Miller, D.; Revanna, K.V.; Gao, X.; Antonopoulos, D.A.; Slepak, V.Z.; Shestopalov, V.I. Diversity of bacteria at healthy human conjunctiva. Investig. Ophthalmol. Vis. Sci. 2011, 52(8), 5408–13. [Google Scholar] [CrossRef] [PubMed]
- Parkin, B.; Chew, J.B.; White, V.A.; Garcia-Briones, G.; Chhanabhai, M.; Rootman, J. Lymphocytic infiltration and enlargement of the lacrimal glands: a new subtype of primary Sjögren's syndrome? Ophthalmology 2005, 112(11), 2040–7. [Google Scholar] [PubMed]
- Jonsson, R. Disease mechanisms in Sjögren's syndrome: What do we know? Scand. J. Immunol. 2022, 95(3), e13145. [Google Scholar] [CrossRef] [PubMed]
- Meng, Q.; Ma, J.; Cui, J.; Gu, Y.; Shan, Y. Subpopulation dynamics of T and B lymphocytes in Sjögren's syndrome: implications for disease activity and treatment. Front. Immunol. 2024, 15, 1468469. [Google Scholar] [CrossRef] [PubMed]
- Pflugfelder, S.C.; Stern, M.E. Biological functions of tear film. Exp. Eye Res. 2020, 197, 108115. [Google Scholar] [CrossRef] [PubMed]
- Gupta, S.; Ploumakis, A.; Kalavros, N.; Masli, S. Spatial transcriptomic profiling identifies lacrimal-gland-epithelial cell-driven mechanisms underlying autoimmunity in Sjögren's disease. Front. Immunol. 2026, 17, 1759347. [Google Scholar] [CrossRef] [PubMed]
- Monteiro, R.C.; van de Winkel, J.G.J. IgA Fc receptors. Annu. Rev. Immunol. 2003, 21, 177–204. [Google Scholar] [CrossRef] [PubMed]
- van Gool, M.M.J.; van Egmond, M. IgA and FcαRI: Versatile Players in Homeostasis, Infection, and Autoimmunity. ImmunoTargets Ther. 2020, 9, 351–72. [Google Scholar] [CrossRef] [PubMed]
- Derksen, V.F.A.M.; Allaart, C.F.; van der Helm-Van Mil, A.H.M.; Huizinga, T.W.J.; Toes, R.E.M.; van der Woude, D. In rheumatoid arthritis patients, total IgA1 and IgA2 levels are elevated: implications for the mucosal origin hypothesis. Rheumatology 2022, 62(1), 407–16. [Google Scholar] [CrossRef] [PubMed]
- Lemp, M.A.; Baudouin, C.; Baum, J.; Dogru, M.; Foulks, G.N.; Kinoshita, S.; Laibson, P.; McCulley, J.; Murube, J.; Pflugfelder, S.C.; Rolando, M.; Toda, I. The definition and classification of dry eye disease: report of the Definition and Classification Subcommittee of the International Dry Eye WorkShop (2007). Ocul. Surf. 2007, 5(2), 75–92. [Google Scholar] [CrossRef] [PubMed]
- Liu, D.Y.; Wang, X.L.; Liu, P. Tumor necrosis factor-alpha upregulates the expression of immunoglobulin secretory component. J. Investig. Allergol. Clin. Immunol. 2007, 17(2), 101–6. [Google Scholar] [PubMed]
- Denning, G.M. IL-4 and IFN-gamma synergistically increase total polymeric IgA receptor levels in human intestinal epithelial cells. Role of protein tyrosine kinases. J. Immunol. 1996, 156(12), 4807–14. [Google Scholar] [CrossRef]
- Phillips, J.O.; Everson, M.P.; Moldoveanu, Z.; Lue, C.; Mestecky, J. Synergistic effect of IL-4 and IFN-gamma on the expression of polymeric Ig receptor (secretory component) and IgA binding by human epithelial cells. J. Immunol. 1990, 145(6), 1740–4. [Google Scholar] [CrossRef]
- Lee, S.Y.; Han, S.J.; Nam, S.M.; Yoon, S.C.; Ahn, J.M.; Kim, T.-I.; Kim, E.K.; Seo, K.Y. Analysis of tear cytokines and clinical correlations in Sjögren syndrome dry eye patients and non-Sjögren syndrome dry eye patients. Am. J. Ophthalmol. 2013, 156(2), 247–253.e1. [Google Scholar] [CrossRef] [PubMed]
- Li, J.; Liu, Y.; Liu, Z.; Li, X. Tear cytokine levels in Sjogren's syndrome-related dry eye disease compared with non-Sjogren's syndrome-related dry eye disease patients: A meta-analysis. Medicine 2024, 103(49), e40669. [Google Scholar] [CrossRef] [PubMed]
- Ahmed, S.; Safille, S.; Clifton, V.; Sharma, S.; de Paiva, C.S.; Sharma, A. A comprehensive review of tear fluid proteome alterations in dry eye disease: Insights into pathophysiology and biomarker potential. Ocul. Surf. 2026, 40, 71–85. [Google Scholar] [CrossRef] [PubMed]
- Edman, M.C.; Janga, S.R.; Meng, Z.; Bechtold, M.; Chen, A.F.; Kim, C.; Naman, L.; Sarma, A.; Teekappanavar, N.; Kim, A.Y.; Madrigal, S.; Singh, S.; Ortiz, E.; Christianakis, S.; Arkfeld, D.G.; Mack, W.J.; Heur, M.; Stohl, W.; Hamm-Alvarez, S.F. Increased Cathepsin S activity associated with decreased protease inhibitory capacity contributes to altered tear proteins in Sjögren's Syndrome patients. Sci. Rep. 2018, 8(1), 11044. [Google Scholar] [CrossRef] [PubMed]
- Mora, J.R.; Andrian, U.H.; von. Differentiation and homing of IgA-secreting cells. Mucosal Immunol. 2008, 1(2), 96–109. [Google Scholar] [CrossRef] [PubMed]
- Pabst, O.; Mowat, A.M. Oral tolerance to food protein. Mucosal Immunol. 2012, 5(3), 232–9. [Google Scholar] [CrossRef] [PubMed]
- Tiwari, S.; Nair, R.M.; Vamadevan, P.; Ali, M.J.; Naik, M.N.; Honavar, S.G.; Vemuganti, G.K. Establishing and characterizing lacrispheres from human lacrimal gland for potential clinical application. Graefe's archive for clinical and experimental ophthalmology = Albrecht von Graefes Archiv fur klinische und experimentelle Ophthalmologie 2018, 256(4), 717–27. [Google Scholar] [CrossRef] [PubMed]
- Lin, H.; Liu, Y.; Yiu, S. Three Dimensional Culture of Potential Epithelial Progenitor Cells in Human Lacrimal Gland. Transl. Vis. Sci. Technol. 2019, 8(4), 32. [Google Scholar] [CrossRef] [PubMed]
- Abdal Dayem, A.; Bin Jang, S.; Lim, N.; Yeo, H.C.; Kwak, Y.; Lee, S.-H.; Shin, H.J.; Cho, S.-G. Advances in lacrimal gland organoid development: Techniques and therapeutic applications. Biomed. Pharmacother. Biomed. Pharmacother. 2025, 183, 117870. [Google Scholar] [CrossRef] [PubMed]
- Siddiqui, M.G.; LaPointe, V.L.; Dickman, M.M.; Basu, S.; Singh, V.; Singh, S. Lacrimal gland organoids: A systematic review on development, characterization, molecular profiling and translational potential in dry eye disease. Exp. Eye Res. 2026, 267, 110956. [Google Scholar] [CrossRef] [PubMed]
- Hayashi, R.; Okubo, T.; Kudo, Y.; Ishikawa, Y.; Imaizumi, T.; Suzuki, K.; Shibata, S.; Katayama, T.; Park, S.-J.; Young, R.D.; Quantock, A.J.; Nishida, K. Generation of 3D lacrimal gland organoids from human pluripotent stem cells. Nature 2022, 605(7908), 126–31. [Google Scholar] [CrossRef] [PubMed]
Figure 1.
Immunofluorescence detection and quantification of IgA-, IgA1- and IgA2-producing B/plasma cells in the human lacrimal gland, conjunctiva and cornea. (A) Representative immunofluorescence images of CD38-+IgA+ B cells and CD38++IgA+ plasmablasts and plasma cells in the lacrimal gland (A1–A3), eyelid with conjunctiva (A4–A6), and cornea with corneal epithelium (A7–A9). Images were obtained from sections of different body donors (Table 1). Insets show higher-magnification views. Arrowheads indicate representative IgA-producing cells. Scale bar: 20 µm. (B-C) Quantification of CD38++IgA+ plasmablasts and plasma cells and CD38-+IgA+ B cells in the lacrimal gland (LG), eyelid with conjunctiva (Conj), and in the cornea (C), presented as cell counts. (D-E) Quantification of IgA1- versus IgA2-producing B/plasma cells in the LG, Conj and C, expressed as the percentage of the corresponding IgA-producing cell population. For each donor, one tissue section was analyzed, and each data point represents the mean value obtained from three fields imaged at 40x magnification. The entire corneal section was additionally systematically examined for the presence of IgA-producing cells.
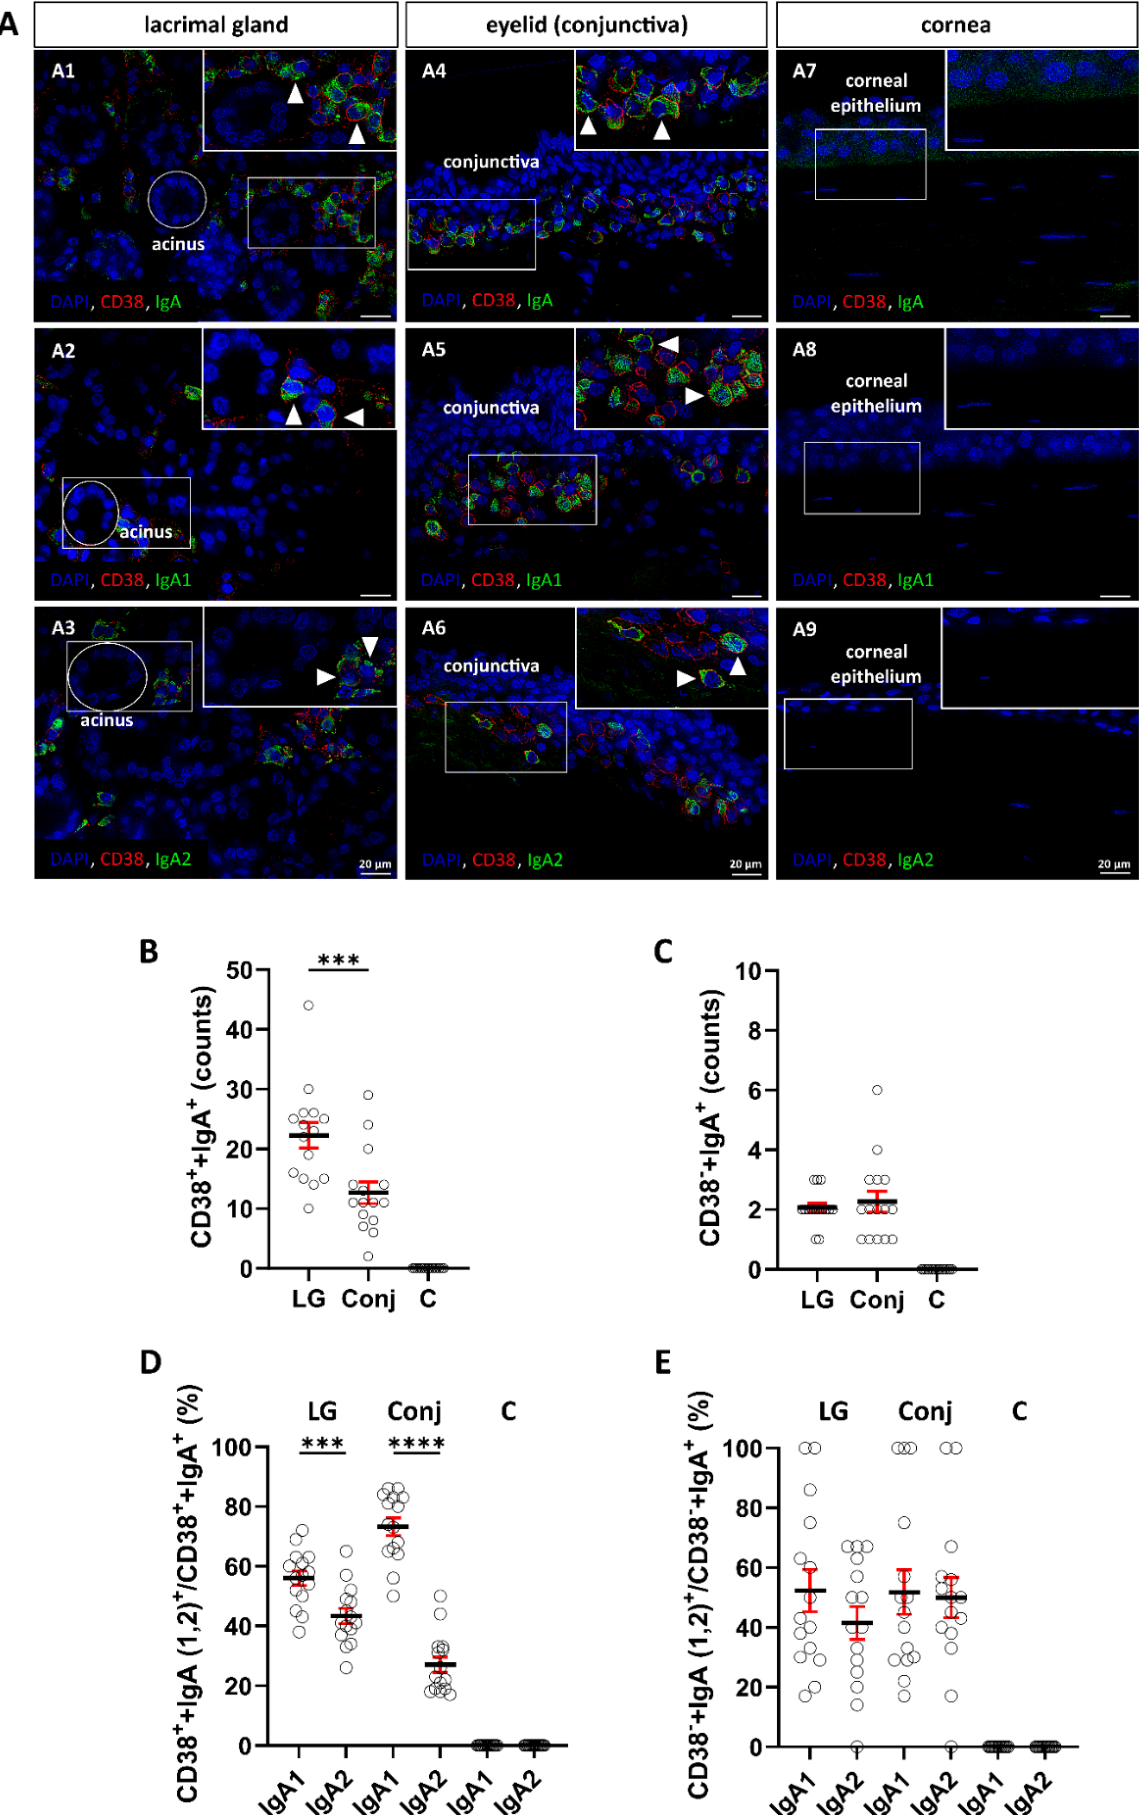
Figure 2.
Total protein concentrations in Schirmer strip extracts from controls and patients with DED and pSS. (A) Total protein concentrations in Schirmer strip extracts from controls and patients with DED or pSS. Protein concentrations were significantly higher in patients with DED than in patients with pSS. (B) Subgroup analysis showing significantly higher protein concentrations in EDE and MDE patients compared to pSS patients. Each data point represents the total protein concentration measured in the Schirmer strip extract of an individual participant.
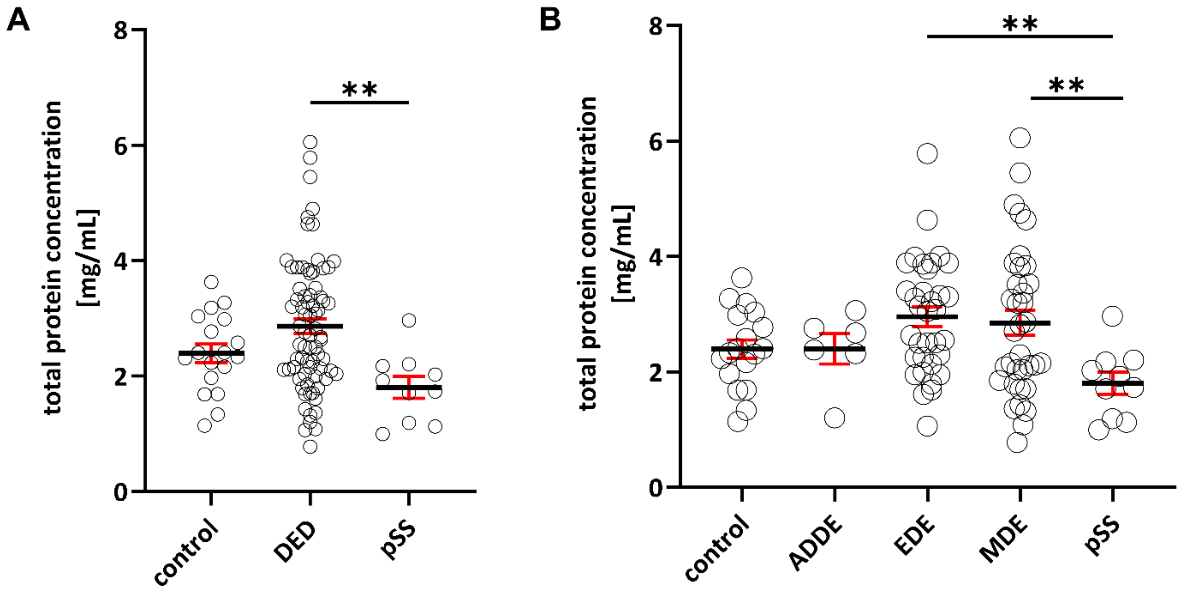
Figure 3.
ELISA analysis of total IgA, IgA1 and IgA2 in Schirmer strip extracts normalized to total protein content. (A–D) Normalized total IgA, IgA1, and IgA2 abundance and the IgA1/IgA2 ratio in controls, DED, and pSS patients. Patients with pSS showed significantly reduced normalized total IgA, IgA1, and IgA2 abundance compared with controls, whereas normalized IgA2 abundance was also significantly reduced in patients with DED. (E–H) Analysis of DED subgroups demonstrated a reduction of normalized IgA2 abundance across all disease groups, whereas reductions in normalized total IgA and IgA1 abundance was primarily observed in ADDE and pSS. Patients with pSS additionally showed significantly lower normalized total IgA abundance than patients with EDE and MDE. Each data point represents an individual participant.
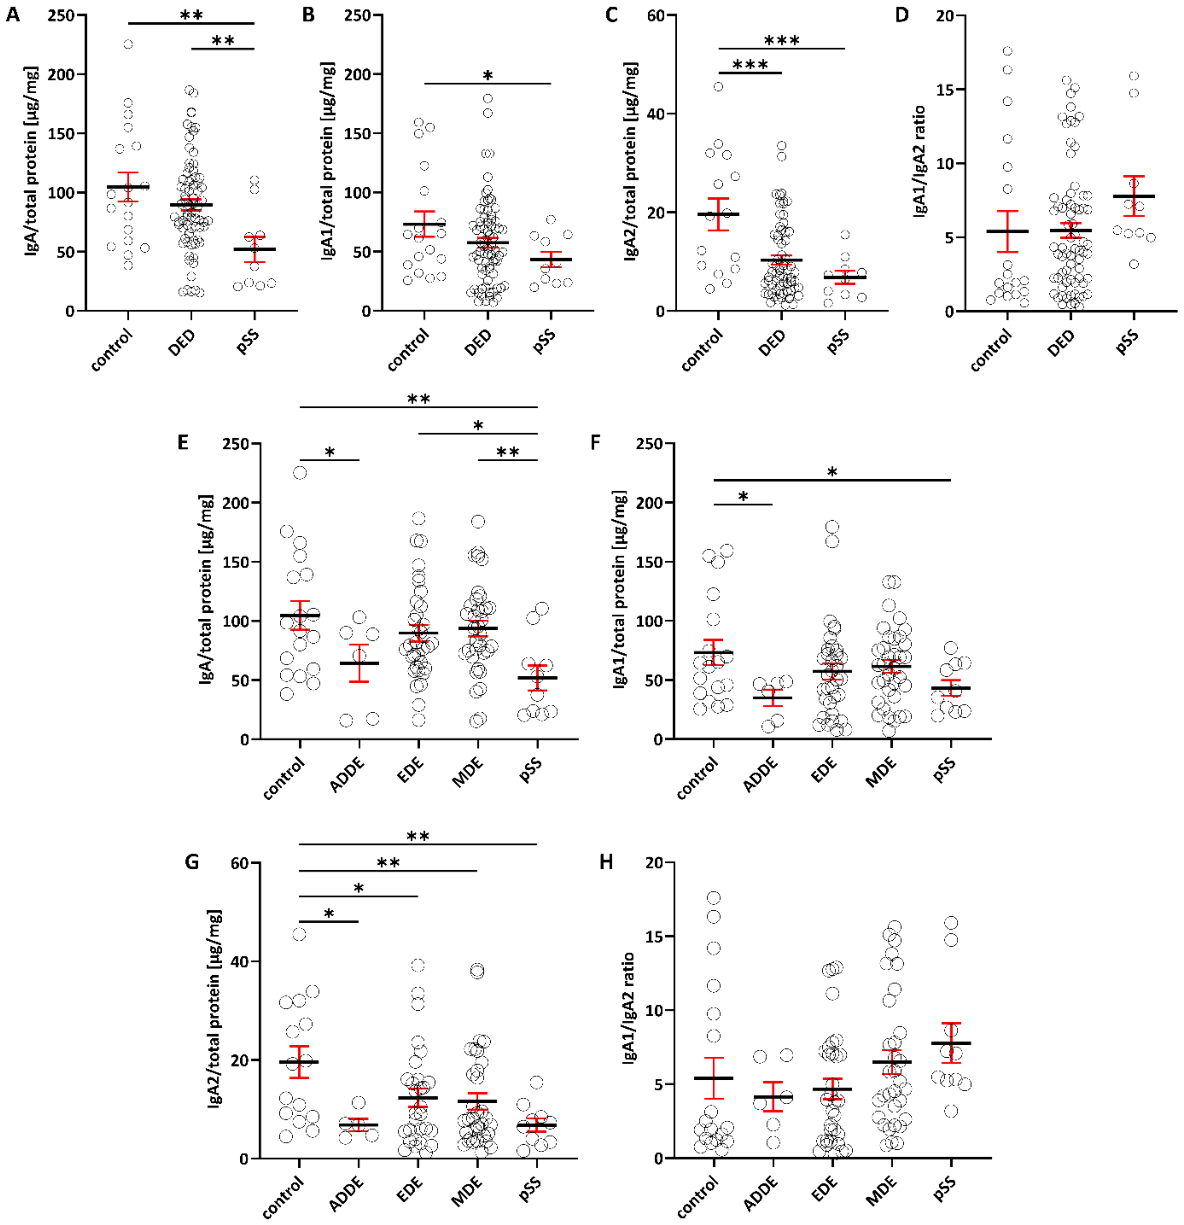
Figure 4.
ELISA analysis of total IgA, IgA1, and IgA2 in Schirmer strip extracts normalized to total protein content, stratified by sex. (A–D) Exploratory sex-stratified analysis of normalized total IgA, IgA1, and IgA2 abundance and the IgA1/IgA2 ratio in controls and patients with DED or pSS. Female patients with pSS and male patients with DED showed significantly reduced normalized IgA2 abundance compared with the respective sex-matched controls. Female patients with pSS additionally exhibited an increased IgA1/IgA2 ratio. (E–H) Female patients with pSS and male patients with DED showed significantly reduced normalized IgA2 abundance compared with the respective sex-matched controls. Normalized total IgA abundance was significantly lower in female patients with pSS than in female controls and female patients with EDE or MDE. Elevated IgA1/IgA2 ratios were observed in female patients with pSS and male patients with MDE in the respective comparisons. Each data point represents an individual participant.
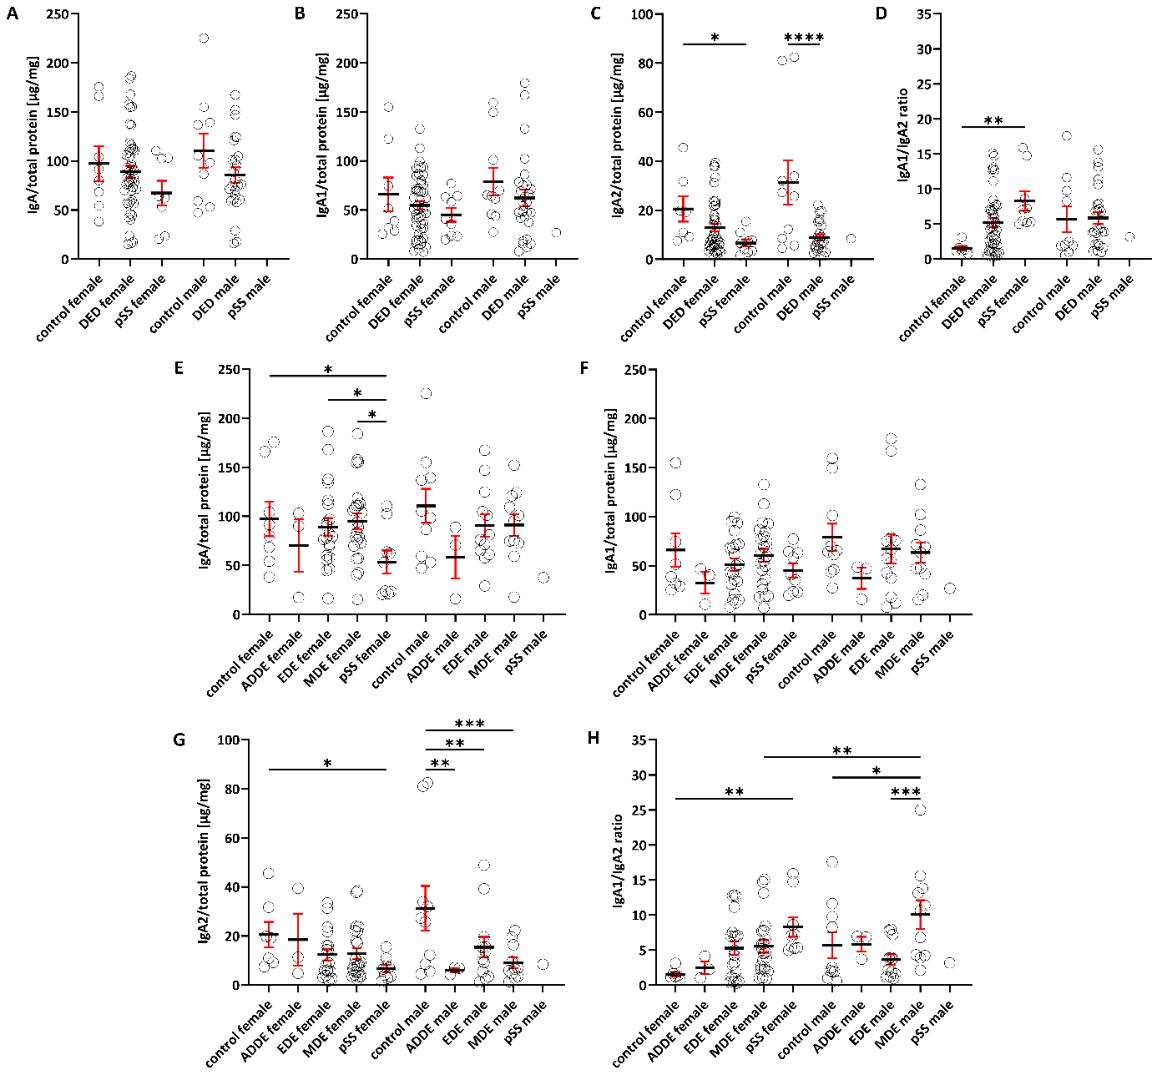
Figure 5.
ELISA analysis of total IgA, IgA1, and IgA2 in Schirmer strip extracts normalized to total protein content, stratified by age. (A–D) Exploratory age-stratified analysis of normalized total IgA, IgA1, and IgA2 abundance and the IgA1/IgA2 ratio in controls and patients with DED or pSS. Among individuals aged >50 years, patients with DED or pSS showed significantly reduced normalized total IgA and IgA2 abundance compared with age-matched controls. Controls aged >50 years showed higher normalized total IgA and IgA2 abundance than controls aged ≤50 years. Higher IgA1/IgA2 ratios were observed in patients with DED and pSS aged >50 years compared with age-matched controls. (E–H) Exploratory analysis of DED subgroups stratified by age showed reduced normalized total IgA and IgA2 abundance in disease groups aged >50 years in the respective comparisons, whereas patients with MDE aged ≤50 years showed higher normalized total IgA abundance in selected comparisons. Controls >50 years exhibited the highest normalized total IgA and IgA2 abundance, while pSS patients showed the lowest abundance overall. Differences in the IgA1/IgA2 ratio were additionally observed between individual age- and disease-stratified groups. Each data point represents an individual participant.
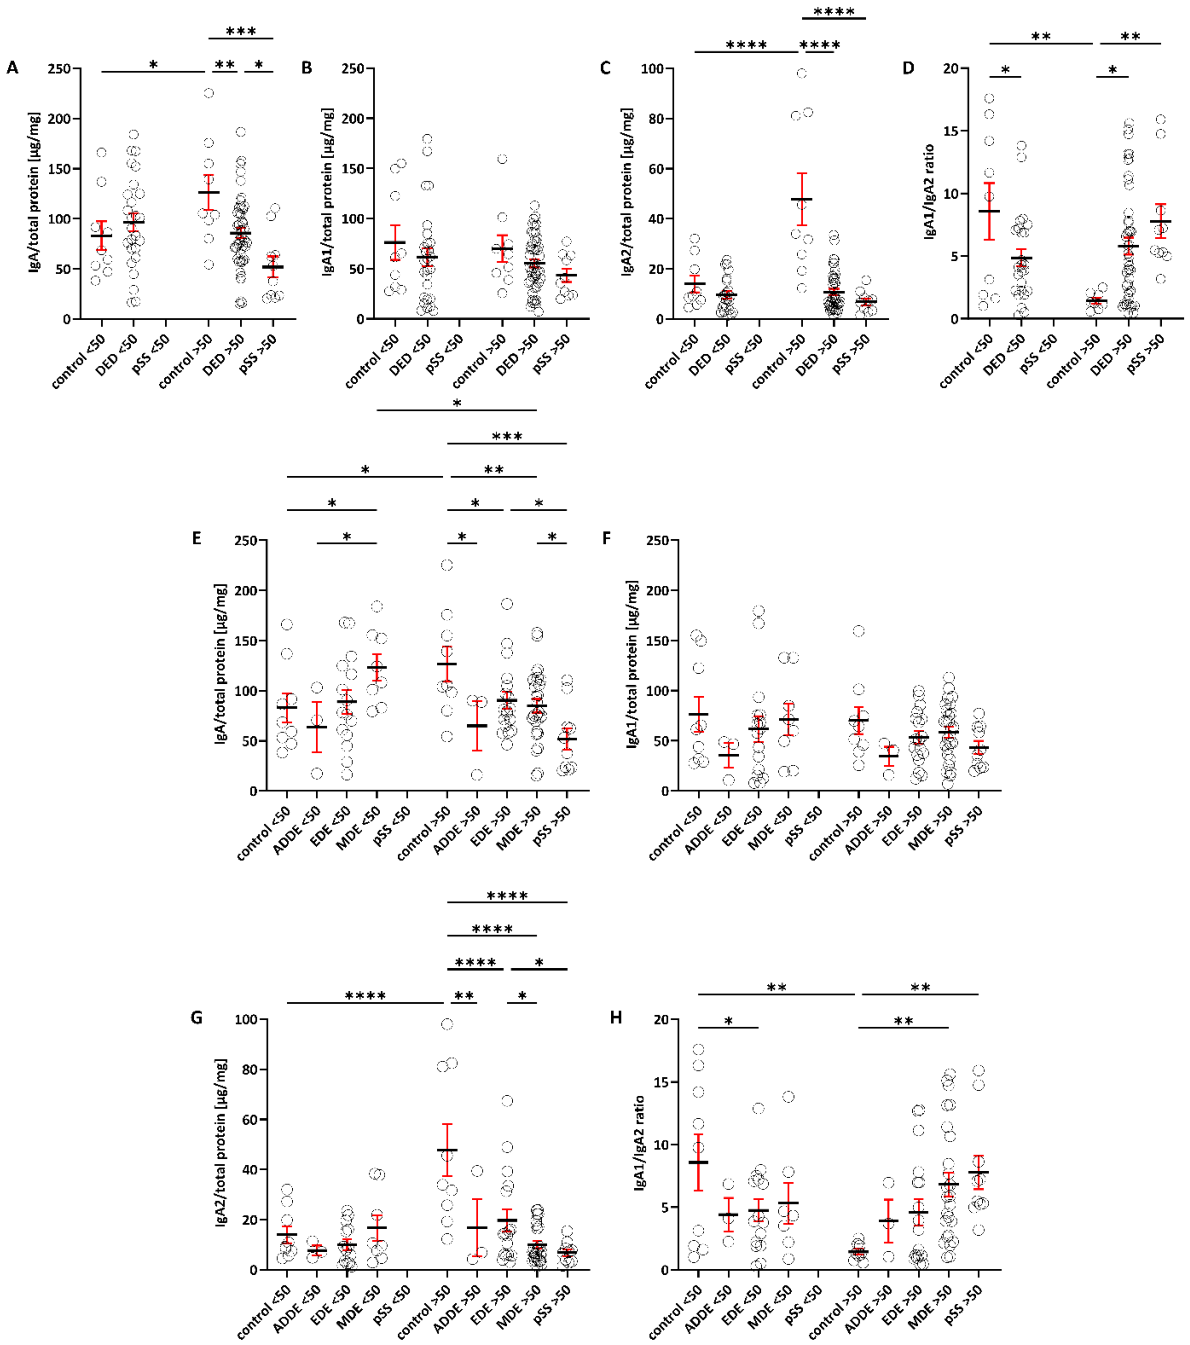
Figure 6.
Proposed model of altered IgA homeostasis at the ocular surface in DED and pSS. (A) In the healthy ocular surface, IgA-producing plasma cells in the lacrimal gland and subconjunctival tissue predominantly produce IgA1 and smaller amounts of IgA2. Dimeric IgA, including IgA1 and IgA2, is transported across epithelial cells via the polymeric immunoglobulin receptor (pIgR) and released into the tear film as secretory IgA, thereby contributing to mucosal immune protection. (B) In dry eye disease (DED) and primary Sjögren’s syndrome (pSS), several mechanisms may contribute to altered IgA abundance in the tear film. These include changes in the number or secretory activity of IgA1- and IgA2-producing plasma cells, alterations in pIgR-mediated epithelial transport, and increased extracellular degradation of IgA. Chronic inflammation and lacrimal gland tissue damage may additionally affect local plasma cell survival niches. Locally produced IgA may also interact with FcαRI-expressing immune cells within ocular surface-associated tissues and thereby modulate local inflammatory responses. Together, these mechanisms may contribute to the altered IgA profiles observed in DED and pSS.
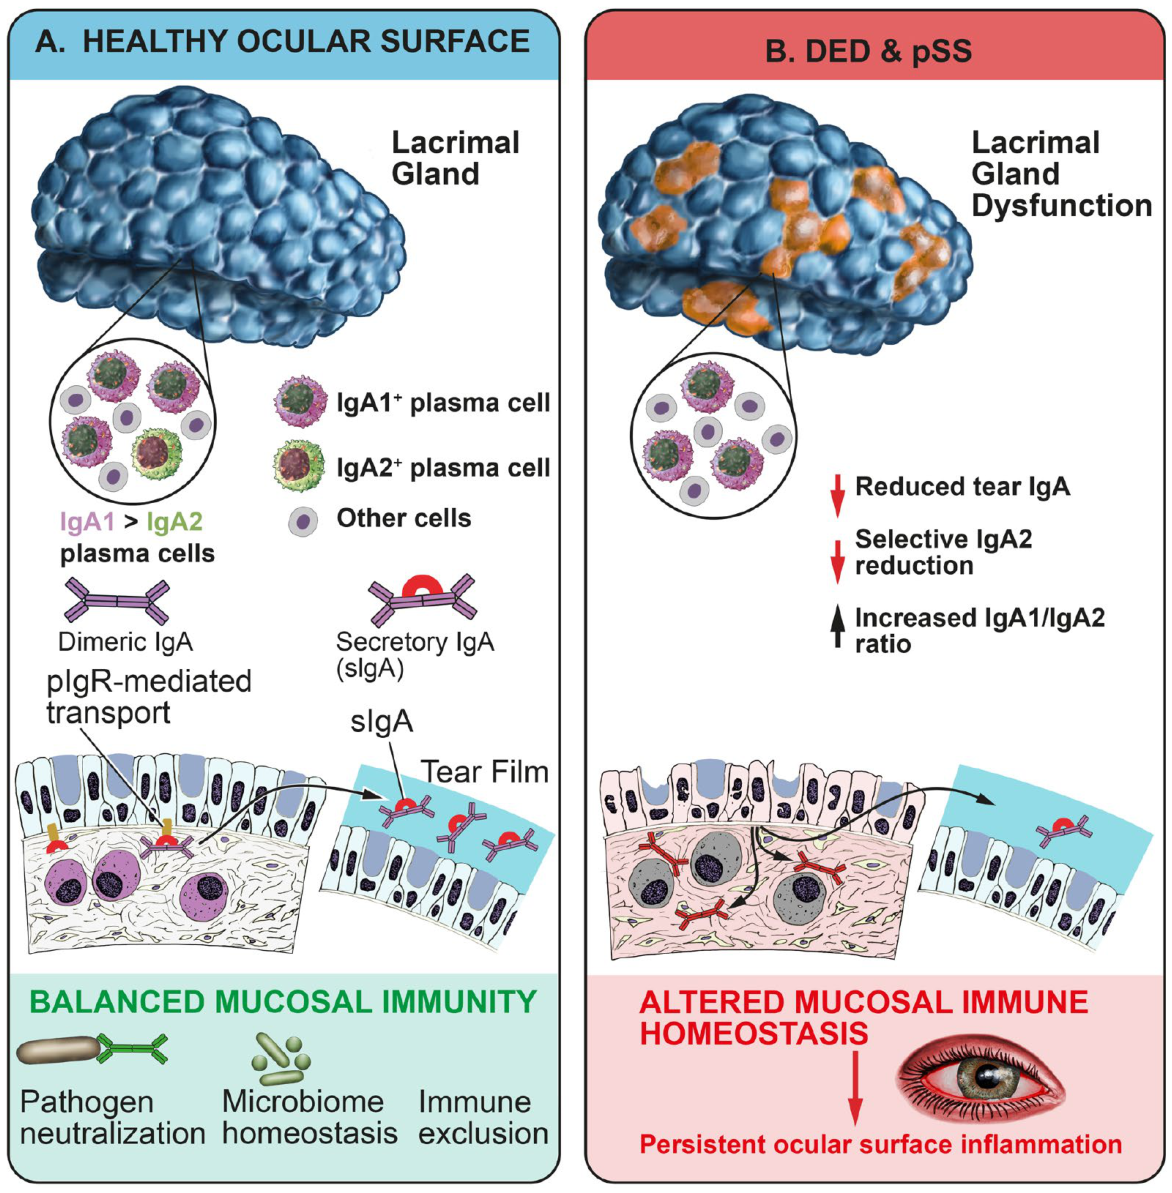

Table 1.
Tissues removed from body donors.
| Characteristics | Lacrimal gland | Eyelid | Cornea |
|---|---|---|---|
| Number of subjects (n) | 15 | 15 | 10 |
| Sex | |||
| Male: (n) | 7 | 7 | 6 |
| Female: (n) | 8 | 8 | 4 |
| Age: years | |||
| Mean ± SD | 74 ± 13 | 78 ± 11 | 69 ± 11 |
Table 2.
Primary antibodies used for immunofluorescence staining.
| Antibody | Host Species | Dilution | Stock (mg/mL) | Order-Number | Company |
|---|---|---|---|---|---|
| CD38 | Rabbit | 1:100 | 0.25 | MA5-38376 | Thermo Fisher, USA |
| IgA | Goat | 1:100 | 1.0 | 2050-01 | Southern Biotech, USA |
| IgA1 | Mouse | 1:100 | 0.5 | 9130-01 | Southern Biotech, USA |
| IgA2 | Mouse | 1:100 | 0.5 | 9140-01 | Southern Biotech, USA |
Table 3.
Secondary antibodies used for immunofluorescence staining.
| Conjugated fluorophore | Host Species | Species Reactivity | Dilution | Stock (mg/mL) | Order-Number | Company |
|---|---|---|---|---|---|---|
| Alexa Fluor 488 | Donkey | Goat | 1:1000 | 2 | A-11055 | Invitrogen, USA |
| Alexa Fluor 488 | Goat | Mouse | 1:1000 | 2 | A-11029 | Invitrogen, USA |
| Alexa Fluor 555 | Donkey | Rabbit | 1:1000 | 2 | A-31572 | Invitrogen, USA |
Table 4.
Demographic and clinical characteristics of the study cohorts.
| Characteristics | Total | Healthy | DED | ADDE | EDE | MDE | pSS |
|---|---|---|---|---|---|---|---|
| Subjects (n) | 103 | 18 | 75 | 6 | 34 | 35 | 10 |
| Female: (n) | 65 | 8 | 48 | 3 | 21 | 24 | 9 |
| Male: (n) | 38 | 10 | 27 | 3 | 13 | 11 | 1 |
| Age: (years) | - | 46 ± 15 | 55 ± 18 | 55 ± 21 | 50 ± 19 | 61 ± 17 | 68 ± 10 |
| OSDI-Score | - | 4 ± 4 | 51 ± 20 | 53 ± 14 | 50 ± 21 | 51 ± 21 | 57 ± 18 |
| Schirmer 1, right eye, (mm/5min) | - | 29 ± 9 | 11 ± 10 | 5 ± 4 | 19 ± 10 | 5 ± 3 | 4 ± 6 |
| BUT, right eye, (s) | - | - | 5 ± 4 | 6 ± 6 | 5 ± 3 | 4 ± 4 | 3 ± 1 |
| NEI corneal staining, right eye | - | - | 1 ± 2 | 1 ± 2 | 1 ± 3 | 1 ± 1 | 4 ± 2 |
| Lissamine green staining, right eye | - | - | 1 ± 1 | 2 ± 2 | 1 ± 1 | 1 ± 2 | 5 ± 4 |
Table 5.
Antibodies used for quantification of total IgA, IgA1, and IgA2 by ELISA.
| Antibody | Application | Host Species | Conjugate | Dilution | Working concentration (µg/mL) | Order-Number | Company |
|---|---|---|---|---|---|---|---|
| IgA, F(ab)2 | Capture | Goat | - | 1:1000 | 0.5 | 2052-01 | Southern Biotech, USA |
| IgA-HRP | Detection | Goat | HRP | 1:1000 | 1 | 2050-05 | Southern Biotech, USA |
| IgA1-HRP | Detection | Mouse | HRP | 1:500 | 2 | 9130-05 | Southern Biotech, USA |
| IgA2-HRP | Detection | Mouse | HRP | 1:500 | 2 | 9140-05 | Southern Biotech, USA |
Disclaimer/Publisher’s Note: The statements, opinions and data contained in all publications are solely those of the individual author(s) and contributor(s) and not of MDPI and/or the editor(s). MDPI and/or the editor(s) disclaim responsibility for any injury to people or property resulting from any ideas, methods, instructions or products referred to in the content. |
© 2026 by the authors. Licensee MDPI, Basel, Switzerland. This article is an open access article distributed under the terms and conditions of the Creative Commons Attribution (CC BY) license (http://creativecommons.org/licenses/by/4.0/).
Copyright: This open access article is published under a Creative Commons CC BY 4.0 license, which permit the free download, distribution, and reuse, provided that the author and preprint are cited in any reuse.