

Submitted:
02 October 2026
Posted:
05 October 2026
You are already at the latest version
Abstract
Understanding the interactions between agricultural management and seasonal climate variability is essential for maintaining soil biological sustainability and resilience. This study evaluated the effects of irrigation regime (irrigated vs. rainfed) and seasonality (autumn vs. spring) on rhizosphere microbiome diversity and composition using 16S and ITS amplicon metabarcoding during 2024–2026. Rainfed vineyards showed substantially higher bacterial richness (median Chao1: ≈1,220 vs. 710) and greater fungal diversity and richness than irrigated vineyards (Shannon H′: 4.71 vs. 3.86; Chao1: ≈595 vs. 335, re-spectively). PERMANOVA based on Bray–Curtis dissimilarity confirmed irrigation re-gime as the main structuring factor for bacterial (R² = 0.264, p = 0.042) and fungal communities (R² = 0.272, p = 0.005), whereas seasonality had no significant effect (p > 0.30). Taxonomic analysis revealed a marked dominance of Ascomycota under irrigation (80–98% relative abundance), accompanied by reduced fungal evenness. The bacte-ria-to-fungi ratio indicated a higher bacterial proportion under rainfed conditions and in autumn. These results suggest a plant-mediated buffering effect in the rhizosphere and indicate that continuous irrigation may promote microbial homogenization, potentially reducing soil biodiversity. Controlled deficit irrigation strategies may therefore help preserve microbial diversity and support soil functionality and resilience in Mediterra-nean vineyards.
Keywords:
rhizosphere microbiome
; 16S/ITS metabarcoding
; irrigation management
; alpha and beta diversity
; soil sustainability
; biotic homogenization
1. Introduction
The rhizosphere microbiome represents one of the most complex and dynamic biological interfaces in the agrosystem, playing a critical role in nutrient cycling, plant nutrition and growth, the suppression of plant pathogens, and the maintenance of soil structure [1,2]. Roots actively select a subset of the soil microbial reservoir (species sorting), shaping microbial communities that have a direct impact on abiotic stress tolerance and host defense [3,4]. In Mediterranean and semi-arid agrosystems, this interaction takes on particular importance, given that water availability is the primary limiting factor for primary productivity.
In grapevines (Vitis vinifera L.), the edaphic and rhizosphere microbiome not only influences the crop’s phytosanitary status and productivity but also modulates metabolic processes that affect the organoleptic composition of grapes and wine [3,5]. This link has solidified the concept of microbial terroir, which posits that microbial communities are part of the vineyard’s biogeographic identity at the continental, regional, and local scales [6,7,8,9]. However, the architecture of the microbial terroir does not respond exclusively to spatial gradients but rather emerges from the hierarchical interaction between soil physicochemical properties, climatic conditions, phenology, plant genotype, and agronomic management [9,10,11].
Soil properties are established as primary determinants of alpha and beta diversity in the microbiome [11,12,13]. In vineyard soils, variables such as pH, soil organic carbon (SOC), the C:N ratio, available phosphorus, and texture explain a significant fraction of community variance [5,14]. While in fungal communities, environmental filtering by pH and organic matter may prevail even at fine spatial scales [15], in bacterial communities, carbon availability is typically associated with an increase in species richness and niche breadth [11]. This framework is critical in Calcaric Cambisols soils, where the chemistry of calcium and carbonates (CaCO₃) restricts the dynamics of organic carbon and alters the bioavailability of nutrients [16]. In these alkaline environments, the presence of calcareous matrices favors the shift of oligotrophic taxa toward copiotrophic clades and affects total microbial biomass [17,18,19].
In addition to edaphic selectivity, there is anthropogenic disturbance resulting from changes in the water regime. The conversion of traditional rain-fed vineyards to irrigated ones has improved production stability, but its ecological implications for the rhizosphere microbiota remain a subject of debate [6,14]. Although it has been hypothetically assumed that irrigation increases microbial richness by alleviating water limitations, empirical evidence suggests that moisture saturation reduces niche heterogeneity, promotes community convergence, and selects for fast-growing opportunistic taxa [9,11]. Thus, the transition to irrigation predominantly alters community assembly rules and beta diversity, rather than generating a linear increase in local alpha diversity [20,21].
Additionally, seasonality introduces a dynamic intra-annual component. Fluctuations in temperature, soil moisture, and root exudation patterns throughout the growing season impose temporal variations on the rhizosphere microbiome [10,22]. These seasonal dynamics affect the different microbial kingdoms asymmetrically: fungal communities generally exhibit greater sensitivity to climatic factors, seasonality, and macroscale terroir, whereas bacterial communities show a closer coupling with pH, available carbon, and agronomic management variables [8,23]. Dominant prokaryotic taxa such as Proteobacteria, Actinobacteria, and Acidobacteria, as well as fungal clades belonging to Ascomycota, Basidiomycota, and genera such as Mortierella, Alternaria, or Solicoccozyma, respond differently to these environmental gradients [5,6]. This differential response justifies the dual metabarcoding approach (16S rRNA gene and ITS region) to comprehensively assess community restructuring and the dynamics of key functional groups (e.g., nitrogen fixers such as Rhizobiaceae, nitrifiers such as Candidatus Nitrososphaera, or phytopathogenic taxa such as Fusarium) [7,24].
Despite advances in the characterization of the viticultural microbiome, knowledge gaps remain regarding the interaction between the water regime (rainfed vs. irrigated) and seasonality in Mediterranean agroecosystems established on Calcaric Cambisols. The objective of this study was to evaluate alpha diversity, beta diversity, and the taxonomic composition of bacterial and fungal communities in the rhizosphere of Vitis vinifera L., comparing rainfed and irrigated plots during the spring and autumn seasons throughout the 2024–2026 period. It is hypothesized that: (i) Differences in the rhizosphere microbiota associated with water management will be more pronounced in community restructuring (beta diversity) than in unidirectional changes in local richness (alpha diversity); and (ii) bacterial and fungal communities will respond asymmetrically to the interaction between water regime and seasonality, with the fungal microbiota showing greater sensitivity to seasonal dynamics and bacteria showing greater coupling with variations in the soil matrix resulting from irrigation.
2. Results
2.1. Alpha Diversity of the Rhizosphere Microbiome
The alpha diversity analysis revealed distinct responses of bacterial and fungal communities to the rainfed–irrigated water management dichotomy (Table 1; Figure 1). In the bacterial community, the Shannon index (H′) showed similar values between the two systems, with a median of 4.90 in the irrigated system and 5.00 in the rainfed system. Therefore, the difference between the systems was small in terms of Shannon diversity. However, the richness estimated using Chao1 showed a more marked divergence, with an approximate median of 710 OTUs in the irrigated system compared to 1,220 OTUs in the rainfed system, indicating greater estimated bacterial richness in the rainfed plots.
In the fungal community, the differences between the two systems were more evident. The Shannon index had a median value of 4.71 in rainfed areas compared to 3.86 in irrigated areas, while the richness estimated using Chao1 reached approximately 595 OTUs in rainfed areas and 335 OTUs in irrigated areas (Figure 1C–D). Overall, the alpha diversity pattern is characterized by greater bacterial and fungal richness in rainfed systems, while, most notably, the fungal community in rainfed systems also exhibited higher Shannon diversity. This divergence provides an initial indication of a richer and more balanced community under the rainfed system.
2.2. Beta Diversity and Structure of Microbial Communities
Cluster analysis using principal coordinate analysis (PCoA), based on Bray–Curtis distances, revealed a clear differentiation of microbial communities according to the water management system (Figure 2). In the bacterial community, the first two PCoA axes together explained 59.7% of the variability, with 44.4% accounted for by the first axis and 15.3% by the second. The graphical representation showed a separation of the rainfed samples from the irrigated ones, primarily along the first axis (Figure 2A).
In the fungal community, the first two principal axes together explained 73.1% of the variability, with 54.7% corresponding to the first axis and 18.4% to the second. The cluster analysis also revealed a differentiation between the two systems, with a relatively compact grouping of samples within each water regime (Figure 2B). In descriptive terms, the observed separation was therefore consistent across both microbial domains and particularly pronounced in the fungal community.
The differentiation observed in the ordering was supported by the two-factor PERMANOVA analysis (Table 2). The management system explained 26.4% of the variability in the bacterial community (R² = 0.264; F = 2.86; p = 0.042) and 27.2% of the variability in the fungal community (R² = 0.272; F = 3.12; p = 0.005). In both domains, the effect of the management system was statistically significant. These R² values indicate that the dryland–irrigated dichotomy explained a significant portion of the variation in community composition and that the statistical evidence was stronger for fungi.
In contrast, season made a smaller and non-significant contribution. For bacteria, the season factor explained 10.9% of the variability (R² = 0.109; F = 1.18; p = 0.332), while for fungi it explained only 3.6% (R² = 0.036; F = 0.41; p = 0.900). Consequently, during the period analyzed, the PERMANOVA results indicate that the water management system had a clearly greater statistical influence on community structure than the spring-autumn contrast. This interpretation must be understood in the context of the sample size and the absence of autumn 2026 samples.
2.3. Relative Taxonomic Composition
Analysis of taxonomic composition at the phylum level revealed differences in the relative representation of certain groups among management systems during the 2024–2026 period (Figure 3). The bacterial community was dominated primarily by Actinobacteriota, Proteobacteria, Crenarchaeota, Bacteroidota, and Acidobacteriota. Actinobacteriota had relative abundances ranging from approximately 18% to 35%, with a higher overall representation in rainfed samples, while Proteobacteria accounted for between 22% and 32% and showed a higher relative representation in irrigated plots. Crenarchaeota accounted for approximately 10–20%, while Bacteroidota and Acidobacteriota generally ranged between 8% and 16%.
The fungal community exhibited a much more pronounced pattern of dominance. Ascomycota was the predominant phylum throughout the study period and reached values as high as 98.9% in certain irrigated samples, particularly in the spring of 2026. In rain-fed plots, by contrast, their representation ranged approximately from 40.8% to 81.8%, coexisting with a higher relative contribution from other groups. Basidiomycota and Mortierellomycota accounted for approximately 10–32% and 3–12%, respectively, and both groups showed lower relative representation in certain irrigated samples.
Overall, the taxonomic profile reveals a greater concentration of relative abundance in certain groups under irrigation, especially in the fungal community. The dominance of Ascomycota—which accounted for virtually the entire community in some irrigated samples—contrasts with the greater relative evenness observed in rainfed areas, where abundance was distributed across a broader set of phyla. This taxonomic pattern is consistent with the lower Shannon diversity and fungal richness observed in irrigated areas and suggests a possible homogenization of the community, although the data alone do not allow for the attribution of a specific functional loss.
2.4. Bacteria-to-Fungus Ratio
The bacteria-to-fungus (B/F) ratio showed high variability among the analyzed samples, with values ranging from 46 to 817 (Figure 4). Considering the management system, the mean was 432.29 in rainfed areas and 297.70 in irrigated areas. The median was 421.20 for rainfed fields and 332.00 for irrigated fields, while the first and third quartile values were 183.75 and 608.50 for rainfed fields and 140.00 and 476.50 for irrigated fields, respectively.
From a seasonal perspective, the average B/H ratio was 264.29 in spring and 516.05 in autumn. The corresponding medians were 161.88 and 457.60, respectively. The range was also high, particularly in spring, where values ranged from 46 to 608.50, while in autumn they ranged from 332 to 817.
2.4.1. Comparison Between Rainfed and Irrigated Systems
The paired comparison between rainfed and irrigated systems showed higher B/H ratio values in the rainfed system in four of the five pairs of observations (Table 3). The mean difference between the two systems was 134.59 B/H units. The t-test for paired samples yielded a value of t = 2.50 with 4 degrees of freedom (p = 0.067), while the nonparametric Wilcoxon test yielded W = 1.00 (p = 0.125). The effect size estimated using Cohen’s d for paired data was 1.12.
Therefore, although the descriptive statistics and the effect size pointed toward a higher B/H ratio in the rainfed plots, none of the inferential tests reached the conventional threshold for statistical significance (α = 0.05). The discrepancy between the descriptive magnitude of the effect and its statistical significance should be interpreted in light of the small number of available pairs.
2.4.2. Comparison Between Stations
The B/H ratio showed higher mean values in the autumn (516.05) than in the spring (264.29) (Table 3). Considering only the years for which data were available for both seasons—namely, 2024–2025—the mean difference between autumn and spring was 187.36 B/H units. The comparison using the t-test for paired samples showed no significant differences (t = 0.53; df = 1; p = 0.690). The Wilcoxon test also showed no evidence of differences (W = 1.00; p = 1.000).
Consequently, although the descriptive values of the B/H ratio were higher in the autumn, the inferential analyses did not provide sufficient statistical evidence to establish a seasonal effect. The inferential power of this comparison is particularly limited by the fact that data were available for only two years covering both stations.
2.4.3. Comparison Between Rainfed and Irrigated Systems Within Each Season
Comparisons conducted independently within each season showed a consistent trend toward higher B/H ratio values in rainfed systems, although no difference reached statistical significance (Table 4). In spring, the mean was 307.75 for rainfed crops compared to 220.83 for irrigated crops, with a difference of 86.92 units (t = 1.811; df = 2; p = 0.212). In the autumn, the means were 619.10 and 413.00, respectively, with a difference of 206.10 units (t = 1.763; df = 1; p = 0.328).
These results indicate that the descriptive differences between systems were greater in the autumn than in the spring, but insufficient statistical evidence was obtained to confirm differences between rainfed and irrigated systems within either season.
2.4.4. Exploratory Factorial Model
To jointly evaluate the possible effects of year, management system, and season on the B/H ratio, an exploratory factorial model was conducted using the 2024–2025 period, which provided observations for both seasons (Table 5). The model included the factors year, system, and season, as well as the system × season interaction.
None of the effects included in the model reached statistical significance. The effect of year was F = 0.126 (p = 0.746), while the management system showed F = 0.662 (p = 0.475) and the season F = 0.800 (p = 0.437). The interaction between management system and season was also not significant (F = 0.029; p = 0.876), indicating that no statistical evidence was found that the difference between rainfed and irrigated systems in the B/H ratio varied consistently between spring and autumn.
The factor analysis should be considered exploratory due to the small number of observations and the few residual degrees of freedom. Consequently, the lack of statistical significance should not be interpreted as evidence of equivalence between the systems or between the stations, but rather as a lack of sufficient evidence to detect differences given the available study design and sample size.
Overall, the results show that the rainfed–irrigated dichotomy was associated with clear differences in the composition of microbial communities—both bacterial and fungal—and with higher descriptive measures of richness in the rainfed plots. The divergence was particularly marked in the fungal community, which exhibited both greater richness and Shannon diversity in rainfed areas and a high dominance of Ascomycota in irrigated areas. PERMANOVA reinforced this differentiation, with R² values of 0.264 and 0.272 for bacteria and fungi, respectively, compared to lower R² values for the station. In contrast, the differences observed in the B/H ratio did not reach statistical significance. The overall interpretation must consider the limitations arising from sample size and the absence of autumn samples in 2026.
3. Discussion
The rainfed versus irrigated dichotomy emerged as the main ecological factor shaping the beta diversity of microbial communities in the vineyard rhizosphere, explaining 26.4% of bacterial variation and 27.2% of fungal variation, while the season explained a smaller and non-significant fraction. This result is consistent with recent studies in vineyards demonstrating that water availability and irrigation practices modify the microbial structure of the soil and rhizosphere [25,26,27,28]. Furthermore, the sensitivity of the fungal fraction to the water gradient has been documented in other Mediterranean agroecosystems [27,28], where bacteria and fungi respond by altering microstructure and nutrient transport [27], with a relative contribution that varies depending on the compartment, cultivar, and temporal scale [25,29].
Alpha diversity added a complementary dimension, as rainfed plots exhibited greater bacterial and fungal richness, as well as a clearly higher fungal evenness. Ecologically, the greater spatiotemporal variability of moisture in rainfed systems increases microhabitat heterogeneity, promoting niche differentiation and the coexistence of taxa with contrasting strategies [13]. In contrast, a more stable water regime in irrigated areas reduces subtle contrasts in oxygenation, carbon, and pore space, favoring more convergent communities dominated by fewer groups [30,31,32]. This dynamic aligns with the copiotrophic–oligotrophic framework, where environments with predictable resources benefit fast-growing taxa, while variable environments preserve more diverse oligotrophic strategies [33,34]. The strong dominance of Ascomycota in some irrigated samples is consistent with a reduction in equity and a process of internal homogenization of the fungal community. In other irrigated systems, Ascomycota also widely dominates the mycobiota, and water management practices can displace both diversity and functional groups, including mycorrhizae and potential pathogens [27,30]. However, taxonomic composition alone does not demonstrate functional loss; recent evidence suggests that the relationship between diversity, composition, and soil processes depends on both the edaphic environment and the microbial assemblage and must be validated with direct functional metrics [35]. However, since direct functional variables were not measured, the greater dominance and lower richness observed in irrigated areas should be interpreted as a sign of community reorganization with possible functional relevance, not as conclusive evidence of ecological deterioration [35,36].
Regarding seasonality, the absence of a significant effect in PERMANOVA suggests that the rhizosphere community was primarily influenced by water management. The rhizosphere acts as a highly selective and buffering environment, where the continuous release of root exudates (sugars, amino acids, and organic acids) exerts strong microbial filtering that can buffer temporal variations from spring to autumn [37,38,39], although these dynamics vary depending on scale, compartment, and plant species [25,40].
Furthermore, the absence of arbuscular mycorrhizal fungi (AMF) in the dataset represents a significant finding, given their importance in grapevine mineral nutrition, stress tolerance, and the structuring of the rhizosphere microbiome [40,41,42]. Although intensive agronomic practices, tillage, fertilization, or the use of fungicides tend to reduce AMF or favor ruderals [42,43,44], this result should be interpreted with caution. In the absence of detailed records of plant protection products or root colonization metrics, the failure to detect AMF could also be due to methodological limitations, such as the bias of ITS primers compared to LSU primers for Glomeromycetes or soil sampling compared to root sampling [42,45]. In this regard, the correlation between the absence of AMF and the presence of the plant pathogenic fungus Cadophora suggests possible dysbiosis, which requires empirical validation [42].
Regarding the bacteria-to-fungi (B/F) ratio, the high variability observed prevented the detection of significant differences between water regimes or seasons. This corroborates that aggregated ratios between major microbial domains have limited ability to reflect taxonomic replacements or changes in evenness within each group [26,46]. In agricultural soils, bacterial and fungal communities may respond differently to environmental gradients and management practices; thus, a single summary B/F ratio should be considered only an exploratory indicator, with beta diversity being the most sensitive and consistent metric for assessing the impact of irrigation [26,29,46]. In vineyards, irrigation altered bacterial communities, although its effect was less pronounced than that of cultivar, location, or phenology [29], whereas the fungal community showed marked responses to drought and different irrigation regimes [25,26].
These findings highlight that water management in vineyards not only stabilizes production but also significantly alters the biological heterogeneity of the soil [25,47]. The combination of lower species richness, Ascomycota dominance, and the absence of AMF under irrigation indicates a risk of biotic homogenization and loss of resilience [48]. Therefore, it is a priority to evaluate strategies such as controlled deficit irrigation or other conservation practices, such as plant cover, through multi-year factorial experiments [26,42]. To optimize soil monitoring programs, it is essential to integrate mass sequencing (16S/ITS) with direct metrics of mycorrhizal colonization, enzymatic activity, and physicochemical variables that allow for a causal link between community structure and the multifunctionality and health of the vineyard [48,49].
It should be noted that although the absence of AMF, the inconclusive variability in the B/H ratio, and the effects associated with water management point to a microbial reorganization relevant to soil biological quality, they do not yet allow for firm causal inferences regarding crop functionality or health.
The results of this research underscore the need to improve the study design by including direct quantification of mycorrhizal colonization, detailed recording of inputs, soil functional variables, and a longer-term follow-up to determine whether strategies such as controlled deficit irrigation, plant cover, or the reduction of chemical inputs actually support soil multifunctionality in vineyards.
4. Materials and Methods
4.1. Study Area and Experimental Design
The study was conducted in a 30-hectare area located in the Tierra de Barros region (Badajoz, Extremadura, Spain; 38° 44′–38° 52′ N, 6° 28′–6° 44′ W). The area has an arid/semi-arid Mediterranean climate with marked seasonal variations in precipitation and hot, dry summers. The average annual temperature is approximately 16 °C (with average lows of ~11 °C and highs of ~23 °C), average annual sunshine hours of 2,800–3,000 h, and cumulative reference potential evapotranspiration (ETo) of ~1,250 mm⋅year−1 [50].
Geomorphologically, the physiography consists of flat or gently undulating terrain [51]. Lithologically, Tertiary detrital materials predominate—primarily from the Miocene and Pliocene—composed of sandstones, conglomerates, gravels, sands, silts, and red clays, as well as Quaternary slope deposits containing caliches and calcareous crusts [52]. The soils developed on this parent material are representative of the Mediterranean viticultural agrosystems of the Iberian Peninsula, classified predominantly as Calcaric Cambisols and, to a lesser extent, Chromic Luvisols [53,54]. These soils are characterized by a subsurface B horizon that is cambic, argillic, or calcareous; a variable carbonate content; loamy to clayey textures; a neutral to alkaline pH; and low organic matter content [52,55].
The experiment was established on three adjacent vineyard plots (Vitis vinifera L., cultivars ‘Pardilla’ and ‘Cayetana Blanca’). General agronomic management included shallow tillage, no inter-row plant cover, mechanized harvesting, synthetic mineral fertilization (N-P-K), and conventional application of agrochemicals (herbicides, insecticides, and fungicides). Two contrasting water regimes were evaluated: rainfed (dependent exclusively on natural precipitation) and irrigated (with periodic water supplies via drip irrigation). Planting density differed according to the water regime, with <3,000 vines·ha−1 recorded under rainfed conditions and >3,000 vines·ha−1 under irrigated conditions.
4.2. Rhizosphere Soil Sampling and Preservation
Stratified random sampling of rhizosphere soil was conducted under both water regimes during consecutive spring and autumn campaigns (2024–2026). A total of 30 samples were collected: 18 in the spring (9 from rainfed and 9 from irrigated vineyards) and 12 in the autumn (6 from rainfed and 6 from irrigated vineyards).
The rhizosphere samples consisted of the soil fraction closely adhering to the active root system in the 0–20 cm depth layer, extracted near the trunk following the standard methodology for microbiome studies in vineyards [11,56,57]. After extraction, the material was handled under aseptic conditions and homogenized to minimize intrasample variability [58,59,60]. The homogenized samples were immediately frozen and stored at −80 °C until molecular processing to preserve genomic DNA integrity and prevent alterations in community composition [61].
4.3. DNA Extraction, PCR Amplification, and Sequencing
Total genomic DNA was isolated from rhizosphere soil using the DNeasy PowerLyzer PowerSoil kit (Qiagen, Hilden, Germany) according to the manufacturer’s specifications for the BeCrop® platform (Biome Makers Inc., Valladolid, Spain). The characterization of bacterial and fungal communities was performed by PCR amplification of the V4 hypervariable region of the 16S rRNA gene and the internal transcribed spacer 1 (ITS1) region, respectively. The generated amplicons were purified using KAPA Pure Beads magnetic microspheres (Roche, Basel, Switzerland), and the quality of the amplification product was verified by agarose gel electrophoresis [62].
4.4. Bioinformatics Processing and Taxonomic Assignment
The representative sequences obtained were grouped into amplicon sequence variants (ASVs) or operational taxonomic units (OTUs). Taxonomic assignment was performed by aligning the representative sequences against the curated databases SILVA v138 for the 16S rRNA gene and UNITE v8.3 for the ITS region [63]. Prior to calculating the ecological diversity indices, the taxonomic abundance matrices were rarified to a uniform read depth per sample to correct for biases arising from differences in the size of the sequencing libraries.
4.5. Ecological and Statistical Analysis
Alpha diversity was estimated using the Shannon evenness index (H′) and the nonparametric Chao1 total richness estimator. To assess beta diversity, ecological dissimilarity matrices were constructed using the Bray-Curtis distance based on relative taxonomic abundances; the resulting ordinations were visualized using Principal Coordinate Analysis (PCoA). The statistical significance of the effect of the main factors and their interactions on community structure was determined using a two-factor permutational multivariate analysis of variance (two-way PERMANOVA: Water Regime × Season) with 999 Monte Carlo permutations.
A preliminary descriptive analysis was conducted to evaluate the Bacteria/Fungi (B/F) ratio. The paired comparison between rainfed and irrigated systems was performed using a Student’s t-test for dependent samples (given the synchronous nature of the sampling) and the nonparametric Wilcoxon signed-rank test as an alternative test; additionally, the effect size was estimated using Cohen’s d for paired data. For seasonal dynamics (spring vs. autumn), the comparison was conducted as a paired analysis for the 2024–2025 period using the intra-annual mean value of the water systems. Complementarily, an exploratory linear factorial model was fitted for the 2024–2025 period (B/F ∼ Year + System × Season). A significance level of α = 0.05 was set. Given the sample size, the results derived from these models were interpreted on an exploratory basis. All statistical procedures and graphical representations were performed using the R and Python programming environments.
5. Conclusions
The results of this study show that the irrigation regime (rainfed vs. irrigated) is the main ecological factor shaping the beta diversity of microbial communities in the vineyard rhizosphere. The management system explained 26.4% of bacterial variability (R² = 0.264; p = 0.042) and 27.2% of fungal variability (R² = 0.272; p = 0.005). In contrast, season made a smaller and non-significant contribution (R² = 0.109 and 0.036; p = 0.332 and 0.900, respectively), confirming that water management exerts a greater selective pressure than seasonality under the tested conditions.
Regarding alpha diversity, the rainfed plots retained a higher estimated richness (Chao1 index) for both bacteria (~1,220 vs. ~710 OTUs) and fungi (~595 vs. ~335 OTUs). Likewise, the fungal community exhibited higher Shannon diversity under rainfed conditions (H’ = 4.71) than under irrigated conditions (H’ = 3.86). These values suggest greater spatiotemporal heterogeneity of microhabitats under rainfed conditions. In contrast, irrigated fields favored a high dominance of Ascomycota (reaching up to 98.9% in certain samples), indicating lower evenness and a possible biotic homogenization of the fungal community. Although this homogenization represents a relevant ecological signal, its actual impact on the loss of crop functionality or health requires specific validation.
The bacteria-to-fungi (B/F) ratio showed descriptive trends toward higher values under rainfed conditions and during the autumn; however, no comparison reached statistical significance. The lack of a significant seasonal effect on beta diversity suggests a buffering effect of the rhizosphere, where root activity and exudates maintain a relatively stable microenvironment. However, this interpretation should be viewed with caution due to sample size limitations and the absence of data for the autumn of 2026.
From the perspective of sustainable agricultural management, these findings highlight the need to design strategies that preserve soil biological heterogeneity. Controlled deficit irrigation (CDI) is proposed as a promising tool to mitigate ongoing water homogenization and promote the conservation of more diverse and functional microbial communities, without compromising the physiological needs of the grapevine. This management hypothesis must be experimentally validated by integrating metabarcoding profiles (16S/ITS), edaphic analyses, and functional measurements. In conclusion, the preservation of rhizosphere microbial diversity must be established as a key pillar for ensuring the long-term health and multifunctionality of vineyard soil.
Author Contributions
Conceptualization, L.F.F.P. and M.A.R.G.; methodology, L.F.F.P. and M.A.R.G.; validation, L.F.F.P. and M.A.R.G.; formal analysis, L.F.F.P. and M.A.R.G.; investigation, L.F.F.P. and M.A.R.G.; data curation, L.F.F.P. and M.A.R.G.; writing—original draft preparation, L.F.F.P. and M.A.R.G.; writing—review and editing, L.F.F.P. and M.A.R.G.; visualization, L.F.F.P. and M.A.R.G.; supervision, L.F.F.P. and M.A.R.G.; project administration, M.A.R.G.; funding acquisition, M.A.R.G. All authors have read and agreed to the published version of the manuscript.
Funding
This study was co-financed at 85% by the European Union, European Regional Development Fund, and Regional Government of Extremadura (Junta de Extremadura). Grant number: GR24153.
Data Availability Statement
The data supporting the findings of this study are available from the authors upon request.
Acknowledgments
We gratefully acknowledge the financial support received from the Regional Government of Extremadura.
Conflicts of Interest
The authors declare no conflicts of interest.
References
- Fierer, N. Embracing the Unknown: Disentangling the Complexities of the Soil Microbiome. Nat. Rev. Microbiol. 2017, 15, 579–590. [Google Scholar] [CrossRef] [PubMed]
- Trivedi, P.; Leach, J.E.; Tringe, S.G.; Sa, T.; Singh, B.K. Plant–Microbiome Interactions: From Community Assembly to Plant Health. Nat. Rev. Microbiol. 2020, 18, 607–621. [Google Scholar] [CrossRef] [PubMed]
- Oyuela Aguilar, M.; Gobbi, A.; Browne, P.D.; Ellegaard-Jensen, L.; Hansen, L.H.; Semorile, L.; Pistorio, M. Influence of Vintage, Geographic Location and Cultivar on the Structure of Microbial Communities Associated with the Grapevine Rhizosphere in Vineyards of San Juan Province, Argentina. PLoS ONE 2020, 15, e0243848. [Google Scholar] [CrossRef] [PubMed]
- Griggs, R.G.; Steenwerth, K.L.; Mills, D.A.; Cantu, D.; Bokulich, N.A. Sources and Assembly of Microbial Communities in Vineyards as a Functional Component of Winegrowing. Front. Microbiol. 2021, 12, 673810. [Google Scholar] [CrossRef] [PubMed]
- Liang, H.; Wang, X.; Yan, J.; Luo, L. Characterizing the Intra-Vineyard Variation of Soil Bacterial and Fungal Communities. Front. Microbiol. 2019, 10, 1239. [Google Scholar] [CrossRef] [PubMed]
- Gobbi, A.; Acedo, A.; Imam, N.; Santini, R.G.; Ortiz-Álvarez, R.; Ellegaard-Jensen, L.; Belda, I.; Hansen, L.H. A Global Microbiome Survey of Vineyard Soils Highlights the Microbial Dimension of Viticultural Terroirs. Commun. Biol. 2022, 5, 241. [Google Scholar] [CrossRef] [PubMed]
- Palladino, G.; Nanetti, E.; Scicchitano, D.; Cinti, N.; Foresto, L.; Cozzi, A.; Gonzalez Vara Rodriguez, A.; Interino, N.; Fiori, J.; Turroni, S.; et al. Zonation of the Vitis Vinifera Microbiome in Vino Nobile Di Montepulciano PDO Production Area. Commun. Biol. 2024, 7, 1626. [Google Scholar] [CrossRef] [PubMed]
- Bekris, F.; Papadopoulou, E.; Vasileiadis, S.; Karapetsas, N.; Theocharis, S.; Alexandridis, T.K.; Koundouras, S.; Karpouzas, D.G. Vintage and Terroir Are the Strongest Determinants of Grapevine Carposphere Microbiome in the Viticultural Zone of Drama, Greece. FEMS Microbiol. Ecol. 2025, 101, fiaf008. [Google Scholar] [CrossRef] [PubMed]
- Flörl, L.; Schönenberger, P.; Rienth, M.; Bokulich, N.A. Grape Expectations: Disentangling Environmental Drivers of Microbiome Establishment in Winegrowing Ecosystems. npj Biofilms Microbiomes 2026, 12, 49. [Google Scholar] [CrossRef] [PubMed]
- Berlanas, C.; Berbegal, M.; Elena, G.; Laidani, M.; Cibriain, J.F.; Sagües, A.; Gramaje, D. The Fungal and Bacterial Rhizosphere Microbiome Associated With Grapevine Rootstock Genotypes in Mature and Young Vineyards. Front. Microbiol. 2019, 10, 1142. [Google Scholar] [CrossRef] [PubMed]
- Prada, J.; Pereira-Dias, L.; Santos, J.A.; Santos, C. Influence of Environment and Rootstock On the Rhizosphere Bacterial Communities in Four Vineyards of the Douro Demarcated Region. Microb. Ecol. 2026, 89, 159. [Google Scholar] [CrossRef] [PubMed]
- Liang, H.; Wang, X.; Yan, J.; Luo, L. Characterizing the Intra-Vineyard Variation of Soil Bacterial and Fungal Communities. Front. Microbiol. 2019, 10, 1239. [Google Scholar] [CrossRef] [PubMed]
- Malard, L.A.; Mod, H.K.; Guex, N.; Broennimann, O.; Yashiro, E.; Lara, E.; Mitchell, E.A.D.; Niculita-Hirzel, H.; Guisan, A. Comparative Analysis of Diversity and Environmental Niches of Soil Bacterial, Archaeal, Fungal and Protist Communities Reveal Niche Divergences along Environmental Gradients in the Alps. Soil Biol. Biochem. 2022, 169, 108674. [Google Scholar] [CrossRef]
- Viñas, M.; Marull, J.; Guivernau, M.; Tello, E.; Lucas, Y.; Carreras-Sempere, M.; Giol-Casanova, X.; Funes, I.; Sánchez-Costa, E.; Savé, R.; et al. Impact of Organic and Conventional Agricultural Management on Subsurface Soil Microbiota in Mediterranean Vineyards. Agronomy 2025, 15, 2001. [Google Scholar] [CrossRef]
- Glassman, S.I.; Wang, I.J.; Bruns, T.D. Environmental Filtering by PH and Soil Nutrients Drives Community Assembly in Fungi at Fine Spatial Scales. Mol. Ecol. 2017, 26, 6960–6973. [Google Scholar] [CrossRef] [PubMed]
- Yang, X.; Ma, D.; Yang, T.; Zhang, Y.; Chen, L.; Jiang, H.; Chen, B.; Zhang, N.; Zou, H.; Zhang, C.; et al. Dual Mechanisms of Mineral-Microbial Interactions in Suppressing Organic Carbon Sequestration in Calcareous Soils. J. Environ. Manag. 2026, 400, 128692. [Google Scholar] [CrossRef] [PubMed]
- Dou, X.; Zhang, C.; Chen, L.; Wu, Q.; Zhou, G.; Ma, D.; Zhao, Z.; Zhang, J. Calcium Forms Influence Soil Organic Carbon by Mediating Labile Organic Carbon Fractions, Carbon Pool Management Indices and Microbial Communities in Calcareous Alkaline Soils. Plant Soil 2025, 512, 801–817. [Google Scholar] [CrossRef]
- Mezzatesta, D.; Oyuela Aguilar, M.; Gobbi, A.; Pistorio, M.; Hansen, L.H.; Buscema, F.; Piccoli, P.; Berli, F. Soil-Associated Fungal and Prokaryotic Diversity Influenced by Stoniness, Depth and Vintage in a High-Altitude Vineyard. OENO One 2024, 58. [Google Scholar] [CrossRef]
- Bai, C.; Yao, Y.; Wang, H.; Li, H.; Wei, R. The Fungal Microbiome in the Vineyard Ecosystem Plays a Key Role in Shaping the Regional Characteristics of Wine. Foods 2025, 14, 1211. [Google Scholar] [CrossRef] [PubMed]
- Li, X.; Zhang, J.; Liu, B.; Su, Z. A Critical Review on the Application and Recent Developments of Post-Modified Biochar in Supercapacitors. J. Clean. Prod. 2021, 310, 127428. [Google Scholar] [CrossRef]
- Sun, Z.; Lin, M.; Du, C.; Hao, Y.; Zhang, Y.; Wang, Z. The Use of Manure Shifts the Response of α-Diversity and Network While Not β-Diversity of Soil Microbes to Altered Irrigation Regimes. Appl. Soil Ecol. 2022, 174, 104423. [Google Scholar] [CrossRef]
- Novello, G.; Gamalero, E.; Bona, E.; Boatti, L.; Mignone, F.; Massa, N.; Cesaro, P.; Lingua, G.; Berta, G. The Rhizosphere Bacterial Microbiota of Vitis Vinifera Cv. Pinot Noir in an Integrated Pest Management Vineyard. Front. Microbiol. 2017, 8, 1528. [Google Scholar] [CrossRef] [PubMed]
- Miura, T.; Sánchez, R.; Castañeda, L.E.; Godoy, K.; Barbosa, O. Is Microbial Terroir Related to Geographic Distance between Vineyards? Environ. Microbiol. Rep. 2017, 9, 742–749. [Google Scholar] [CrossRef] [PubMed]
- Leal, C.M.; Geiger, A.; Molnár, A.; Váczy, K.Z.; Kgobe, G.; Zsófi, Z.; Geml, J. Disentangling the Effects of Terroir, Season, and Vintage on the Grapevine Fungal Pathobiome. Front. Microbiol. 2024, 14, 1322559. [Google Scholar] [CrossRef] [PubMed]
- Torres, N.; Yu, R.; Kurtural, S.K. Inoculation with Mycorrhizal Fungi and Irrigation Management Shape the Bacterial and Fungal Communities and Networks in Vineyard Soils. Microorganisms 2021, 9, 1273. [Google Scholar] [CrossRef] [PubMed]
- Carbone, M.J.; Alaniz, S.; Mondino, P.; Gelabert, M.; Eichmeier, A.; Tekielska, D.; Bujanda, R.; Gramaje, D. Drought Influences Fungal Community Dynamics in the Grapevine Rhizosphere and Root Microbiome. JoF 2021, 7, 686. [Google Scholar] [CrossRef] [PubMed]
- Deng, Q.; Wu, Y.; Zhao, X.; Qiu, C.; Xia, S.; Feng, Y.; Liu, H. Influence of Different Irrigation Methods on the Alfalfa Rhizosphere Soil Fungal Communities in an Arid Region. PLoS ONE 2022, 17, e0268175. [Google Scholar] [CrossRef] [PubMed]
- Onoszko, K.; González-Moreno, P.; Ruiz-Gómez, F.J. Unravelling the Diversity of Soil Fungal and Oomycete Communities in the Quercus Ilex L. Rhizosphere of Dehesa Grasslands: A Metabarcoding Approach. Plant Soil 2026, 524, 263–292. [Google Scholar] [CrossRef]
- Vink, S.N.; Chrysargyris, A.; Tzortzakis, N.; Salles, J.F. Bacterial Community Dynamics Varies with Soil Management and Irrigation Practices in Grapevines (Vitis Vinifera L.). Appl. Soil Ecol. 2021, 158, 103807. [Google Scholar] [CrossRef]
- Ohigashi, T.; Madegwa, Y.M.; Karuku, G.N.; Njira, K.; Uchida, Y. Agricultural Land Use Induces Broader Homogenization of Soil Microbial Functional Composition than Taxonomic Composition in Sub-Saharan Africa. Soil Biol. Biochem. 2025, 209, 109895. [Google Scholar] [CrossRef]
- Gu, H.; Liu, Z.; Liu, S.; Hu, X.; Yu, Z.; Li, Y.; Li, L.; Sui, Y.; Jin, J.; Liu, X.; et al. Land Conversion to Cropland Homogenizes Variation in Soil Biota, Gene Assemblages, and Ecological Strategies on Local and Regional Scales. ISME J. 2025, 19, wraf264. [Google Scholar] [CrossRef] [PubMed]
- Zheng, B.; Hui, N.; Jumpponen, A.; Lu, C.; Pouyat, R.; Szlavecz, K.; Wardle, D.A.; Yesilonis, I.; Setälä, H.; Kotze, D.J. Urbanization Leads to Asynchronous Homogenization of Soil Microbial Communities across Biomes. Environ. Sci. Ecotechnology 2025, 25, 100547. [Google Scholar] [CrossRef] [PubMed]
- Chen, Y.; Neilson, J.W.; Kushwaha, P.; Maier, R.M.; Barberán, A. Life-History Strategies of Soil Microbial Communities in an Arid Ecosystem. ISME J. 2021, 15, 649–657. [Google Scholar] [CrossRef] [PubMed]
- Yu, Z.; Zeng, X.; Cheng, X.; Zhang, Q.; Zhang, K. Patterns and Environmental Drivers of Soil Microbial Succession. Glob. Change Biol. 2025, 31, e70475. [Google Scholar] [CrossRef] [PubMed]
- Zheng, Q.; Hu, Y.; Zhang, S.; Noll, L.; Böckle, T.; Dietrich, M.; Herbold, C.W.; Eichorst, S.A.; Woebken, D.; Richter, A.; et al. Soil Multifunctionality Is Affected by the Soil Environment and by Microbial Community Composition and Diversity. Soil Biol. Biochem. 2019, 136, 107521. [Google Scholar] [CrossRef] [PubMed]
- Xue, R.; Wang, C.; Zhao, L.; Cao, J.; Liu, M.; Zhang, D. Agricultural Intensification Weakens Soil Multifunctionality by Reducing Fungal Diversity. Appl. Soil Ecol. 2023, 189, 104900. [Google Scholar] [CrossRef]
- Li, H.; Wang, H.; Jia, B.; Li, D.; Fang, Q.; Li, R. Irrigation Has a Higher Impact on Soil Bacterial Abundance, Diversity and Composition than Nitrogen Fertilization. Sci. Rep. 2021, 11, 16901. [Google Scholar] [CrossRef] [PubMed]
- Steinauer, K.; Thakur, M.P.; Emilia Hannula, S.; Weinhold, A.; Uthe, H.; Van Dam, N.M.; Martijn Bezemer, T. Root Exudates and Rhizosphere Microbiomes Jointly Determine Temporal Shifts in Plant-soil Feedbacks. Plant Cell Environ. 2023, 46, 1885–1899. [Google Scholar] [CrossRef] [PubMed]
- Fu, X.; Huang, Y.; Fu, Q.; Qiu, Y.; Zhao, J.; Li, J.; Wu, X.; Yang, Y.; Liu, H.; Yang, X.; et al. Critical Transition of Soil Microbial Diversity and Composition Triggered by Plant Rhizosphere Effects. Front. Plant Sci. 2023, 14, 1252821. [Google Scholar] [CrossRef] [PubMed]
- Zhang, Y.; Du, Y.; Mu, Z.; Islam, W.; Zeng, F.; Gonzalez, N.C.T.; Zhang, Z. Impact of Seasonal Changes on Root-Associated Microbial Communities among Phreatophytes of Three Basins in Desert Ecosystem. Front. Plant Sci. 2025, 16, 1554879. [Google Scholar] [CrossRef] [PubMed]
- Catalani, A.; Brunori, E.; Chilosi, G.; Bernardini, A.; Vanino, S.; Migliore, M.; Farina, R.; Biasi, R. Soil Traits and Grapevine Rootstock Genotypes Modulate Arbuscular Mycorrhizal Rate and Species in a Mediterranean Environment. Agriculture 2024, 14, 1425. [Google Scholar] [CrossRef]
- Štůsková, K.; Vavřiník, A.; Hakalová, E.; Čechová, J.; Gramaje, D.; Eichmeier, A. Arbuscular Mycorrhizal Fungi Strongly Influence the Endorhizosphere of Grapevine Rootstock with Soil Type as a Key Factor. Mycorrhiza 2025, 35, 17. [Google Scholar] [CrossRef] [PubMed]
- Rivera-Becerril, F.; Van Tuinen, D.; Chatagnier, O.; Rouard, N.; Béguet, J.; Kuszala, C.; Soulas, G.; Gianinazzi-Pearson, V.; Martin-Laurent, F. Impact of a Pesticide Cocktail (Fenhexamid, Folpel, Deltamethrin) on the Abundance of Glomeromycota in Two Agricultural Soils. Sci. Total Environ. 2017, 577, 84–93. [Google Scholar] [CrossRef] [PubMed]
- Peng, Z.; Johnson, N.C.; Jansa, J.; Han, J.; Fang, Z.; Zhang, Y.; Jiang, S.; Xi, H.; Mao, L.; Pan, J.; et al. Mycorrhizal Effects on Crop Yield and Soil Ecosystem Functions in a Long-term Tillage and Fertilization Experiment. New Phytol. 2024, 242, 1798–1813. [Google Scholar] [CrossRef] [PubMed]
- Aguilar-Paredes, A.; Turrini, A.; Avio, L.; Stuardo, C.; Velásquez, A.; Becerra, J.; Giovannetti, M.; Seeger, M. Agricultural Managements Influence the Diversity of Arbuscular Mycorrhizal Fungi in Vineyards from Chilean Mediterranean Climate Ecosystems. J. Soil Sci. Plant Nutr. 2024, 24, 6099–6112. [Google Scholar] [CrossRef]
- Wang, H.; Yang, J.; Finn, D.R.; Brunotte, J.; Tebbe, C.C. Distinct Seasonal and Annual Variability of Prokaryotes, Fungi and Protists in Cropland Soil under Different Tillage Systems and Soil Texture. Soil Biol. Biochem. 2025, 203, 109732. [Google Scholar] [CrossRef]
- Zhang, J.; Ji, Y.; Guo, Y.; Yin, X.; Li, Y.; Han, J.; Liu, Y.; Wang, C.; Wang, W.; Liu, Y.; et al. Responses of Soil Respiration and Microbial Community Structure to Fertilizer and Irrigation Regimes over 2 Years in Temperate Vineyards in North China. Sci. Total Environ. 2022, 840, 156469. [Google Scholar] [CrossRef] [PubMed]
- Durney, C.; Robbe, E.; Vedrenne, L.; Genestier, J.; Wipf, D.; Poitou, X.; Courty, P.-E. Vitiforestry Management Enhances Soil Microbial Activity and Microbial Community Diversity in Soil and Roots Compared to Conventional Vineyard: Evidence from Five Adjacent Plots in a Small-Scale Trial in the Cognac Region (France). Symbiosis 2026, 99, 35–47. [Google Scholar] [CrossRef]
- Wang, H.; Du, X.; Zhang, Z.; Feng, F.; Zhang, J. Rhizosphere Interface Microbiome Reassembly by Arbuscular Mycorrhizal Fungi Weakens Cadmium Migration Dynamics. iMeta 2023, 2, e133. [Google Scholar] [CrossRef] [PubMed]
- Informe Anual Agencia Estatal Metereologia 2024; Agencia Estatal de Metereologia: Madrid, 2025.
- El Estado Mundial de La Agricultura y La Alimentacion; Roma, Italia, 2006.
- Jiménez-Ballesta, R.; Bravo, S.; Amorós, J.A.; Pérez-de-los-Reyes, C.; García-Pradas, J.; Sánchez, M.; García-Navarro, F.J. An Environmental Approach to Understanding the Expansion of Future Vineyards: Case Study of Soil Developed on Alluvial Sediments. Environments 2021, 8, 96. [Google Scholar] [CrossRef]
- World Reference Base for Soil Resources. International Soil Classification System for Naming Soils and Creating Legends for Soil Maps; International Union of Soil Sciences (IUSS): Vienna, Austria, 2022. [Google Scholar]
- Jiménez-Ballesta, R.; Bravo, S.; Pérez-de-los-Reyes, C.; Amorós, J.A.; García-Navarro, F.J. Soil Properties of Vineyards on Arkoses as a Basis to Understand Their Suitability and Optimum Performance. Eur. J. Soil Sci. 2023, 74, e13401. [Google Scholar] [CrossRef]
- Eslava-Lecumberri, F.J.; Jiménez-Ballesta, R. Delineating Vineyard Management Zones: INTRAFIELD Spatial Variability of Soil Properties of Carbonate Vineyard Soils. Eur. J. Soil Sci. 2024, 75, e70029. [Google Scholar] [CrossRef]
- Rivas, G.A.; Semorile, L.; Delfederico, L. Microbial Diversity of the Soil, Rhizosphere and Wine from an Emerging Wine-Producing Region of Argentina. LWT 2022, 153, 112429. [Google Scholar] [CrossRef]
- Canavera, G.; Vaccari, F.; Del Zozzo, F.; Poni, S.; Gatti, M.; Puglisi, E.; Frioni, T. Cover Crop-Based under-Row Dry Mulching Enhances Phyllosphere and Rhizosphere Microbial Biodiversity in a Non-Irrigated Vineyard. Environ. Microbiome 2026, 21, 32. [Google Scholar] [CrossRef] [PubMed]
- Jiménez-Ballesta, R.; Bravo, S.; Amorós, J.A.; Pérez-de-los-Reyes, C.; García-Pradas, J.; Sanchez, M.; García-Navarro, F.J. A Morphological Approach to Evaluating the Nature of Vineyard Soils in Semiarid Mediterranean Environment. Eur. J. Soil Sci. 2022, 73, e13201. [Google Scholar] [CrossRef]
- Kovács, B.; Andreolli, M.; Lampis, S.; Biró, B.; Kotroczó, Z. Bacterial Community Structure Responds to Soil Management in the Rhizosphere of Vine Grape Vineyards. Biology 2024, 13, 254. [Google Scholar] [CrossRef] [PubMed]
- Mezzatesta, D.; Oyuela Aguilar, M.; Gobbi, A.; Pistorio, M.; Hansen, L.H.; Buscema, F.; Piccoli, P.; Berli, F. Soil-Associated Fungal and Prokaryotic Diversity Influenced by Stoniness, Depth and Vintage in a High-Altitude Vineyard. OENO One 2024, 58. [Google Scholar] [CrossRef]
- Darriaut, R.; Antonielli, L.; Martins, G.; Ballestra, P.; Vivin, P.; Marguerit, E.; Mitter, B.; Masneuf-Pomarède, I.; Compant, S.; Ollat, N.; et al. Soil Composition and Rootstock Genotype Drive the Root Associated Microbial Communities in Young Grapevines. Front. Microbiol. 2022, 13, 1031064. [Google Scholar] [CrossRef] [PubMed]
- Conti Taguali, S.; Pöter, R.; Aloi, F.; Fernández-Trujillo, C.; Acedo, A.; La Spada, F.; Li Destri Nicosia, M.G.; Pane, A.; Schena, L.; Cacciola, S.O. Influence of Environmental and Agronomic Variables on Soil Microbiome in Citrus Orchards: A Comparative Analysis of Organic and Conventional Farming System. Microbiol. Res. 2025, 299, 128260. [Google Scholar] [CrossRef] [PubMed]
- Nilsson, R.H.; Larsson, K.-H.; Taylor, A.F.S.; Bengtsson-Palme, J.; Jeppesen, T.S.; Schigel, D.; Kennedy, P.; Picard, K.; Glöckner, F.O.; Tedersoo, L.; et al. The UNITE Database for Molecular Identification of Fungi: Handling Dark Taxa and Parallel Taxonomic Classifications. Nucleic Acids Res. 2019, 47, D259–D264. [Google Scholar] [CrossRef] [PubMed]
Figure 1.
Alpha diversity metrics of soil microbial communities across management systems and sampling seasons. Box plots display the distribution of (A) Bacterial Shannon Diversity Index (H′), (B) Bacterial Chao1 Richness estimator, (C) Fungal Shannon Diversity Index (H′), and (D) Fungal Chao1 Richness estimator under Irrigated (purple) and Rainfed (tan) agricultural systems. Individual data points overlaid on box plots represent sampling campaigns, color-coded by season (Red: Autumn; Green: Spring). Middle lines inside boxes denote medians, box limits represent the interquartile range (IQR, Q1–Q3), and whiskers extend to 1.5×IQR.
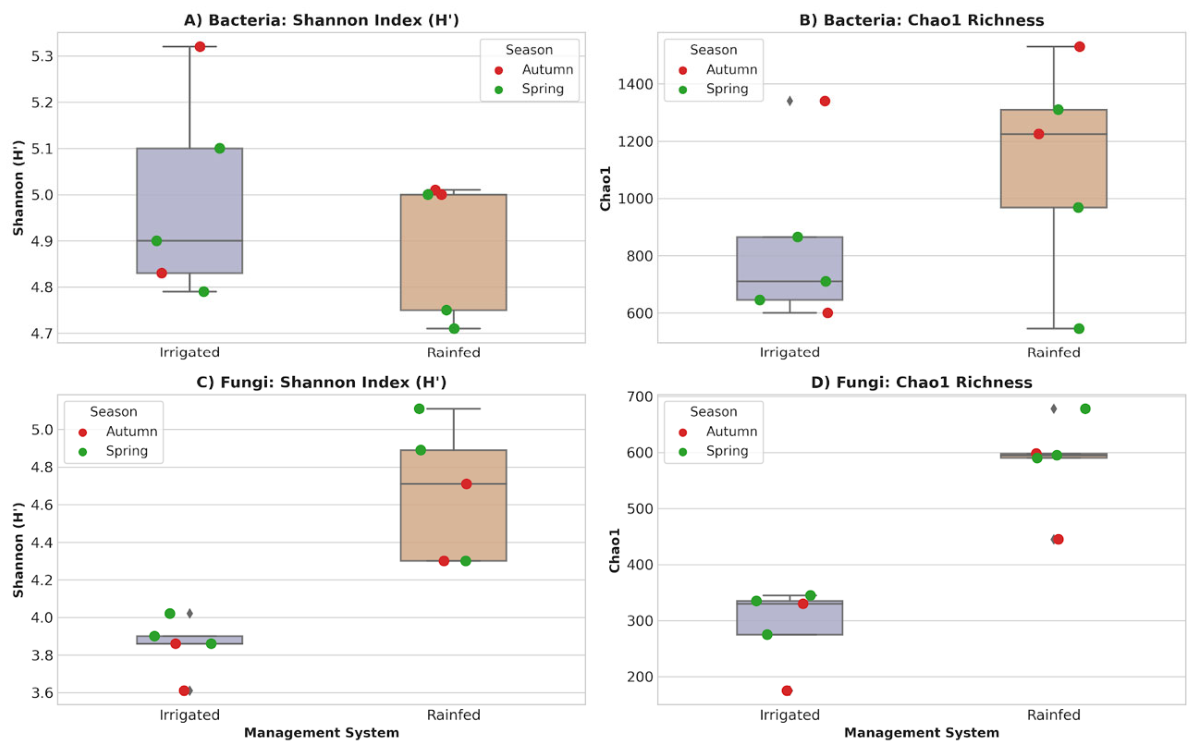
Figure 2.
Relative taxonomic abundance at the phylum level across sampling campaigns. Stacked bar plots show the percentage composition of (A) Major bacterial phyla (16S rRNA gene sequencing) and (B) Major fungal phyla (ITS region sequencing) across 10 sequential sampling events (Spring 2024 to Spring 2026) under Rainfed and Irrigated management systems. Colors correspond to the primary bacterial and fungal phyla identified in the rhizosphere.
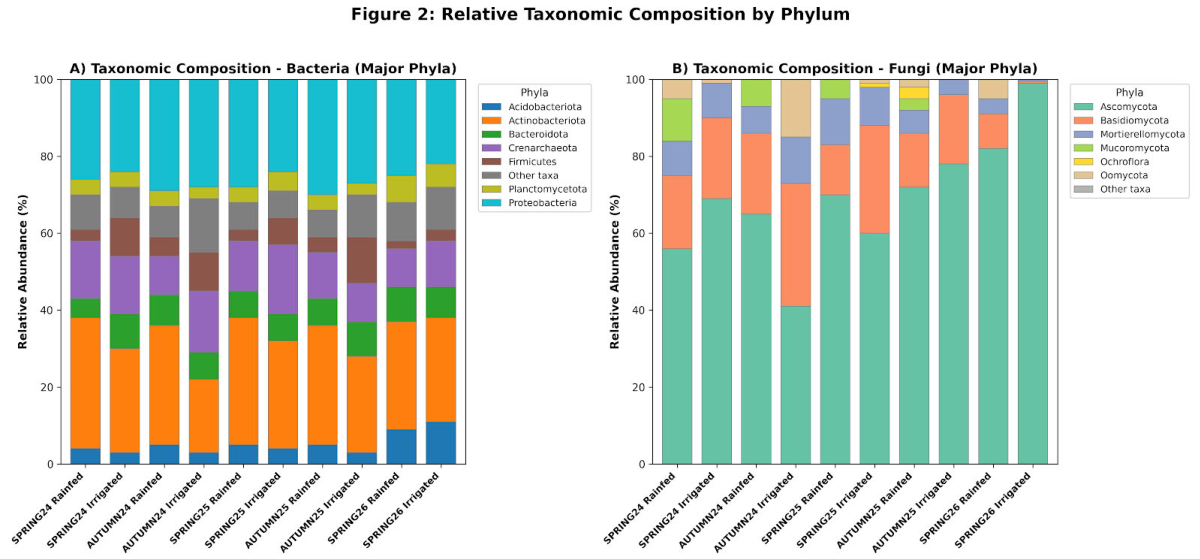
Figure 3.
Beta diversity structure of rhizosphere microbial communities based on Bray-Curtis dissimilarity. Principal Coordinate Analysis (PCoA) ordination plots for (A) Bacterial community structure (16S rRNA) and (B) Fungal community structure (ITS). Point colors designate the management system (Purple: Irrigated; Orange: Rainfed), while point shapes specify the sampling season (∙: Autumn; ×: Spring). Statistical significance was assessed using Permutational Multivariate Analysis of Variance (PERMANOVA, 999 permutations); R2 and p-values are annotated inside each panel (∗p<0.05, ∗∗p<0.01, ns: not significant).
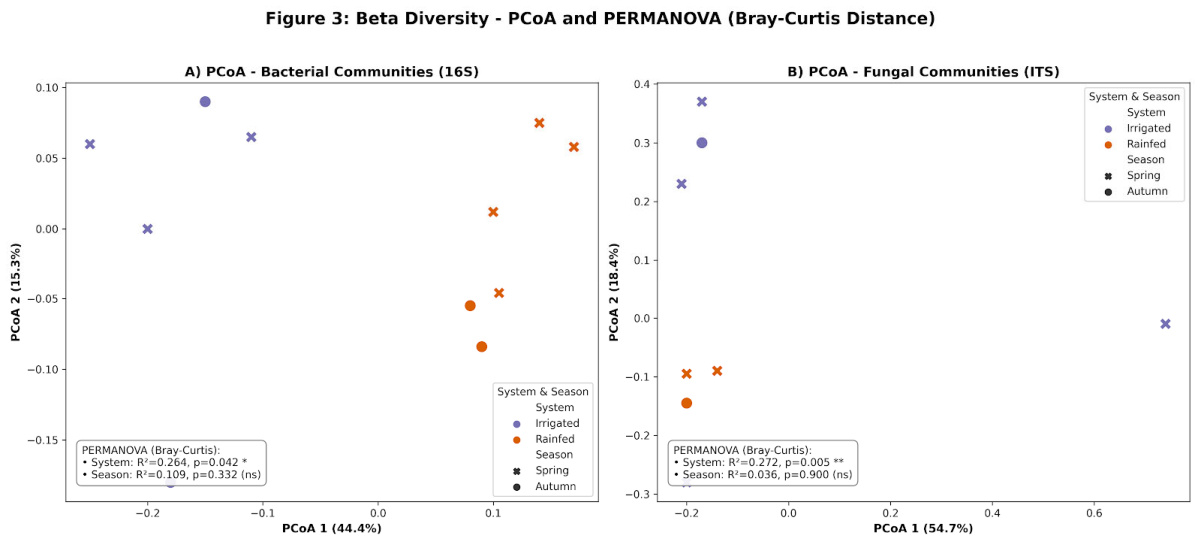
Figure 4.
Bacteria/Fungi ratio (Mean ± Standard Error) by season (Spring vs. Autumn) and water management system (Rainfed vs. Irrigated). Bars represent the mean ratio across 5 sampling campaigns and error bars show the Standard Error (SE). Soil under rainfed management consistently exhibits higher bacteria-to-fungi ratios across both seasons.
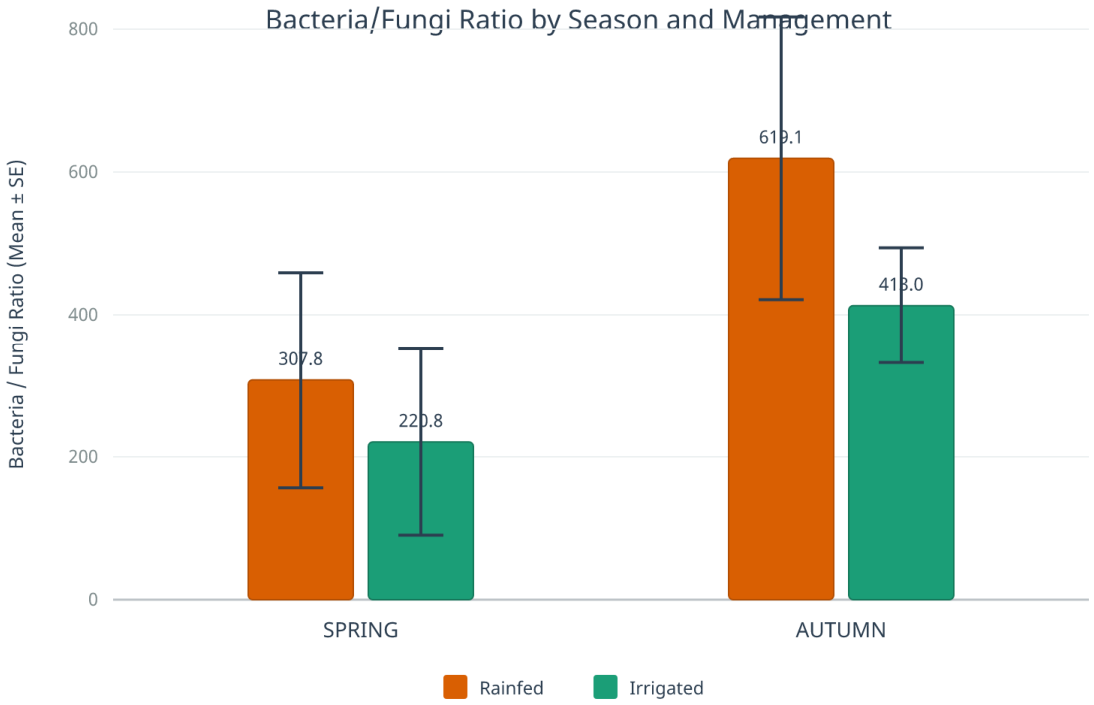

Table 1.
Alpha diversity indices (Shannon and Chao1) in irrigated and rainfed systems.
| Metric / Domain | Irrigated (Median) | Rain-fed (Median) | Interquartile range |
|---|---|---|---|
| Bacteria – Shannon (H') | 4.90 | 5.00 | 4.71–5.32 |
| Bacteria – Chao1 | 710 | 1220 | 542–1535 |
| Fungi – Shannon (H') | 3.86 | 4.71 | 3.61–5.11 |
| Fungi – Chao1 | 335 | 595 | 175–680 |
Table 2.
Results of the two-factor PERMANOVA analysis of bacterial and fungal beta diversity.
| Microbial domain | Factor evaluated | R² | F | p |
|---|---|---|---|---|
| Bacteria (16S) | Handling system | 0.264 | 2.86 | 0.042* |
| Station | 0.109 | 1.18 | 0.332 ns | |
| Fungi (ITS) | Handling system | 0.272 | 3.12 | 0.005 |
| Station | 0.036 | 0.41 | 0.900 ns |
*Statistical significance: p < 0.05; p < 0.01; ns, not significant.
Table 3.
Descriptive statistics for the bacteria-to-fungi ratio by management system and season.
| Group | n | Mean | SD | Median | Q1 | Q3 | Min–Max |
|---|---|---|---|---|---|---|---|
| Dry-farmed | 5 | 432.29 | 287.98 | 421.20 | 183.75 | 608.50 | 131.00–817.00 |
| Irrigated | 5 | 297.70 | 199.94 | 332.00 | 140.00 | 476.50 | 46.00–494.00 |
| Spring | 6 | 264.29 | 223.99 | 161.88 | 133.25 | 403.31 | 46.00–608.50 |
| Autumn | 4 | 516.05 | 211.29 | 457.60 | 398.90 | 574.75 | 332.00–817.00 |
Table 4.
Comparison of the B/H ratio between rainfed and irrigated fields within each season.
| Season | Dryland | Irrigated | Difference | t | gl | p |
|---|---|---|---|---|---|---|
| Spring | 307.75 | 220.83 | 86.92 | 1.811 | 2 | 0.212 |
| Autumn | 619.10 | 413.00 | 206.10 | 1.763 | 1 | 0.328 |
Table 5.
Exploratory factorial model of the bacteria-to-fungi ratio during 2024–2025.
| Source | SC | gl | F | p |
|---|---|---|---|---|
| Year | 11059.563 | 1 | 0.126 | 0.746 |
| System | 58131.975 | 1 | 0.662 | 0.475 |
| Station | 70209.413 | 1 | 0.800 | 0.437 |
| System × Station | 2536.500 | 1 | 0.029 | 0.876 |
Disclaimer/Publisher’s Note: The statements, opinions and data contained in all publications are solely those of the individual author(s) and contributor(s) and not of MDPI and/or the editor(s). MDPI and/or the editor(s) disclaim responsibility for any injury to people or property resulting from any ideas, methods, instructions or products referred to in the content. |
© 2026 by the authors. Licensee MDPI, Basel, Switzerland. This article is an open access article distributed under the terms and conditions of the Creative Commons Attribution (CC BY) license (http://creativecommons.org/licenses/by/4.0/).
Copyright: This open access article is published under a Creative Commons CC BY 4.0 license, which permit the free download, distribution, and reuse, provided that the author and preprint are cited in any reuse.