

Submitted:
02 October 2026
Posted:
05 October 2026
You are already at the latest version
Abstract
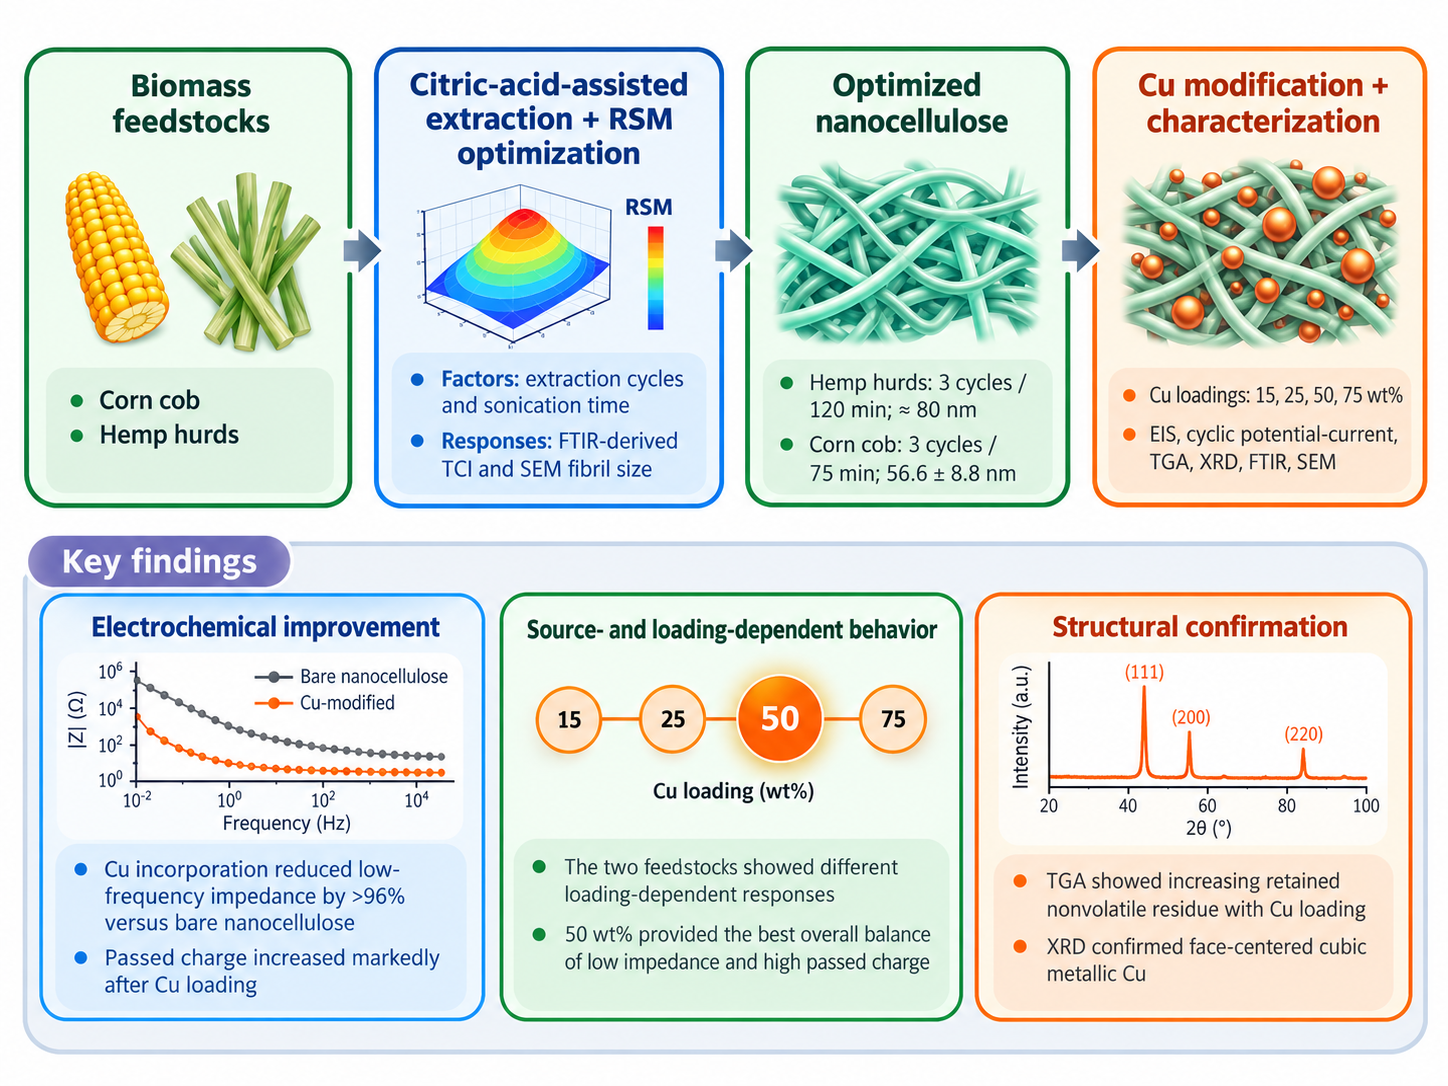
Nanocellulose was produced from hemp hurds and corn cob using a citric-acid-assisted chemical–mechanical route optimized by response surface methodology (RSM). Extraction cycle number and probe-sonication time were evaluated as process variables, with FTIR-derived total crystallinity index (TCI) and SEM-derived fibril size as responses. The selected conditions were 3 cycles/120 min for hemp hurds and 3 cycles/75 min for corn cob, yielding experimentally observed fibril sizes of 80 nm and 56.6 ± 8.8 nm, respectively. The optimized nanocelluloses were modified with nominal Cu loadings of 15, 25, 50, and 75 wt%. Cu incorporation reduced low-frequency impedance by more than 96% relative to bare nanocellulose and markedly increased cycle-5 passed charge, although the loading dependence differed between biomass sources. The 50 wt% formulations provided the most consistent combination of relatively low impedance and high passed charge across both sources. TGA revealed source-dependent increases in retained nonvolatile residue with Cu loading, while XRD confirmed face-centered cubic metallic Cu together with weaker cellulose-related reflections. The results demonstrate that extraction history and biomass source jointly govern nanocellulose structure and the electrochemical response to Cu modification.
Keywords:
nanocellulose
; biomass
; corn cob
; hemp hurds
; response surface methodology
; copper modifica-tion
; electrochemical properties
1. Introduction
Nanocellulose has attracted considerable attention as a renewable nanomaterial because of its low density, high specific surface area, favorable mechanical properties, abundant surface hydroxyl groups, and ability to form interconnected fibrillar networks. Depending on the biomass source and processing route, cellulose nanomaterials can differ substantially in dimensions, structural organization, surface chemistry, and interfacial behavior, which directly influence their suitability for applications in composites, membranes, sensors, and energy-related systems [1,2,3]. The utilization of lignocellulosic residues as feedstocks is particularly attractive because it combines nanomaterial production with biomass valorization and the conversion of agricultural wastes into value-added functional materials.
The characteristics of nanocellulose are strongly affected by both the botanical source and the extraction history. Differences in cellulose organization, lignin and hemicellulose content, ash, extractives, and native fiber architecture can influence chemical purification, fibrillation efficiency, and the structural properties of the resulting nanocellulose [1,2,3]. Corn cob and hemp hurds are abundant agricultural residues with distinctly different chemical compositions and fiber morphologies. Nanocellulose has previously been produced from corn-cob-derived biomass through combined chemical and mechanical treatments [4], while hemp-derived residues have also been investigated as sustainable cellulose sources [5,6]. However, direct comparison of these two biomass sources under an identical extraction and optimization framework remains limited.
Efficient nanocellulose production requires careful control of the processing conditions. Chemical pretreatment facilitates the removal of non-cellulosic components and increases cellulose accessibility, whereas subsequent mechanical treatments such as sonication or homogenization promote fibrillation and reduction of fiber dimensions [7,8]. Most nanocellulose extraction routes are described as sequential chemo-mechanical processes; however, achieving extensive fibrillation may require repeated mechanical treatment. For example, Samsalee et al. demonstrated that increasing high-pressure homogenization from 6 to 12 cycles affected particle size, crystallinity, and other properties of rice-husk-derived nanocellulose, while Sonyeam et al. similarly showed that the number of homogenization passes influenced fibrillation and crystallinity of nanocellulose produced from palm empty fruit bunch [8,9]. Nevertheless, these studies primarily considered repeated passes within a specific mechanical fibrillation step. In contrast, repetition of the overall extraction sequence has rarely been treated as an independent process variable in optimization of nanocellulose production from agricultural residues. In the present study, this repetition is defined as the number of extraction cycles and is introduced as an RSM factor. This variable is also relevant from an energy-efficiency perspective, because insufficient repetition may lead to incomplete fibrillation, whereas excessive mechanical processing increases energy input and may even adversely affect structural order or crystallinity [8,10]. In addition, the present extraction route employs citric acid rather than the more conventional sulfuric-acid hydrolysis, offering potential environmental and process advantages. Sulfuric-acid-based nanocellulose production is effective but can involve severe equipment corrosion, substantial water consumption for washing and neutralization, and acidic effluent generation [11,12]. By comparison, citric acid is a biodegradable organic acid that has been proposed as a more sustainable alternative for nanocellulose production and can be integrated into biorefinery concepts [13]. Importantly, citric-acid-based systems also offer the possibility of acid recovery and reuse; recyclable citric-acid-containing hydrolysis systems have been demonstrated experimentally, and citric acid can also be recovered by recrystallization from process effluents [14,15]. Thus, combining recoverable organic-acid treatment with optimization of cycle number provides an opportunity to improve both fibrillation efficiency and process sustainability.
Response surface methodology (RSM) offers an appropriate approach for simultaneously evaluating such interacting process variables and identifying operating conditions that balance competing material responses. RSM has been applied to optimize nanocellulose production from different lignocellulosic feedstocks by examining variables such as treatment severity, chemical concentration, reaction time, and mechanical processing conditions [16,17,18,19] . Nevertheless, comparatively little attention has been given to extraction cycle number as an explicit RSM factor or to how source-dependent nanocellulose characteristics subsequently influence functional modification.
Although nanocellulose provides a versatile nanoscale scaffold, its intrinsic electronic conductivity is low. Functional electrochemical applications therefore generally require incorporation of conductive or electroactive components. The hydroxyl-rich surface of nanocellulose enables interaction with inorganic and metallic species through adsorption, coordination, ionic interactions, and surface modification [20,21,22]. Copper is particularly attractive because of its electrical conductivity, availability, and ability to interact with oxygen-containing groups on cellulose-based substrates. Copper-containing cellulose and nanocellulose systems have consequently been investigated for functional and conductive applications and characterized using techniques including X-ray photoelectron spectroscopy and thermal analysis [23,24]. However, the combined effects of nanocellulose source and Cu loading on the electrochemical properties of such materials remain insufficiently understood.
In this study, nanocellulose extraction from corn cob and hemp hurds was optimized using RSM, with extraction cycle number and sonication time employed as process variables and FTIR-derived total crystallinity index (TCI) and fibril size considered as response parameters. The optimized nanocellulose obtained from each source was subsequently modified using four nominal Cu loadings of 15, 25, 50, and 75 wt%. The retained Cu-containing fraction was evaluated by thermogravimetric (TGA) analysis and compared with the theoretically introduced Cu content. Morphological and structural characteristics were investigated using FTIR spectroscopy, scanning electron microscopy, and X-ray diffraction, while thermogravimetric analysis was used to evaluate the retained Cu-containing fraction. Electrochemical impedance spectroscopy and cyclic potential-current measurements were used to assess the effect of Cu loading on electrochemical behavior. The study therefore aimed not only to optimize nanocellulose production while considering processing efficiency, but also to determine whether biomass source governs the structural and electrochemical response of nanocellulose to Cu modification.
2. Materials and Methods
2.1.. Materials
Hemp hurds and corn cobs were used as lignocellulosic feedstocks for nanocellulose production. Hemp hurds were supplied by Hempium Life (Merzifon, Türkiye), whereas corn cobs were obtained from local producers in Rize, Türkiye. The raw materials were dried, ground, and sieved to obtain 70-mesh powders before chemical treatment.
Citric acid monohydrate (C₆H₈O₇·H₂O; Isolab), sodium hydroxide (NaOH; Supelco), sodium sulfide (Na₂S), polyvinylpyrrolidone (PVP; Sigma-Aldrich), L-ascorbic acid (≥99%; Fisher Chemical), and copper(II) nitrate trihydrate (Cu(NO₃)₂·3H₂O; Tekkim) were used as received. Distilled water was used throughout the extraction, washing, and Cu-modification procedures.
2.2. Experimental Design and Optimization of Nanocellulose Extraction
Response surface methodology (RSM) was used to investigate the effects of extraction cycle number and probe-sonication time on nanocellulose production from hemp hurds and corn cobs. FTIR-derived total crystallinity index (TCI) and SEM-derived fibril size were selected as response variables.
In this study, an extraction cycle was defined as repetition of the chemical–mechanical treatment sequence used for nanocellulose production. Cycle number was therefore considered as an independent processing variable rather than treating the extraction route as a single-pass procedure. Separate RSM models were established for hemp-hurd- and corn-cob-derived nanocellulose, and numerical optimization was performed to identify conditions providing high TCI and reduced fibril dimensions while minimizing unnecessary processing.
2.3. Nanocellulose Extraction
2.3.1. Alkaline Delignification
For each biomass source, 2 g of dried and sieved material was treated with 60 mL of an alkaline sulfide solution containing 23 wt% NaOH, 25 wt% Na₂S, and 52 wt% distilled water. The mixtures were transferred into sealed high-pressure reactors and treated at 165 °C for 3 h.
After treatment, the solid fraction was recovered by centrifugation and washed repeatedly with distilled water to remove residual chemicals and soluble degradation products. Ethanol was included in the final washing step.
2.3.2. Citric Acid Treatment
Following alkaline delignification, the recovered biomass was treated with 85 wt% citric acid. The samples were transferred into sealed reactors and maintained at 110 °C for 7 h.
After treatment, the samples were centrifuged and washed with distilled water until excess citric acid and soluble reaction products were removed.
The use of citric acid provides an alternative to conventional strong mineral-acid hydrolysis and offers potential advantages in terms of lower corrosiveness and the possibility of acid recovery and reuse.
2.3.3. Probe Ultrasonication
Following citric acid treatment, the cellulose-rich material was dispersed in distilled water and subjected to probe ultrasonication using an UP200Ht ultrasonic homogenizer. Sonication time was varied according to the RSM experimental design.
The sample vessel was maintained in an ice-water bath during sonication to minimize temperature increases caused by acoustic cavitation. After sonication, the suspensions were centrifuged and washed with distilled water, and the recovered nanocellulose was collected for characterization and Cu modification.
2.4. Copper Modification of Nanocellulose
The optimized nanocellulose obtained from each biomass source was modified with Cu using an in situ chemical reduction method adapted from Pinto et al. [25]. Copper(II) nitrate trihydrate was used as the Cu precursor, L-ascorbic acid as the reducing agent, and PVP as the stabilizing agent.
Four nominal Cu contents, 15, 25, 50, and 75 wt%, were prepared for both hemp-hurd- and corn-cob-derived nanocellulose. The required amount of Cu(NO₃)₂·3H₂O was calculated stoichiometrically from its metallic Cu content, assuming 100% reduction and incorporation efficiency. These values were considered the theoretical Cu contents of the prepared samples.
For Cu incorporation, the optimized nanocellulose was dispersed in distilled water and introduced into the reaction medium containing PVP and the corresponding amount of Cu precursor. The pH was adjusted to 6–7 using NaOH, and the reaction medium was purged with nitrogen to minimize oxidation. L-ascorbic acid was then added gradually under continuous stirring.
The reduction reaction was carried out at 70 °C under vigorous stirring. During the reaction, Cu²⁺ ions were reduced by ascorbic acid, leading to the formation of Cu-containing domains associated with the nanocellulose structure. The modified nanocellulose was subsequently recovered by centrifugation, washed to remove residual soluble species, and dried prior to characterization.
Samples were designated according to biomass source and nominal Cu loading as bare nanocellulose and 15, 25, 50, and 75 wt% Cu-modified nanocellulose.
2.5. Structural and Morphological Characterization
Fourier-transform infrared spectroscopy (FTIR) was used to evaluate the chemical characteristics and relative structural order of the extracted nanocellulose. The total crystallinity index (TCI) was calculated according to the infrared ratio proposed by Nelson and O’Connor, using the absorbance ratio of the cellulose bands at approximately 1372 and 2900 cm⁻¹ [26]:
where A1372 and A2900 represent the absorbance intensities at approximately 1372 and 2900 cm⁻¹, respectively. The TCI was used as a relative, semiquantitative indicator of cellulose structural order rather than an absolute crystallinity percentage, in accordance with recent assessments of cellulose crystallinity determination methods [27].
TCI = A₁₃₇₂/A₂₉₀₀
Scanning electron microscopy (SEM) was used to examine the morphology and fibrillation of the extracted materials. Fibril dimensions were determined from SEM micrographs and used together with FTIR-derived TCI as response variables in the RSM optimization.
Following electrochemical evaluation, the 50 wt% Cu-modified formulations from each biomass source, H-NC-Cu 50 wt% and C-NC-Cu 50 wt%, were selected for further structural characterization by X-ray diffraction (XRD). XRD was used to identify the crystalline Cu-containing phase and to evaluate the remaining cellulose-related diffraction features in the Cu-modified nanocellulose.
2.6. Thermogravimetric Analysis and Evaluation of Cu-Containing Residue
Thermogravimetric analysis (TGA) was used to evaluate the retained Cu-containing inorganic fraction of the modified nanocellulose samples. Bare nanocellulose and samples containing nominal Cu loadings of 15, 25, 50, and 75 wt% were subjected to controlled thermal decomposition. Approximately 5–10 mg of dried sample was used for each measurement. The samples were heated from 30 to 105 °C at a heating rate of 10 °C min⁻¹ and held at 105 °C for 30 min to remove residual moisture. They were subsequently heated from 105 to 600 °C at 10 °C min⁻¹ and maintained at 600 °C for 60 min, followed by heating to 800 °C at the same rate and a final isothermal hold at 800 °C for 30 min. Nitrogen was supplied as a protective gas during the measurement.
During heating, the organic nanocellulose fraction was progressively degraded, while a Cu-containing inorganic residue remained at the end of the analysis. The final residual mass at 800 °C was therefore used to estimate the retained Cu-containing fraction of each sample and to compare the experimentally retained inorganic content with the corresponding nominal Cu loading calculated under the assumption of 100% incorporation efficiency. Because nitrogen served only as a protective gas rather than as a reducing atmosphere, oxidation of the Cu-containing phase could not be excluded. Therefore, the final residue was interpreted as a Cu-containing inorganic fraction rather than directly as elemental metallic Cu.
2.7. Electrochemical Characterization
Electrochemical measurements were performed using a Metrohm potentiostat/galvanostat and Metrohm screen-printed electrodes. Bare nanocellulose and the four Cu-modified compositions containing nominal Cu contents of 15, 25, 50, and 75 wt% were evaluated separately for both hemp-hurd- and corn-cob-derived nanocellulose.
For each composition, three independently prepared samples were analyzed to evaluate reproducibility. Equivalent amounts of sample were deposited and compacted onto the active area of the screen-printed electrodes under comparable conditions.
Electrochemical impedance spectroscopy (EIS) was performed over the selected frequency range using identical measurement conditions for all samples. Impedance magnitude, phase response, and Nyquist behavior were analyzed to evaluate changes in electrical and interfacial characteristics resulting from Cu incorporation.
Cyclic potential-current measurements were additionally performed by repeatedly sweeping the applied potential between the selected negative and positive potential limits. The resulting current-potential curves were used to evaluate the electrochemical response and the charge passed during each cycle. Measurements obtained after stabilization of the cyclic response were used for comparison among compositions.
The electrochemical behavior was compared both as a function of Cu loading within each biomass source and between hemp-hurd- and corn-cob-derived nanocellulose, enabling evaluation of source-dependent differences in the electrochemical response to Cu modification.
3. Results
3.1. RSM-Guided Optimization of Nanocellulose Extraction
Nanocellulose extraction from hemp hurds and corn cob was evaluated as a two-factor process in which extraction cycle number and probe-sonication time were varied, with FTIR-derived total crystallinity index (TCI) and SEM-derived fibril size used as responses. The two feedstocks exhibited different response landscapes. TCI was treated as a relative band-intensity-based indicator of cellulose structural order rather than as an absolute crystallinity percentage [27]. The model-predicted response surfaces are presented in Figure 1. The complete design matrices, individual response values, model outputs, numerical optimization results, and supporting SEM and FTIR analyses are provided in the Supporting Information (Table S1–S4 and Figure S1–S4).
3.1.1. Hemp-Hurd Nanocellulose
The hemp-hurd experiments produced a broad response range, with TCI values from 0.851 to 7.239 and apparent fibril sizes from 68 to 350 nm. At one extraction cycle, TCI remained close to unity (1.061-1.172) across 30-120 min sonication, indicating that sonication alone did not generate the pronounced increase in FTIR structural order observed after repeated processing. In contrast, the five measurements at the central condition of 3 cycles and 75 min gave a mean TCI of 3.636 ± 0.071 and a mean size of 162.2 ± 3.1 nm, showing good repeatability of the central response. The highest measured TCI, 7.239, occurred at the short-sonication axial condition (laboratory code 3-11H), although the corresponding size remained 140 nm.
At 120 min sonication, TCI increased from 1.136 after one cycle to 5.380 after two cycles and 5.735 after three cycles, while the corresponding size decreased from 175 to 140 and 80 nm, respectively. Increasing the treatment to four cycles reduced TCI to 1.098, while the measured size decreased further to 68 nm. Thus, the measured responses were non-monotonic with cycle number.
Numerical optimization identified approximately 3 cycles and 120 min as the selected practical region. The solution predicted a TCI of 4.791 and a size of 67.2 nm with a desirability of 1.000. Experimentally, the 3-120H sample exhibited a TCI of 5.735 and a size of 80 nm. This condition was selected for subsequent Cu modification (Table 1).
3.1.2. Corn-Cob Nanocellulose
Across the 13-run corn-cob design, TCI ranged from 0.530 to 3.768 and fibril size from 22 to 225 nm. The highest TCI was obtained at the short-sonication axial condition (3-11C; TCI = 3.768, size = 100 nm). At 3 cycles and 75 min, five center-point measurements yielded a mean TCI of 2.242 ± 0.002 and a mean size of 56.6 ± 8.8 nm. The 4-cycle/30-min condition produced the smallest measured size (22 nm) but a TCI of 1.292, whereas 5 cycles at 75 min produced a TCI of 0.530 and a size of 225 nm.
The numerical desirability solution selected 3 cycles and 75 min, with predicted TCI and size values of 2.154 and 61.3 nm, respectively, and a desirability of 0.734. These values were close to the observed center-point means, and the 3-75C condition was selected as the optimized corn-cob nanocellulose (Table 1).
The three-dimensional desirability surfaces further illustrate the distinct optimization windows of the two biomass sources (Figure 2). For hemp hurds, the desirability maximum was concentrated at high sonication time and an intermediate cycle number, supporting the selection of 3 cycles and 120 min as the optimum condition. In contrast, corn cob exhibited a broader optimum region, with the desirability maximum centered around 3 cycles and 75 min.
3.1.3. Model Adequacy
For hemp hurds, the cubic models gave R² values of 0.964 for TCI and 0.994 for size; however, lack-of-fit tests were significant and the predicted R² values were negative. For corn cob, the quadratic TCI model was significant (p = 0.010; R² = 0.841), whereas the size model was not statistically significant (p = 0.270; R² = 0.537), and significant lack of fit was also observed. Accordingly, the selected samples were chosen using numerical desirability together with measured TCI, measured fibril size, and practical processing conditions rather than the fitted mathematical optimum alone. Full model diagnostics and coefficients are provided in the Supporting Information.
In the hemp dataset, the additional high-sonication validation conditions showed an intermediate maximum in TCI, with the selected response occurring at an intermediate cycle number rather than at either extreme of the tested cycle range.
3.1.4. FTIR and SEM Confirmation of the Selected Nanocellulose
The stacked FTIR spectra (Figure 3) show that the main cellulose-related spectral features were retained across the extraction conditions for both biomass sources, while the relative band intensities changed substantially with processing. The TCI response used in the RSM was calculated from the baseline-corrected absorbance ratio A1372/A2900. Because FTIR-derived indices are method-dependent, these values should be used for relative comparison within the present datasets and should not be interpreted as absolute crystallinity percentages or directly equated with XRD-derived crystallinity values [27]. Detailed spectra showing the baseline and the two band heights used in the TCI calculation are provided in the Supporting Information.
Comparison of untreated biomass with the selected nanocellulose samples (Figure 4) showed the broad O–H stretching band near 3330 cm⁻¹, C–H stretching around 2890 cm⁻¹, CH₂ bending near 1425 cm⁻¹, asymmetric C–O–C stretching around 1160 cm⁻¹, C–O stretching near 1030 cm⁻¹, and the band around 898 cm⁻¹ associated with β-glycosidic linkages, all characteristic of cellulose-based materials [4,17,18]. Relative to the untreated feedstocks, the optimized samples showed strong attenuation of the band near 1730 cm⁻¹, a marked decrease around 1510 cm⁻¹, and substantial reduction of the feature near 1240 cm⁻¹, which are commonly associated with hemicellulose carbonyl groups and lignin-related aromatic/C–O vibrations; their reduction is consistent with removal of non-cellulosic constituents during treatment [17,18].
Representative SEM images (Figure 5) showed extensive fibrillation in both selected samples. The 3-120H field contained fine fibrillar regions with annotated apparent widths of approximately 70–90 nm, whereas 3-75C showed a dense fibrillar network with annotated features around 90–110 nm in the presented field. The complete SEM dataset for all extraction experiments is provided in the Supporting Information.
2.2. Electrochemical Characterization of Cu-Modified Hemp-Hurd and Corn-Cob Nanocellulose
Bare nanocellulose and samples containing nominal Cu loadings of 15, 25, 50, and 75 wt% were evaluated by electrochemical impedance spectroscopy (EIS) and cyclic potential-current measurements. Three independently prepared samples were analyzed for each Cu-modified composition (n = 3). The corresponding bare nanocellulose was measured once and was therefore treated as a descriptive reference rather than included in inferential statistics.
3.2.1. Electrochemical Impedance Spectroscopy
Cu incorporation produced a pronounced decrease in low-frequency impedance for both nanocellulose sources. At 0.1 Hz, bare hemp-hurd nanocellulose exhibited |Z| = 274.15 kΩ and bare corn-cob nanocellulose exhibited |Z| = 247.67 kΩ, whereas all Cu-modified formulations had mean values below 10 kΩ. The high-frequency Z′ values of the Cu-modified groups changed comparatively little and remained approximately 175–187 Ω. The Nyquist plots are shown in Figure 6.
For hemp-hurd nanocellulose, the mean |Z| values at 0.1 Hz were 9.65 ± 0.92, 8.44 ± 1.27, 8.44 ± 0.63, and 9.45 ± 0.29 kΩ for 15, 25, 50, and 75 wt% Cu, respectively. One-way ANOVA across the four Cu-modified groups gave p = 0.245. The 25 wt% group showed the largest variability, mainly because H25-2 differed from H25-1 and H25-3; this replicate was retained because its EIS response was smooth and its potential-current response was internally stable.
For corn-cob-derived nanocellulose, mean |Z| at 0.1 Hz decreased from 9.90 ± 0.81 kΩ at 15 wt% to 9.65 ± 0.44 kΩ at 25 wt%, 9.17 ± 0.41 kΩ at 50 wt%, and 8.17 ± 0.84 kΩ at 75 wt% Cu (Table 2). The one-way ANOVA gave p = 0.051, while the linear trend calculated from the four group means gave p = 0.015. The low-frequency phase response also varied with loading (one-way ANOVA p = 0.0107).
The Bode magnitude plots (Figure 7) showed the largest separation between bare and Cu-modified samples at low frequency. For corn cob, bare NC exhibited |Z| = 29.16 kΩ at 1 Hz, whereas the Cu-modified samples were clustered around 1.20–1.27 kΩ. In the corn-cob series, the mean phase angle at 0.1 Hz decreased from 77.73 ± 3.35° at 15 wt% to 67.59 ± 4.17° at 50 wt% Cu and then increased slightly to 69.28 ± 2.31° at 75 wt% Cu (Figure 8).
Figure 9 summarizes the loading dependence of low-frequency impedance. The hemp-hurd series was non-monotonic, whereas the corn-cob series showed a progressive decrease from 15 to 75 wt% Cu. Because a sufficiently well-resolved semicircular region was not observed in the Nyquist plots, Rct was not extracted from semicircle diameters.
3.2.2. Cyclic Potential-Current Response
The cyclic potential-current measurements showed a marked increase in current and passed charge after Cu incorporation. Cycle 5 was used for composition-to-composition comparison because the responses had largely approached a repeatable regime by cycles 4–5. The mean cycle-5 curves are presented in Figure 10.
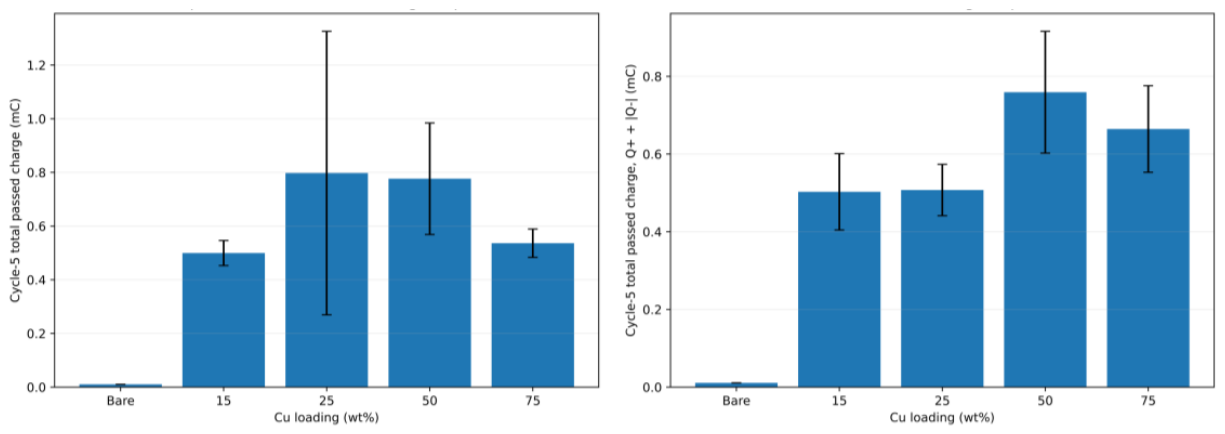
For hemp-hurd nanocellulose, bare NC exhibited a cycle-5 total passed charge of 0.0104 mC. The Cu-modified groups yielded 0.500 ± 0.047 mC at 15 wt%, 0.798 ± 0.528 mC at 25 wt%, 0.777 ± 0.208 mC at 50 wt%, and 0.536 ± 0.053 mC at 75 wt% Cu. H25-2 produced 1.399 mC compared with 0.407 and 0.588 mC for H25-1 and H25-3; it changed by only −6.3% from cycle 4 to cycle 5 and was retained as an independent replicate. The one-way ANOVA across the Cu-modified hemp groups was not significant (p = 0.484).
For corn-cob nanocellulose, mean cycle-5 total charge values were 0.503 ± 0.098, 0.507 ± 0.066, 0.759 ± 0.157, and 0.665 ± 0.111 mC for 15, 25, 50, and 75 wt% Cu, respectively, compared with 0.0109 mC for bare corn-cob NC (Table 3). The highest mean response occurred at 50 wt% Cu. The total-charge ANOVA gave p = 0.0617. For the positive charge component, Q+, exploratory ANOVA gave p = 0.031, with the 50 wt% group exceeding the 15 and 25 wt% groups in Tukey comparisons. Hysteresis between the forward and reverse potential scans was visible in the Cu-modified samples.
Figure 11.
Cycle-5 total passed charge for bare and Cu-modified nanocellulose: (a) hemp hurds and (b) corn cob. Error bars represent SD for the Cu-modified groups (n = 3); bare NC is n = 1.
Figure 11.
Cycle-5 total passed charge for bare and Cu-modified nanocellulose: (a) hemp hurds and (b) corn cob. Error bars represent SD for the Cu-modified groups (n = 3); bare NC is n = 1.
Across five consecutive cycles (Figure 12), the largest changes generally occurred during the early cycles and became smaller with further cycling. The relatively small differences between cycles 4 and 5 supported the use of cycle 5 for comparison. The 50 wt% corn-cob group showed somewhat greater residual cycle-to-cycle evolution than the other corn-cob groups.
3.2.3. Source-Dependent Electrochemical Response
At 15 wt% Cu, the low-frequency impedances of the two nanocellulose sources were nearly identical. At 25 and 50 wt%, the hemp-hurd samples exhibited lower mean |Z| at 0.1 Hz, whereas at 75 wt% the corn-cob formulation exhibited the lower mean impedance (Figure 13a). Two-way ANOVA showed no significant source main effect for |Z| at 0.1 Hz (p = 0.474) and no significant Cu-loading main effect (p = 0.135); the source × Cu interaction approached significance (p = 0.063).
For cycle-5 total passed charge (Figure 13b), two-way ANOVA showed no significant source main effect (p = 0.627), Cu-loading main effect (p = 0.237), or source × Cu interaction (p = 0.424). The Q+/|Q−| ratio showed a Cu-loading effect (p = 0.027) but no significant source effect. The two sources had similar responses at 15 and 50 wt% Cu, while larger differences were observed at 25 and 75 wt%.
3.3. Thermogravimetric Analysis of Cu-Modified Nanocellulose
The final TGA residue at 800 °C increased with nominal Cu loading for both biomass sources (Table 4). For hemp-hurd-derived nanocellulose, the residue increased from 24.7 wt% at 15 wt% nominal Cu to 35.1, 48.1, and 56.8 wt% at 25, 50, and 75 wt% Cu, respectively. The corresponding corn-cob-derived samples exhibited final residues of 51.2, 56.0, 57.8, and 61.05 wt%.
If the Cu-containing portion of the final residue is assumed to be present predominantly as CuO, the residues correspond to CuO-equivalent elemental Cu contents of approximately 19.7, 28.0, 38.4, and 45.4 wt% for H-NC-Cu 15, 25, 50, and 75%, respectively, and 40.9, 44.7, 46.2, and 48.8 wt% for the corresponding corn-cob samples. These converted values are treated as approximate CuO-equivalent estimates because TGA measures total residual mass rather than elemental Cu directly.
For the selected 50 wt% formulations, C-NC-Cu 50% showed a dominant DTG maximum at approximately 308.7–309 °C, whereas H-NC-Cu 50% showed a principal DTG maximum at approximately 337.6–338 °C (Figure 14). The final residue was 57.8 wt% for C-NC-Cu 50% and 48.1 wt% for H-NC-Cu 50%.
3.4. X-Ray Diffraction Analysis of Cu-Modified Nanocellulose
XRD analysis was focused on H-NC-Cu 50% and C-NC-Cu 50%. The bare nanocellulose diffractograms were not used for phase assignment in the main manuscript because they contained additional weak reflections that could not be assigned unambiguously.
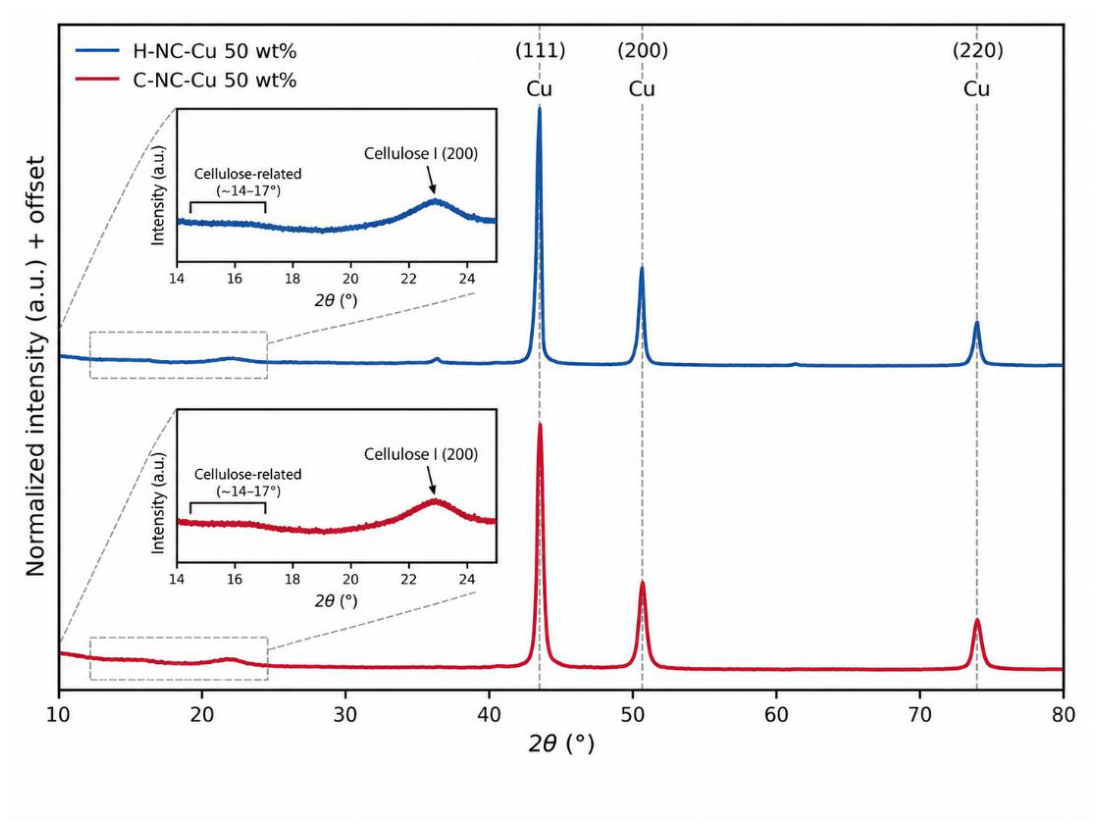
Both Cu-modified samples exhibited three dominant reflections characteristic of metallic Cu. H-NC-Cu 50% showed peaks at 2θ = 43.18°, 50.33°, and 74.04°, while C-NC-Cu 50% showed corresponding peaks at 43.37°, 50.48°, and 74.17°. These reflections were assigned to the (111), (200), and (220) planes, respectively, of face-centered cubic Cu. In both samples, the inset regions also showed weak broad cellulose-related features in the approximately 14–17° region and around 22.5–23.0°, the latter corresponding to the cellulose I (200) reflection [23,28,29]. The Cu peaks were substantially more intense than the cellulose-related features.
Figure 15.
XRD patterns of H-NC-Cu 50 wt% and C-NC-Cu 50 wt%.
4. Discussion
4.1. Source-Dependent Optimization of Nanocellulose Extraction
The RSM results show that extraction cycle number and sonication time cannot be treated as interchangeable measures of processing severity. In hemp hurds, increasing the number of cycles initially increased TCI and reduced fibril size, but the fourth cycle at 120 min produced a sharp reduction in TCI despite the smaller apparent size. This non-monotonic behavior is consistent with literature showing that repeated mechanical fibrillation can change both fibrillation efficiency and cellulose structural characteristics rather than producing a simple linear improvement with additional passes [3,8]. The result therefore supports the use of cycle number as an explicit process variable in nanocellulose optimization.
Corn cob showed a different processing window. The 3-cycle/75-min condition provided a reproducible compromise between TCI and fibril size, whereas more severe treatment did not improve both responses simultaneously. Previous chemical-mechanical production of corn-cob nanocellulose has likewise emphasized the need to balance chemical purification with mechanical disintegration [4]. More broadly, the present source dependence agrees with the established observation that feedstock composition and native fiber architecture influence nanocellulose dimensions, structural organization, and fibrillation behavior [1,2,3].
The use of RSM was valuable for identifying these source-specific operating regions, but the model diagnostics also define an important limitation. The significant lack of fit and negative predicted R² values in the hemp models indicate that the fitted high-order surfaces should be used as empirical response maps within the measured design space rather than as robust extrapolative models. The corn-cob TCI model was statistically stronger, while the size model remained weak. This justifies the combined use of numerical desirability, experimental confirmation, and practical processing criteria rather than relying on the mathematical optimum alone. The same general role of RSM as a process-selection tool has been reported in nanocellulose extraction from other biomass sources [16,18,19].
4.2. FTIR and SEM Evidence of Cellulose Enrichment and Fibrillation
The persistence of the principal cellulose bands after treatment, together with the strong reduction of the features near 1730, 1510, and 1240 cm⁻¹, supports substantial removal of hemicellulose- and lignin-associated components while preserving the cellulose-rich framework [4,17]. The FTIR comparison therefore complements the RSM response by showing that the selected 3-120H and 3-75C materials are chemically enriched in cellulose relative to the untreated feedstocks. Because FTIR-derived TCI is a band-intensity ratio, its absolute magnitude should be interpreted as a relative structural-order index within the present datasets rather than as a direct crystallinity percentage [27].
SEM provided independent morphological confirmation of nanoscale fibrillation. At the same time, the spread of apparent feature sizes and the field-dependent morphology caution against interpreting any individual micrograph as a single uniform fibril diameter. The source-specific optimization therefore rests on the combined response of FTIR-derived structural order and SEM-derived size rather than on either technique alone.
4.3. Effect of Cu Incorporation on Electrochemical Response
The clearest functional effect of Cu modification was the large reduction in low-frequency impedance and the tens-of-fold increase in cycle-5 passed charge relative to bare nanocellulose. Conductive nanocellulose systems generally require incorporation of an electrically active phase because the cellulose framework itself is poorly conducting [21,22]. Cu-containing cellulose and nanocellulose systems have also been reported as functional hybrid materials [23,24], and impregnation of cellulose fibers with Cu colloids has been shown to produce electrically conductive cellulose-based materials [30]. In the present samples, the strongest separation between bare and Cu-modified materials occurred at low frequency, whereas the high-frequency Z′ values of the Cu-containing groups remained comparatively close. This pattern indicates that Cu incorporation altered the slower network/interfacial response much more strongly than the high-frequency resistance proxy. The overall behavior is also consistent with the broader use of nanoparticle-decorated nanocellulose as a platform for conductive and electrochemically active hybrid materials [31].
The loading dependence differed between the two biomass sources. Corn-cob-derived nanocellulose showed a progressive decrease in |Z| from 15 to 75 wt% nominal Cu, whereas the hemp-hurd series reached its lowest mean impedance in the 25–50 wt% range and increased again at 75 wt%. The passed-charge response was also non-monotonic: the largest mean response occurred in the 25–50 wt% region for hemp and at 50 wt% for corn cob. Thus, increasing nominal Cu loading beyond 50 wt% did not yield a universal improvement in the combined electrochemical metrics.
The 50 wt% formulation provided the most consistent compromise across the two sources, combining relatively low impedance with high passed charge. However, this should be treated as a comparative trend within the present dataset rather than as a statistically established global optimum. Several loading comparisons did not reach conventional statistical significance, and the Cu-modified groups were based on n = 3 independent preparations. The bare controls were measured once and should therefore remain descriptive references rather than the basis of inferential comparisons.
The hysteresis observed between forward and reverse potential sweeps further indicates that the response is not purely ohmic and likely includes interfacial, redox, adsorption/desorption, mass-transport, and capacitive contributions, which are common considerations in the interpretation of cyclic voltammetric and potential-sweep data [32,33]. Because the Nyquist plots did not contain a sufficiently resolved single semicircle, extracting Rct directly from a semicircle diameter would not be justified without identification of the relevant electrochemical processes and validation of a physically meaningful equivalent-circuit model [34]. The present EIS data are therefore most defensibly interpreted through the directly measured impedance magnitude, phase response, and their loading-dependent trends.
4.4. Biomass Matrix Effects and the Relationship Between Cu Retention and Performance
The cross-source comparison indicates that biomass origin modulates the effect of Cu loading rather than producing a simple overall ranking of the two feedstocks. The two sources were nearly identical at 15 wt% Cu and similar again at 50 wt%, while larger differences appeared at 25 and 75 wt%. This behavior is consistent with the broader understanding that nanocellulose source and processing history affect morphology, surface chemistry, and network organization, all of which can influence the connectivity and electroanalytical response of an incorporated conductive phase [1,3,22,35].
TGA reinforces this matrix-dependent interpretation. The final nonvolatile residue increased with nominal Cu loading in both series, but the corn-cob samples retained substantially larger absolute residues, particularly at the lower nominal loadings. Because TGA measures total residual mass, these residues cannot be equated directly with elemental Cu. The CuO-equivalent conversions are therefore useful only as approximate indicators. The fact that the corn-cob 50 wt% sample retained more residue than the hemp-hurd 50 wt% sample while the two exhibited broadly comparable electrochemical responses shows that total retained inorganic fraction alone does not determine functional performance. Distribution, connectivity, and interfacial organization of the Cu-containing domains within the nanocellulose network are also likely to be important.
The different DTG maxima of the two 50 wt% samples provide additional evidence that the biomass-derived matrix affects thermal decomposition after Cu modification. The thermal behavior of cellulose nanomaterials is known to depend on source, surface chemistry, processing history, and degradation mechanism [36,37], while Cu incorporation has also been reported to modify the degradation behavior of cellulose-based Cu nanocomposites [28]. These differences are reported descriptively here because the main purpose of TGA was to evaluate retained nonvolatile residue rather than to establish a complete thermal-degradation mechanism.
4.5. Structural Confirmation by XRD and Integrated Interpretation
The XRD patterns of the selected 50 wt% samples confirm that crystalline metallic Cu is present in both nanocellulose matrices. The reflections near 43.2–43.4°, 50.3–50.5°, and 74.0–74.2° are consistent with the (111), (200), and (220) planes of face-centered cubic Cu. Comparable fcc-Cu reflections have been reported for Cu nanoparticles supported on nanocrystalline cellulose, cotton-derived cellulose, and wood-derived cellulose matrices [23,28,29], and the same Cu-rich crystalline phase assignment was reported in our previous Cu-modified nanocellulose study [38]. The much stronger Cu reflections relative to the weak broad cellulose features indicate that Cu-rich crystalline domains dominate the diffraction response, while the residual features near 14–17° and 22.5–23.0° show that the cellulose phase remains detectable [28,29].
Taken together, the RSM, FTIR/SEM, electrochemical, TGA, and XRD results support a source-dependent structure–processing–property relationship. The extraction history determines the nanocellulose substrate produced from each agricultural residue; that substrate in turn affects how increasing Cu loading is translated into impedance, charge response, retained residue, and thermal behavior. The data do not support a simple “more Cu gives better performance” relationship. Instead, the combined results point to an intermediate loading region—most consistently represented by 50 wt% under the present conditions, where Cu incorporation and nanocellulose network characteristics provide a favorable balance of electrochemical response.
5. Conclusions
Nanocellulose was successfully produced from hemp hurds and corn cob through a citric-acid-assisted chemical–mechanical route, and the combined effects of extraction cycle number and sonication time were evaluated using RSM. Treating the number of extraction cycles as an independent process variable revealed a strongly non-linear processing response, particularly for hemp hurds, demonstrating that repeated treatment cannot be replaced simply by increasing sonication severity. The selected conditions were 3 cycles/120 min for hemp hurds and 3 cycles/75 min for corn cob, confirming that different lignocellulosic feedstocks require source-specific processing windows to obtain a favorable balance between FTIR-derived structural order and nanoscale fibrillation.
Modification of the optimized nanocelluloses with 15–75 wt% nominal Cu markedly altered their electrochemical behavior. All Cu-modified samples exhibited substantially lower low-frequency impedance and much larger passed charge than the corresponding bare nanocellulose. However, the loading dependence differed between the two biomass sources. Hemp-hurd-derived samples showed their most favorable impedance and charge responses in the 25–50 wt% range, whereas corn-cob-derived samples exhibited a progressive decrease in low-frequency impedance with increasing Cu loading and a maximum mean charge response at 50 wt% Cu. Across both sources, the 50 wt% formulations provided the most consistent combination of relatively low impedance and high cycle-5 passed charge, although this trend should not be interpreted as a statistically established universal optimum.
TGA further demonstrated that retained nonvolatile residue increased with nominal Cu loading for both nanocellulose sources, while the different residue levels and DTG maxima of the 50 wt% samples highlighted the influence of the biomass-derived matrix on thermal behavior. XRD confirmed face-centered cubic metallic Cu through the characteristic (111), (200), and (220) reflections, while weaker cellulose-related features remained detectable. Importantly, the electrochemical response did not scale directly with the retained residue fraction, indicating that Cu content alone does not determine performance and that the structure and interfacial characteristics of the nanocellulose network also contribute. Overall, the study demonstrates a source-dependent route for converting agricultural residues into Cu-modified nanocellulose with strongly enhanced electrochemical response and highlights extraction cycle number as an important but underexplored parameter in nanocellulose process optimization.
Supplementary Materials
The following supporting information can be downloaded at the website of this paper posted on Preprints.org, Table S1: RSM experimental design and responses for hemp-hurd-derived nanocellulose; Table S2: RSM experimental design and responses for corn-cob-derived nanocellulose; Table S3: Model diagnostic statistics recalculated from the response values and polynomial terms stored in the Stat-Ease project files; Table S4. Numerical optimization settings and selected solutions from the supplied Stat-Ease outputs; Figure S1: Supporting SEM analysis of hemp-hurd and corn-cob-derived nanocellulose; Figure S2: Baseline and band-height visualization used for FTIR-TCI determination;.
Author Contributions
The author was solely responsible for the conceptualization, methodology, investigation, data analysis, visualization, writing, project administration, and funding acquisition of this study. The author has read and agreed to the published version of the manuscript.
Funding
This research received no external funding” or “This research was funded by Funding is provided by the Scientific and Research Council of Türkiye (TUBITAK), project number 224M392.
Institutional Review Board Statement
Not applicable. This study did not involve humans or animals.
Data Availability Statement
The data presented in this study are available within the article and its Supplementary Materials. Additional data are available from the author upon reasonable request.
Acknowledgments
The author acknowledges Yeditepe University for providing the research facilities and technical infrastructure used in this study.
Conflicts of Interest
The author declares no conflicts of interest.
References
- Jonoobi, M. Different preparation methods and properties of nanostructured cellulose from various natural resources and residues: a review Cellulose 2015, 22(2), 935–969. [CrossRef]
- García, A.; et al. Industrial and crop wastes: A new source for nanocellulose biorefinery Industrial Crops and Products 2016, 93, 26–38. [CrossRef]
- Nechyporchuk, O.; Belgacem, M.N.; Bras, J. Production of cellulose nanofibrils: A review of recent advances Industrial Crops and Products 2016, 93, 2–25. [CrossRef]
- Sartika, D. High yield production of nanocrystalline cellulose from corn cob through a chemical-mechanical treatment under mild conditions International Journal of Biological Macromolecules 2023, 240, 124327. [CrossRef]
- Agate, S.; et al. Innovating generation of nanocellulose from industrial hemp by dual asymmetric centrifugation ACS Sustainable Chemistry & Engineering 2020, 8(4), 1850–1858. [CrossRef]
- Beluns, S.; et al. From wood and hemp biomass wastes to sustainable nanocellulose foams Industrial Crops and Products 2021, 170, 113780. [CrossRef]
- Thakur, V.; et al. Recent advances in nanocellulose processing, functionalization and applications: A review Materials Advances 2021, 2(6), 1872–1895. [CrossRef]
- Sonyeam, J. Process design for acidic and alcohol based deep eutectic solvent pretreatment and high pressure homogenization of palm bunches for nanocellulose production Scientific Reports 2024, 14(1), 7550. [CrossRef]
- Samsalee, N.; Meerasri, J.; Sothornvit, R. Rice husk nanocellulose: Extraction by high-pressure homogenization, chemical treatments and characterization Carbohydrate Polymer Technologies and Applications 2023, 100353. [CrossRef]
- Alvarado, M.C. Review on nanocellulose production from agricultural residue through response surface methodology and its applications Nano Trends 2024. 8, 100054. [CrossRef]
- Zhang, L. Cleaner production of cellulose nanocrystals and calcium sulfate whiskers: Process design and life cycle assessment AIChE Journal 2023, 69(11), e18186. [CrossRef]
- Hu, M.; et al. Guidel. Extr. Nanocellulose From Lignocellul. Feed. Food Biomacromolecules 2024, 1(1), 9–17. [CrossRef]
- Bondancia, T.J. Production of nanocellulose using citric acid in a biorefinery concept: effect of the hydrolysis reaction time and techno-economic analysis Industrial & Engineering Chemistry Research 2020, 59(25), 11505–11516. [CrossRef]
- Yu, H. Simple process to produce high-yield cellulose nanocrystals using recyclable citric/hydrochloric acids ACS Sustainable Chemistry & Engineering 2019, 7(5), 4912–4923. [CrossRef]
- Ruiz-Caldas, M.-X. Citrated cellulose nanocrystals from post-consumer cotton textiles Journal of Materials Chemistry A 2023, 11(13), 6854–6868. [CrossRef]
- Bacha Ebise, G. Response Surface Methodology Modeling, Experimental Validation, and Optimization of Acid Hydrolysis Process Parameters for Nanocellulose Extraction . South Afr. J. Chem. Eng. 2022, 40(1), 176–185. [Google Scholar] [CrossRef]
- Guo, Y. Isolation and characterization of nanocellulose crystals via acid hydrolysis from agricultural waste-tea stalk International Journal of Biological Macromolecules 2020, 163, 927–933. [CrossRef]
- Görgüç, A. Process optimization and characterization of nanocellulose from chestnut shell Materials Chemistry and Physics 2023, 310, 128482. [CrossRef]
- Yahya, M.; et al. A New Protocol for Efficient and High Yield Preparation of Nanocellulose from Elaeis guineensis Biomass: A Response Surface Methodology (RSM) Study J. Polym. Environ. 2019, 27(4), 678–702. [CrossRef]
- Habibi, Y. Key Adv. Chem. Modif. Nanocelluloses Chem. Soc. Rev. 2014, 43(5), 1519–1542. [CrossRef]
- Du, X. Nanocellulose-based conductive materials and their emerging applications in energy devices-A review Nano Energy 2017, 35, 299–320. [CrossRef]
- Chen, L. Nanocellulose-Based Funct. Mater. Adv. Energy Sens. Appl. Nano Res. 2022, 15(8), 7432–7452. [CrossRef]
- Musa, A.; et al. Synth. Nanocrystalline Cellul. Stab. Copp. Nanoparticles J. Nanomater. 2016, 2016, 1–7. [CrossRef]
- Bahsis, L. Copper phosphorylated cellulose nanofibers mediated azide-alkyne cycloaddition click reaction in water Carbohydrate Polymers 2024, 324, 121501. [CrossRef]
- Pinto, R.J. Antibact. Act. Nanocomposites Copp. Cellul. BioMed Res. Int. 2013, 2013(1), 280512. [CrossRef]
- Nelson, M.L.; O'Connor, R.T. Relation of certain infrared bands to cellulose crystallinity and crystal lattice type. Part II. A new infrared ratio for estimation of crystallinity in celluloses I and II Journal of Applied Polymer Science 1964, 8(3), 1325–1341. [CrossRef]
- Salem, K.S. Comparison and assessment of methods for cellulose crystallinity determination Chemical Society Reviews 2023, 52(18), 6417–6446. [CrossRef]
- Pérez-Alvarez, M.; et al. Green Synth. Copp. Nanoparticles Using Cotton Polym. 2021, 13(12), 1906. [CrossRef]
- Dong, Y. Synthesis and characterization of pure copper nanostructures using wood inherent architecture as a natural template Nanoscale research letters 2018, 13(1), 119. [CrossRef]
- Schreck, M.; et al. Impregnation of cellulose fibers with copper colloids and their processing into electrically conductive paper Chemistry of Materials 2022, 34(1), 43–52. [CrossRef]
- Raghuwanshi, V.S.; Garnier, G. Nanoparticle Decor. Cellul. Nanocrystals (CNC) Compos. Energy Catal. Biomed. Appl. Adv. Funct. Mater. 2025, 35(2), 2412869. [CrossRef]
- Elgrishi, N.; et al. A Pract. Beginner’s Guide To Cycl. Voltammetry J. Chem. Educ. 2018, 95(2), 197–206. [CrossRef]
- Zhang, L.; Xu, Z.J. Cyclic Voltammetry versus Linear-Sweep Voltammetry: Rethinking Practices in Electrocatalyst Evaluation ACS Electrochemistry 2026. [CrossRef]
- Huang, J. Graphical analysis of electrochemical impedance spectroscopy data in Bode and Nyquist representations Journal of Power Sources 2016, 309, 82–98. [CrossRef]
- Durairaj, V.; et al. Role of nanocellulose in tailoring electroanalytical performance of hybrid nanocellulose/multiwalled carbon nanotube electrodes Cellulose 2022, 29(17), 9217–9233. [CrossRef]
- D’Acierno, F.; Michal, C.A.; MacLachlan, M.J. Therm. Stab. Cellul. Nanomater. Chem. Rev. 2023, 123(11), 7295–7325. [CrossRef]
- Ranucci, E.; Alongi, J. Thermal decomposition of cellulosic materials: Insights into mechanisms and product evolution Polymer Degradation and Stability 2025, 111629. [CrossRef]
- Ranjbar-Navazi, Z. Copper modified nanocellulose: atomistic and experimental elucidation; Cellulose, 2026. [Google Scholar] [CrossRef]
Figure 1.
Model-predicted response surfaces for FTIR-derived TCI and apparent fibril size as a function of extraction cycle number and sonication time. White circles indicate experimental points within the plotted factor domain; stars indicate the practical conditions selected for subsequent Cu modification (3-120H and 3-75C).
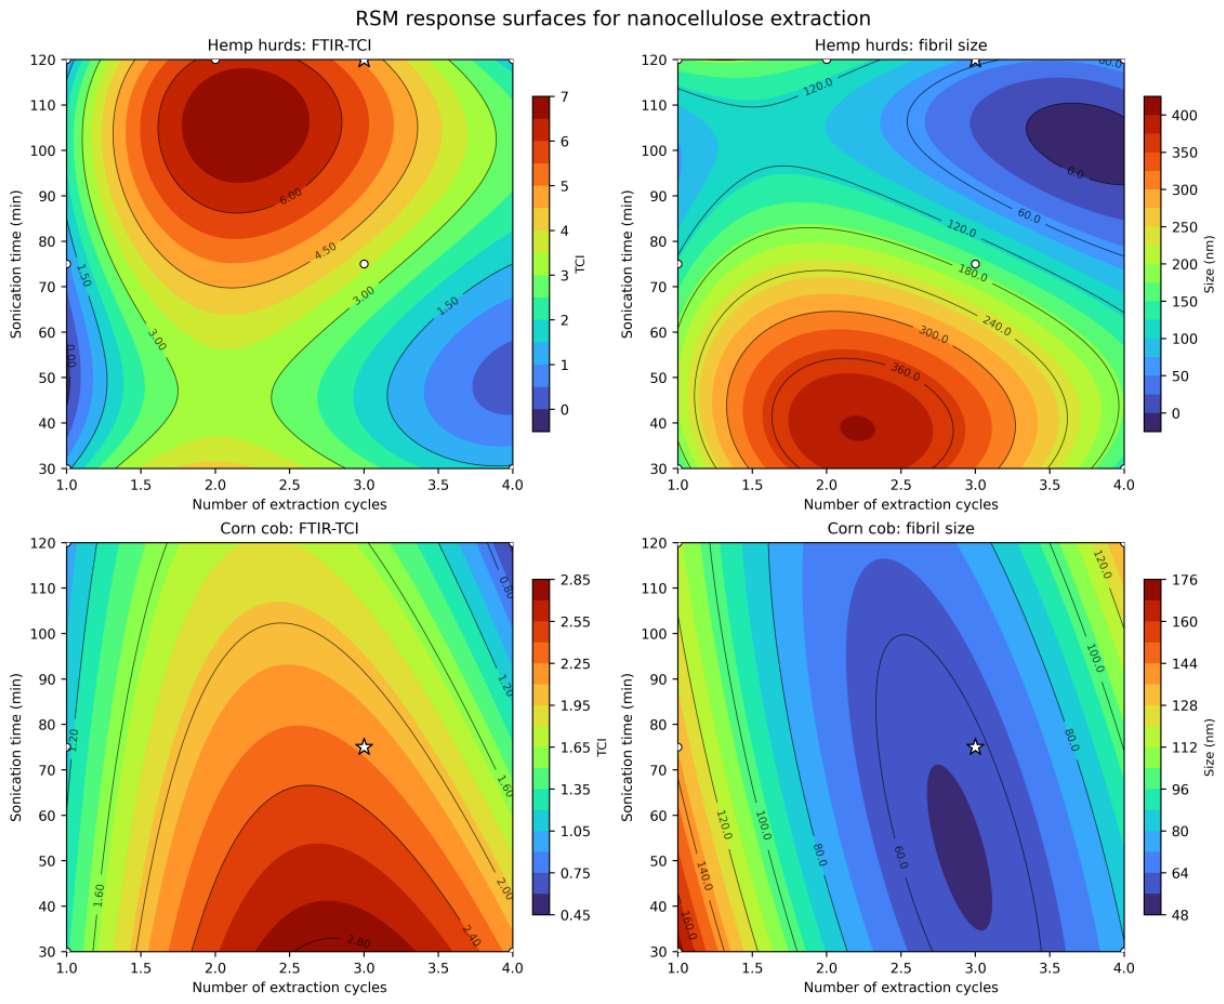
Figure 2.
Three-dimensional desirability response surfaces for nanocellulose extraction optimization: (a) hemp hurds and (b) corn cob. The optimization criteria were defined as maximizing FTIR-derived TCI and minimizing fibril size and extraction cycle number. The optimum regions correspond to 3-120H for hemp hurds and 3-75C for corn cob.
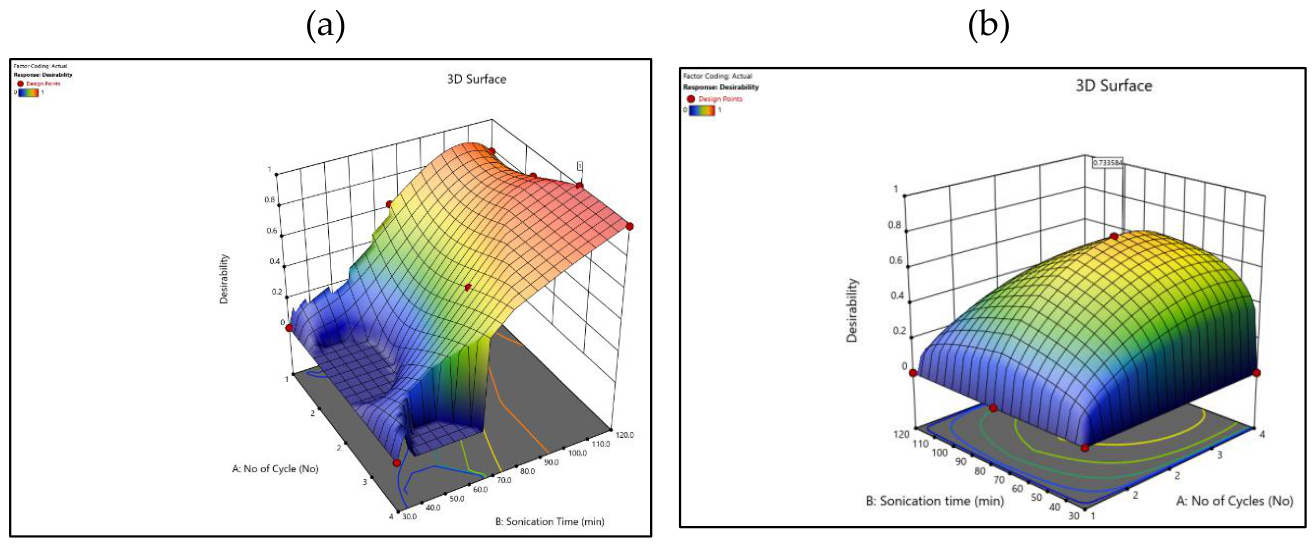
Figure 3.
Stacked, baseline-corrected FTIR spectra of (a) hemp-hurd- and (b) corn-cob-derived nanocellulose prepared under the investigated extraction conditions. Spectra were individually normalized and vertically offset for visualization.
Figure 3.
Stacked, baseline-corrected FTIR spectra of (a) hemp-hurd- and (b) corn-cob-derived nanocellulose prepared under the investigated extraction conditions. Spectra were individually normalized and vertically offset for visualization.
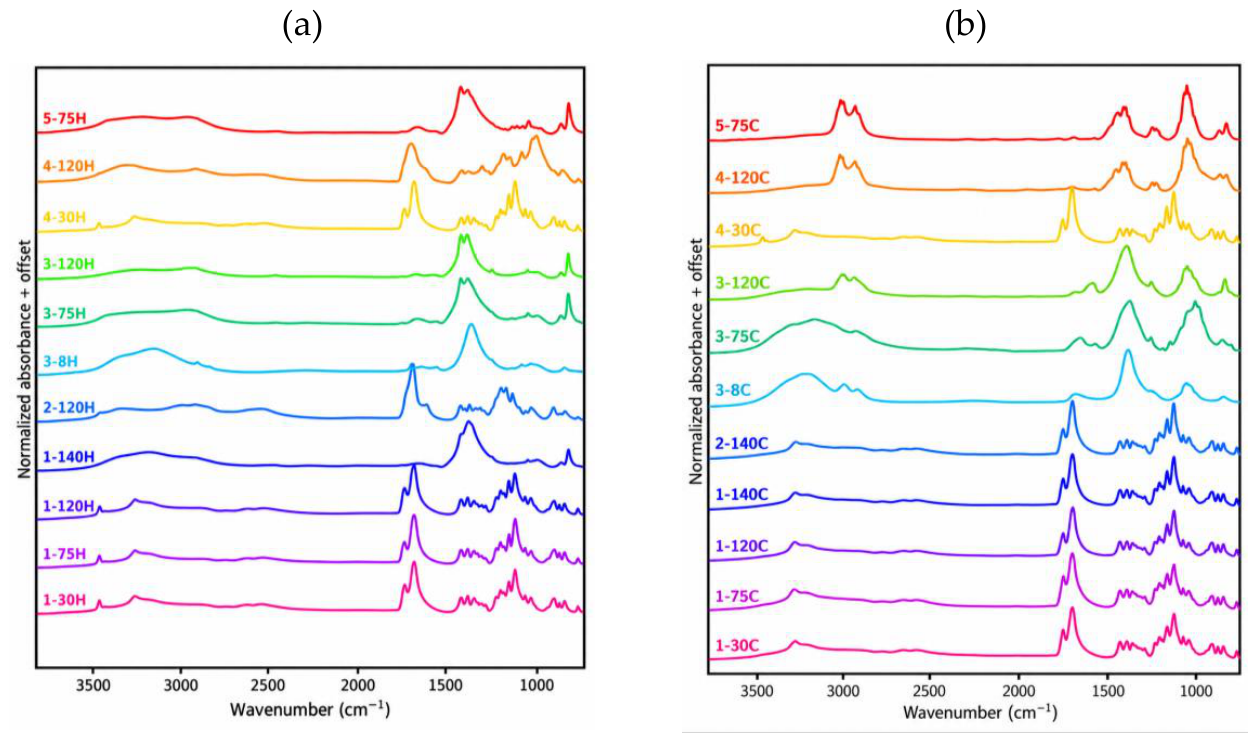
Figure 4.
FTIR transmittance spectra of the untreated lignocellulosic feedstocks and the corresponding optimized nanocellulose samples: (a) hemp hurds, comparing untreated hemp hurds with the optimized 3-120H sample, and (b) corn cob, comparing untreated corn cob with the optimized 3-75C sample.
Figure 4.
FTIR transmittance spectra of the untreated lignocellulosic feedstocks and the corresponding optimized nanocellulose samples: (a) hemp hurds, comparing untreated hemp hurds with the optimized 3-120H sample, and (b) corn cob, comparing untreated corn cob with the optimized 3-75C sample.
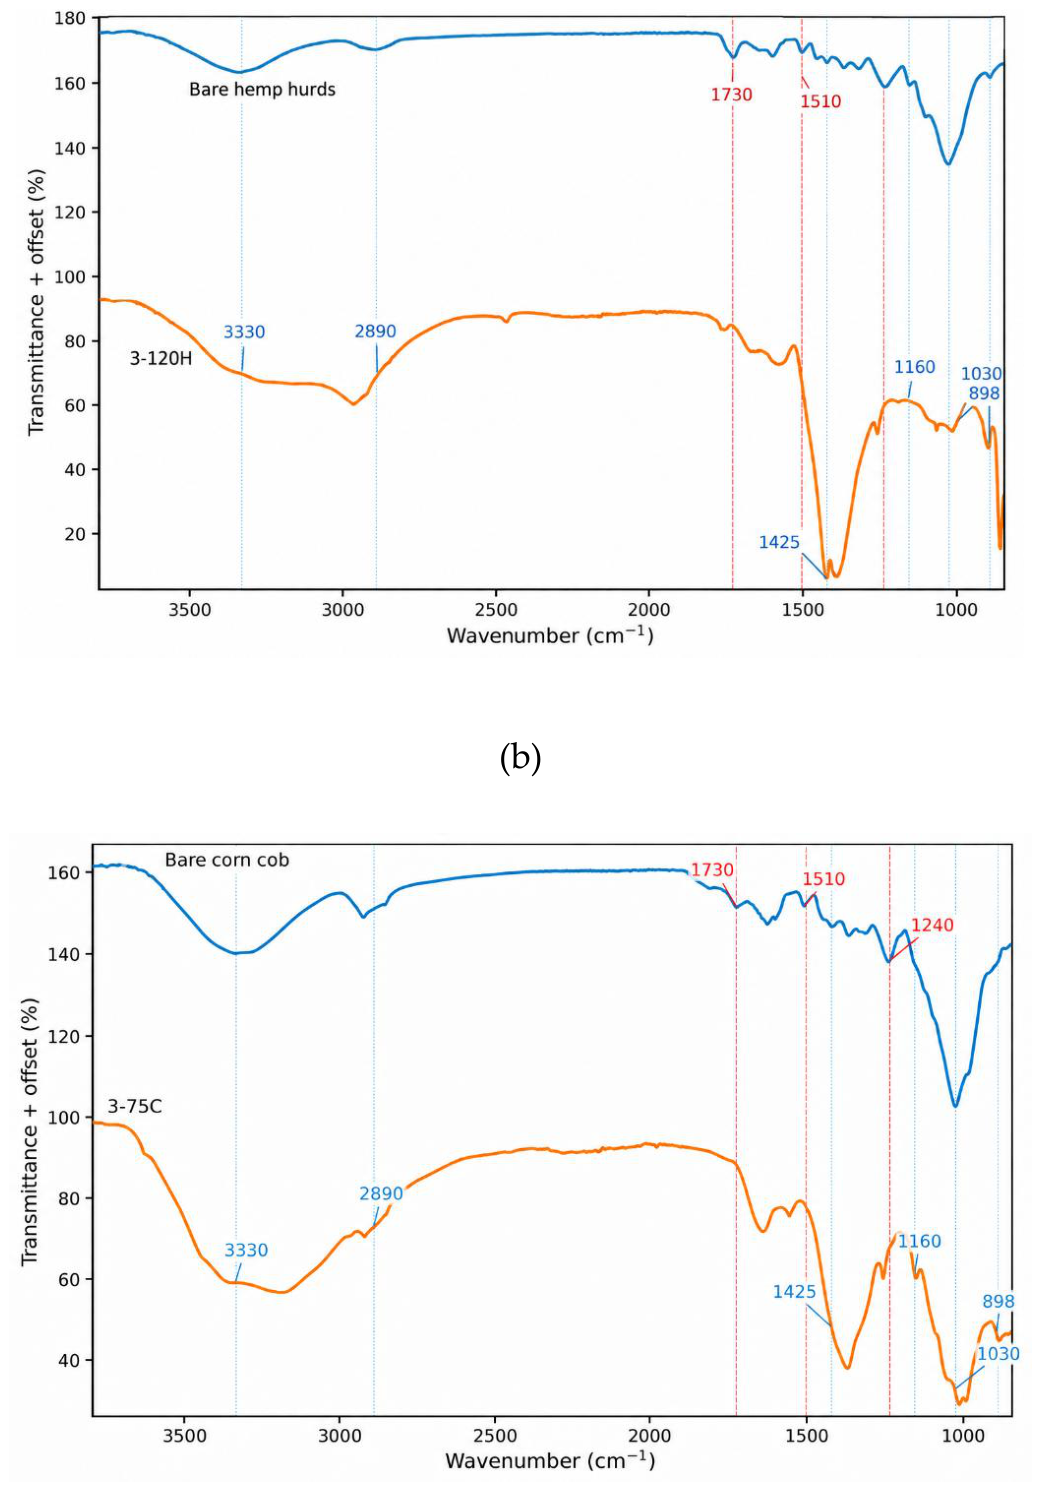
Figure 5.
Representative SEM images of the nanocellulose samples selected for subsequent Cu modification: (a) hemp-hurd sample 3-120H and (b) corn-cob sample 3-75C. Scale bars and measurement annotations are retained from the supplied micrographs.
Figure 5.
Representative SEM images of the nanocellulose samples selected for subsequent Cu modification: (a) hemp-hurd sample 3-120H and (b) corn-cob sample 3-75C. Scale bars and measurement annotations are retained from the supplied micrographs.
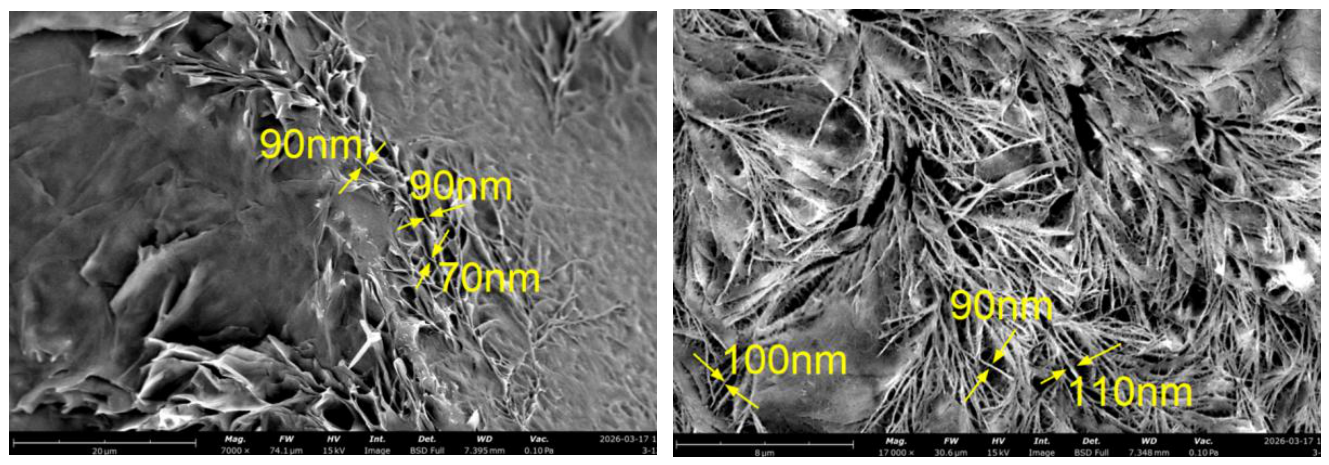
Figure 6.
Nyquist plots of Cu-modified nanocellulose: (a) hemp-hurd-derived NC and (b) corn-cob-derived NC. The plotted ranges are restricted to preserve visibility of the Cu-modified responses; the bare controls exhibit substantially larger low-frequency impedance. No Rct value was extracted because a sufficiently well-resolved single semicircle was not observed.
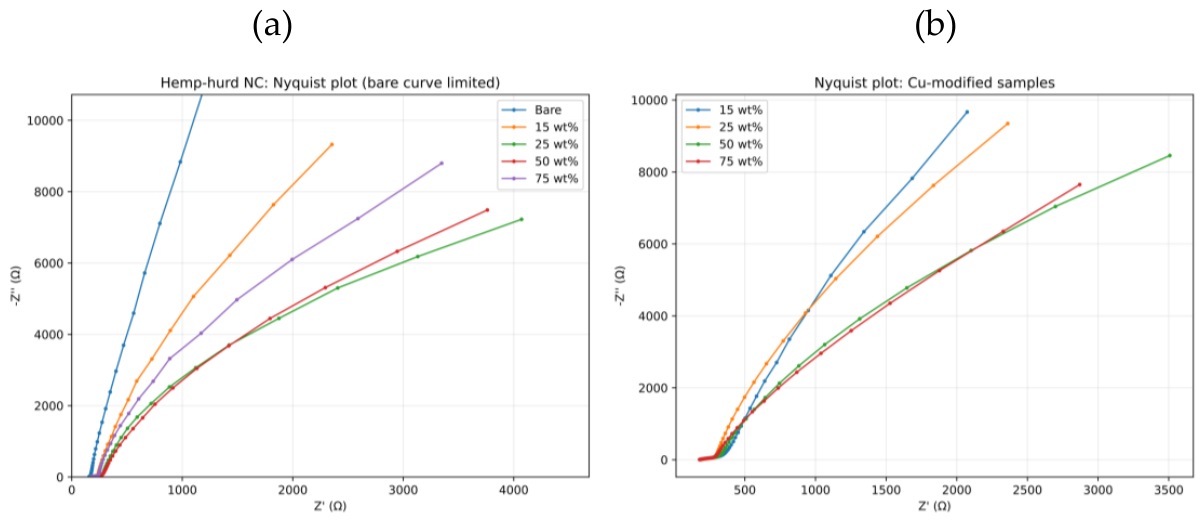
Figure 7.
Bode magnitude plots for bare and Cu-modified nanocellulose: (a) hemp hurds and (b) corn cob.
Figure 7.
Bode magnitude plots for bare and Cu-modified nanocellulose: (a) hemp hurds and (b) corn cob.
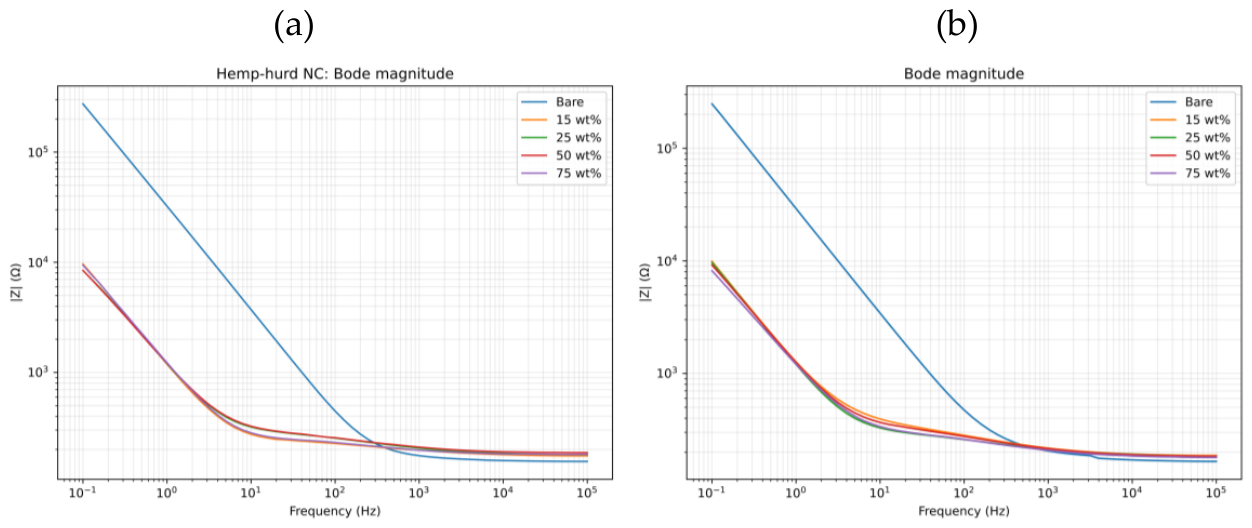
Figure 8.
Bode phase plots for bare and Cu-modified nanocellulose: (a) hemp hurds and (b) corn cob.
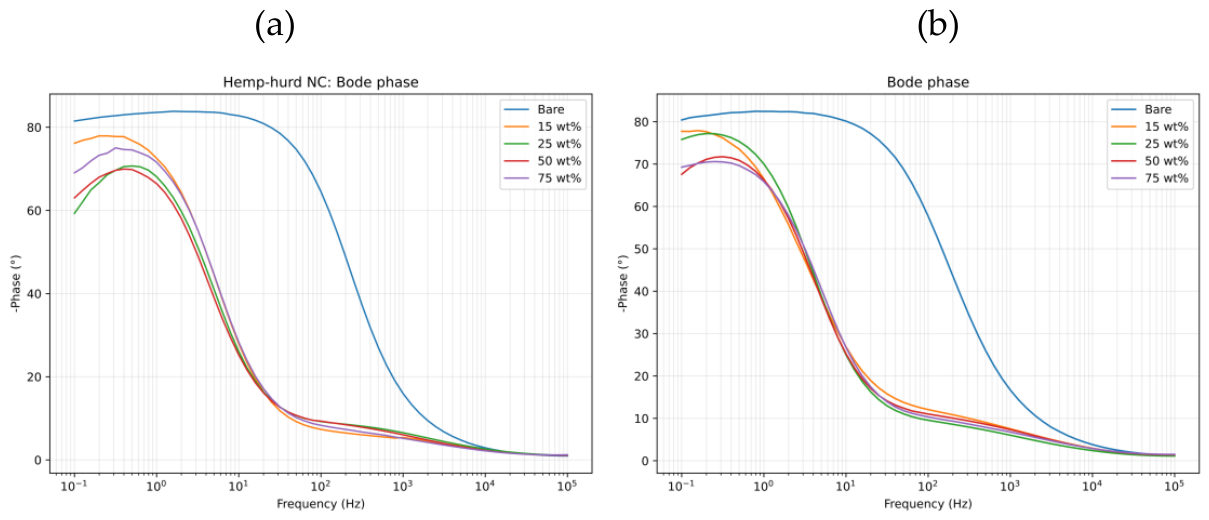
Figure 9.
Low-frequency impedance as a function of nominal Cu loading for (a) hemp-hurd-derived and (b) corn-cob-derived nanocellulose. Error bars represent SD for the Cu-modified groups (n = 3); bare NC is n = 1.
Figure 9.
Low-frequency impedance as a function of nominal Cu loading for (a) hemp-hurd-derived and (b) corn-cob-derived nanocellulose. Error bars represent SD for the Cu-modified groups (n = 3); bare NC is n = 1.
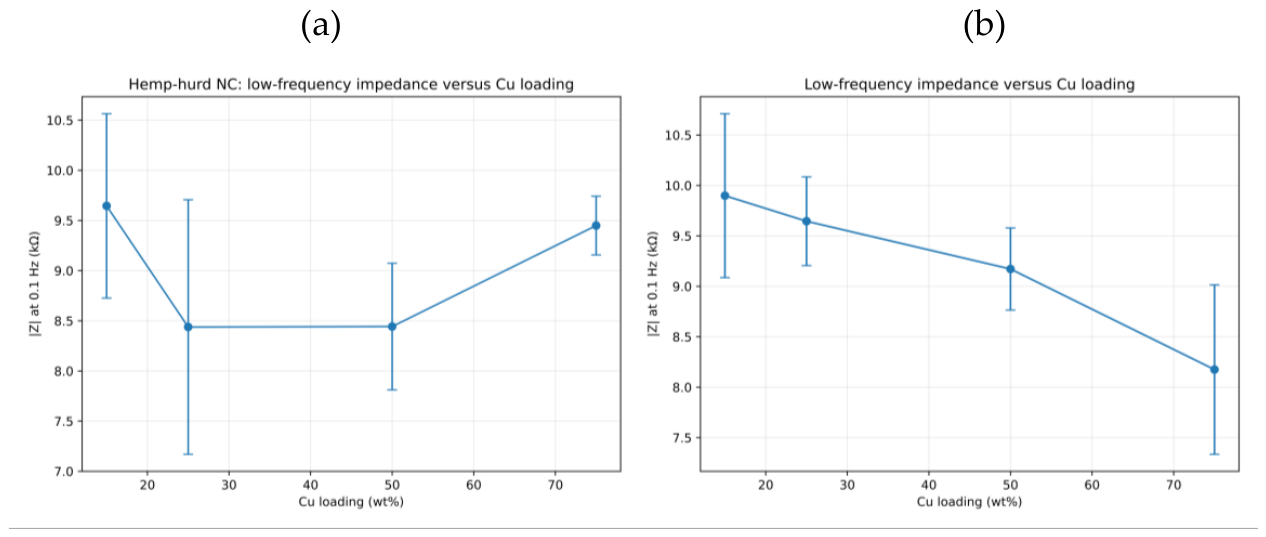
Figure 10.
Mean cycle-5 potential-current curves of bare and Cu-modified nanocellulose: (a) hemp hurds and (b) corn cob. Cu-modified curves represent means of three independently prepared samples.
Figure 10.
Mean cycle-5 potential-current curves of bare and Cu-modified nanocellulose: (a) hemp hurds and (b) corn cob. Cu-modified curves represent means of three independently prepared samples.
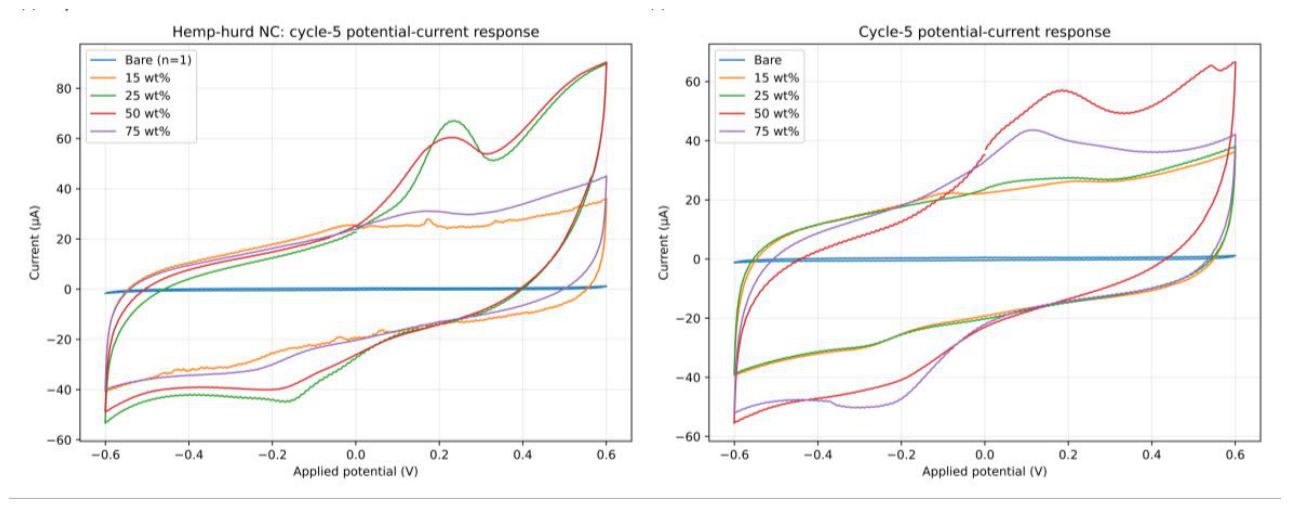
Figure 12.
Evolution of total passed charge over five consecutive potential cycles for (a) hemp-hurd-derived and (b) corn-cob-derived nanocellulose.
Figure 12.
Evolution of total passed charge over five consecutive potential cycles for (a) hemp-hurd-derived and (b) corn-cob-derived nanocellulose.
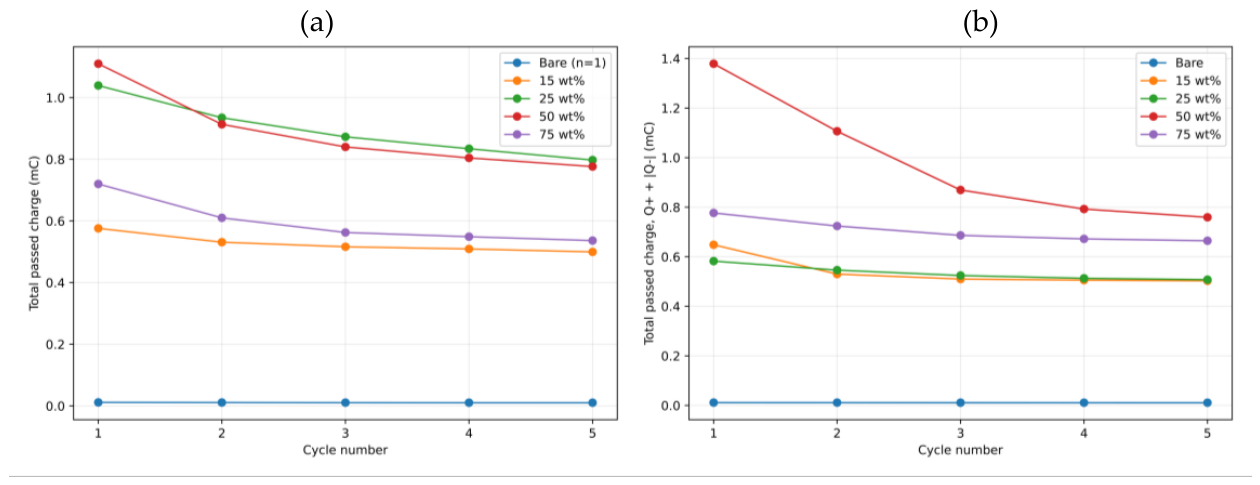
Figure 13.
Direct comparison of the two nanocellulose sources as a function of nominal Cu loading: (a) |Z| at 0.1 Hz and (b) cycle-5 total passed charge. Values are mean ± SD for three independently prepared Cu-modified samples.
Figure 13.
Direct comparison of the two nanocellulose sources as a function of nominal Cu loading: (a) |Z| at 0.1 Hz and (b) cycle-5 total passed charge. Values are mean ± SD for three independently prepared Cu-modified samples.
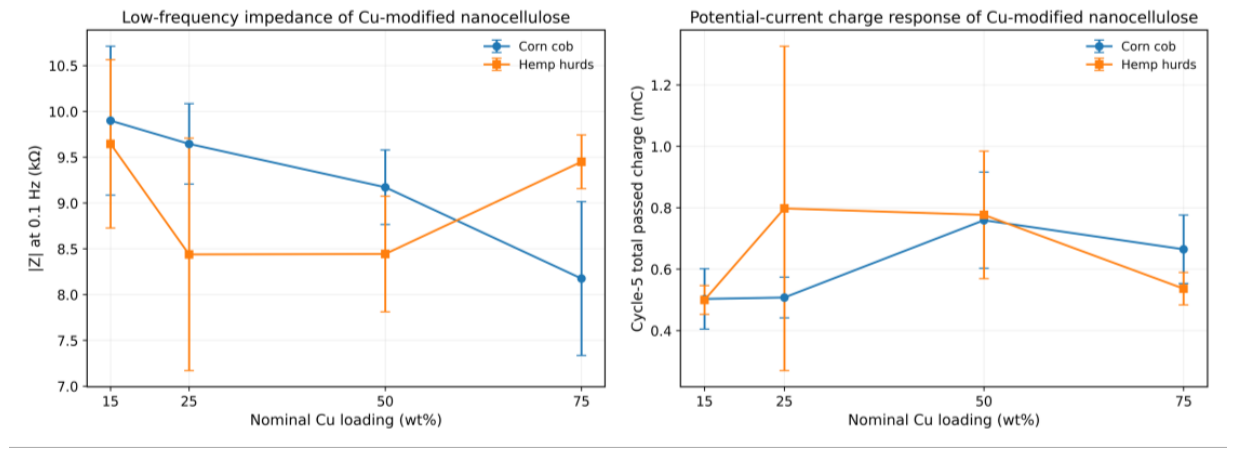
Figure 14.
TGA/DTG profiles of the selected 50 wt% Cu-modified nanocellulose formulations: (a) H-NC-Cu 50% and (b) C-NC-Cu 50%. The main DTG maxima occurred at approximately 337.6 and 308.7 °C, respectively. The N₂ flow indicated in the instrument output corresponds to protective-gas flow and was not used as the sample purge atmosphere.
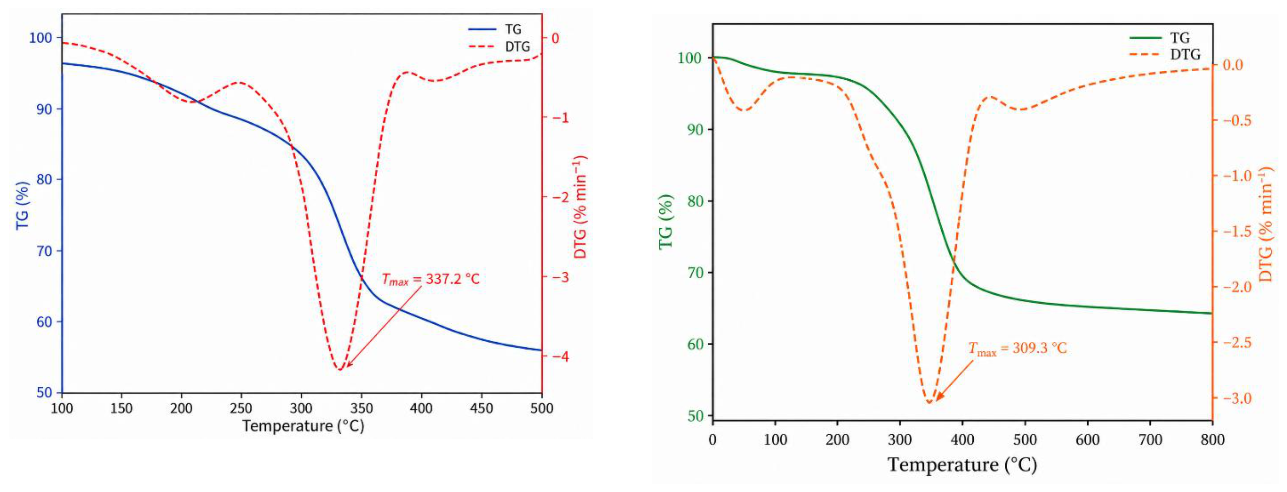

Table 1.
Selected RSM conditions and experimental confirmation.
| Source | Selected sample | Cycles | Sonication (min) | Predicted TCI | Predicted size (nm) | Desirability | Observed response |
|---|---|---|---|---|---|---|---|
| Hemp hurds | 3-120H | 3 | 120 | 4.791 | 67.2 | 1.000 | TCI 5.735; size 80 nm |
| Corn cob | 3-75C | 3 | 75 | 2.154 | 61.3 | 0.734 | TCI 2.242 ± 0.002; size 56.6 ± 8.8 nm (n = 5) |
Table 2.
Low-frequency EIS response of bare and Cu-modified nanocellulose.
| Source | Cu loading | N | |Z| at 0.1 Hz (kΩ) | Phase at 0.1 Hz (°) |
|---|---|---|---|---|
| Hemp hurds | Bare | 1 | 274.15 | 81.5 |
| Hemp hurds | 15 wt% | 3 | 9.65 ± 0.92 | 76.2 ± 5.4 |
| Hemp hurds | 25 wt% | 3 | 8.44 ± 1.27 | 59.3 ± 13.7 |
| Hemp hurds | 50 wt% | 3 | 8.44 ± 0.63 | 63.0 ± 8.8 |
| Hemp hurds | 75 wt% | 3 | 9.45 ± 0.29 | 69.0 ± 6.2 |
| Corn cob | Bare | 1 | 247.67 | 80.4 |
| Corn cob | 15 wt% | 3 | 9.90 ± 0.81 | 77.7 ± 3.4 |
| Corn cob | 25 wt% | 3 | 9.65 ± 0.44 | 75.8 ± 2.3 |
| Corn cob | 50 wt% | 3 | 9.17 ± 0.41 | 67.6 ± 4.2 |
| Corn cob | 75 wt% | 3 | 8.17 ± 0.84 | 69.3 ± 2.3 |
Table 3.
Cycle-5 passed charge of bare and Cu-modified nanocellulose.
| Source | Cu loading | N | Q+ (mC) | |Q-| (mC) | Total charge (mC) |
|---|---|---|---|---|---|
| Hemp hurds | Bare | 1 | 0.0049 | 0.0055 | 0.0104 |
| Hemp hurds | 15 wt% | 3 | 0.251 ± 0.019 | 0.248 ± 0.046 | 0.500 ± 0.047 |
| Hemp hurds | 25 wt% | 3 | 0.461 ± 0.359 | 0.337 ± 0.169 | 0.798 ± 0.528 |
| Hemp hurds | 50 wt% | 3 | 0.477 ± 0.134 | 0.299 ± 0.083 | 0.777 ± 0.208 |
| Hemp hurds | 75 wt% | 3 | 0.284 ± 0.058 | 0.252 ± 0.025 | 0.536 ± 0.053 |
| Corn cob | Bare | 1 | 0.0054 | 0.0055 | 0.0109 |
| Corn cob | 15 wt% | 3 | 0.254 ± 0.069 | 0.249 ± 0.031 | 0.503 ± 0.098 |
| Corn cob | 25 wt% | 3 | 0.262 ± 0.043 | 0.246 ± 0.023 | 0.507 ± 0.066 |
| Corn cob | 50 wt% | 3 | 0.421 ± 0.058 | 0.338 ± 0.100 | 0.759 ± 0.157 |
| Corn cob | 75 wt% | 3 | 0.321 ± 0.065 | 0.343 ± 0.046 | 0.665 ± 0.111 |
Table 4.
Final TGA residue at 800 °C and CuO-equivalent Cu content of Cu-modified nanocellulose.
| Sample | Nominal Cu loading (wt%) | Final residue at 800 °C (wt%) | CuO-equivalent Cu content (wt%)* |
|---|---|---|---|
| H-NC-Cu 15% | 15 | 24.7 | 19.7 |
| H-NC-Cu 25% | 25 | 35.1 | 28.0 |
| H-NC-Cu 50% | 50 | 48.1 | 38.4 |
| H-NC-Cu 75% | 75 | 56.8 | 45.4 |
| C-NC-Cu 15% | 15 | 51.2 | 40.9 |
| C-NC-Cu 25% | 25 | 56.0 | 44.7 |
| C-NC-Cu 50% | 50 | 57.8 | 46.2 |
| C-NC-Cu 75% | 75 | 61.05 | 48.8 |
Disclaimer/Publisher’s Note: The statements, opinions and data contained in all publications are solely those of the individual author(s) and contributor(s) and not of MDPI and/or the editor(s). MDPI and/or the editor(s) disclaim responsibility for any injury to people or property resulting from any ideas, methods, instructions or products referred to in the content. |
© 2026 by the authors. Licensee MDPI, Basel, Switzerland. This article is an open access article distributed under the terms and conditions of the Creative Commons Attribution (CC BY) license (http://creativecommons.org/licenses/by/4.0/).
Copyright: This open access article is published under a Creative Commons CC BY 4.0 license, which permit the free download, distribution, and reuse, provided that the author and preprint are cited in any reuse.