

Submitted:
01 October 2026
Posted:
05 October 2026
You are already at the latest version
Abstract
Circular economy practices are increasingly integrated into supply chains through reuse, repair, remanufacturing, recycling, resource recovery, and reverse logistics. Although these practices are generally expected to improve sustainability, greater circular activity does not necessarily produce proportional environmental, economic, or social benefits. Circular interventions can increase transportation, sorting, processing, inventory, coordination, and energy requirements, while efficiency improvements and lower effective resource costs may stimulate additional consumption. Recovered materials may also lose value when recovery volumes exceed processing capability or secondary market demand. This study examines this problem as the circularity paradox and develops a qualitative system dynamics framework to explain the conditions under which circular supply chain initiatives create or erode sustainable value. The study synthesizes peer-reviewed literature and secondary evidence, with selected evidence from the United States and Bangladesh used to illustrate system relationships under different institutional and operational conditions. The framework integrates circular intervention intensity, reverse flow complexity, recovery efficiency, organizational capability, stakeholder coordination, secondary market absorptive capacity, rebound demand, value leakage, and sustainability performance. Reinforcing and balancing feedback loops are developed to show how circular interventions can generate sustained benefits, diminishing returns, capacity pressure, market constraints, and rebound effects. The study distinguishes circular activity from sustainable circular performance and argues that effective circular supply chains require alignment between the scale of circular intervention and the capabilities of the supporting logistics, organizational, processing, and market systems. The framework provides a theoretical foundation for future empirical validation and quantitative system dynamics simulation and offers implications for managers and policymakers seeking to expand circularity without shifting environmental and economic burdens elsewhere in the supply chain.
Keywords:
circular supply chain
; circular economy
; rebound effect
; value leakage
; reverse logistics
; sustaina-ble value
; system dynamics
; organizational capability
; secondary materials
; sustainability per-formance
1. Introduction
Circular economy principles have become increasingly important in efforts to reduce resource depletion, waste generation, and environmental pressure associated with conventional linear production and consumption. Rather than following a take-make-use-dispose model, circular systems seek to retain products, components, materials, and their embedded value through reduction, reuse, repair, refurbishment, remanufacturing, recycling, and resource recovery [1,2,3]. These principles have important implications for supply chain management because materials that previously left the economic system as waste are increasingly expected to return through reverse flows and re-enter production or consumption. Circular supply chain management therefore connects sourcing, production, distribution, consumption, collection, recovery, and secondary markets within a broader system of material and value flows [4,5,6]. The environmental logic supporting this transition is compelling, but the relationship between circularity and sustainability is not necessarily straightforward. Increasing collection, recycling, remanufacturing, or reuse can reduce waste and virgin resource requirements, yet the same activities may require additional transportation, sorting, storage, inspection, processing, energy, information exchange, and coordination. Returned products are often geographically dispersed and uncertain in quantity, timing, condition, and quality, creating operational requirements that differ substantially from conventional forward supply chains [6,7]. Recovered materials can also lose economic or functional value through contamination, degradation, inefficient processing, downcycling, or weak secondary demand. Thus, increasing the quantity of material circulating within a supply chain does not by itself establish that the supply chain has become more sustainable.
A further challenge is created by rebound effects. Efficiency improvements and circular business models may reduce the effective cost of products or resources, extend their availability, or create additional economic value. These benefits can alter producer and consumer behavior in ways that increase consumption and material throughput, partially offsetting the environmental improvements initially achieved [8,9,10]. Rebound can also occur at the system level when expansion of one circular activity creates additional requirements elsewhere. Higher collection volumes, for example, may increase recovery opportunities but can simultaneously place pressure on transportation networks, sorting facilities, processing capacity, storage infrastructure, and secondary material markets. The resulting sustainability outcome depends on the interaction between the circular intervention and the capacity of the wider system to support it. This study refers to this tension as the circularity paradox: increasing circular intervention can strengthen resource recovery and value retention while simultaneously activating operational, market, organizational, and behavioral mechanisms that weaken part of the expected sustainability gain. The paradox does not suggest that circular practices are inherently unsustainable. Rather, it emphasizes that circular activity and sustainable circular performance are not equivalent. A supply chain can become more circular in terms of material recovery while experiencing diminishing sustainability returns if the supporting system does not develop at a comparable rate.
Existing studies provide substantial knowledge about circular supply chains, reverse logistics, circular business models, organizational capabilities, recycling, remanufacturing, and circular economy barriers [6,11,12]. Another stream of research has identified circular economy rebound effects and demonstrated that circular interventions can produce unintended behavioral and economic responses [8,9,10,13]. However, these mechanisms are frequently examined separately. Less attention has been given to how rebound demand, reverse flow complexity, organizational capability, recovery efficiency, stakeholder coordination, and secondary market capacity interact as parts of the same supply chain system and collectively determine whether additional circularity creates or leaks sustainable value. Such relationships are inherently dynamic. Greater recovery may increase retained material value and strengthen investment in circular capabilities, creating a reinforcing process. At the same time, higher recovery volumes can increase reverse logistics complexity and processing pressure, creating balancing forces that constrain further improvement. Expanding secondary material supply may strengthen circular production when sufficient demand exists but depress recovered material value when market absorption is limited. Efficiency improvements may reduce resource requirements per unit while stimulating additional demand. These interacting processes involve feedback, delays, capacity constraints, and unintended consequences, making system dynamics particularly appropriate for examining the problem [14,15].
Accordingly, this study develops a literature-based qualitative system dynamics framework explaining how circular intervention intensity influences sustainable supply chain performance through reinforcing and balancing feedback processes. Selected secondary evidence from the United States and Bangladesh is incorporated to illustrate how these relationships may operate under different levels of infrastructure, organizational capability, market development, and institutional support. The two countries are not treated as directly comparable empirical cases; rather, they provide contrasting contexts for examining the broader theoretical relationships. The study addresses three questions: Why does increasing circular supply chain activity not necessarily produce proportional sustainability improvement? How do reverse flow complexity, organizational capability, recovery efficiency, stakeholder coordination, secondary market capacity, and rebound demand influence sustainable value creation and value leakage? What feedback structures determine whether circular interventions generate sustained benefits, diminishing returns, or unintended consequences? By addressing these questions, the study develops a system-level explanation of the circularity paradox and shifts attention from the amount of circular activity to the net sustainable value it generates. This distinction provides the foundation for the literature review and the qualitative system dynamics framework developed in the following sections.
2. Literature Review and Theoretical Foundations
Circular supply chain management extends circular economy principles across sourcing, production, distribution, consumption, return, recovery, and reintegration. Rather than treating waste as the final stage of a product life cycle, circular systems seek to retain products, components, materials, and embedded value through reduction, reuse, repair, refurbishment, remanufacturing, recycling, and resource recovery [1,2,3,16]. Circular supply chains consequently connect forward and reverse flows and require coordination among manufacturers, suppliers, customers, logistics providers, collectors, recyclers, remanufacturers, and secondary material users [4,5,6,11,17,18,19]. The expected benefits are substantial. Reuse and repair can extend product life, remanufacturing can preserve components and embedded value, and recycling can reduce disposal and substitute secondary materials for virgin resources. Circular practices may also improve resource productivity and create new economic opportunities when recovery activities are supported by appropriate organizational and institutional conditions [6,12,20,21]. However, the literature also increasingly recognizes that material circulation is not equivalent to sustainability. Circular strategies differ in the amount of functional, economic, and material value they retain, and recovery activities themselves consume resources [16,20,22,23,24]. This distinction between material circulation and value retention is central to the present study. Table 1 summarizes the major literature streams that provide the theoretical foundation for the circularity paradox.
Their integration is necessary to explain how circular interventions can simultaneously create value and generate operational, market, organizational, and behavioral pressures.
2.1. Circularity, Value Retention, and Reverse Flow Complexity
Circular supply chains introduce operational characteristics that are less prominent in conventional forward supply chains. Returned products are uncertain in timing, quantity, location, condition, and quality. They may require collection, consolidation, transportation, inspection, disassembly, sorting, cleaning, storage, repair, remanufacturing, recycling, and redistribution before value can be recovered [5,6,7,25,26]. Increasing circular intervention therefore creates both a recovery opportunity and an operational burden. The distinction becomes important as circular activity expands. Early recovery may capture relatively accessible and high-value resources, whereas additional recovery can involve geographically dispersed sources, smaller quantities, greater contamination, or lower-value materials. Transportation, labor, energy, sorting, and processing requirements can consequently rise while the marginal value retained declines. This creates the possibility of value leakage, where part of the environmental or economic benefit expected from circularity is lost through the activities necessary to maintain the circular flow. The literature similarly identifies contamination, excessive transportation, inefficient sorting, low recovery yields, downcycling, storage delays, and insufficient processing capacity as mechanisms through which physical recovery and sustainable value recovery can diverge.
2.2. Rebound Effects and the Limits of Circular Expansion
Rebound provides a second explanation for why circularity and sustainability may diverge. Circular interventions can reduce resource requirements or effective costs, but the resulting savings can alter consumption, production, and market behavior. Zink and Geyer [8] show that circular economy rebound can occur when secondary products fail to displace primary production or when lower prices stimulate additional consumption. Makov and Font Vivanco [9] similarly demonstrate that rebound can materially affect the environmental gains attributed to circular interventions. More recent studies conceptualize circular rebound as a broader systemic phenomenon involving interacting behavioral, market, technological, and governance mechanisms [10,13,27,28,29,30,31]. Direct rebound can occur when lower costs encourage greater use of the same product or service. Indirect rebound can arise when savings are spent elsewhere, while economy-wide effects can influence prices, production, investment, and overall resource demand. Circularity may therefore improve resource efficiency per unit without producing an equivalent reduction in total material throughput. The literature also identifies direct, indirect, and wider system responses as important reasons that environmental improvement per unit may not translate into lower total environmental burden. The present study extends this reasoning beyond consumption rebound. A circular intervention may generate value leakage through transportation, processing, inventory, coordination, and capacity pressures even when consumer demand remains unchanged. Rebound demand and operational value leakage are therefore distinct but interacting mechanisms. Together, they explain how circular activity can increase while net sustainability benefits grow more slowly, stabilize, or under unfavorable conditions decline. Table 2 summarizes the principal mechanisms through which expected circular economy benefits can be weakened.
Table 2 demonstrates that counteracting effects can arise across multiple circular strategies, including reuse, remanufacturing, recycling, reverse logistics, resource efficiency, and secondary material recovery. These mechanisms provide the basis for incorporating value leakage and rebound effects into the proposed framework.
2.3. Capability, Coordination, and Market Absorption
Circular supply chains require capabilities for managing uncertain returns, material quality, multiple recovery pathways, information sharing, and relationships among organizations [17,18,32]. Dynamic capability theory is therefore relevant because firms must integrate and reconfigure resources as circular operations evolve [33,34,35]. Greater circular experience can generate learning and improve recovery efficiency, but circular activity can also expand faster than organizational capability. In that situation, delays, inventory accumulation, quality problems, and coordination costs increase. The literature supporting the present study specifically identifies this reciprocal relationship between circular activity, organizational learning, and operational complexity. Digital technologies can strengthen this capability through product identification, traceability, condition monitoring, data sharing, and improved visibility of reverse flows [36,37,38,39,40,41,42]. However, digital visibility does not remove physical constraints. Better information cannot independently create transportation capacity, sorting facilities, recycling technology, or secondary demand. Digital capability should therefore be viewed as one component of wider circular system capacity. Secondary markets represent another important constraint. Recovery creates sustainable value only when recovered products and materials can be reintegrated into economically viable applications. Material quality, consistency, technical standards, transaction costs, virgin-material prices, and buyer confidence influence this process. When recovered supply increases faster than demand, inventories can rise and recovered material prices can decline, weakening the economic case for further recovery investment [19,43,44]. Conversely, stable secondary demand can increase material value and encourage investment in quality and recovery capacity. Thus, recovery capacity and market absorptive capacity must develop together. Table 3 summarizes the principal system constraints and enabling conditions that influence sustainable circular performance.
The relationships summarized in Table 3 indicate that sustainable circular performance depends on alignment across organizational, technological, logistical, processing, market, and demand conditions rather than on circular intervention alone.
2.4. Research Gap and Theoretical Position
The literature provides strong individual explanations for circular supply chain benefits, reverse logistics complexity, rebound effects, organizational capability, and secondary market constraints. Although recent studies have begun to model circular economy rebound using system dynamics, less attention has been given to an integrated supply-chain explanation that connects rebound with reverse-flow complexity, organizational capability, recovery capacity, secondary-market absorption, and operational value leakage as interacting feedback mechanisms. Reverse logistics research explains the difficulty of managing returns; capability research explains organizational adaptation; rebound research explains counteracting behavioral and market responses; and circular economy research explains resource retention. Examined separately, however, these streams provide only a partial explanation of net circular performance. This study therefore conceptualizes the circularity paradox through five connected mechanisms: resource recovery, value leakage, capability alignment, secondary market absorption, and rebound demand. Recovery creates potential value; organizational capability determines how efficiently that value can be retained; reverse flow complexity creates operational leakage; secondary markets determine whether recovered resources can be productively absorbed; and rebound responses determine whether efficiency improvements translate into absolute reductions in resource pressure. These mechanisms are mutually dependent rather than independent.
The resulting theoretical position is that circular intervention intensity and sustainable circular performance should not be assumed to have a continuously proportional relationship. Their relationship depends on the balance between value-creating and value-leaking mechanisms. Greater recovery can strengthen investment and capability, while greater complexity can increase operating burdens. Higher recovered-material quality can stimulate secondary demand, while excessive secondary supply can reduce material value. Efficiency can reduce resource requirements per unit, while rebound can increase total throughput. These opposing relationships create the reinforcing and balancing feedback structures examined through the system dynamics methodology in the following sections. Accordingly, this study conceptualizes sustainable circular supply chain performance as the outcome of interacting value-creating and value-leaking feedback processes, integrating recovery, reverse-flow complexity, organizational capability, capacity constraints, secondary-market absorption, and rebound within a qualitative system dynamics framework.
3. Research Methodology
3.1. Research Design and Evidence Selection
This study adopts a literature-based qualitative system dynamics approach to examine the circularity paradox in sustainable supply chains [45]. System dynamics is appropriate for problems characterized by interdependence, feedback, delays, capacity constraints, and unintended consequences [14,15]. It has also been applied to supply chain and resource recovery systems to explain how changes in one part of a system influence economic and environmental outcomes elsewhere. Shamsuddoha [48] applied system dynamics to integrate forward and reverse supply chain processes in sustainable manufacturing, while Shamsuddoha et al. [49] modeled reverse logistical loops for poultry waste recovery. Subsequent studies extended this approach to sustainable dairy supply chains and dairy waste treatment, demonstrating how feedback structures, resource recovery, operational capacity, and alternative scenarios can be integrated within sustainability analysis [46,47]. Unlike those studies, the present research does not develop a calibrated simulation from primary operational data. It uses published literature and secondary evidence to construct a qualitative causal model explaining how circular interventions can simultaneously create sustainable value and generate counteracting pressures. Peer-reviewed studies on circular supply chains, reverse logistics, rebound effects, resource recovery, organizational capabilities, secondary material markets, and system dynamics form the principal evidence base. Recent literature is prioritized, while established studies are retained where necessary to support theoretical concepts and system dynamics methodology.
3.2. System Boundary and Model Development
The system boundary begins with circular intervention intensity and extends through reverse logistics, recovery operations, organizational capability, stakeholder coordination, secondary material markets, demand responses, and sustainability outcomes. Variables were included when the literature showed a recurring theoretical or operational relationship with circular supply chain performance. The main variables include circular intervention intensity, reverse flow complexity, recovery capacity, recovery efficiency, organizational capability, stakeholder coordination, recovered material quality, secondary material supply and demand, value leakage, rebound demand, virgin resource displacement, and sustainable value creation. The causal loop diagram (CLD) was developed in three stages. First, recurring relationships among the selected variables were identified from the literature. Second, the direction of each relationship was specified. A positive relationship indicates that two variables move in the same direction, all else being equal, while a negative relationship indicates movement in opposite directions. Third, the relationships were connected into reinforcing and balancing feedback loops. Reinforcing loops amplify an initial change, whereas balancing loops constrain growth or counteract the original change [15]. The model development also builds on the systems logic used in earlier supply chain applications by Shamsuddoha and colleagues, where causal relationships were translated into feedback structures before evaluating alternative system behavior. Applications to poultry supply chains, dairy operations, and dairy waste recovery demonstrate how economic, environmental, logistical, and recovery variables can be represented within an interconnected system rather than analyzed independently [46,47,48,49]. The present study extends this methodological logic from sector-specific operational systems to a broader theoretical model of circular supply chain performance.
3.3. Qualitative Analysis and Model Credibility
Because the study is conceptual and based on secondary evidence, the causal relationships represent theoretically expected directions rather than statistically estimated effects. The model is used to identify conditions under which reinforcing mechanisms strengthen circular performance and conditions under which balancing mechanisms create diminishing returns, value leakage, capacity pressure, or rebound effects. Selected evidence from the United States and Bangladesh is used to illustrate these mechanisms under different supply chain and institutional conditions rather than to conduct a direct country comparison. Model credibility is established through consistency between the proposed causal relationships and the supporting literature. Relationships are retained when supported by established theory, peer-reviewed empirical findings, prior system dynamics research, or clear material-flow and supply chain logic. This approach is consistent with the use of system dynamics for representing complex sustainability relationships before quantitative calibration [15]. Future research can convert the qualitative structure into a stock-and-flow simulation, estimate parameters, test alternative policies, and conduct sensitivity and behavioral validation.
4. Development of the Circularity Paradox Framework
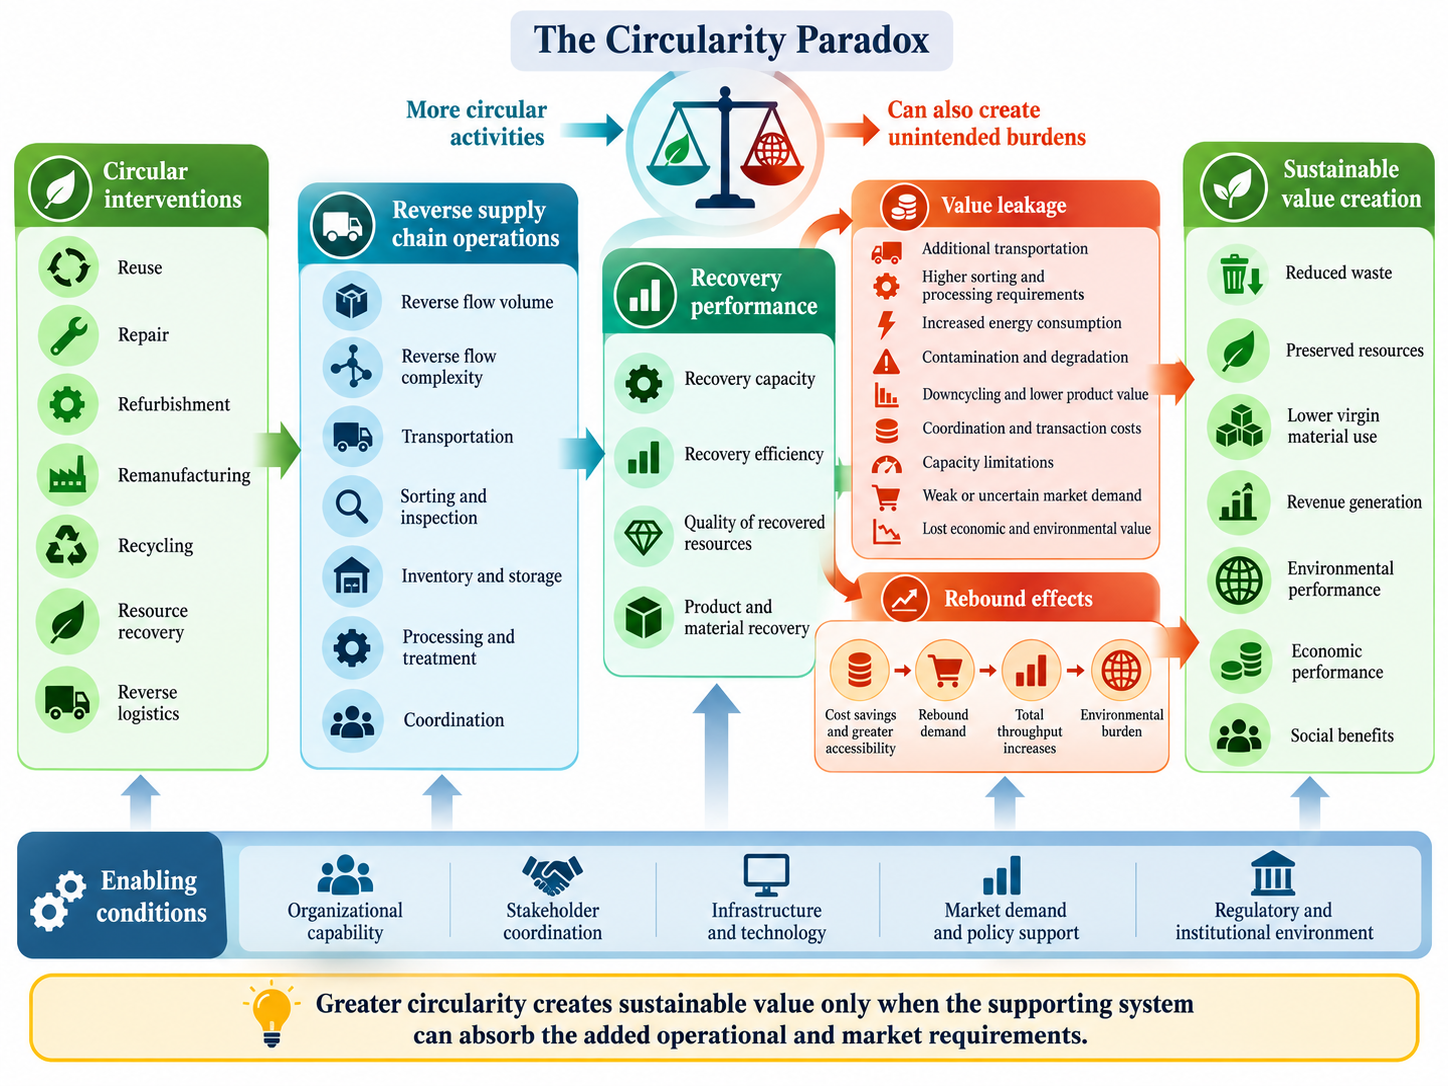
The literature indicates that circular supply chain performance is shaped by the interaction of resource recovery, reverse logistics, organizational capability, processing capacity, market demand, and behavioral responses. Circular interventions can create value by extending product life, recovering materials, reducing waste, and displacing virgin resources. However, the same interventions can increase transportation, sorting, processing, storage, coordination, and energy requirements. The central argument of the proposed framework is therefore that greater circularity creates sustainable value only when the supporting system can absorb the additional operational and market requirements generated by circular flows [4,6,10].
4.1. Circular Intervention and Sustainable Value Creation
Circular intervention intensity represents the extent to which a supply chain applies reuse, repair, refurbishment, remanufacturing, recycling, resource recovery, and reverse logistics. At lower levels of circular activity, increasing intervention can capture products and materials that would otherwise be discarded. This can reduce waste, preserve embedded value, and decrease demand for virgin resources [2,20]. Greater recovery can also generate revenue and organizational learning, supporting further investment in circular infrastructure and capabilities. The sustainability benefit of additional recovery, however, depends on what happens after products and materials enter the reverse supply chain. Returned resources differ in location, quantity, condition, composition, and quality. Increasing recovery can therefore expand transportation distances, sorting requirements, inventory, processing intensity, and coordination needs [6,7]. As increasingly difficult or lower-value resources enter the recovery system, the marginal benefit of additional circular activity may decline. This study describes the resulting loss as value leakage. Value leakage occurs when part of the environmental or economic value expected from a circular intervention is lost through additional logistics, processing, energy consumption, contamination, degradation, downcycling, coordination costs, capacity limitations, or weak market demand. The concept connects circular supply chain operations with rebound thinking by showing that sustainability gains can be reduced even when physical recovery continues to increase. Table 4 defines the core variables used in the circularity paradox framework and identifies their roles within the system.
Collectively, the variables in Table 4 distinguish circular activity from its net sustainability outcome. Their interactions determine whether additional circular intervention strengthens sustainable value creation or increases value leakage and counteracting pressures.
4.2. Capability and Capacity Constraints
Circular intervention places additional demands on organizational capabilities, and recent studies show that organizational, technological, institutional, and market barriers often interact rather than operate independently [43,50,51,52]. Firms must coordinate product returns, evaluate material condition, determine appropriate recovery pathways, exchange information with external partners, and adapt operations to uncertain reverse flows. Dynamic capability theory suggests that performance depends on the ability of organizations to integrate and reconfigure resources as environmental and operational conditions change [33,34]. In circular supply chains, this means that expansion of circular activity needs to be accompanied by corresponding development of logistical, technological, informational, and managerial capabilities. When capability develops alongside circular activity, learning and experience can improve recovery efficiency and support further circular investment [53,54]. When circular intervention expands faster than capability, however, a capability gap emerges. Increasing reverse flows can then create congestion, inventory accumulation, processing delays, contamination, coordination problems, and higher operating costs. Similar capacity relationships have been observed in system dynamics applications of resource recovery, where expansion of recovery activities without sufficient processing and logistical capability can shift system bottlenecks rather than eliminate them [49]. Physical recovery capacity creates a related constraint. Increased collection produces sustainability benefits only when sufficient sorting, recycling, remanufacturing, treatment, and storage capacity is available. When reverse flows approach or exceed available capacity, delays and congestion can reduce recovery efficiency and recovered material quality. Because infrastructure expansion requires investment and time, a delay can develop between growth in circular intervention and the capacity required to support it. This creates an important balancing mechanism within the circular supply chain.
4.3. Secondary Markets and Rebound Pressure
Recovery alone does not complete a circular flow. Recovered products and materials must be absorbed by markets capable of returning them to productive use. When secondary demand is strong, increased recovery can improve revenue, encourage investment, and strengthen recovery capability. When recovered material supply grows faster than demand, however, prices can decline, inventories can accumulate, and the financial attractiveness of recovery can weaken. Secondary market absorptive capacity therefore establishes another boundary on the scale at which circular intervention can generate sustainable value [8,20]. Circular interventions can also alter demand. Reuse, remanufacturing, sharing, recycling, and efficiency improvements can reduce effective costs or increase product availability. Consumers or firms may respond by increasing consumption, while financial savings may be redirected toward other resource-consuming activities. These responses can reduce the amount of virgin production or environmental burden actually displaced by circular strategies [8,9,10]. Rebound pressure is therefore incorporated into the framework as a mechanism linking circular efficiency with total system throughput. Table 5 contrasts the potential value-creating effects of major circular mechanisms with the value leakage or counteracting effects that may accompany them.
4.4. Integrated Causal Structure
The proposed framework integrates these mechanisms into a system in which circular intervention produces both value-creating and value-constraining pathways, consistent with recent systems-oriented circular economy research [45,55,56]. The first pathway operates through recovery, value retention, reduced virgin resource dependence, organizational learning, and circular investment. The second operates through reverse flow complexity, operating burden, capacity pressure, value leakage, secondary market saturation, and rebound demand. These interacting pathways are conceptualized in Figure 1.
The conceptual structure suggests that the relationship between circular intervention and sustainability is conditional rather than uniformly positive. When organizational capability, processing capacity, stakeholder coordination, and secondary market demand develop alongside circular intervention, the value-creating pathway can dominate. When circular intervention expands more rapidly than these supporting conditions, value leakage and rebound mechanisms become stronger. Table 6 summarizes the expected sustainability consequences under different combinations of circular activity, supporting capability, processing capacity, market conditions, and rebound pressure.
These relationships establish the causal foundation for the feedback structure. The next stage connects them into reinforcing and balancing loops to explain how the circularity paradox develops over time.
5. Feedback Structure and Causal Loop Model
The circularity paradox becomes clearer when the relationships identified in Section 4 are represented as interacting feedback loops. The proposed causal loop model contains three reinforcing loops and four balancing loops. The reinforcing loops explain how recovery, capability development, coordination, and secondary markets can strengthen circular performance. The balancing loops capture reverse flow complexity, capacity pressure, market saturation, and rebound effects that can reduce the net sustainability gains from expanding circularity.
5.1. Reinforcing Feedback Loops
R1: Recovery–Investment Loop. Greater circular intervention increases resource recovery, which increases the quantity of products, components, and materials available for productive reuse. When these resources retain sufficient quality and market value, recovery generates economic returns that strengthen the business case for further circular investment. Additional investment improves recovery capability and supports further circular intervention. This reinforcing process helps explain how economically viable recovery systems can become progressively stronger once sufficient scale and market value are established [4,6,20].
R2: Capability–Efficiency Loop. Circular intervention also generates operational experience and organizational learning. Learning strengthens circular supply chain capability, which improves decisions concerning collection, sorting, processing, reuse, remanufacturing, and recycling. Higher capability increases recovery efficiency and retained value, strengthening incentives for continued circular investment. This relationship is consistent with dynamic capability theory, in which organizational performance depends on the ability to integrate and reconfigure resources as operating conditions change [33,34,35].
R3: Quality–Market Development Loop. Improved sorting and recovery capability increases the consistency and quality of recovered products and materials [57,58]. Higher quality increases buyer confidence and secondary market demand, which improves recovered material value and strengthens investment in recovery technology. Improved technology subsequently increases recovered material quality. This loop demonstrates that secondary markets are not external to circular supply chains but can co-evolve with recovery capability and material quality [8,20].
5.2. Balancing Feedback Loops
B1: Reverse Flow Complexity Loop. Increasing circular intervention expands the quantity and diversity of reverse flows. Greater heterogeneity and geographic dispersion increase collection, transportation, inspection, sorting, inventory, and coordination requirements. These requirements increase circular operating costs and value leakage, reducing the net return from additional circular activity. The loop therefore constrains expansion when reverse flow complexity increases faster than organizational capability [6,7].
B2: Recovery Capacity Loop. Higher collection and return volumes increase pressure on sorting, recycling, remanufacturing, and treatment capacity. When processing capacity approaches its limit, congestion and delays increase and recovery efficiency can decline. Lower recovery efficiency reduces retained value and weakens the sustainability return from additional collection. Capacity investment can eventually reduce this pressure, but infrastructure development generally occurs with a delay, allowing temporary or persistent bottlenecks to emerge [46,49].
B3: Secondary Market Saturation Loop. Greater recovery increases the supply of secondary products and materials. When supply grows faster than secondary market demand, market absorption declines and recovered material prices can weaken. Lower recovered material value reduces recovery profitability and investment incentives, constraining further expansion. The effect is particularly important when recovered materials compete directly with relatively inexpensive virgin resources [8,20].
B4: Sustainability Rebound Loop. Improvements in resource efficiency, reuse, remanufacturing, or other circular practices can reduce effective product or resource costs. Lower costs and greater availability may increase consumption and total throughput. As throughput rises, production, transportation, energy consumption, and material requirements can also increase, offsetting part of the environmental benefit initially generated by circular intervention. The magnitude of this effect depends on consumer behavior, market conditions, substitution between secondary and primary products, and the extent to which circular products replace rather than supplement new production [8,9,10]. Table 7 consolidates the three reinforcing and four balancing feedback processes, their principal causal pathways, and their implications for circular supply chain performance.
5.3. Integrated Causal Loop Diagram
The seven feedback loops are integrated into the causal loop diagram presented in Figure 2. The left and central portions represent the intended circular pathway from intervention to recovery, value retention, capability development, and sustainable performance. The upper and lower pathways represent the principal counteracting mechanisms: reverse flow complexity, processing capacity pressure, secondary market saturation, and rebound demand. Organizational capability and stakeholder coordination influence the system by increasing its ability to manage larger and more complex circular flows [17,32,59].
The model shows why circular supply chain performance cannot be understood from recovery rates alone. When R1–R3 dominate, circular intervention strengthens capability, material quality, secondary demand, investment, and sustainable value. When B1–B4 become stronger, additional circular activity increases complexity, capacity pressure, market imbalance, and rebound effects. The resulting sustainability performance therefore depends on the relative strength of reinforcing value-creation processes and counteracting value-leakage processes rather than on circular intervention intensity alone.
6. System Conditions and Contextual Evidence
The causal structure suggests that circular interventions can produce different sustainability outcomes depending on the alignment among recovery activity, organizational capability, processing capacity, secondary markets, and demand responses. Four system conditions are therefore considered: fragmented circularity, scale without alignment, coordinated circularity, and value-preserving circularity. These conditions are qualitative representations rather than forecasts.
6.1. Alternative System Conditions
Under fragmented circularity, individual reuse, recycling, recovery, or reverse logistics initiatives exist, but coordination across the supply chain remains limited. Some materials are successfully recovered, yet weak information exchange, inconsistent quality, limited processing capacity, and uncertain markets create substantial value leakage. Increasing circular intervention can improve performance initially, but benefits remain constrained by the surrounding system. A more problematic condition occurs when circular activities are expanded primarily through collection or recovery targets without corresponding development of infrastructure, organizational capability, and secondary markets. This scale-without-alignment condition increases reverse flow volume while processing and market capacity remain relatively fixed. The balancing loops identified in Section 5 become stronger: congestion increases, recovery efficiency declines, secondary material inventories grow, and operating costs rise. Circularity indicators may improve while net sustainability gains increase only marginally or potentially deteriorate.
Coordinated circularity occurs when recovery expansion is accompanied by investment in processing capacity, information systems, organizational capability, stakeholder coordination, and secondary markets. Under this condition, the reinforcing loops are more likely to dominate. Recovery improves material availability, higher-quality outputs strengthen secondary demand, and economic returns support further capability development. The objective is therefore not maximum circular intervention but alignment between intervention and system capacity. The fourth condition extends this logic by combining efficient recovery with waste prevention, product-life extension, demand management, and higher-value retention strategies. Value-preserving circularity prioritizes reduction, reuse, repair, and remanufacturing where feasible before relying on material recycling and lower-value recovery. It also limits rebound pressure by focusing on absolute resource use and total system throughput rather than efficiency per unit alone [8,16,20]. Table 8 summarizes these alternative system conditions and their expected implications for circular supply chain development.
Table 8 illustrates that increasing circular intervention does not lead to a single predetermined outcome. The expected system behavior depends on whether capability, coordination, recovery capacity, and market capacity develop sufficiently to support the scale of circular activity.
6.2. Illustrative Evidence from the United States and Bangladesh
The United States and Bangladesh provide useful contrasting contexts for interpreting these system relationships. They are not used as matched cases, and differences in definitions, institutional structures, waste systems, and data availability prevent direct quantitative comparison. In the United States, circular economy development occurs within comparatively mature logistics and industrial systems, yet important structural constraints remain. The U.S. Environmental Protection Agency's National Recycling Strategy identifies reduced markets for recycled materials, inadequate infrastructure, contamination, consumer confusion, and inconsistent performance measurement as continuing challenges. The strategy specifically links stronger recycling performance with improved secondary markets, collection and infrastructure, reduced contamination, supportive policy, and better measurement [60]. These conditions closely correspond with the capacity and market feedback mechanisms represented in the proposed model.
The U.S. case also demonstrates why recycling alone should not be equated with circularity. EPA explicitly recognizes that municipal solid waste recycling represents only one component of a broader circular economy and that source reduction, reuse, product design, and other material strategies are required alongside recycling [60]. This supports the distinction made in the framework between increasing circular output and generating sustainable value. Bangladesh illustrates different but related system constraints. Rapid urbanization and increasing consumption have intensified pressure on material recovery systems. World Bank evidence indicates that annual per-capita plastic consumption in urban Bangladesh increased from approximately 3 kg in 2005 to 9 kg in 2020, while consumption in Dhaka reached approximately 22.5 kg per capita. The same evidence reported that only 37.2% of plastic waste in Dhaka was recycled, illustrating the gap that can emerge between growing material throughput and available recovery systems [61]. Bangladesh's National Action Plan for Sustainable Plastic Management adopts a circular approach based on reduction, reuse, and recycling and identifies infrastructure, technology, institutional capacity, investment, behavioral change, and stakeholder participation as interconnected requirements. The plan established phased targets extending to 2030 and emphasized that circular material flows require interventions across production, consumption, waste management, and regeneration rather than recycling alone [61]. These conditions reinforce the system argument developed here: increasing recovery targets without parallel development of infrastructure, markets, institutional capability, and stakeholder coordination can strengthen balancing constraints. Table 9 summarizes the contextual evidence from the United States and Bangladesh and relates it to the mechanisms represented in the proposed framework.
The two contexts therefore illustrate a common theoretical point despite substantial institutional differences. Circularity becomes constrained when material flows expand faster than the systems required to recover, process, coordinate, and absorb them. The location of the bottleneck may differ, but the underlying feedback structure remains relevant.
7. Discussion
The proposed framework challenges a simple linear assumption frequently associated with circular supply chain implementation:
More circular activity → more resource recovery → greater sustainability.
The system dynamics perspective suggests a more conditional relationship. Circular intervention increases recovery opportunities, but it also changes the volume and complexity of reverse flows. As these flows expand, organizational, logistical, processing, and market requirements increase. Sustainable performance therefore depends on whether supporting capabilities develop sufficiently to prevent these requirements from becoming sources of value leakage.
7.1. Explaining the Circularity Paradox
The paradox emerges from the simultaneous operation of reinforcing and balancing feedback. R1–R3 encourage circular expansion through recovery value, capability development, and secondary market development. These processes explain why successful circular initiatives can become increasingly viable as experience, scale, infrastructure, and market confidence develop. The balancing loops explain why the same expansion does not continue indefinitely without additional system adjustment. Reverse flow complexity increases management requirements; capacity constraints create congestion; growing secondary supply can exceed market absorption; and efficiency gains can stimulate rebound demand. The sustainability outcome depends on the relative strength of these opposing processes. The framework therefore does not identify a universal level of optimal circularity, which is consistent with recent research emphasizing contextual barriers, trade-offs, and system-specific transition conditions [45,50,55]. A recovery rate that is sustainable in one supply chain may generate excessive cost or environmental burden in another because transportation distance, material value, processing technology, energy sources, market demand, or organizational capability differ. Similarly, a circular intervention that initially produces strong benefits may experience diminishing returns as scale increases.
7.2. Circularity as a Capability–Capacity Alignment Problem
An important implication is that circular supply chain development can be understood as an alignment problem. Circular intervention creates demand for organizational capability, logistics capacity, recovery infrastructure, stakeholder coordination, and secondary market absorption. Sustainable value is more likely to increase when these supporting elements develop together. This interpretation extends dynamic capability thinking into circular supply chain systems. Organizational capability does not merely improve performance directly; it changes the level of circular complexity that a supply chain can manage before balancing pressures dominate. Stronger capability can therefore shift the point at which circular intervention begins experiencing diminishing returns. The same principle applies to infrastructure and markets. Expanding collection without processing capacity moves the bottleneck downstream. Expanding processing without secondary demand creates recovered material inventories. Expanding secondary demand without reliable material quality creates supply uncertainty. Circular supply chain performance consequently depends on coordinated development across the complete system.
7.3. Propositions for Future Empirical Testing
The causal framework produces several propositions that can be examined through future survey research, case analysis, longitudinal data, or quantitative system dynamics simulation. Table 10 presents eight propositions derived from the reinforcing and balancing relationships identified in the framework.
Together, these propositions translate the conceptual framework into testable relationships. They provide a basis for examining how capability, capacity, market absorption, and rebound conditions influence the relationship between circular intervention and sustainable circular performance.
8. Theoretical Contributions
The study makes three principal theoretical contributions. First, it separates circular intervention intensity from sustainable circular performance. Circular supply chain studies frequently use recovery, recycling, reuse, or circular practice adoption as indicators of progress. The present framework argues that these measures describe circular activity but do not independently establish net sustainability performance. Sustainable circular performance requires consideration of the value retained and the environmental and economic burdens generated in achieving that retention.
Second, the study introduces value leakage as a connecting mechanism between circular supply chain operations and circular rebound. Existing rebound research has established that efficiency and circular business models can stimulate behavioral and economic responses that offset environmental gains [8,9,10]. The proposed framework extends this reasoning by incorporating operational leakage through reverse logistics complexity, processing burden, capacity pressure, degradation, and secondary market constraints. Circular benefits can therefore be eroded through operational mechanisms even when a conventional consumption rebound is limited.
Third, the framework integrates dynamic capabilities with system dynamics. Organizational capability affects the ability of the system to absorb increasing circular complexity, while feedback from successful recovery can itself strengthen capability through learning and investment. Capability is consequently both a determinant and an endogenous outcome of circular development. This provides a dynamic explanation of why similar circular interventions can produce different outcomes across firms, industries, and institutional environments.
9. Managerial and Policy Implications
For managers, the framework suggests that circular supply chain strategies should not be evaluated primarily through the quantity collected, returned, or recycled. Performance systems should also monitor recovery yield, transportation intensity, processing cost, recovered material quality, inventory accumulation, secondary market demand, virgin material displacement, and the net value retained through recovery. Increasing collection while recovered inventories accumulate or processing costs rise may indicate that the system is approaching a capacity or market constraint. Investment decisions should similarly be coordinated across the circular supply chain. Expanding reverse logistics requires corresponding consideration of sorting and processing capacity, information systems, recovery technology, workforce capability, and downstream markets. Digital visibility can improve coordination, but information alone cannot compensate for inadequate physical capacity or weak secondary demand. For policymakers, circular targets should avoid encouraging one-dimensional optimization. Collection or recycling targets can increase circular activity while transferring pressure to sorting facilities, recyclers, secondary markets, or other parts of the system. Policies combining waste prevention, design for recovery, collection infrastructure, recycled-content demand, market development, standards, information, and capacity building are more consistent with the system relationships identified in this study. The U.S. National Recycling Strategy similarly links stronger recycling with market development, infrastructure, contamination reduction, policy coordination, and improved measurement rather than relying on collection alone. Bangladesh's plastic management framework likewise emphasizes coordinated action across design, consumption, waste management, regeneration, infrastructure, technology, and institutional capacity.
10. Limitations and Future Research
This study develops a qualitative theoretical framework and therefore has several limitations. The causal relationships are grounded in literature and secondary evidence but are not estimated statistically. The causal loop model identifies expected directions and feedback mechanisms rather than numerical effect sizes, thresholds, or forecasts. The proposed circularity threshold should consequently be interpreted as a theoretical system condition rather than a predetermined numerical point. The United States and Bangladesh evidence is illustrative rather than comparative. Differences in economic structure, waste definitions, regulatory systems, informal sector participation, infrastructure, and data quality prevent direct comparison. Future research could examine the framework within individual industries or countries using standardized longitudinal data.
The most important extension would be development of a quantitative stock-and-flow system dynamics model. Stocks could include accumulated returned products, recoverable materials, recovery capacity, secondary material inventory, organizational capability, and circular investment. Flows could represent product returns, processing, material recovery, secondary material consumption, disposal, capacity investment, and capability development. Parameter estimation would permit sensitivity analysis and identification of conditions under which reinforcing or balancing loops become dominant. Future empirical studies could also test the propositions through survey data, longitudinal case studies, structural equation modeling, or multi-industry datasets. Sector-specific applications would be particularly valuable because circularity constraints vary considerably among plastics, electronics, automotive products, textiles, food, construction materials, and agricultural or livestock systems.
11. Conclusions
Circular supply chains offer important opportunities to reduce waste, retain resource value, and decrease dependence on virgin materials. However, increasing circular activity does not automatically generate proportional sustainability improvement. Circular interventions simultaneously create recovery opportunities and additional logistical, processing, organizational, market, and behavioral requirements. This study conceptualizes this tension as the circularity paradox and develops a qualitative system dynamics framework explaining its underlying feedback structure. Three reinforcing mechanisms support circular development through recovery value, capability improvement, and secondary market development. Four balancing mechanisms constrain these gains through reverse flow complexity, processing capacity pressure, secondary market saturation, and rebound demand. The central implication is that sustainable circularity depends on system alignment rather than circular intensity alone. Circular intervention must develop together with organizational capability, stakeholder coordination, recovery infrastructure, material quality, and secondary market demand. When these elements remain aligned, circular activity can reinforce sustainable value creation. When circular activity expands faster than the capacity of the surrounding system, value leakage and rebound effects can progressively reduce its marginal sustainability benefit. Circularity should therefore be viewed not as an end state but as a means of preserving economic, environmental, and social value. The relevant question for sustainable supply chain management is not simply how much material can be circulated, but how much sustainable value remains after the complete system required to circulate that material is considered.
Author Contributions
Conceptualization, M.S. and T.N.; methodology, M.S.; formal analysis, M.S. and T.N.; investigation, M.S. and T.N.; resources, M.S. and T.N.; writing—original draft preparation, M.S.; writing—review and editing, M.S. and T.N.; visualization, M.S.; supervision, M.S.; project administration, M.S. All authors have read and agreed to the published version of the manuscript.
Funding
This research received no external funding.
Institutional Review Board Statement
Not applicable.
Informed Consent Statement
Not applicable.
Data Availability Statement
No new datasets were generated. The literature and secondary sources used in this study are cited in the manuscript.
Acknowledgments
The authors acknowledge the scholarly literature and institutional sources that informed the development of the conceptual framework presented in this study. During the preparation of this manuscript, the authors used Gemini, Copilot and ChatGPT (OpenAI) to assist with language editing, manuscript organization, reference organization, and the visual preparation and refinement of conceptual figures. The authors reviewed and edited all outputs and take full responsibility for the content of the publication.
Conflicts of Interest
The authors declare no conflicts of interest.
References
- Ghisellini, P.; Cialani, C.; Ulgiati, S. A review on circular economy: The expected transition to a balanced interplay of environmental and economic systems. J. Clean. Prod. 2016, 114, 11–32. [Google Scholar] [CrossRef]
- Geissdoerfer, M.; Savaget, P.; Bocken, N.M.P.; Hultink, E.J. The Circular Economy—A new sustainability paradigm? J. Clean. Prod. 2017, 143, 757–768. [Google Scholar] [CrossRef]
- Kirchherr, J.; Reike, D.; Hekkert, M. Conceptualizing the circular economy: An analysis of 114 definitions. Resour. Conserv. Recycl. 2017, 127, 221–232. [Google Scholar] [CrossRef]
- Genovese, A.; Acquaye, A.A.; Figueroa, A.; Koh, S.C.L. Sustainable supply chain management and the transition towards a circular economy: Evidence and some applications. Omega 2017, 66, 344–357. [Google Scholar] [CrossRef]
- Batista, L.; Bourlakis, M.; Smart, P.; Maull, R. In search of a circular supply chain archetype—A content-analysis-based literature review. Prod. Plan. Control 2018, 29, 438–451. [Google Scholar] [CrossRef]
- Farooque, M.; Zhang, A.; Thürer, M.; Qu, T.; Huisingh, D. Circular supply chain management: A definition and structured literature review. J. Clean. Prod. 2019, 228, 882–900. [Google Scholar] [CrossRef]
- Govindan, K.; Soleimani, H. A review of reverse logistics and closed-loop supply chains: A Journal of Cleaner Production focus. J. Clean. Prod. 2017, 142, 371–384. [Google Scholar] [CrossRef]
- Zink, T.; Geyer, R. Circular economy rebound. J. Ind. Ecol. 2017, 21, 593–602. [Google Scholar] [CrossRef]
- Makov, T.; Font Vivanco, D. Does the circular economy grow the pie? The case of rebound effects from smartphone reuse. Front. Energy Res. 2018, 6, 39. [Google Scholar] [CrossRef]
- Castro, C.G.; Trevisan, A.H.; Pigosso, D.C.A.; Mascarenhas, J. The rebound effect of circular economy: Definitions, mechanisms and a research agenda. J. Clean. Prod. 2022, 345, 131136. [Google Scholar] [CrossRef]
- Govindan, K.; Hasanagic, M. A systematic review on drivers, barriers, and practices towards circular economy: A supply chain perspective. Int. J. Prod. Res. 2018, 56, 278–311. [Google Scholar] [CrossRef]
- Geissdoerfer, M.; Pieroni, M.P.P.; Pigosso, D.C.A.; Soufani, K. Circular business models: A review. J. Clean. Prod. 2020, 277, 123741. [Google Scholar] [CrossRef]
- Metic, J.; Pigosso, D.C.A. Research avenues for uncovering the rebound effects of the circular economy: A systematic literature review. J. Clean. Prod. 2022, 368, 133133. [Google Scholar] [CrossRef]
- Forrester, J.W. Industrial Dynamics; MIT Press: Cambridge, MA, USA, 1961. [Google Scholar]
- Sterman, J.D. Business Dynamics: Systems Thinking and Modeling for a Complex World; Irwin/McGraw-Hill: Boston, MA, USA, 2000. [Google Scholar]
- Korhonen, J.; Honkasalo, A.; Seppälä, J. Circular Economy: The concept and its limitations. Ecol. Econ. 2018, 143, 37–46. [Google Scholar] [CrossRef]
- Berardi, P.C.; de Brito, R.P. Supply chain collaboration for a circular economy—From transition to continuous improvement. J. Clean. Prod. 2021, 328, 129511. [Google Scholar] [CrossRef]
- Aarikka-Stenroos, L.; Chiaroni, D.; Kaipainen, J.; Urbinati, A. Companies' circular business models enabled by supply chain collaborations: An empirical-based framework, synthesis, and research agenda. Ind. Mark. Manag. 2022, 105, 322–339. [Google Scholar] [CrossRef]
- Bals, L.; Taylor, K.M.; Rosca, E.; Ciulli, F. Toward a circular supply chain: The enabling role of information and financial flows in open and closed loop designs. Resour. Conserv. Recycl. 2024, 209, 107781. [Google Scholar] [CrossRef]
- Velenturf, A.P.M.; Purnell, P. Principles for a sustainable circular economy. Sustain. Prod. Consum. 2021, 27, 1437–1457. [Google Scholar] [CrossRef]
- Farooque, M.; Zhang, A.; Liu, Y.; Hartley, J.L. Circular supply chain management: Performance outcomes and the role of eco-industrial parks in China. Transp. Res. Part E Logist. Transp. Rev. 2022, 157, 102596. [Google Scholar] [CrossRef]
- Linder, M.; Sarasini, S.; van Loon, P. A metric for quantifying product-level circularity. J. Ind. Ecol. 2017, 21, 545–558. [Google Scholar] [CrossRef]
- Saidani, M.; Yannou, B.; Leroy, Y.; Cluzel, F.; Kendall, A. A taxonomy of circular economy indicators. J. Clean. Prod. 2019, 207, 542–559. [Google Scholar] [CrossRef]
- Muller, L.N.P.S.; Delai, I.; Alcantara, R.L.C. Circular value chain practices for developing resource value retention options. J. Clean. Prod. 2022, 359, 131925. [Google Scholar] [CrossRef]
- Mishra, A.; Dutta, P.; Jayasankar, S.; Jain, P.; Mathiyazhagan, K. A review of reverse logistics and closed-loop supply chains in the perspective of circular economy. Benchmarking 2023, 30, 975–1020. [Google Scholar] [CrossRef]
- Mallick, P.K.; Salling, K.B.; Pigosso, D.C.A.; McAloone, T.C. Closing the loop: Establishing reverse logistics for a circular economy, a systematic review. J. Environ. Manag. 2023, 328, 117017. [Google Scholar] [CrossRef] [PubMed]
- Zerbino, P. How to manage the Circular Economy Rebound effect: A proposal for contingency-based guidelines. J. Clean. Prod. 2022, 378, 134584. [Google Scholar] [CrossRef]
- Schultz, F.C.; Valentinov, V.; Reinhardt, R.J.; Pies, I. The circular economy rebound effect: Reconceptualizing rebound approaches and mitigation opportunities from an ordonomic perspective. J. Ind. Ecol. 2024, 28, 374–385. [Google Scholar] [CrossRef]
- Lowe, B.H.; Bimpizas-Pinis, M.; Zerbino, P.; Genovese, A. Methods to estimate the circular economy rebound effect: A review. J. Clean. Prod. 2024, 443, 141063. [Google Scholar] [CrossRef]
- Ferrante, M.; Vitti, M.; Facchini, F.; Sassanelli, C. Mapping the relations between the circular economy rebound effects dimensions: A systematic literature review. J. Clean. Prod. 2024, 456, 142399. [Google Scholar] [CrossRef]
- Bączyk, M.; Tunn, V.; Worrell, E.; Corona, B. Consumer behavior in circular business models: Unveiling conservation and rebound effects. Sustain. Prod. Consum. 2024, 52, 283–298. [Google Scholar] [CrossRef]
- Calzolari, T.; Bimpizas-Pinis, M.; Genovese, A.; Brint, A. Understanding the relationship between institutional pressures, supply chain integration and the adoption of circular economy practices. J. Clean. Prod. 2023, 432, 139686. [Google Scholar] [CrossRef]
- Teece, D.J.; Pisano, G.; Shuen, A. Dynamic capabilities and strategic management. Strateg. Manag. J. 1997, 18, 509–533. [Google Scholar]
- Eisenhardt, K.M.; Martin, J.A. Dynamic capabilities: What are they? Strateg. Manag. J. 2000, 21, 1105–1121. [Google Scholar] [CrossRef]
- De Angelis, R.; Howard, M.; Miemczyk, J. Supply chain management and the circular economy: Towards the circular supply chain. Prod. Plan. Control 2018, 29, 425–437. [Google Scholar] [CrossRef]
- Nascimento, D.L.M.; Alencastro, V.; Quelhas, O.L.G.; Caiado, R.G.G.; Garza-Reyes, J.A.; Lona, L.R.; Tortorella, G. Exploring Industry 4.0 technologies to enable circular economy practices in a manufacturing context: A business model proposal. J. Manuf. Technol. Manag. 2019, 30, 607–627. [Google Scholar]
- Kristoffersen, E.; Blomsma, F.; Mikalef, P.; Li, J. The smart circular economy: A digital-enabled circular strategies framework for manufacturing companies. J. Bus. Res. 2020, 120, 241–261. [Google Scholar] [CrossRef]
- Awan, U.; Gölgeci, I.; Makhmadshoev, D.; Mishra, N. Industry 4.0 and circular economy in an era of global value chains: What have we learned and what is still to be explored? J. Clean. Prod. 2022, 371, 133621. [Google Scholar] [CrossRef]
- Chauhan, C.; Parida, V.; Dhir, A. Linking circular economy and digitalisation technologies: A systematic literature review of past achievements and future promises. Technol. Forecast. Soc. Change 2022, 177, 121508. [Google Scholar] [CrossRef]
- Taddei, E.; Sassanelli, C.; Rosa, P.; Terzi, S. Circular supply chains in the era of Industry 4.0: A systematic literature review. Comput. Ind. Eng. 2022, 170, 108268. [Google Scholar] [CrossRef]
- Toth-Peter, A.; Torres de Oliveira, R.; Mathews, S.; Barner, L.; Figueira, S. Industry 4.0 as an enabler in transitioning to circular business models: A systematic literature review. J. Clean. Prod. 2023, 393, 136284. [Google Scholar] [CrossRef]
- Jum'a, L.; Ikram, M.; Jabbour, C.J.C. Towards circular economy: An IoT enabled framework for circular supply chain integration. Comput. Ind. Eng. 2024, 192, 110194. [Google Scholar] [CrossRef]
- Grafström, J.; Aasma, S. Breaking circular economy barriers. J. Clean. Prod. 2021, 292, 126002. [Google Scholar] [CrossRef]
- Bening, C.R.; Pruess, J.T.; Blum, N.U. Towards a circular plastics economy: Interacting barriers and contested solutions for flexible packaging recycling. J. Clean. Prod. 2021, 302, 126966. [Google Scholar] [CrossRef]
- Guzzo, D.; Pigosso, D.C.A.; Videira, N.; Mascarenhas, J. A system dynamics-based framework for examining Circular Economy transitions. J. Clean. Prod. 2022, 333, 129933. [Google Scholar] [CrossRef]
- Shamsuddoha, M.; Nasir, T.; Hossain, N.U.I. A sustainable supply chain framework for dairy farming operations: A system dynamics approach. Sustainability 2023, 15, 8417. [Google Scholar] [CrossRef]
- Shamsuddoha, M.; Koul, S.; Taylor, I.W. Eco-efficient dairy waste treatment: Validating a sustainable system dynamics framework. SN Oper. Res. Forum 2024, 5, 12. [Google Scholar] [CrossRef]
- Shamsuddoha, M. Integrated supply chain model for sustainable manufacturing: A system dynamics approach. In Sustaining Competitive Advantage via Business Intelligence, Knowledge Management, and System Dynamics; Emerald Group Publishing Limited: Bingley, UK, 2015; Volume 22B, pp. 155–399. [Google Scholar] [CrossRef]
- Shamsuddoha, M.; Quaddus, M.A.; Woodside, A.G. Environmental sustainability through designing reverse logistical loops: Case research of poultry supply chains using system dynamics. J. Bus. Ind. Mark. 2021, 37, 823–840. [Google Scholar] [CrossRef]
- Hina, M.; Chauhan, C.; Kaur, P.; Kraus, S.; Dhir, A. Drivers and barriers of circular economy business models: Where we are now, and where we are heading. J. Clean. Prod. 2022, 333, 130049. [Google Scholar] [CrossRef]
- Kayikci, Y.; Kazancoglu, Y.; Lafci, C.; Gozacan, N. Exploring barriers to smart and sustainable circular economy: The case of an automotive eco-cluster. J. Clean. Prod. 2021, 314, 127920. [Google Scholar] [CrossRef]
- Mhatre, P.; Gedam, V.V.; Unnikrishnan, S.; Raut, R.D. Circular economy adoption barriers in built environment—A case of emerging economy. J. Clean. Prod. 2023, 392, 136201. [Google Scholar] [CrossRef]
- Tseng, M.-L.; Ha, H.M.; Tran, T.P.T.; Bui, T.-D.; Chen, C.-C.; Lin, C.-W. Building a data-driven circular supply chain hierarchical structure: Resource recovery implementation drives circular business strategy. Bus. Strategy Environ. 2022, 31, 2082–2106. [Google Scholar] [CrossRef]
- Cheng, T.C.E.; Kamble, S.S.; Belhadi, A.; Ndubisi, N.O.; Lai, K.-h.; Kharat, M.G. Linkages between big data analytics, circular economy, sustainable supply chain flexibility, and sustainable performance in manufacturing firms. Int. J. Prod. Res. 2022, 60, 6908–6922. [Google Scholar] [CrossRef]
- Silvério, A.C.; Ferreira, J.; Fernandes, P.O.; Dabić, M. How does circular economy work in industry? Strategies, opportunities, and trends in scholarly literature. J. Clean. Prod. 2023, 412, 137312. [Google Scholar] [CrossRef]
- Hina, M.; Chauhan, C.; Sharma, R.; Dhir, A. Circular economy business models as pillars of sustainability: Where are we now, and where are we heading? Bus. Strategy Environ. 2023, 32, 6182–6209. [Google Scholar] [CrossRef]
- Chien, C.-F.; Kuo, P.-C.; Sun, P.-C.; Kuo, H.-A. Green production planning for circular supply chain and resource management: An empirical study for high-tech textile dyeing. Resour. Conserv. Recycl. 2024, 204, 107499. [Google Scholar] [CrossRef]
- Chen, G.; Geng, D.; Zhu, Q. Implementation barriers to the circular supply chain mode for pre-consumer textile waste reprocessing in China. Resour. Conserv. Recycl. 2024, 206, 107621. [Google Scholar] [CrossRef]
- Di Maria, E.; De Marchi, V.; Galeazzo, A. Industry 4.0 technologies and circular economy: The mediating role of supply chain integration. Bus. Strategy Environ. 2022, 31, 619–632. [Google Scholar] [CrossRef]
- U.S. Environmental Protection Agency. National Recycling Strategy: Part One of a Series on Building a Circular Economy for All; U.S. EPA Office of Resource Conservation and Recovery: Washington, DC, USA, 2021. [Google Scholar]
- World Bank. Towards a Multisectoral Action Plan for Sustainable Plastic Management in Bangladesh; World Bank: Washington, DC, USA, 2021. [Google Scholar]
Figure 1.
Conceptual structure of the circularity paradox in sustainable supply chains. Source: Authors' development based on Zink and Geyer [8], Govindan and Soleimani [7], Farooque et al. [6], Velenturf and Purnell [20], Castro et al. [10], and Shamsuddoha et al. [49].
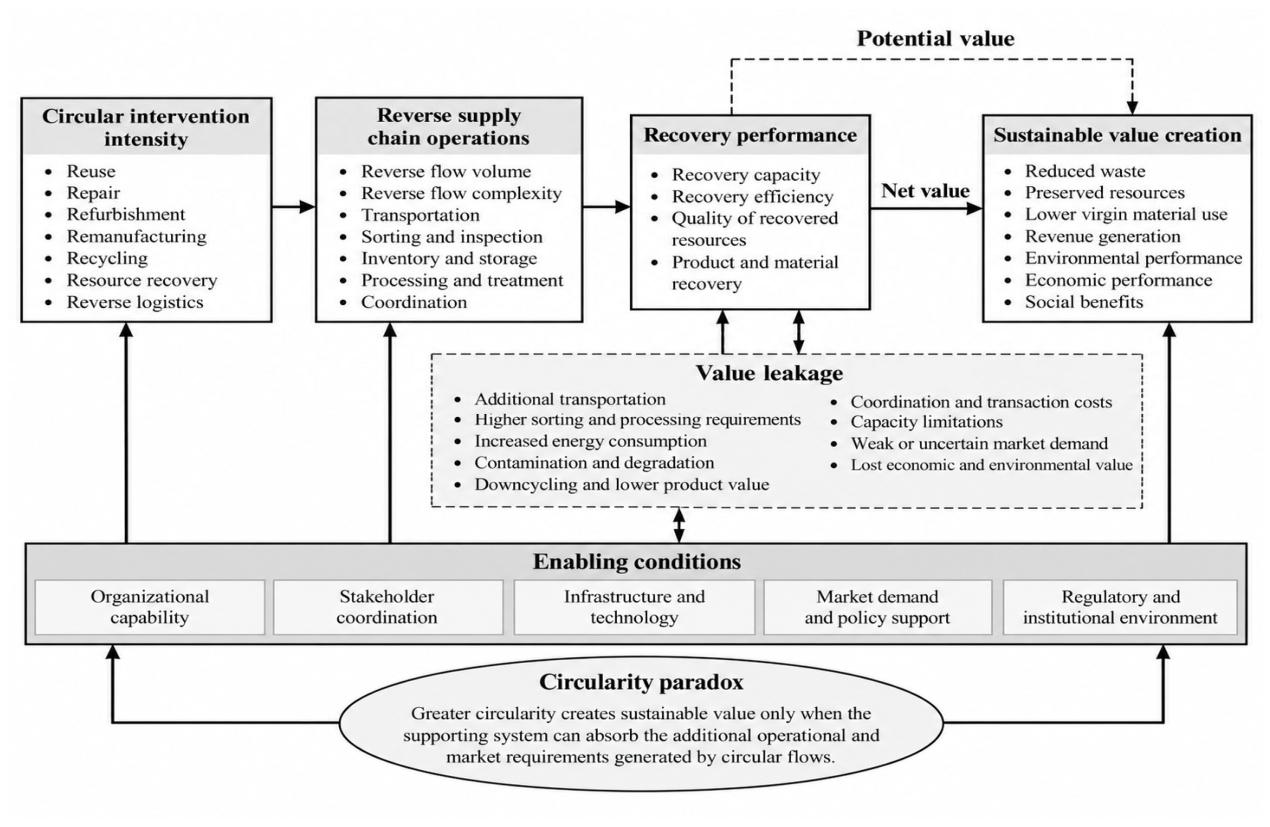
Figure 2.
Causal loop diagram of the circularity paradox in sustainable supply chains Note: (+) indicates movement in the same direction and (−) indicates movement in the opposite direction, all else being equal. R1–R3 represent reinforcing feedback processes, while B1–B4 represent counteracting processes within the circular system. The arrows represent theoretically expected causal directions rather than estimated effect sizes. Source: Authors' development based on Sterman [15], Zink and Geyer [8], Govindan and Soleimani [7], Farooque et al. [6], Makov and Font Vivanco [9], Velenturf and Purnell [20], Shamsuddoha et al. [49], Shamsuddoha et al. [46], and Castro et al. [10].
Figure 2.
Causal loop diagram of the circularity paradox in sustainable supply chains Note: (+) indicates movement in the same direction and (−) indicates movement in the opposite direction, all else being equal. R1–R3 represent reinforcing feedback processes, while B1–B4 represent counteracting processes within the circular system. The arrows represent theoretically expected causal directions rather than estimated effect sizes. Source: Authors' development based on Sterman [15], Zink and Geyer [8], Govindan and Soleimani [7], Farooque et al. [6], Makov and Font Vivanco [9], Velenturf and Purnell [20], Shamsuddoha et al. [49], Shamsuddoha et al. [46], and Castro et al. [10].
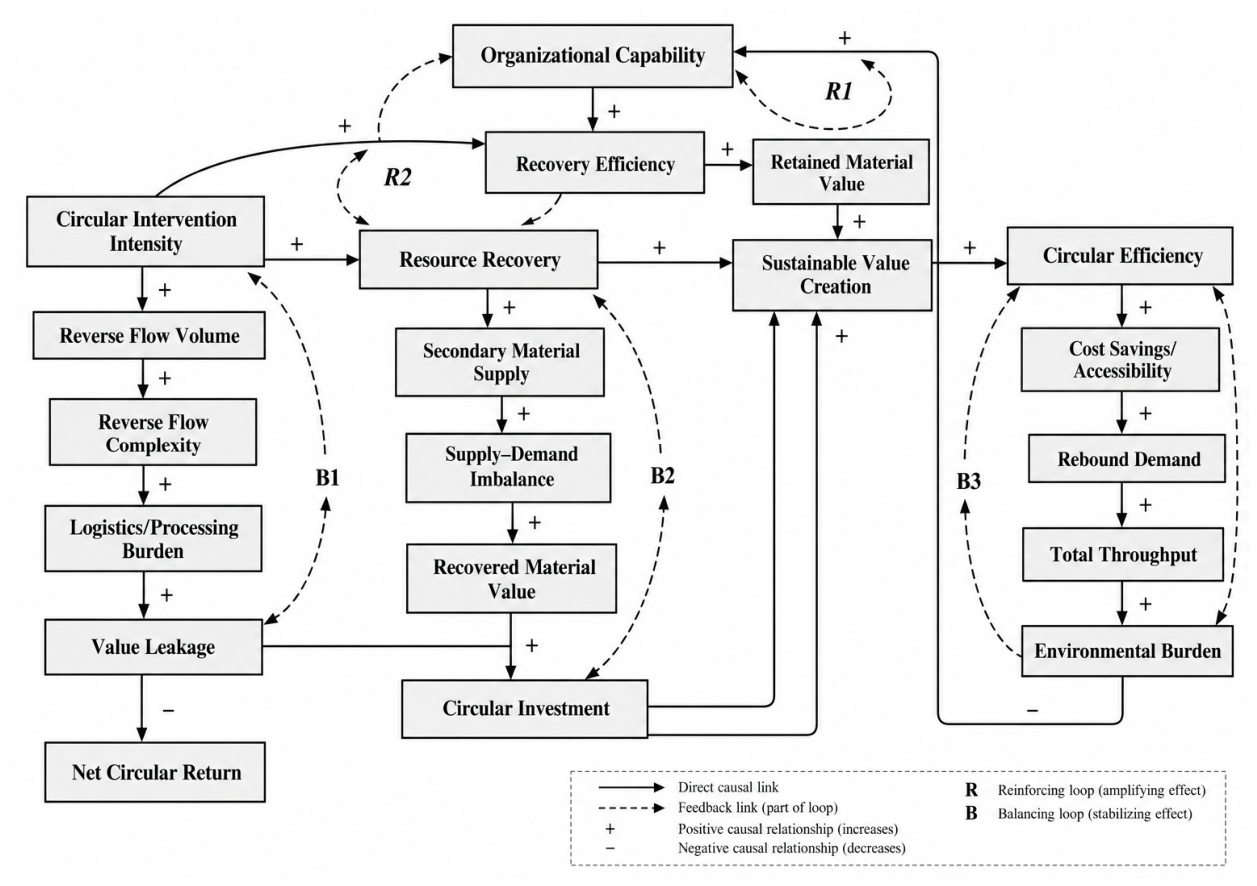

Table 1.
Major literature streams supporting the circularity paradox.
| Literature stream | Main contribution | Relevance to this study | References |
|---|---|---|---|
| Circular economy | Closing and slowing resource loops; reduction of waste and virgin-resource dependence | Establishes the broader circularity logic | Ghisellini et al. [1]; Geissdoerfer et al. [2]; Kirchherr et al. [3]; Korhonen et al. [16] |
| Circular supply chains | Integration of forward and reverse material flows | Establishes supply-chain-level circularity | Genovese et al. [4]; Batista et al. [5]; Govindan and Hasanagic [11]; Farooque et al. [6] |
| Value retention | Preservation of product, component, material, and economic value | Separates circulation from actual value preservation | Linder et al. [22]; Saidani et al. [23]; Velenturf and Purnell [20]; Muller et al. [24] |
| Reverse logistics | Collection, return, inspection, sorting, processing, and redistribution | Explains operational burden of circular flows | Govindan and Soleimani [7]; Batista et al. [5]; Farooque et al. [6] |
| Circular rebound | Circular improvements may stimulate additional consumption or fail to displace primary production | Explains counteracting sustainability effects | Zink and Geyer [8]; Makov and Font Vivanco [9]; Castro et al. [10]; Metic and Pigosso [13]; Schultz et al. [28]; Lowe et al. [29]; Ferrante et al. [30] |
| Dynamic capabilities | Organizations must integrate and reconfigure resources as conditions change | Explains differences in firms' ability to manage circular complexity | Teece et al. [33]; Eisenhardt and Martin [34]; de Angelis et al. [35] |
| Digital circularity | Traceability, visibility, information sharing, and data-enabled coordination | Supports management of complex reverse flows | Nascimento et al. [36]; Kristoffersen et al. [37]; Chauhan et al. [39]; Taddei et al. [40]; Jum'a et al. [42] |
| System dynamics | Feedback, delays, capacity constraints, and unintended consequences | Provides the modeling foundation | Forrester [14]; Sterman [15]; Shamsuddoha et al. [49]; Shamsuddoha et al. [46] |
Table 2.
Mechanisms that can weaken expected circular economy benefits.
| Mechanism | Initial circular benefit | Counteracting effect | References |
|---|---|---|---|
| Product reuse | Avoided or delayed new production | Lower prices or increased accessibility may stimulate additional consumption | Zink and Geyer [8]; Makov and Font Vivanco [9] |
| Remanufacturing | Retention of product and component value | Return uncertainty, inspection, disassembly, and processing requirements | Govindan and Soleimani [7]; Batista et al. [5] |
| Recycling | Virgin-material substitution and waste diversion | Energy use, sorting losses, contamination, and downcycling | Korhonen et al. [16]; Velenturf and Purnell [20] |
| Reverse logistics expansion | Greater resource capture | Additional transportation, handling, storage, and coordination | Govindan and Soleimani [7]; Farooque et al. [6]; Mishra et al. [25]; Mallick et al. [26] |
| Resource efficiency | Lower resource use per unit | Direct and indirect rebound may increase total throughput | Zink and Geyer [8]; Makov and Font Vivanco [9]; Castro et al. [10] |
| Increased recovery | Greater secondary resource availability | Processing capacity may become constrained | Shamsuddoha et al. [49]; Shamsuddoha et al. [46] |
| Secondary material growth | Greater potential virgin-material displacement | Supply can exceed market absorption | Zink and Geyer [8]; Velenturf and Purnell [20] |
| Circular scaling | Greater potential sustainability impact | Complexity can increase faster than organizational capability | de Angelis et al. [35]; Farooque et al. [6]; Metic and Pigosso [13] |
Table 3.
System constraints and enabling conditions for sustainable circular performance.
| System factor | Enabling condition | Constraint when misaligned | References |
|---|---|---|---|
| Organizational capability | Learning, adaptation, integration of circular processes | Complexity exceeds managerial capability | Teece et al. [33]; Eisenhardt and Martin [34]; de Angelis et al. [35] |
| Stakeholder coordination | Information sharing and aligned recovery decisions | Fragmentation and flow mismatch | Govindan and Hasanagic [11]; Farooque et al. [6] |
| Digital capability | Traceability, visibility, condition and flow information | Technology without physical capacity produces limited improvement | Nascimento et al. [36]; Kristoffersen et al. [37]; Chauhan et al. [39]; Taddei et al. [40]; Jum'a et al. [42] |
| Reverse logistics capacity | Efficient collection, consolidation, and transportation | Higher cost, delays, and dispersed flows | Govindan and Soleimani [7]; Farooque et al. [6]; Mishra et al. [25]; Mallick et al. [26] |
| Processing capacity | Sufficient sorting, remanufacturing, recycling, and treatment | Congestion, inventory accumulation, and recovery losses | Genovese et al. [4]; Shamsuddoha et al. [49]; Shamsuddoha et al. [46] |
| Recovered material quality | Consistent secondary resources suitable for productive use | Contamination and downcycling reduce retained value | Korhonen et al. [16]; Velenturf and Purnell [20] |
| Secondary market capacity | Reliable demand for recovered products and materials | Oversupply and declining recovery profitability | Zink and Geyer [8]; Velenturf and Purnell [20] |
| Demand response | Circular products substitute for primary production | Rebound increases consumption and total throughput | Makov and Font Vivanco [9]; Castro et al. [10]; Metic and Pigosso [13] |
Table 4.
Core variables and their roles in the circularity paradox.
| Variable | Definition in the framework | Role in the system | References |
|---|---|---|---|
| Circular intervention intensity | Extent of reuse, repair, remanufacturing, recycling, recovery, and reverse logistics | Initiates and expands circular flows | Geissdoerfer et al. [2]; Farooque et al. [6] |
| Reverse flow volume | Quantity of products, components, and materials returning to the supply chain | Creates recovery opportunity but increases handling requirements | Govindan and Soleimani [7]; Farooque et al. [6]; Mishra et al. [25]; Mallick et al. [26] |
| Reverse flow complexity | Uncertainty and heterogeneity in timing, location, condition, and quality of returns | Increases logistical and processing burden | Govindan and Soleimani [7]; Batista et al. [5] |
| Organizational capability | Ability to integrate, coordinate, learn, and adapt circular operations | Determines ability to manage increasing circular complexity | Teece et al. [33]; de Angelis et al. [35] |
| Stakeholder coordination | Alignment and information sharing among actors involved in circular flows | Improves visibility, collection, and recovery | Govindan and Hasanagic [11]; Farooque et al. [6] |
| Recovery capacity | Available collection, sorting, treatment, recycling, and remanufacturing capability | Determines how much reverse flow can be effectively processed | Genovese et al. [4]; Shamsuddoha et al. [49] |
| Recovery efficiency | Ability to convert returned resources into usable products, components, or materials | Increases retained value and reduces losses | Velenturf and Purnell [20]; Shamsuddoha et al. [49] |
| Secondary market absorptive capacity | Ability of markets to utilize recovered products and materials | Determines whether recovered resources create economic value | Zink and Geyer [8]; Castro et al. [10] |
| Rebound demand | Additional consumption or throughput associated with efficiency, availability, or cost effects | Can offset environmental gains | Zink and Geyer [8]; Makov and Font Vivanco [9]; Castro et al. [10] |
| Value leakage | Loss of expected circular value through operational, environmental, or market mechanisms | Reduces net benefit from circular activity | Korhonen et al. [16]; Velenturf and Purnell [20] |
| Sustainable circular performance | Net sustainability value remaining after benefits and counteracting effects | Principal system outcome | Korhonen et al. [16]; Farooque et al. [6] |
Table 5.
Value-creating and value-leaking mechanisms in circular supply chains.
| Circular mechanism | Potential value creation | Potential value leakage or counteracting effect | References |
|---|---|---|---|
| Reuse and repair | Extends product life and avoids new production | Collection, inspection, repair, and redistribution burdens | Geissdoerfer et al. [2]; Zink and Geyer [8] |
| Remanufacturing | Preserves components and embedded value | Disassembly costs, uncertain returns, and quality variation | Govindan and Soleimani [7]; Batista et al. [5] |
| Recycling | Reduces disposal and can displace virgin materials | Energy use, contamination, processing losses, and downcycling | Korhonen et al. [16]; Velenturf and Purnell [20] |
| Reverse logistics expansion | Captures additional products and materials | Transportation, storage, handling, and coordination requirements | Govindan and Soleimani [7]; Farooque et al. [6]; Mishra et al. [25]; Mallick et al. [26] |
| Increased recovery volume | Improves resource recovery and may create economies of scale | Capacity congestion and declining marginal recovery value | Genovese et al. [4]; Shamsuddoha et al. [49] |
| Organizational learning | Improves circular capability and recovery decisions | Benefits may lag behind rapid expansion of circular activity | Teece et al. [33]; de Angelis et al. [35] |
| Stakeholder coordination | Improves information, recovery quality, and flow alignment | Requires governance, information sharing, and coordination resources | Govindan and Hasanagic [11]; Farooque et al. [6] |
| Secondary material supply | Reduces dependence on virgin resources | Oversupply can weaken prices and recovery profitability | Zink and Geyer [8]; Velenturf and Purnell [20] |
| Resource efficiency | Reduces resource requirements per unit | Lower effective cost can stimulate rebound demand | Makov and Font Vivanco [9]; Castro et al. [10] |
Table 6.
Expected system conditions and sustainability consequences.
| System condition | Circular activity | Supporting capability and capacity | Expected sustainability consequence | References |
|---|---|---|---|---|
| Early circular development | Low to moderate | Capacity generally sufficient | Strong initial gains from additional recovery | Geissdoerfer et al. [2]; Farooque et al. [6] |
| Coordinated expansion | Moderate to high | Capability and markets develop with recovery | Sustained value creation and higher recovery efficiency | de Angelis et al. [35]; Velenturf and Purnell [20] |
| Capacity-constrained expansion | High | Processing or logistics capacity develops slowly | Congestion, higher cost, and increasing value leakage | Govindan and Soleimani [7]; Shamsuddoha et al. [49] |
| Market-constrained circularity | High | Secondary demand remains limited | Inventory accumulation and declining recovered material value | Zink and Geyer [8]; Velenturf and Purnell [20] |
| Rebound-dominated circularity | High efficiency/circularity | Demand response is insufficiently controlled | Higher throughput offsets part of expected environmental gain | Makov and Font Vivanco [9]; Castro et al. [10] |
Table 7.
Feedback loops in the circularity paradox framework.
| Loop | Type | Main causal pathway | System implication | References |
|---|---|---|---|---|
| R1 Recovery–Investment | Reinforcing | Recovery → retained value → economic return → circular investment → recovery capability → recovery | Successful recovery can become self-reinforcing | Genovese et al. [4]; Farooque et al. [6]; Velenturf and Purnell [20] |
| R2 Capability–Efficiency | Reinforcing | Circular experience → organizational capability → recovery efficiency → sustainable value → investment → capability | Learning strengthens the ability to manage circular flows | Teece et al. [33]; Eisenhardt and Martin [34]; de Angelis et al. [35] |
| R3 Quality–Market Development | Reinforcing | Recovery capability → material quality → secondary demand → recovered value → recovery investment → capability | Quality and market development can strengthen each other | Zink and Geyer [8]; Velenturf and Purnell [20] |
| B1 Reverse Flow Complexity | Balancing | Circular intervention → reverse flow complexity → operating burden → value leakage → lower net return → circular investment | Complexity can reduce marginal benefits of additional circularity | Govindan and Soleimani [7]; Farooque et al. [6]; Mishra et al. [25]; Mallick et al. [26] |
| B2 Recovery Capacity | Balancing | Reverse flow volume → capacity utilization → congestion/delay → lower recovery efficiency → lower retained value | Collection growth can exceed downstream capacity | Shamsuddoha et al. [49]; Shamsuddoha et al. [46] |
| B3 Secondary Market Saturation | Balancing | Recovered supply → supply–demand imbalance → lower recovered value → lower profitability → weaker recovery investment | Recovery can exceed market absorptive capacity | Zink and Geyer [8]; Velenturf and Purnell [20] |
| B4 Sustainability Rebound | Balancing | Circular efficiency → lower effective cost → demand/throughput → environmental burden → lower net sustainability gain | Efficiency gains can be partially offset by additional consumption | Zink and Geyer [8]; Makov and Font Vivanco [9]; Castro et al. [10] |
Table 8.
Alternative system conditions for circular supply chain development.
| System condition | Circular intervention | Capability and coordination | Recovery and market capacity | Expected system behavior | References |
|---|---|---|---|---|---|
| Fragmented circularity | Low–moderate | Uneven | Limited or fragmented | Some recovery gains but substantial value leakage | Govindan and Hasanagic [11]; Farooque et al. [6] |
| Scale without alignment | High and rapidly expanding | Develops slowly | Capacity and markets lag behind recovery | Congestion, higher cost, declining marginal benefit, market pressure | Govindan and Soleimani [7]; Zink and Geyer [8]; Shamsuddoha et al. [49] |
| Coordinated circularity | Moderate–high | Strong | Develops with circular flows | Recovery, quality, investment, and market demand reinforce one another | de Angelis et al. [35]; Farooque et al. [6]; Velenturf and Purnell [20] |
| Value-preserving circularity | Selective and system-oriented | Strong | Aligned with resource hierarchy and demand | Higher value retention with lower value leakage and rebound pressure | Korhonen et al. [16]; Castro et al. [10] |
Table 9.
Contextual evidence and implications for the circularity paradox.
| Context | Observed system issue | Relevance to the proposed framework | References |
|---|---|---|---|
| United States | Recycling infrastructure has not consistently kept pace with a diverse and changing waste stream | Supports the recovery-capacity constraint | U.S. EPA [60] |
| United States | Reduced and uncertain markets for recycled materials remain a recycling challenge | Supports secondary market absorptive capacity | U.S. EPA [60] |
| United States | Contamination and inconsistent recycling practices affect material recovery | Supports recovered-quality and value-leakage mechanisms | U.S. EPA [60] |
| United States | Recycling alone is insufficient for achieving a circular economy | Supports distinction between circular activity and sustainable circular performance | U.S. EPA [60] |
| Bangladesh | Urban plastic consumption increased substantially between 2005 and 2020 | Illustrates throughput pressure on recovery systems | World Bank [61] |
| Bangladesh | Only 37.2% of plastic waste in Dhaka was reported as recycled in the cited 2021 evidence | Illustrates the gap between material generation and recovery | World Bank [61] |
| Bangladesh | Sustainable plastic management requires infrastructure, technology, investment, institutional capacity, and stakeholder coordination | Supports capability-alignment relationships | World Bank [61] |
| Bangladesh | National strategy combines reduction, reuse, recycling, design, waste management, and regeneration | Supports system-level rather than recycling-only circularity | World Bank [61] |
Table 10.
Theoretical propositions derived from the circularity paradox framework.
| Proposition | Expected relationship | References |
|---|---|---|
| P1 | Circular intervention intensity positively influences sustainable value creation when recovery capability and market absorption remain sufficient. | Genovese et al. [4]; Farooque et al. [6] |
| P2 | The positive relationship between circular intervention and sustainable performance weakens as reverse flow complexity increases relative to organizational capability. | Govindan and Soleimani [7]; de Angelis et al. [35] |
| P3 | Organizational capability positively moderates the relationship between circular intervention intensity and recovery efficiency. | Teece et al. [33]; Eisenhardt and Martin [34]; de Angelis et al. [35] |
| P4 | Recovery volume exceeding available processing capacity increases value leakage and reduces marginal sustainability gains. | Shamsuddoha et al. [49]; Shamsuddoha et al. [46] |
| P5 | Secondary market absorptive capacity positively moderates the relationship between resource recovery and sustainable value creation. | Zink and Geyer [8]; Velenturf and Purnell [20] |
| P6 | Increasing recovered material supply beyond secondary market absorption reduces recovered material value and weakens circular investment incentives. | Zink and Geyer [8]; Velenturf and Purnell [20] |
| P7 | Resource-efficiency gains generate smaller improvements in net sustainability performance when rebound demand is high. | Makov and Font Vivanco [9]; Castro et al. [10] |
| P8 | Greater alignment among circular intervention, organizational capability, recovery capacity, stakeholder coordination, and secondary market demand increases sustainable circular performance. | Farooque et al. [6]; Castro et al. [10] |
Disclaimer/Publisher’s Note: The statements, opinions and data contained in all publications are solely those of the individual author(s) and contributor(s) and not of MDPI and/or the editor(s). MDPI and/or the editor(s) disclaim responsibility for any injury to people or property resulting from any ideas, methods, instructions or products referred to in the content. |
© 2026 by the authors. Licensee MDPI, Basel, Switzerland. This article is an open access article distributed under the terms and conditions of the Creative Commons Attribution (CC BY) license (http://creativecommons.org/licenses/by/4.0/).
Copyright: This open access article is published under a Creative Commons CC BY 4.0 license, which permit the free download, distribution, and reuse, provided that the author and preprint are cited in any reuse.