

Submitted:
30 September 2026
Posted:
02 October 2026
You are already at the latest version
Abstract
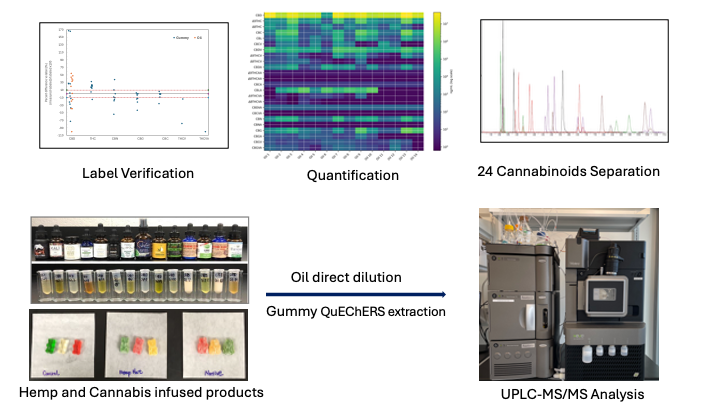
Accurate potency testing is essential for quality control, regulatory compliance, and consumer safety in commercial cannabis products, particularly as edible and oil formulations increasingly contain complex mixtures of major and minor cannabinoids. In this study, a selective ultra-performance liquid chromatography-tandem mass spectrometry (UPLC-MS/MS) method was developed and validated for the simultaneous quantification of 24 cannabinoids in cannabis-derived oils and gummy products. The method included cannabinoids commonly targeted in AOAC-relevant potency testing, together with additional minor, acidic, varin-type, and degradation-related cannabinoids to support full-spectrum product assessment. Chromatographic separation was optimized to resolve structurally related isomers with identical or highly similar MRM transitions, including Δ9/Δ8 cannabinoid pairs and their acidic and varin analogues. The method demonstrated good linearity across analyte-specific calibration ranges, with LOQs of 0.05-0.1 ng/mL and LODs of 0.005-0.05 ng/mL. Bias values for quality control samples at 4, 400, and 800 ng/mL ranged from -19.3% to 10.1%, meeting the predefined acceptance criterion of +/-20%. Recovery in gummy matrices fortified at 0.04, 0.4, and 4 μ/g was generally within 80-110%, confirming acceptable extraction performance. Application to 14 hemp oil and 18 hemp- or cannabis-infused gummy products revealed wide variations in cannabinoid profiles, with concentrations spanning ng/mL to mg/mL in oils and ng/g to mg/g in gummies. Label comparison further demonstrated substantial deviations for CBD, Δ9-THC, and several minor cannabinoids. This validated method provides a practical tool for comprehensive potency testing, quality assessment, and label-accuracy evaluation of commercial cannabis-derived oils and edible products.
Keywords:
cannabinoids
; cannabis edibles
; hemp oil
; potency testing
; label accuracy
; UPLC-MS/MS
; minor cannabinoids
; full-spectrum profiling
1. Introduction
The cannabis plant (Cannabis sativa L.) has been utilized for therapeutic, medicinal, and industrial purposes for thousands of years. Although historical drug control policies categorized cannabis as a Schedule I controlled substance due to the psychoactive properties of Δ9-tetrahydrocannabinol (Δ9-THC), recent legislative changes across the United States have expanded access to medical and recreational cannabis markets1, 2. This rapid expansion has accelerated the commercialization of diverse product formats, among which infused edibles (e.g., gummies, baked goods, beverages) and sublingual hemp oils represent the fastest-growing market segments3-5. However, regulatory oversight and standardized quality control have lagged behind market growth, resulting in widespread mislabeling, inconsistent dosing, and untruthful promotional claims across commercial products6. Inaccurate or missing label information poses significant public health risks: under-labeled products can lead consumers to inadvertently overconsume psychoactive compounds, resulting in central nervous system depression, psychosis, hallucinations, and dysrhythmias7, 8. Furthermore, commercial edibles frequently resemble conventional candies and snacks, leading to accidental pediatric ingestions associated with severe toxicities such as coma, seizures, severe vomiting, and respiratory distress9, 10.
To establish standardized testing guidelines, AOAC International defined Standard Method Performance Requirements (SMPRs) for cannabinoid potency testing in complex edible matrices11, 12. The AOAC framework targets 14 priority cannabinoids, designating 5 compounds as mandatory (Δ9-THC, CBD, CBN, Δ9-THCA, and CBDA) and 9 compounds as desirable (CBG, CBGA, CBC, CBCA, CBDV, CBDVA, THCV, THCVA, and Δ8-THC)12. While this 14-cannabinoid panel captures the primary constituents, commercial formulations are increasingly marketed as “full-spectrum” or “broad-spectrum” products containing minor, acidic, varin-type, and degradation-related cannabinoids. Beyond labeling inaccuracies, comprehensive profiling of these minor constituents is critical for consumer safety. Emerging toxicological and pharmacological evidence indicates that minor cannabinoids, structural isomers, and degradation byproducts can exhibit variable CB1/CB2 receptor binding affinities and unexpected toxicities, ranging from central nervous system depression, sedation, and anxiety to acute cardiovascular and respiratory distress13-15. To address potential unlisted compounds, thermal or oxidative degradation products, and unintended contaminants, an expanded analytical scope is required. In this study, 10 additional cannabinoids include Δ8-THCVA, Δ8-THCV, Δ8-THCA, CBNA, CBLA, CBL, CBCVA, CBCV, CBGVA, and CBGV were incorporated into the analytical panel alongside the 14 AOAC-recommended targets (Figure 1). These 24 compounds span three major metabolic categories: native acidic cannabinoids, neutral decarboxylation products, and secondary degradation products. Comprehensive profiling of these 24 targets enables a complete assessment of product formulation integrity, raw material origin, and labeling accuracy.
Profiling multi-cannabinoid mixtures in complex matrices presents two major analytical challenges: broad dynamic concentration ranges and severe structural isomerism16. First, commercial oils and edibles exhibit extreme concentration disparities between major cannabinoids (CBD and Δ9-THC, often present at high mg/mL or mg/g levels) and minor or trace cannabinoids (often present at sub-μg or low ng levels). Achieving simultaneous quantification without requiring excessive serial dilutions or risking detector saturation requires an analytical method with high sensitivity coupled with a wide linear dynamic range, usually a tandem mass spectrometry. Second, many of the 24 target cannabinoids are structural or positional isomers that possess identical molecular weights and yield identical multiple reaction monitoring (MRM) mass transitions. For example, the neutral isomer group (CBD, Δ9-THC, Δ8-THC, CBC, and CBL) shares the mass transition m/z 315.2→193.1, while the varin isomer group (CBDV, Δ9-THCV, Δ8-THCV, and CBCV) shares m/z 287.2→165.2. In addition, the Δ9/Δ8cannabinoid pairs and their respective acidic (Δ9-THCAA vs. Δ8-THCAA) and varin (Δ9-THCVA vs. Δ8-THCVA) analogues differ only in the position of a single carbon-carbon double bond, producing indistinguishable MS/MS fragmentation patterns17. Consequently, tandem mass spectrometry alone cannot differentiate these isomeric pairs; baseline chromatographic resolution prior to MS detection is indispensable for accurate identification and quantification.
The primary objective of this research was to develop and validate a highly selective, sensitive, and high-throughput UPLC-MS/MS method for the simultaneous quantification of 24 cannabinoids in commercial hemp oils and edible gummy matrices. Using optimized QuEChERS sample preparation and chromatographic conditions, the method was applied to evaluate full-spectrum cannabinoid profiles and assess label accuracy across 14 commercial hemp oils and 18 hemp- and cannabis-infused gummies, providing a robust platform to support product quality control and consumer safety.
2. Method and Materials
2.1. Chemicals and Reagents
Phytocannabinoid Mixture 10 (CRM) was purchased from Cayman Chemical (Ann Arbor, MI, USA) as a solution in acetonitrile containing 250 μg mL⁻¹ of each analyte. The mixture included cannabidiol (CBD), Δ⁹-tetrahydrocannabinol (Δ⁹-THC), Δ⁸-tetrahydrocannabinol (Δ⁸-THC), cannabichromene (CBC), cannabinol (CBN), cannabigerol (CBG), cannabidivarin (CBDV), cannabigerolic acid (CBGA), cannabidiolic acid (CBDA), and Δ⁹-tetrahydrocannabinolic acid (Δ⁹-THCA).
Individual reference standards of cannabidivarinic acid (CBDVA), Δ⁹-tetrahydrocannabivarin (Δ⁹-THCV), Δ⁹-tetrahydrocannabivarinic acid (Δ⁹-THCVA), Δ⁸-tetrahydrocannabinolic acid (Δ⁸-THCA), Δ⁸-tetrahydrocannabivarin (Δ⁸-THCV), Δ⁸-tetrahydrocannabivarinic acid (Δ⁸-THCVA), cannabichromenic acid (CBCA), cannabichromevarin (CBCV), cannabichromevarinic acid (CBCVA), cannabinolic acid (CBNA), cannabigerovarin (CBGV), cannabigerovarinic acid (CBGVA), cannabicyclol (CBL), and cannabicyclolic acid (CBLA) were also obtained from Cayman Chemical.
QuEChERS extraction salts (ECQUEU750CT-MP) were purchased from United Chemical Technologies (Bristol, PA, USA). LC-MS grade methanol, acetonitrile, and formic acid were obtained from Fisher Scientific (Waltham, MA, USA).
2.2. Cannabinoids Standard Preparation
Individual cannabinoid standards (CBDVA, Δ⁹-THCV, Δ⁹-THCVA, Δ⁸-THCA, Δ⁸-THCV, Δ⁸-THCVA, CBCA, CBCV, CBCVA, CBNA, CBGV, CBGVA, CBL, and CBLA) were diluted with acetonitrile to prepare 1 mg mL⁻¹ stock solutions. Equal volumes of the individual standards were combined and diluted with acetonitrile to obtain a mixed of 14 standard solution at 50 μg mL⁻¹ for each analyte.
The Phytocannabinoid Mixture 10 reference material was diluted to 50 μg mL⁻¹ and combined with the mixed 14 cannabinoid standard solution. The resulting stock solution contained 24 cannabinoids, each at a concentration of 10 μg mL⁻¹
2.3. Sample Collection and Preparation
2.3.1. Hemp and Cannabis-Infused Products
Hemp-derived products, including oils and gummies, were purchased from online retailers and local retail stores. Cannabis-infused gummy products were obtained from licensed dispensaries in New Jersey, USA. The study included 14 hemp oil samples, 7 hemp gummy samples, and 11 cannabis-infused gummy samples. All samples were stored at −80 °C until analysis.
2.3.2. Hemp Oil Preparation
Oil samples were diluted and analyzed directly without further extraction. Briefly, 0.1 mL of oil was transferred into a 2 mL tube containing 0.9 mL of isopropanol. Samples were vortex mixed and sonicated for 30 min. Following sonication, 0.1 mL of the supernatant was further diluted with acetonitrile (60- to 5000-fold, depending on the anticipated cannabinoid concentration) prior to LC-MS/MS analysis.
2.3.3. Gummy Sample Extraction
Gummy samples were frozen overnight and cut into approximately 2 mm pieces prior to homogenization. A 1.0 g aliquot of homogenized sample was weighed into a 50 mL centrifuge tube, followed by the addition of 5 mL deionized water. Samples were shaken for 30 min to facilitate dissolution. Subsequently, 10 mL acetonitrile was added and the mixture was vortexed for 1 min. One packet of QuEChERS extraction salts (ECQUEU750CT-MP) was added, and the sample was vortexed for an additional 1 min. Samples were centrifuged at 4,000 rpm for 5 min to achieve phase separation. The upper acetonitrile layer was collected and diluted as necessary prior to LC-MS/MS analysis.
2.4. Instrumentation Conditions
Sample analysis was performed using a Waters ACQUITY Premier UPLC system coupled to a Xevo TQ Absolute triple quadrupole mass spectrometer (Waters Corporation, Milford, MA, USA).
Separation was achieved on a Waters CORTECS C18 column (3.0 × 150 mm, 2.7 μm particle size). The column temperature was maintained at 30 °C and the autosampler temperature at 10 °C. The mobile phases consisted of (A) water containing 0.1% formic acid and (B) acetonitrile containing 0.1% formic acid. Separation was achieved at a flow rate of 0.5 mL min⁻¹ using the following gradient program: 24% A from 0.0 to 10.0 min, 21% A from 10.1 to 12.0 min, and 24% A from 12.1 to 15.0 min to equlibrum the column. The injection volume was 5 μL.
Detection was carried out using a Waters Xevo TQ Absolute triple quadrupole mass spectrometer operated with electrospray ionization (ESI). The capillary voltage was set at 0.8 kV and the cone voltage at 20 V. The desolvation temperature was maintained at 450 °C, with desolvation, cone, and nebulizer gas flow rates of 1000, 150, and 102 L h⁻¹, respectively. Nitrogen was used as the nebulizing and desolvation gas, while argon was used as the collision gas at a flow rate of 0.15 mL min⁻¹. Data were acquired in multiple reaction monitoring (MRM) mode using optimized precursor/product ion transitions for each cannabinoid.
2.5. Method Validation
Method validation was conducted in accordance with ANSI/ASB Standard 036, Standard Practices for Method Validation in Forensic Toxicology18. Validation parameters included calibration model performance, linearity, limits of detection (LOD), limits of quantitation (LOQ), carryover, bias, precision, and extraction recovery.
2.5.1. Calibration Model, Lod, Loq and Carryover
Calibration standards were prepared in triplicate by serial dilution of a 24-cannabinoid mixed stock solution at 10 μg/mL with 50:50 (v/v) acetonitrile/water. The final calibration levels were 0.005, 0.01, 0.05, 0.1, 0.5, 1, 5, 10, 50, 100, 250, 500, and 1000 ng/mL.
The LOQ was defined as the lowest calibration level that satisfied the predefined accuracy and precision criteria, including bias within ±20% of the nominal concentration. The LOD was defined as the lowest concentration with a signal-to-noise ratio greater than 3.
Carryover was evaluated by injecting a solvent blank immediately after the highest calibration standard. Carryover was considered absent when no analyte response above the established LOD was detected in the blank injection.
2.5.2. Bias and Precision
Quality control (QC) samples were prepared independently at three concentration levels (low, medium, and high) and analyzed in triplicate across three separate analytical runs.
Bias was calculated as:
Precision was determined for each concentration level and expressed as standard deviation (SD).
2.5.3. Recovery Study
Extraction recovery of the QuEChERS method was evaluated using Haribo® gummy bears purchased from a local retail store as a cannabinoid-free matrix. One gram of homogenized gummy sample was fortified with the 24-cannabinoid mixed standard solution at three concentration levels (n = 3): low (0.04 μg g⁻¹), medium (0.4 μg g⁻¹), and high (4 μg g⁻¹). Fortified samples were extracted according to the procedure described in Section 2.3.3.
Recovery was calculated as:
3. Results and Discussion
3.1. Uhplc-Ms/ms Method Optimization and Chromatographic Separation
To optimize the multiple reaction monitoring (MRM) transitions, individual cannabinoid standards at 1 μg/mL were injected into the UPLC-MS/MS system. For each compound, the precursor ion was fragmented using a series of collision energies, including 10, 15, 20, 25, 30, and 35 eV, to generate product ions. The most abundant product ion, together with its corresponding collision energy, was selected as the quantifier transition. The second most abundant product ion was selected as the qualifier transition for confirmation.
Positive ionization mode was tested for all neutral cannabinoids. For acidic cannabinoids, both positive and negative ionization modes were evaluated. The results showed that positive ionization mode provided better responses for the acidic cannabinoids. Therefore, positive ionization mode was selected for all 24 cannabinoids in the final method.
The optimized MRM transitions, retention times, cone voltages, and collision energies are listed in Table 1.
A major analytical challenge in cannabinoid profiling is the presence of numerous structural and positional isomers that possess identical molecular weights and highly similar fragmentation patterns. Among the 24 cannabinoids investigated, four prominent isomeric groups were included: (i) CBD, Δ⁹-THC, Δ⁸-THC, CBC, and CBL; (ii) CBDV, Δ⁹-THCV, Δ⁸-THCV, and CBCV; (iii) CBDA, Δ⁹-THCAA, Δ⁸-THCAA, CBCA, and CBLA; and (iv) CBDVA, Δ⁹-THCVA, Δ⁸-THCVA, and CBCVA. Several compounds within each group shared identical precursor and product ions. For example, CBD, Δ⁹-THC, and Δ⁸-THC all utilized the same quantifier (m/z 315.2→193.1) and qualifier (m/z 315.2→123.1) transitions, while CBDV, Δ⁹-THCV, Δ⁸-THCV, and CBCV shared identical transitions of m/z 287.2→165.2 and 287.2→123.2. Consequently, chromatographic resolution rather than MS/MS selectivity was the primary mechanism enabling their reliable identification and quantification.
Particularly, Δ⁹-THC and Δ⁸-THC together with their acidic and varin analogues represent some of the most challenging cannabinoid isomer pairs because they differ only in the position of a carbon-carbon double bond. Despite producing nearly identical MS/MS fragmentation patterns, the developed method successfully resolved Δ⁹-THC (6.49 min) and Δ⁸-THC (6.78 min), Δ⁹-THCV (3.72 min) and Δ⁸-THCV (3.87 min), Δ⁹-THCAA (8.72 min) and Δ⁸-THCAA (9.45 min), and Δ⁹-THCVA (4.80 min) and Δ⁸-THCVA (5.16 min). Similarly, CBD was clearly separated from Δ⁹-THC and Δ⁸-THC despite sharing identical MRM transitions. Effective separation was also achieved for the acidic cannabinoid isomers, including CBDA, Δ⁹-THCAA, Δ⁸-THCAA, CBCA, and CBLA, as well as CBDVA, Δ⁹-THCVA, Δ⁸-THCVA, and CBCVA. These results demonstrate that chromatographic retention provided an additional and essential level of selectivity beyond tandem mass spectrometry.
Figure 2 shows the chromatographic separation of 24 cannabinoid standards using the developed UHPLC-MS/MS method. Most analytes exhibited sharp, symmetrical peaks with excellent retention-time reproducibility and minimal peak overlap, demonstrating good chromatographic selectivity across the analytical run. The method enabled simultaneous determination of 24 cannabinoids, including neutral cannabinoids, acidic cannabinoids, and their corresponding varin analogues, within a single analysis. The separation of neutral cannabinoids is illustrated in Figure 2B, whereas acidic cannabinoids are shown in Figure 2C.
Compared with previously reported multicannabinoid methods, the present method offers substantially broader analyte coverage while maintaining effective isomer separation in a short run (within 12 mins). Song et al. subsequently developed LC-DAD methods for the analysis of up to 16 cannabinoids, respectively, emphasizing the importance of chromatographic resolution for potency testing and achieving baseline separation for numerous analytes 3. More recently, Owolabi et al. systematically evaluated chromatographic conditions for the separation of 18 cannabinoids and concluded that cannabinoid isomers represent the most significant chromatographic challenge in potency analysis 19. Notably, Song et al. established one of the broadest panels to date, reporting an LC-DAD method with optional electrospray ionization time-of-flight mass spectrometry for the determination of up to 20 cannabinoids 4. Although their approach demonstrated the utility of high-resolution chromatography for multi-cannabinoid profiling, optical DAD detection remains susceptible to spectral overlap and attenuated sensitivity when quantifying trace minor cannabinoids in dark or complex matrices such as infused gummies and crude hemp oils.
In comparison, the current UPLC-MS/MS method expands analyte coverage to 24 cannabinoids while simultaneously resolving four major families of structurally related isomers, including neutral, acidic, and varin cannabinoids. The successful separation of Δ⁹/Δ⁸ cannabinoid pairs and their derivatives is particularly important because these compounds often exhibit identical MRM transitions and may have different regulatory and commercial significance. Therefore, the developed method provides a comprehensive and highly selective platform for cannabinoid potency testing and profiling of commercial cannabis-derived products.
3.2. Method Validation
Calibration curves were generated by combining data from triplicate calibration standards for each analyte. A linear regression model was applied with a 1/x weighting factor. The validation results for linearity, sensitivity, accuracy, and precision are summarized in Table 2.
The developed UHPLC-MS/MS method demonstrated good linearity across the evaluated calibration range, with analyte-specific lower limits ranging from 0.05 to 0.1 ng/mL and an upper limit of 1000 ng/mL. The broad calibration range supports the applicability of this method for cannabinoid products with highly variable compositions, including products containing abundant major cannabinoids such as CBD and THC and low concentrations of minor cannabinoids.
Most cannabinoids showed coefficient of determination values, R², above 0.99, indicating acceptable linear responses over the tested concentration range. Although CBGV and CBGVA showed relatively lower R² values compared with the other analytes, their calibration performance remained acceptable for quantitative analysis.
The method also showed high sensitivity for the 24 cannabinoids. The LOQs ranged from 0.05 to 0.1 ng/mL. Most analytes had an LOQ of 0.05 ng/mL, while Δ9-THCAA, Δ8-THCAA, and CBCA had LOQs of 0.1 ng/mL. The LODs ranged from 0.005 to 0.05 ng/mL, with the lowest LODs observed for Δ9-THCV, Δ8-THCV, CBG, and CBGV. These results indicate that the method is sufficiently sensitive for trace-level detection and quantification of cannabinoids.
Accuracy and precision were assessed at three QC levels: 4, 400, and 800 ng/mL. Across all analytes, measured concentrations ranged from 3.6 to 4.1, 322.9 to 382.0, and 708.6 to 881.0 ng/mL at the low, medium, and high QC levels, respectively. Bias ranged from -19.3% to 10.1%, meeting the predefined acceptance criterion of ±20%.
The recovery performance of the method was evaluated in gummy samples at three fortification levels: 0.04, 0.4, and 4 μg/g. As shown in Figure 3, most cannabinoids exhibited recoveries within 80-110% across the tested concentration range, indicating satisfactory extraction efficiency and method accuracy in the gummy matrix. Major cannabinoids, including CBD, Δ9-THC, CBC, CBN, and CBG, generally showed consistent recoveries with relatively small standard deviations. Slightly lower recoveries were observed for some minor cannabinoids, particularly at the low fortification level, likely reflecting the greater difficulty of trace-level quantification in complex gummy matrices.
Overrall, the validation results confirmed that the UPLC-MS/MS method provided suitable linearity, sensitivity, accuracy, and precision for comprehensive cannabinoid quantification. The consistent recovery profiles across the three fortification levels indicate that the method is robust for both high-abundance cannabinoids, such as CBD and THC, and lower-abundance minor cannabinoids in complex gummy matrices. The method was therefore considered appropriate for the quantitative analysis of neutral cannabinoids, acidic cannabinoids, and varin-type cannabinoids in cannabis-derived samples.
3.3. Potency Test of Commercial Hemp Oil Samples.
Figure 4 shows the overlay TIC profiles of the solvent blank, gummy control, gummy sample, and oil sample. The solvent blank exhibited minimal background signal, indicating no obvious contamination or carryover during analysis. The gummy control showed limited matrix-related responses, with no major interfering peaks observed in the retention regions of the target cannabinoids. The gummy and oil samples displayed distinct chromatographic peaks corresponding to cannabinoid signals, confirming the applicability of the developed UHPLC-MS/MS method to complex commercial matrices.
The developed method was further applied to analyze 14 commercial hemp oil samples, and the quantitative results are summarized in Table S1. The cannabinoid profiles varied substantially among the oil samples, with concentrations spanning from ng/mL to mg/mL levels. CBD was the predominant cannabinoid in most samples, ranging from 0.012 mg/mL in Oil 6 to 45.54 mg/mL in Oil 13, indicating large differences in product potency. Δ9-THC concentrations also varied widely, from 0.1 to 918.4 μg/mL, with the highest levels observed in Oils 3, 9, and 13. Other neutral cannabinoids, including CBC, CBN, CBG, CBDV, and CBL, were detected at variable concentrations across the samples, whereas acidic and varin-type cannabinoids were generally present at lower μg/mL or ng/mL levels. Several analytes, including Δ8-THCV, Δ8-THCAA, Δ9-THCVA, Δ8-THCVA, CBCVA, CBNA, and CBGA, were not detected in selected samples, further demonstrating the heterogeneity of commercial hemp oil compositions.
Due to the wide concentration range of cannabinoids in hemp oil samples, a log-transformed heatmap was generated to visualize differences in cannabinoid abundance across samples (Figure 5). The heatmap clearly showed substantial compositional variability among the 14 oils. CBD was consistently the most abundant cannabinoid, while secondary cannabinoids such as CBDV, CBC, CBG, and CBN were enriched in selected samples, particularly Oils 3, 9, 13, and 14. In contrast, Oil 6 generally showed lower cannabinoid abundance than the other samples. Minor cannabinoids, including Δ9-THCV, Δ8-THCV, Δ9-THCVA, and Δ8-THCVA, were detected at much lower levels and showed greater sample-to-sample variability. Several acidic cannabinoids, such as Δ9-THCAA, Δ8-THCAA, CBCA, and CBNA, were present at low levels or were not detected in some oils.
Overall, these results demonstrate considerable variability in cannabinoid composition among commercial hemp oil products. The broad concentration range observed for both major and minor cannabinoids highlights the importance of using a sensitive and wide-range analytical method. The developed UHPLC-MS/MS method was suitable for comprehensive profiling of hemp oil products, enabling simultaneous quantification of abundant cannabinoids such as CBD and THC as well as trace-level minor cannabinoids.
3.4. Potency Test of Commercial Hemp- and Cannabis-Infused Gummy Samples
The developed UHPLC-MS/MS method was applied to 18 commercial hemp- and cannabis-infused gummy samples to evaluate its applicability to edible matrices. The quantitative results showed substantial variation in cannabinoid composition among the gummy products, with concentrations spanning from ng/g to mg/g levels. CBD and Δ9-THC were the dominant cannabinoids in most samples, but their relative abundance differed markedly across products. CBD concentrations ranged from 2.6 μg/g in Gummy 1 to 9267 μg/g in Gummy 17, whereas Δ9-THC ranged from 0.37 μg/g in Gummy 13 to 5042 μg/g in Gummy 7. These results indicate large differences in product formulation and cannabinoid potency among commercial gummy samples.
Several samples, particularly Gummies 1-10, contained high levels of Δ9-THC, with concentrations generally in the mg/g range. In contrast, Gummies 11-18 showed higher CBD abundance, especially Gummies 11, 12, 14, 15, and 17, suggesting that these samples were likely CBD-dominant or hemp-derived products. Δ8-THC was detected only at trace levels in selected samples, with most gummies showing non-detectable levels, indicating that Δ8-THC was not a major cannabinoid in these products. Other neutral cannabinoids, including CBC, CBL, CBCV, CBDV, CBN, and CBG, were detected at variable concentrations. Notably, Gummy 7 and Gummy 9 contained elevated levels of CBC, CBL, and CBG, while Gummy 11 showed relatively high levels of CBL, CBCV, CBDV, and CBD, suggesting distinct cannabinoid profiles among the tested products.
Acidic cannabinoids and varin-type acidic cannabinoids were generally present at much lower concentrations, mostly in the ng/g range, and were frequently not detected in several samples. CBDA, Δ9-THCAA, CBCA, CBLA, Δ9-THCVA, Δ8-THCVA, CBDVA, CBCVA, CBNA, CBGA, CBGV, and CBGVA showed sample-dependent occurrence, reflecting differences in raw materials, decarboxylation extent, and manufacturing processes. The low abundance of acidic cannabinoids suggests that most gummy products contained predominantly decarboxylated cannabinoids, which is consistent with the use of processed cannabis or hemp extracts in edible formulations.
To better visualize the broad concentration range and compositional differences among the gummy samples, cannabinoid concentrations were converted to ng/g and displayed using a log-transformed heatmap. As shown in Figure 6, the heatmap clearly separated samples with high Δ9-THC abundance from those with high CBD abundance. Gummies 1-10 exhibited strong Δ9-THC signals, whereas Gummies 11-18 showed comparatively higher CBD signals and lower Δ9-THC levels. The heatmap also highlighted sample-specific enrichment of minor cannabinoids, including CBC, CBL, CBG, CBDV, and CBCV, while acidic and varin-type cannabinoids appeared at relatively low abundance across most samples. Overall, these results demonstrate the substantial heterogeneity of cannabinoid profiles in commercial gummy products and confirm that the developed UHPLC-MS/MS method is suitable for comprehensive quantification of both major and trace cannabinoids in complex edible matrices.
3.5. Label Accuracy Assessment
Figure 7 compares the labeled and experimentally measured cannabinoid potencies in commercial oil (n = 14) and gummy (n = 18) products. Considerable variability was observed among both product types, with many samples deviating beyond the ±10% acceptance range indicated by the dashed lines. CBD exhibited the greatest variability, with several gummy products substantially exceeding their label claims, including one sample showing approximately 165% higher potency than declared, whereas some oil products contained considerably lower CBD levels than stated on the label. THC concentrations generally showed better agreement with label claims, although both over- and under-labeled products were observed. Minor cannabinoids, including CBN, CBG, CBC, THCV, and THCVA, displayed larger proportional deviations, particularly at low labeled concentrations, where analytical and formulation variability may have a greater impact. Overall, gummy products tended to exhibit broader variability than oil products, with a greater number of samples falling outside the ±10% range. These findings highlight inconsistencies between labeled and measured cannabinoid content in commercial products and underscore the importance of routine potency verification to ensure product quality and accurate consumer information.
These findings are consistent with previous studies showing frequent discrepancies between labeled and measured cannabinoid contents in commercial cannabis and hemp-derived products. For example, Geweda et al. evaluated 107 dispensary cannabis flower samples and found that only 30% of samples were within ± 20% of labeled Δ9-THC content, while 70% failed to meet the ±20% acceptance criterion 20. Similarly, Spindle et al. reported that among 89 hemp-derived topical products with labeled CBD amounts, only 24% were accurately labeled within ±10%, while 18% contained less CBD than advertised and 58% contained more CBD than advertised 21. Gidal et al. also reported that 74% of 202 commercial CBD products deviated from their CBD potency label claim by at least 10%, further demonstrating widespread labeling inaccuracy among CBD products 22.
Other studies have reported similar labeling issues across different product categories. Melchert et al. found that among 27 products explicitly listing CBD content, only 33% matched the labeled value, whereas 26% exceeded the declared CBD content and 41% contained lower amounts 23. Dowd et al. analyzed hemp-derived haircare, cosmetic, and edible products and reported that only 12.7% of 71 products with labeled CBD amounts were accurately labeled within ±10%, while 49% were underlabeled and 38% were overlabeled 24. In addition, studies of broader cannabis product labeling have shown that inaccurate or incomplete labeling extends beyond potency claims. For example, Becker et al. found that unlicensed cannabis products in New York provided significantly less essential label information and fewer safety features than licensed products25. Limbacher et al. also reported that labeled THC values in Colorado flower and edible products were generally higher than independently measured values, highlighting ongoing concerns regarding THC label fidelity even in licensed markets26. Most recently, a comprehensive matrix-specific review evaluating literature from 2017 to 2025 further underscored these systemic discrepancies, finding that only 31.3% of analyzed CBD products met the standard ±10% label-accuracy threshold and emphasizing that widespread methodological heterogeneity across literature continues to limit direct comparisons among label-accuracy studies 27.
Compared with these previous studies, the present study expands the scope of label-accuracy assessment by quantifying 24 canabinoids rather than focusing primarily on CBD or Δ9-THC. This is important because commercial cannabinoid products are often marketed using broad terms such as “full spectrum,” “broad spectrum,” or “minor cannabinoid enriched,” yet labeling verification is commonly limited to major cannabinoids. The present UPLC-MS/MS method evaluates not only CBD and THC, but also neutral cannabinoids, acidic cannabinoids, and varin-type cannabinoids, including CBC, CBG, CBN, CBDV, THCV, THCVA, CBDA, THCAA, CBCA, CBGA, CBGV, and related analogues. This broader cannabinoid coverage provides a more complete assessment of product composition and improves the ability to evaluate formulation consistency, label accuracy, and cannabinoid-spectrum claims.
Overall, the potency-testing results demonstrate that commercial gummy and oil products can differ substantially from their labeled cannabinoid contents, especially for CBD and several minor cannabinoids. While previous studies have clearly documented mislabeling of CBD- and THC-containing products, the present study provides a more comprehensive full-spectrum assessment by simultaneously measuring 24 cannabinoids in both edible and oil matrices. These findings highlight the need for routine broad-spectrum cannabinoid testing to support accurate product labeling, quality control, regulatory compliance, and informed consumer use.
4. Conclusions
A UPLC-MS/MS method was developed and validated for simultaneous potency testing of 24 cannabinoids in cannabis-derived oil and gummy products. The method provided sensitive quantification, broad calibration coverage, acceptable bias and precision, and satisfactory recovery in gummy matrices. Chromatographic resolution was critical for reliable analysis because many cannabinoids were structural or positional isomers with identical or highly similar MRM transitions. Application to commercial samples revealed substantial variability in cannabinoid composition, with major cannabinoids present at μg/g to mg/g levels and many minor cannabinoids present at trace levels or absent depending on product type. Label comparison showed that several products deviated from declared cannabinoid contents, particularly for CBD and selected minor cannabinoids. Overall, the method supports comprehensive full-spectrum cannabinoid assessment and provides a useful platform for product quality control, label verification, and characterization of commercial hemp- and cannabis-derived products.
Supplementary Materials
The following supporting information can be downloaded at the website of this paper posted on Preprints.org, Cannabinoids’ content in Hemp Oil and Gummy Samples.
Acknowledgments
The authors thank the administration of Kean University for providing re-search opportunities and support through the Research Release Time (RTR) program and McNair Scholars program. Work on this project was supported by the National Science Foundation IUSE-HIS pro-gram (award ID 2247157); the National Science Foundation Major Research Instrumentation (MRI) Program (award ID 2409248), and NIH Undergraduate Research Training Initiative for Student Enhancement (U-RISE) Program (award ID: 5T34GM149448-03). Any opinions, findings, and conclusions or recommendations expressed in this material are those of the author and do not necessarily reflect the views of the National Institutes of Health and National Science Foundation. During the preparation of this manuscript, the authors used Gemini (3.1 Pro) for language editing and refinement to improve readability. Following the use of this tool, the authors reviewed, revised, and approved the content and assume full responsibility for the integrity and accuracy of the publication.
References
- Legislatures, N. C. o. S. State Medical Cannabis Laws. NCSL Policy Brief . 2023. Available online: https://www.ncsl.org/health/state-medical-cannabis-laws.
- Mead, A. The legal status of cannabis (marijuana) and cannabidiol (CBD) under U.S. law. Epilepsy Behav. 2017, 70, 288–291. [Google Scholar] [CrossRef] [PubMed]
- Song, L.; Meyer, G.; Adejumo, E.; Jovanovich, E.; LeBlanc, L.; Provis, J. Potency testing of up to sixteen cannabinoids in hemp-infused edibles using liquid chromatography diode array detector with optional confirmation of identity by electrospray ionization time-of-flight mass spectrometry. Food Chem. 2023, 417, 135819. [Google Scholar] [CrossRef] [PubMed]
- Song, L.; Valenzuela, G.; Carlson, S.; Dodson, Z.; Adisa, M. Potency testing of up to twenty cannabinoids by liquid chromatography diode array detector with optional electrospray ionization time-of-flight mass spectrometry. Anal. Chim. Acta 2022, 1207, 339827. [Google Scholar] [CrossRef] [PubMed]
- Yang, S.; Sun, M. Recent Advanced Methods for Extracting and Analyzing Cannabinoids from Cannabis-Infused Edibles and Detecting Hemp-Derived Contaminants in Food (2013-2023): A Comprehensive Review. J. Agric. Food Chem. 2024. [Google Scholar] [CrossRef] [PubMed]
- Corroon, J.; MacKay, D.; Dolphin, W. Labeling of Cannabidiol Products: A Public Health Perspective. Cannabis Cannabinoid Res. 2020, 5(4), 274–278. [Google Scholar] [CrossRef] [PubMed]
- Allaf, S.; Lim, J. S.; Buckley, N. A.; Cairns, R. The impact of cannabis legalization and decriminalization on acute poisoning: A systematic review. Addiction 2023, 118(12), 2252–2274. [Google Scholar] [CrossRef] [PubMed]
- Monte, A. A.; Shelton, S. K.; Mills, E.; Saben, J.; Hopkinson, A.; Sonn, B.; Devivo, M.; Chang, T.; Fox, J.; Brevik, C. Acute illness associated with cannabis use, by route of exposure: an observational study. Ann. Intern. Med. 2019, 170(8), 531–537. [Google Scholar] [CrossRef] [PubMed]
- Kruger, M.; van Eeden, T.; Beswa, D. Cannabis sativa Cannabinoids as Functional Ingredients in Snack Foods-Historical and Developmental Aspects. Plants 2022, 11(23). [Google Scholar] [CrossRef] [PubMed]
- Tweet, M. S.; Nemanich, A.; Wahl, M. Pediatric Edible Cannabis Exposures and Acute Toxicity: 2017-2021. Pediatrics 2023, 151(2). [Google Scholar] [CrossRef] [PubMed]
- AOAC. AOAC SMPR® 2022.001: Standard Method Performance Requirements (SMPRs®) for Quantitation of Cannabinoids in Beverages. 2022. [Google Scholar] [CrossRef]
- AOAC. AOAC SMPR® 2017.019. Standard Method Performance Requirements. [CrossRef] [PubMed]
- (SMPRs®) for Quantitation of Cannabinoids
- in Edible Chocolate; 2017. [CrossRef]
- Erin K Bradley, B. E. H., Evan S Bradley, Douglas R Roehler. Unintentional ingestion of putative delta-8 tetrahydrocannabinol by two youth requiring critical care: a case report. Cannabis Cannabinoid Res. 2023, 51(9). [CrossRef] [PubMed]
- Jenny L Wiley, J. A. M., Bruce E Blough, Ojas Namjoshi, Marcus Brackeen, Luli R Akinfiresoye, Teneille D Walker, Cassandra Prioleau, Daniel G Barrus, Thomas F Gamage. Evaluation of cannabimimetic effects of selected minor cannabinoids and Terpenoids in mice. Prog. Neuropsychopharmacol. Biol. Psychiatry 2024, 8(132). [CrossRef] [PubMed]
- Karen Lin, Y. S.; Raghu, Rhea; Suharu, Parth; Effah, Felix; Rahman, Irfan. Toxicity and health effects of delta-8, delta-9, and delta-10-tetrahydrocannabinol and unregulated cannabinoids in vaping products. Toxicol. Rep. 2026, 16. [Google Scholar] [CrossRef] [PubMed]
- Shawky, E.; Nahar, L.; Sarker, S. D.; Selim, D. A. Fit-for-purpose analytics for cannabis: identification, quantification, and standardization of cannabinoids, flavonoids and terpenes. Crit. Rev. Anal. Chem. 2026, 1–22. [Google Scholar] [CrossRef] [PubMed]
- Kgato P. Selwe, A. S. A. S., Kelechi O. Uleanya and Caroline E. H. Dessent Fragmentation and Isomerization Pathways of Natural and Synthetic Cannabinoids Studied via Higher Collisional Energy Dissociation Profiles. Molecules 2025, 30(3). [CrossRef] [PubMed]
- ANSI/ASB. Standard Practices for Method Validation in Forensic Toxicology . 2019. Available online: https://www.aafs.org/asb-standard/standard-practices-method-validation-forensic-toxicology.
- Owolabi, A.; Ogunsola, O.; Joens, E.; Kotler, M.; Song, L. A Systematic Study of Liquid Chromatography in Search of the Best Separation of Cannabinoids for Potency Testing of Hemp-Based Products. Molecules 2025, 30(4). [Google Scholar] [CrossRef] [PubMed]
- Geweda, M. M.; Majumdar, C. G.; Moore, M. N.; Elhendawy, M. A.; Radwan, M. M.; Chandra, S.; ElSohly, M. A. Evaluation of dispensaries’ cannabis flowers for accuracy of labeling of cannabinoids content. J. Cannabis Res. 2024, 6(1), 11. [Google Scholar] [CrossRef] [PubMed]
- Spindle, T. R.; Sholler, D. J.; Cone, E. J.; Murphy, T. P.; ElSohly, M.; Winecker, R. E.; Flegel, R. R.; Bonn-Miller, M. O.; Vandrey, R. Cannabinoid Content and Label Accuracy of Hemp-Derived Topical Products Available Online and at National Retail Stores. JAMA Netw. Open 2022, 5(7), e2223019. [Google Scholar] [CrossRef] [PubMed]
- Gidal, B. E.; Vandrey, R.; Wallin, C.; Callan, S.; Sutton, A.; Saurer, T. B.; Triemstra, J. L. Product labeling accuracy and contamination analysis of commercially available cannabidiol product samples. Front Pharmacol. 2024, 15, 1335441. [Google Scholar] [CrossRef] [PubMed]
- Melchert, D.; Schaare, F.; Winterhalter, P.; Beuerle, T. CBD products: Labeling accuracy of an obscure niche market. Food Control 2024, 160, 110375. [Google Scholar] [CrossRef]
- Dowd, A. N.; Zamarripa, C. A.; Sholler, D. J.; Cone, E. J.; Murphy, T. P.; ElSohly, M.; ElSohly, K.; Gul, W.; Shahzadi, I.; Mullen, L. D.; et al. Cannabinoid Content and Label Accuracy of Various Hemp-Derived Haircare, Cosmetic, and Edible Products Available at Retail Stores and Online in the United States. Cannabis Cannabinoid Res. 2025, 10(6), 719–725. [Google Scholar] [CrossRef] [PubMed]
- Becker, T. D.; Menzi, P. J.; Olfson, M.; Mosharova, P.; Levin, F. R.; Sultan, R. S. Labeling of Cannabis Products From Licensed and Unlicensed Retailers in New York. Am. J. Prev. Med. 2025, 69(5), 108000. [Google Scholar] [CrossRef] [PubMed]
- Limbacher, S. A.; Godbole, S.; Wrobel, J.; Mackie, D. I.; Goldman, S.; Brooks-Russell, A. Commercial cannabis product testing: Fidelity to labels and regulations. PLoS ONE 2026, 21(4), e0321832. [Google Scholar] [CrossRef] [PubMed]
- Karolina Szyrner, A. S.-I., Janis Vella Szijj. Label integrity of cannabidiol consumer products: A matrix-specific review of accuracy, contaminants, and regulatory gaps (2017–2025). Phytochem. Lett. 2026, 74. [CrossRef]
Figure 1.
Chemical structures of the 24 target cannabinoids, building upon the 14 AOAC-recommended targets to include expanded minor, varin-type, acidic, and degradation-related analytes.
Figure 1.
Chemical structures of the 24 target cannabinoids, building upon the 14 AOAC-recommended targets to include expanded minor, varin-type, acidic, and degradation-related analytes.

Figure 2.
UHPLC-MS/MS separation of 24 cannabinoid standards. (A) Overlay extracted ion chromatograms of all target cannabinoids. (B) Separation of neutral cannabinoids, including CBD, Δ⁹-THC, Δ⁸-THC, CBC, CBL, CBDV, Δ⁹-THCV, Δ⁸-THCV, CBCV, CBN, and CBG. (C) Separation of acidic cannabinoids, including CBDA, Δ⁹-THCAA, Δ⁸-THCAA, CBCA, CBLA, CBDVA, Δ⁹-THCVA, Δ⁸-THCVA, CBCVA, CBGA, and CBGVA. Despite the presence of multiple positional and structural isomers sharing identical MRM transitions, all analytes were chromatographically resolved, enabling reliable identification and quantification within a single analytical run.

Figure 3.
Recovery of 24 cannabinoids in gummy samples at three fortification levels: low, 0.04 μg/g; medium, 0.4 μg/g; and high, 4 μg/g. Recoveries were determined from triplicate analyses, and error bars represent standard deviations.
Figure 3.
Recovery of 24 cannabinoids in gummy samples at three fortification levels: low, 0.04 μg/g; medium, 0.4 μg/g; and high, 4 μg/g. Recoveries were determined from triplicate analyses, and error bars represent standard deviations.

Figure 4.
Overlay total ion chromatograms (TICs) of the solvent blank (A), gummy control (B), gummy sample (C), and oil sample (D) analyzed by the developed UHPLC-MS/MS method.
Figure 4.
Overlay total ion chromatograms (TICs) of the solvent blank (A), gummy control (B), gummy sample (C), and oil sample (D) analyzed by the developed UHPLC-MS/MS method.


Figure 5.
Heatmap visualization of 24 cannabinoids detected in 14 oil samples. Cannabinoid concentrations (ng mL⁻¹) are represented on a log-transformed scale, with color intensity indicating relative abundance. Warmer colors correspond to higher cannabinoid concentrations, whereas cooler colors represent lower concentrations.

Figure 6.
Heatmap visualization of 24 cannabinoids detected in 18 gummy samples. Cannabinoid concentrations (ng g⁻¹) are represented on a log-transformed scale, with color intensity indicating relative abundance. Warmer colors correspond to higher cannabinoid concentrations, whereas cooler colors represent lower concentrations.

Figure 7.
Comparison of labeled versus measured cannabinoid potency in commercial oil (n = 14) and gummy (n = 18) products. The percent difference from the label claim was calculated for each cannabinoid. Blue dots represent gummy samples, and orange dots represent oil samples. Dashed 10. deviation from the declared label claim, a commonly used criterion for potency accuracy. Samples falling outside these limits were considered to differ substantially from the labeled cannabinoid content.


Table 1.
Optimized retention times, quantifier and qualifier MRM transitions, cone voltages (CV), and collision energies (CE) for 24 cannabinoids.
Table 1.
Optimized retention times, quantifier and qualifier MRM transitions, cone voltages (CV), and collision energies (CE) for 24 cannabinoids.
| Compounds | Retention Time (min) | Mode |
Quantifier |
CV (V) CE (eV) |
Qualifier |
CV (V) CE (eV) |
| CBD | 3.35 | Positive | 315.2/193.1 | 20, 25 | 315.2/123.1 | 20, 35 |
| Δ9-THC | 6.49 | Positive | 315.2/193.1 | 20, 25 | 315.2/123.1 | 20, 35 |
| Δ8-THC | 6.78 | Positive | 315.2/193.1 | 20, 25 | 315.2/123.1 | 20, 35 |
| CBC | 8.38 | Positive | 315.2/193.2 | 20, 18 | 315.2/123.2 | 20, 35 |
| CBL | 7.88 | Positive | 315.2/235.1 | 20, 15 | 315.2/165.2 | 20, 26 |
| CBCV | 4.63 | Positive | 287.2/165.2 | 20, 20 | 287.2/123.2 | 20, 35 |
| CBDV | 2.26 | Positive | 287.2/165.2 | 20, 20 | 287.2/123.2 | 20, 35 |
| Δ9-THCV | 3.72 | Positive | 287.2/165.2 | 20, 25 | 287.2/123.2 | 20, 35 |
| Δ8-THCV | 3.87 | Positive | 287.2/165.2 | 20, 25 | 287.2/123.2 | 20, 35 |
| CBDA | 2.83 | Positive | 359.2/341.2 | 20, 20 | 359.2/219.1 | 20, 30 |
| Δ9-THCAA | 8.72 | Positive | 359.1/219.1 | 20, 35 | 359.1/341.2 | 20, 28 |
| Δ8-THCAA | 9.45 | Positive | 359.1/219.1 | 20, 35 | 359.1/341.2 | 20, 28 |
| CBCA | 10.36 | Positive | 359.2/341.2 | 20, 10 | 359.2/219.2 | 20, 25 |
| CBLA | 10.68 | Positive | 359.2/261.1 | 20, 25 | 359.2/81.2 | 21, 40 |
| Δ9-THCVA | 4.80 | Positive | 331.2/191.1 | 20, 35 | 331.2/313.1 | 20, 35 |
| Δ8-THCVA | 5.16 | Positive | 331.2/191.1 | 20, 35 | 331.2/313.1 | 20, 35 |
| CBDVA | 2.07 | Positive | 331.2/191.1 | 20, 28 | 331.2/313.1 | 20, 22 |
| CBCVA | 5.64 | Positive | 331.2/313.1 | 20, 13 | 331.2/191.1 | 20, 23 |
| CBN | 5.06 | Positive | 311.2/223.1 | 20, 23 | 311.2/208.1 | 20, 30 |
| CBNA | 6.60 | Positive | 355.1/235.1 | 20, 32 | 355.1/337.1 | 20, 15 |
| CBG | 3.11 | Positive | 317.2/193.1 | 20, 18 | 317.2/123.1 | 20, 33 |
| CBGA | 2.92 | Positive | 361.2/219.1 | 20, 25 | 361.2/237.0 | 20, 10 |
| CBGV | 2.20 | Positive | 289.2/165.2 | 20, 23 | 289.2/123.2 | 20, 33 |
| CBGVA | 2.18 | Positive | 333.2/315.1 | 20, 13 | 333.2/191.1 | 20, 25 |
Table 2.
Method validation results for 24 cannabinoids, including linearity, LOQ, LOD, and QC accuracy and precision at low, medium, and high concentration levels.
Table 2.
Method validation results for 24 cannabinoids, including linearity, LOQ, LOD, and QC accuracy and precision at low, medium, and high concentration levels.
| Compounds | R2 |
LOQ (ng/mL) |
LOD (ng/mL) |
Low (4 ng/mL) |
Medium (400 ng/mL) |
High (800 ng/mL) |
|||
| Mean ± sd | Bias% | Mean ± sd | Bias% | Mean ± sd | Bias% | ||||
| CBD | 0.9971 | 0.05 | 0.01 | 3.9±0.7 | -2.5 | 376.7±17.9 | -5.8 | 863.3±92.9 | 7.9 |
| d9THC | 0.9956 | 0.05 | 0.01 | 3.9±0.7 | -1.7 | 370.1±12.2 | -7.5 | 839.5±87.1 | 4.9 |
| d8THC | 0.9977 | 0.05 | 0.01 | 3.9±0.7 | -3.3 | 379.5±17.1 | -5.1 | 881.0±96.0 | 10.1 |
| CBC | 0.9988 | 0.05 | 0.01 | 3.8±0.7 | -4.2 | 382.0±14.3 | -4.5 | 836.4±54.8 | 4.6 |
| CBL | 0.9955 | 0.05 | 0.01 | 3.9±0.7 | -1.7 | 369.5±7.8 | -7.6 | 872.6±32.2 | 9.1 |
| CBCV | 0.9962 | 0.05 | 0.01 | 3.9±0.7 | -2.5 | 371.5±12.0 | -7.1 | 858.9±91.0 | 7.4 |
| CBDV | 0.9960 | 0.05 | 0.01 | 4.0±0.8 | -0.8 | 373.9±5.3 | -6.5 | 857.3±89.4 | 7.2 |
| d9THCV | 0.9904 | 0.05 | 0.005 | 4.0±0.7 | 0.8 | 347.1±18.9 | -13.2 | 733.6±70.6 | -8.3 |
| d8THCV | 0.9926 | 0.05 | 0.005 | 3.9±0.7 | -1.7 | 364.4±19.5 | -8.9 | 788.7±79.2 | -1.4 |
| CBDA | 0.9944 | 0.05 | 0.01 | 3.8±0.6 | -4.2 | 350.0±16.6 | -12.5 | 811.0±68.3 | 1.4 |
| d9THCAA | 0.9974 | 0.1 | 0.05 | 3.7±0.5 | -7.5 | 352.0±13.6 | -12.0 | 857.1±76.3 | 7.1 |
| d8THCAA | 0.9966 | 0.1 | 0.05 | 3.7±0.6 | -8.3 | 357.1±11.7 | -10.7 | 858.1±76.5 | 7.3 |
| CBCA | 0.9973 | 0.1 | 0.05 | 3.7±0.6 | -8.3 | 361.1±14.5 | -9.7 | 873.4±78.9 | 9.2 |
| CBLA | 0.9981 | 0.05 | 0.01 | 3.7±0.5 | -7.5 | 359.5±11.0 | -10.1 | 868.0±75.4 | 8.5 |
| d9THCVA | 0.9920 | 0.05 | 0.01 | 3.7±0.5 | -6.7 | 339.1±2.7 | -15.2 | 758.4±49.9 | -5.2 |
| d8THCVA | 0.9925 | 0.05 | 0.01 | 3.7±0.5 | -6.7 | 340.3±0.8 | -14.9 | 765.6±49.9 | -4.3 |
| CBDVA | 0.9925 | 0.05 | 0.01 | 3.8±0.5 | -5.0 | 338.3±8.2 | -15.4 | 768.1±55.4 | -4.0 |
| CBCVA | 0.9969 | 0.05 | 0.01 | 3.6±0.5 | -9.2 | 354.5±6.9 | -11.4 | 832.9±63.9 | 4.1 |
| CBN | 0.9968 | 0.05 | 0.01 | 3.9±0.7 | -3.3 | 373.0±15.6 | -6.8 | 869.1±94.1 | 8.6 |
| CBNA | 0.9927 | 0.05 | 0.01 | 3.9±0.6 | -3.3 | 353.8±7.1 | -11.5 | 774.8±58.8 | -3.1 |
| CBG | 0.9975 | 0.05 | 0.005 | 3.9±0.7 | -1.7 | 372.8±18.9 | -6.8 | 851.1±87.6 | 6.4 |
| CBGA | 0.9941 | 0.05 | 0.01 | 3.9±0.7 | -2.5 | 349.2±14.2 | -12.7 | 806.7±75.0 | 0.8 |
| CBGV | 0.9863 | 0.05 | 0.005 | 4.1±0.7 | 3.3 | 343.9±21.4 | -14.0 | 719.7±63.9 | -10.0 |
| CBGVA | 0.9829 | 0.05 | 0.01 | 4.0±0.6 | 0.1 | 322.9±3.5 | -19.3 | 708.6±4.6 | -11.5 |
Disclaimer/Publisher’s Note: The statements, opinions and data contained in all publications are solely those of the individual author(s) and contributor(s) and not of MDPI and/or the editor(s). MDPI and/or the editor(s) disclaim responsibility for any injury to people or property resulting from any ideas, methods, instructions or products referred to in the content. |
© 2026 by the authors. Licensee MDPI, Basel, Switzerland. This article is an open access article distributed under the terms and conditions of the Creative Commons Attribution (CC BY) license (http://creativecommons.org/licenses/by/4.0/).
Copyright: This open access article is published under a Creative Commons CC BY 4.0 license, which permit the free download, distribution, and reuse, provided that the author and preprint are cited in any reuse.