

Submitted:
30 September 2026
Posted:
02 October 2026
You are already at the latest version
Abstract
This study analyses groundwater quality in the Rhône–Mediterranean–Corsica (RMC) basin using 27,741 samples collected from 7,625 sampling points and 224 groundwater bodies, covering a 34-year period (1987–2021). The objective is to quantify, using statistical and machine learning methods, the respective contributions of temporal variability, spatial variability, and lithology to the hydrochemical and microbiological composition of aquifers. The results reveal a marked dichotomy between microbiological and physico-chemical parameters. Faecal contamination (E. coli, enterococci) is dominated by a strong temporal component (33–36% of variance), whereas spatial structuring by lithology remains very limited (< 11%). Conversely, major physico-chemical parameters (calcium, conductivity, sulphates, etc.) exhibit near-zero temporal variability (<7%) and a spatial structuring strongly controlled by lithology, with gains in explained variance of up to 20% through lithological grouping. Linear discriminant analysis achieves an overall classification rate of 56.2%, but with wide disparities: the crystalline basement is perfectly discriminated (76%), while alluvial formations are not discriminated at all (0%), as their chemical signature is more strongly influenced by anthropogenic pressures than by lithology. Machine learning methods, particularly k-nearest neighbours (k-NN), significantly improve performance (76.2% vs. 56.2% for LDA), confirming the existence of nonlinear structures in the data. Unsupervised validation via K-means confirms the reality of the lithological signal. From an operational standpoint, these findings justify a differentiated approach to groundwater management: a geological approach for chemical parameters, and an approach based on land use and agropastoral practices for bacteriological parameters. The proposed methodology – combining PCA, HCA, nested ANOVA, LDA and machine learning – provides a transferable analytical framework applicable to other major European river basins.
Keywords:
groundwater
; water quality
; lithology
; Rhône–Mediterranean–Corsica basin
; faecal contamination
; nitrates
; PCA
; ANOVA
; machine learning
; SISE-Eaux database
; France
1. Introduction
Worldwide, groundwater is the primary source for drinking water supply, accounting for about 50% of total withdrawals on average [1]. This share varies greatly depending on the context, frequently exceeding 90% in many countries and even approaching 100% in some developing regions [2]. In Europe, and more specifically in France, nearly two-thirds of the water distributed to populations comes from aquifers – a daily volume of 18 million cubic metres [3]. This essential resource supplies millions of households across the country, yet its quality remains fragile.
Groundwater quality results from a complex interplay between natural factors – reservoir lithology, residence time, water–rock interactions – and anthropogenic pressures: over-abstraction, agricultural pollution, industrial discharges, and population density [4,5]. Preserving groundwater is therefore a major strategic issue: any lasting contamination of aquifers jeopardises the water supply of millions of people.
The Rhône–Mediterranean–Corsica (RMC) basin, France's second-largest hydrographic district with 130,000 km² and 14 million inhabitants [6], perfectly illustrates this vulnerability. Its exceptionally heterogeneous geology – Hercynian crystalline basement, Alpine and sub-Alpine formations, Mediterranean karstic carbonate systems, and Tertiary and Quaternary sedimentary deposits – imparts a remarkable hydrogeochemical diversity to its waters. Yet this same lithological heterogeneity, which controls recharge, flow paths, and water–rock interactions [7,8], also exposes aquifers to differentiated risks.
Two major threats compromise the drinkability of RMC basin waters. The first, of faecal origin, stems from extensive livestock farming and pastoral practices, particularly in karstic and crystalline areas: bacterial indicators (E. coli, enterococci) travel through rapid, unfiltered pathways and reach aquifers directly [9,10]. The second, chemical, is nitrate pollution from livestock effluents and nitrogen fertilisers in arable plains, which massively degrades the quality of sedimentary and alluvial water bodies [11,12]. Added to these are contaminations by iron and manganese, whose mobility depends closely on aquifer redox conditions [13].
While regional or thematic studies have explored the link between lithology and water quality [14,15,16,17,18], none has yet provided a rigorous statistical quantification of temporal, spatial, and local variability across the entire RMC basin. In particular, the discriminating role of lithology with respect to faecal contamination and nitrates – across the basin's 224 water bodies – has never been assessed within a unified hierarchical framework. This gap is all the more critical given that the Water Framework Directive (WFD, 2000/60/EC) and the River Basin Management Plan (Schéma Directeur d'Aménagement et de Gestion des Eaux: SDAGE) 2022–2027 require management based on robust quantitative assessments at the water-body scale [19,20].
This paper builds on a previous study [6] that established a multivariate diagnosis of water quality in the RMC basin's water bodies, by cross-referencing bacteriological and physicochemical parameters with land-use data (CORINE Land Cover). It takes a step further by mobilising an expanded dataset of 27,741 analyses from 7,625 sampling points. Its objectives are: (i) to characterise the hierarchical spatio-temporal structure of water quality variability, (ii) to assess lithology's relevance as a regionalisation framework, and (iii) to test the potential of statistical and machine learning methods for predicting the lithological and hydrochemical affiliation of water bodies.
2. Materials and Methods
2.1. Study Area
The Rhône–Mediterranean–Corsica (RMC) basin, a vast hydrological entity covering approximately 130,000 km² – nearly 20% of metropolitan France – is structured around the Rhône River and opens onto the Mediterranean coastline (Figure 1). This hydrographic district, the second largest in France by surface area, is home to 14 million inhabitants (major cities are Lyon, Marseille, Montpellier, Grenoble), representing 22.6% of the French population, nearly half of whom reside along the coastal strips of Languedoc-Roussillon, Provence-Alpes-Côte d'Azur, and Corsica [AERMC: https://www.eaurmc.fr/ accessed on January 26, 2026].
Its topography ranges from sea level to Alpine peaks exceeding 4,000 m, providing an exceptional altitudinal gradient that underpins a wide climatic diversity: the basin experiences a marked Mediterranean regime along its southern perimeter, with hot, dry summers and autumns subject to intense Cévennes rainfall episodes, while the Alpine and sub-Alpine sectors are characterised by a colder, more humid mountain climate with significant snowfall. Mean annual precipitation reaches approximately 120 billion m³, of which 60 billion m³ are considered effective rainfall; however, recent years have been marked by severe drought episodes (notably in 2003 and 2005), leading to the drying-up of sensitive small watercourses and heightened water-use conflicts [21,22,23].
This climatic diversity is reflected in the wide range of soil types, from Mediterranean brown soils and rendzinas on carbonate formations to acidic, leached soils on crystalline basements, alongside recent, fertile alluvial soils in the Rhône and Languedoc plains. This highly heterogeneous soil cover directly influences infiltration and runoff patterns, and consequently aquifer recharge dynamics.
The basin exhibits a strong geological and hydrogeological diversity, combining ancient crystalline domains (eastern Massif Central, Corsica, the Maures and Estérel massifs), Alpine and sub-Alpine formations, karstic carbonate systems (Vercors, Prealps, Causses, Jura), and Tertiary and Quaternary sedimentary formations (Rhône corridor, Languedoc plains). This geological heterogeneity translates into a wide variety of aquifer types. Karstic aquifers, highly permeable and vulnerable, dominate in carbonate massifs and represent a significant share of the basin's groundwater resources [24]. Basement aquifers, with lower permeability, are associated with crystalline domains. Alluvial aquifers, productive and renewable, occupy the plains and valleys; for instance, the Bièvre–Liers–Valloire plain constitutes a large aquifer covering nearly 480 km², reaching depths of up to 100 m in its upstream section [25]. The Vistrenque and Costières aquifers, also extensive (over 500 km²), are conversely shallow, with average depths ranging from 4 to 20 m [26]. Finally, deep sedimentary aquifers, confined or semi-confined, develop within Tertiary and Quaternary basins. This heterogeneity directly influences recharge mechanisms, groundwater flow paths, water–rock interactions, and aquifer vulnerability to contamination, as evidenced by the 12,800 water abstraction points unevenly distributed across the basin, of which 74% of the total volume abstracted for drinking water supply originates from groundwater resources.
2.2. Data Used
2.2.1. SISE-Eaux Database
The data used in this study originate primarily from the French national SISE-Eaux database [27], which is fed by the Regional Health Agencies (Agences Régionales de Santé, ARS) as part of the sanitary monitoring of water intended for human consumption. The dataset comprises 27,741 raw water samples distributed across 7,625 sampling points (springs, wells, and boreholes), covering the entire RMC basin with variable density depending on the region. The analyses span a 34-year period, from 1987 to 2021.
The selected parameters include:
- Major physicochemical parameters: Ca²⁺, Mg²⁺, Na⁺, HCO₃⁻, SO₄²⁻, Cl⁻, and electrical conductivity (E.C.);
- Nutrients and trace metals: nitrates (NO₃⁻), iron (Fe), and manganese (Mn), the latter two being sensitive to aquifer redox conditions.
Only analyses with no missing data (complete matrix) were retained. The procedure for obtaining this complete matrix has been described in detail in a previous paper [6].
2.2.2. Groundwater Body Reference Framework
Based on the geographic coordinates of the sampling points, each analysis was assigned to the corresponding groundwater body (GWB), as defined under the Water Framework Directive (2000/60/EC) [19]. This reference framework, which subdivides the territory into coherent hydrogeological units, makes it possible to respect natural discontinuities between aquifers and to avoid biases inherent to continuous spatial interpolation methods (kriging, inverse distance weighting) that artificially smooth variations between distinct geological units. In total, 224 GWBs were identified within the RMC basin, referenced as FRDGXXX in accordance with the European WISE information system. In this code, FR refers to French territory, D to the RMC basin (District Rhône–Méditerranée–Corse), G to groundwater, and XXX is the unique reference number assigned to each groundwater body.
2.3. Lithological Classification
Particular attention was paid to the lithological structuring of the groundwater bodies. The geological diversity of the RMC basin was synthesised into seven major lithological groups representing the main regional geological contexts:
- Z1 – Pure crystalline basement (granites, gneisses);
- Z2 – Weathered basement, metamorphic formations, and folded domains;
- Z3 – Limestones and karstic systems;
- Z4 – Tertiary formations, molassic deposits, and varied formations;
- Z5 – Deep, uncontaminated alluvial deposits;
- Z6a – Alluvial and coastal formations of the Mediterranean shoreline;
- Z6b – Vulnerable lowland alluvial deposits.
Each GWB was characterised by the dominant lithology present within its spatial extent. This classification aims to establish relationships between the geological characteristics of aquifers and the observed hydrochemical signatures, by grouping together formations with similar geochemical behaviour. The Z1 to Z6b coding provides a synthetic nomenclature that facilitates the integration of lithological information into statistical and machine learning models, while remaining directly interpretable in hydrogeological terms.
2.4. Statistical Tools and Methodology
The analytical strategy adopted in this study is structured in several complementary steps, summarised in the flow diagram of Figure 2. This approach aims successively to: (i) reduce the dimensionality of the dataset, (ii) identify significant spatial structures, (iii) quantify the variance components at different nested scales, and (iv) assess the predictive power of hydrochemical parameters with respect to lithological context.
A Principal Component Analysis (PCA) was performed to reduce the dimensionality of the variable space and to identify the main sources of variability within the dataset [30]. The PCA was conducted using the correlation matrix, thus standardising the variables and allowing the integration of parameters of different natures and units. By diagonalising this matrix, the resulting principal components (PCs) are orthogonal to each other, enabling each factorial axis to be theoretically associated with independent processes controlling water quality. Only the factorial axes cumulating approximately 80% of the total inertia were retained for interpretation; the remaining axes, explaining a small fraction of the variance and considered as statistical noise [31], were discarded from the analysis.
The PCA was applied to water quality data from the SISE-Eaux database. Previous studies conducted on regional extractions from the Rhône–Mediterranean–Corsica (RMC) basin or neighboring areas [32,33,34] have shown that parameter distributions tend toward normality after logarithmic transformation. At the sampling point scale, the distribution is generally multimodal, with each mode corresponding to a distinct site. Consequently, the analysis was conducted after data aggregation at the groundwater body (GWB) scale, used as the reference hydrological unit. In accordance with the findings of previous studies [35], a logarithmic transformation (log10) was applied to all parameters prior to analysis.
Since GWBs are delineated in a harmonised manner at the European scale (WFD reference framework [36,37], the methodology consists of calculating, for each parameter, a representative median or mean value at the GWB scale, derived from all sampling points it contains. This value is then assigned to the entire geographic polygon of the GWB. The resulting mapping thus exclusively reflects inter-GWB spatial variability, i.e., chemical quality differences between hydrogeological units, consistent with their individual characteristics and geological context [6].
A Hierarchical Cluster Analysis (HCA) [38,39] was then applied to the contributions of the variables to the retained PCA factorial axes, weighted by their respective inertia (i.e., their contribution to the total variance of the dataset). This approach allows groundwater bodies (GWB) to be grouped into homogeneous hydrochemical classes, based on their spectral similarities in the reduced space of the principal components. The HCA produces a dendrogram whose cut is determined according to an inter-class inertia jump criterion, enabling the definition of GWB groups sharing similar chemical signatures.
A nested analysis of variance (ANOVA) was applied to quantify the different components of variability of the studied parameters [40]. The model distinguishes four nested hierarchical levels: temporal variability (between sampling dates), variability within sampling points (catchment point), variability between groundwater bodies (GWB), and finally variability between GWB groups defined either by lithology (GWB Lithology Group) or by the hydrochemical classification derived from HCA (GWB HCA-PCA Group). Results are expressed as the η² coefficient (correlation ratio), corresponding to the fraction of total variance cumulatively explained at each spatial aggregation level [41]. This hierarchical variance decomposition allows identification of the spatial and temporal scales at which the processes controlling water quality are primarily structured [42].
Finally, linear discriminant analysis (LDA) as well as various supervised and unsupervised Machine Learning methods were implemented to assess the robustness of the obtained classifications and the ability of hydrochemical parameters to predict the membership of observations to the different GWB groups [43]. LDA seeks linear combinations of predictor variables that maximise separation between predefined classes while minimising within-class variability [44,45]. It was applied using the 11 factorial axes from PCA as predictor variables and lithological group membership (Z1–Z6b) as the response variable. In addition, the k-Nearest Neighbors (k-NN) method – a non-parametric approach that makes no assumptions about the shape of class boundaries [46,47,48] – was tested with several training/validation split ratios (5%, 25%, 50%, 75%), allowing evaluation of performance sensitivity to training sample size and detection of potential nonlinear structures in the hydrochemical space. The naïve Bayesian classifier [49,50,51], based on Bayes' theorem under the assumption of conditional independence of predictors, was also applied in external validation. Finally, the K-means method [52,53] was applied as an unsupervised validation, to verify whether natural structures emerge from the data without recourse to predefined class labels. All these methods were applied to the 11 factorial axes derived from PCA, ensuring predictor orthogonality and removal of statistical noise from the original variables.
3. Results
Figure 3 shows the hierarchical classification dendrogram derived from the main factorial axes of the PCA. The cut-off line allows the identification of 7 classes of GWB.
The distributions of the different classes of GWB, that is, on the one hand the classification from the dendrogram in Figure 3, and on the other hand the dominant lithology, are presented in Figure 4. Nine GWBs lacking sufficient data were excluded from the processing and appear in white on the maps.
3.1. Structure of the Spatio-Temporal Variability
The nested analysis of variance (ANOVA) enabled the total variability of each chemical parameter to be decomposed into four hierarchical components, corresponding to the spatial and temporal levels defined in the methodology (see Section 2.4). The results, summarised in Table 1, reveal a clear hierarchical organisation, with markedly contrasting patterns depending on the nature of the parameters considered.
3.2. Contrast Between Microbiological and Physico-Chemical Parameters
Microbiological parameters (E. coli and enterococci) are characterised by a strong temporal component, accounting for 33.4% and 36.0% of the total variance, respectively – a proportion incomparable with that of physico-chemical parameters, whose temporal share is below 7%, and even drops to 0.4% for electrical conductivity. In contrast, the spatial structuring of these microbiological indicators remains very limited across all scales: the explained variance is low at the GWB scale (η² = 0.377 and 0.382), and aggregation by lithological groups provides only a marginal gain (η² = 0.107 and 0.110). These findings confirm that regional lithology exerts very little influence on the spatial distribution of microbiological contamination. This behaviour reflects the episodic and localised transmission of these microorganisms into aquifers, directly linked to surface inputs and intense recharge events.
3.3. Contribution of Lithology to Spatial Structuring
Conversely, major physico-chemical parameters exhibit nearly zero temporal variability (0.3% to 7.0%) and a spatial structuring that progressively intensifies with changing scale, attesting to the temporal stability of geochemical processes (mineral dissolution, water–rock interactions, residence time). Calcium is an emblematic case (η² = 0.971 at the sampling-point scale; η² = 0.505 at the lithological-group level), reflecting calcite dissolution in extensive carbonate and karst systems. The increase in explained variance between the GWB scale and lithological groups demonstrates that lithology constitutes a regional control structure on groundwater composition. Comparing the two classifications (Lithology Group vs. HCA-PCA Group) shows that the empirical quality-based classification systematically explains more variance, with the gap being particularly pronounced for manganese (ratio 3.9) and nitrates (ratio 3.4).
3.4. Intermediate Parameters: Iron, Manganese and Nitrates
Iron (30.8% temporal variability) and manganese (21.6%) reflect their redox sensitivity to aquifer oxygenation conditions. Nitrates exhibit a distribution co-determined by diffuse agricultural pressures and hydrogeological vulnerability: the low variance explained by lithological groups (0.102) compared to HCA-PCA groups (0.347) indicates that vulnerability to nitrogen inputs depends on fine-scale hydrodynamic parameters – porosity, permeability, connectivity with surface horizons – which lithology alone cannot capture.
3.5. Discrimination of Lithological Groups
Linear discriminant analysis (LDA) applied to the 7,625 observations achieves an overall success rate of 56.2%, but this masks considerable disparities among lithological groups (Table 2). The pure crystalline basement (Z1) shows the highest recognition rate (76.0%), owing to its highly specific hydrochemical signature (very soft, bicarbonate-rich waters, with virtually no soluble minerals). The weathered basement (Z2; 64.0%) and Tertiary molasses (Z4; 65.2%) are also well discriminated. Limestones and karsts (Z3; 50.2%) are subject to substantial confusion with Z4 (702 misclassified observations), due to the similarity of calcium-bicarbonate facies in both formations. In contrast, deep alluvium (Z5; 0%) and vulnerable lowland alluvium (Z6b; 0%) are not discriminated at all, as their chemical signatures are driven more by anthropogenic pressures and exchanges with the surrounding Tertiary formations than by lithology stricto sensu.
3.6. Validation Using Machine Learning Methods
The k-nearest neighbors (k-NN) classifier substantially outperforms LDA with sufficient training (76.2% vs. 56.2% at 75% training), confirming the presence of nonlinear structures in the hydrochemical space that linear methods cannot capture. The steady increase in classification rate with training sample size (from 58.3% to 76.2% for lithology) reflects a high within-class variability that can only be properly learned with enough examples. The naïve Bayesian classifier is suitable for water-quality classification (~65% in validation, stable regardless of training ratio) but is entirely unsuitable for lithological prediction (~11% in validation), due to the strong multicollinearity among hydrochemical parameters, which violates the conditional independence assumption. Finally, unsupervised K-means classification confirms the reality of the lithological signal within the data: the centroids of the resulting classes show a structure consistent with the lithological groups defined a priori, with the class exhibiting the most negative values on the first factorial axis systematically corresponding to the oligomineral waters of the crystalline basement.

Table 3.
Comparative performances of Machine Learning methods in external validation according to training ratio. Rates for the Naïve Bayes classifier for lithology reflect the violation of the independence assumption of correlated predictors.
Table 3.
Comparative performances of Machine Learning methods in external validation according to training ratio. Rates for the Naïve Bayes classifier for lithology reflect the violation of the independence assumption of correlated predictors.
| Method | Target | Training 5% | Training 25% | Training 50% | Training 75% | Note |
|---|---|---|---|---|---|---|
| k-NN | Water quality (7 groups) | 69.0% | 74.4% | 74.4% | 76.2% | Validation |
| k-NN | Lithology (Z1–Z6b) | 58.3% | 63.7% | 66.2% | 76.2% | Validation |
| Naïve Bayes classifier | Water quality | 65.5% | ~65% | 64.4% | ~65% | Validation |
| Naïve Bayes classifier | Lithology | ~11% | ~11% | ~11% | ~11% | Validation |
| K-means | Unsupervised | – | – | – | – | Qualitative Validation |
4. Discussion
4.1. Lithological Control on Physico-Chemical Quality
Pure crystalline basement aquifers (Z1) yield the softest and least mineralised waters in the basin (conductivity generally below 150 µS/cm, with calcium or sodium bicarbonate chemical profile). Microbiological contamination remains moderate in direct basement abstraction areas, but can reach high levels in fractured zones subject to extensive livestock farming and thin soil cover. Karst aquifers (Z3) exhibit high microbiological vulnerability: rapid conduits transmit surface water directly without effective filtration, generating E. coli and enterococci contamination peaks following intense rainfall events. Tertiary and molasse formations (Z4), the most represented group (33.7% of observations), are characterised by often elevated SO₄²⁻, Cl⁻ and NO₃⁻ concentrations, reflecting agricultural pressures in the plains of the Rhône corridor and Languedoc.
The weathered basement (Z2), a transitional domain comprising metamorphic formations and folded massifs, displays a hydrochemical signature intermediate between that of the pure crystalline basement and the surrounding sedimentary formations. This intermediate position, consistent with its moderate LDA discrimination rate (64.0%), reflects greater substrate alteration and longer residence times, promoting a gradual enrichment in major elements without reaching the mineralisation levels of carbonate or molasse formations. Coastal formations of the Mediterranean shoreline (Z6a) are distinguished by a signature marked by saline inputs, particularly chloride and sodium contents, resulting from saltwater intrusions and aeolian deposits characteristic of the coastal setting. However, their discrimination remains imperfect (25.1%), with most confusion occurring with molasse formations (Z4), with which they share a common Tertiary sedimentary origin.
The failure to discriminate deep alluvium (Z5) and vulnerable lowland alluvium (Z6b) – entirely absorbed into Z4 in the LDA – confirms that the quality of these aquifers is dictated more by exchanges with the surrounding Tertiary formations and by agricultural inputs than by lithology per se. This result has important practical implications: these abstraction points, which cannot be distinguished on chemical signature alone, require enhanced monitoring of nitrates and microbiological parameters, regardless of their geological context.
These findings converge with international observations on the role of lithology as a primary factor in groundwater physico-chemical composition [14,54,55,56,57], while providing unprecedented statistical quantification at the scale of an entire basin rather than individual sites. The observed discrimination hierarchy – crystalline basement > weathered basement ≈ molasse > karst > alluvium – reflects an increasing gradient of geochemical reactivity and hydraulic connectivity with adjacent formations. Conversely, the weak spatial structuring of faecal contamination by regional lithology, already highlighted by ANOVA (Table 1, variance share below 11% for lithological groups), confirms that this parameter responds more to local determinants – livestock density, distance to contamination sources, degree of catchment protection – than to the nature of the reservoir rock itself [56,58]. This dissociation between the drivers of chemical quality and those of microbiological quality constitutes one of the key findings of this study and, from an operational standpoint, justifies a dual framework for water-body management: a geological approach for chemical parameters, and an approach based on land use and agropastoral practices for bacteriological parameters.
4.2. Methodological Implications and Relevance for Regionalisation
The systematic comparison of methods allows several recommendations to be formulated for similar large-scale studies. LDA provides an excellent starting point due to its interpretability, but its parametric assumptions (multivariate normality, homogeneity of within-class covariance matrices) limit its performance for hydrochemically similar groups. k-NN, the best-performing method in this dataset, demonstrates the existence of nonlinear structures in the hydrochemical space of the RMC basin. Prior PCA transformation proves essential for all methods, as it removes noise and orthogonalizes predictors. Finally, the comparison between lithological classification and empirical hydrochemical classification argues for a complementary use of both approaches in monitoring strategies: lithology as a structuring geological reference framework, and hydrochemical classification as a tool for identifying aquifers most exposed to diffuse contamination or natural geochemical anomalies.
4.3. Robustness of Lithological Classification: LDA and Machine Learning
The contrast between LDA and k-NN deserves further examination. LDA implicitly assumes that the point clouds associated with each lithological group follow a multivariate Gaussian distribution with a common covariance matrix. However, groups Z3 and Z4 in particular exhibit substantial internal dispersion and likely heterogeneous covariance matrices, which explains the massive confusion observed between these two classes (Table 2). k-NN, by relaxing this assumption and directly exploiting the local structure of the point cloud in the factor space, captures nonlinear decision boundaries that LDA can only imperfectly approximate through hyperplanes. The steady improvement in its performance with increasing training sample size (from 58.3% to 76.2% for lithology) nevertheless indicates that this method remains sensitive to local observation density, warranting caution for underrepresented lithological groups in the dataset, such as Z5 (184 observations, i.e., 2.4% of the total).
Unsupervised validation via K-means provides important complementary insight: the consistency between the class centroids obtained without prior labeling and the lithological groups defined a priori demonstrates that the observed structuring is not an artifact of supervised classification, but indeed reflects a real and robust geochemical signal. Conversely, the near-total failure of the naïve Bayesian classifier for lithological prediction (~11% in validation, close to chance for seven classes) illustrates the limits of an approach relying on conditional independence of predictors in a system where major elements are strongly correlated by mineral dissolution equilibria and solution electroneutrality. This seemingly negative result has diagnostic value: it confirms that the covariance structure among hydrochemical parameters itself carries significant geological information, which methods ignoring this covariance cannot exploit.
4.4. Study Limitations and Research Perspectives
Several limitations warrant mention. First, the sampling network of the SISE-Eaux database is not a stratified random sample but results from the historical location of drinking-water supply intakes, with an overrepresentation of springs in mountain areas and wells or boreholes in lowland areas. This network heterogeneity, although partially compensated by aggregation at the GWB scale, may introduce bias in the characterisation of certain lithological groups poorly covered by the sanitary monitoring network, particularly formations in low-population-density areas (Z1, Z5).
Second, the 34-year observation period (1987–2021) is not covered uniformly: sampling density has evolved over time with the progressive strengthening of sanitary controls, which may affect the representativeness of the temporal component in the ANOVA for the early years of the series. A sub-period analysis, currently beyond the scope of this paper, would allow verification of the stability of variance components over shorter time windows and identification of possible long-term trends related to land-use changes or climatic shifts.
Third, the logarithmic transformation applied to all parameters, although justified by previous work on regional extractions from the same database [33,35,57], relies on the assumption of an approximately log-normal distribution at the GWB scale. While reasonable for major elements, this assumption is more questionable for microbiological indicators, whose distribution remains highly skewed even after transformation, due to the episodic nature of faecal contamination.
Fourth, unlike the previous study [6], which integrated CORINE Land Cover land-use data, the present study focuses solely on lithological control and does not explicitly incorporate anthropogenic pressures (livestock density, irrigated areas, sanitation). The explicit coupling of lithological classification with land-use and agropastoral-pressure variables represents a natural avenue for refining the understanding of faecal contamination mechanisms and their sensitivity to intense recharge events in a context of climate change. Finally, the proposed methodology, designed to be transferable, would benefit from application to other major European river basins with comparable geological diversity, in order to test the generality of the lithology–quality relationships highlighted in the RMC basin.
5. Conclusions
This study makes several original scientific contributions to the understanding of groundwater quality in the RMC basin.
First, it establishes lithology as a fundamental determinant of regional-scale groundwater physico-chemical quality. ANOVA demonstrates that lithological grouping explains up to 20% of additional variance for physico-chemical parameters – a quantitative validation of a relationship that had hitherto been asserted mainly on a qualitative basis in the hydrogeological literature.
Second, the pure crystalline basement (Z1) stands out with a major qualitative difference, achieving a 76% discrimination rate in LDA and displaying a hydrochemical signature that is perfectly distinct from all other geological contexts.
Third, molasse and alluvial sedimentary formations are much less clearly differentiated from one another, reflecting the strong influence of anthropogenic pressures and hydrodynamic exchanges between formations.
Fourth, microbiological variability is governed by factors other than lithology – episodic hydrological events and local pastoral practices – underscoring the need for specific approaches to bacteriological risk management, particularly in karst systems.
These findings have direct implications for groundwater body management under the River Basin Management Plan (Schéma Directeur d'Aménagement et de Gestion des Eaux, SDAGE RMC 2022–2027): definition of quality standards differentiated by lithological context, enhanced monitoring of vulnerable alluvial abstractions for nitrates and microbiological parameters, and implementation of extended protection perimeters in karst systems. Lastly, the proposed methodology – combining PCA, HCA, nested ANOVA, LDA and Machine Learning methods – provides an analytical framework that can be transferred to other major European river basins.
Author Contributions
Conceptualization, V.V., A.B. (Abdelhak Bouabdli), and M.S.; methodology, V.V., L.B. and Z.Z.; software, Z.Z.; validation, A.B. (Abderrahim Bousouis), I.M., M.E.J., A.A.B. and M.T.; formal analysis, Z.Z.; investigation, Z.Z., V.V. and L.B.; resources, L.B., M.S., A.B. (Abderrahim Bousouis), and I.M.; data curation, I.M., M.T., A.A.B. and M.E.J.; writing—original draft preparation, V.V. and Z.Z.; writing—review and editing, L.B.; visualization, Z.Z., V.V. and L.B.; supervision, V.V. and M.S.; project administration, A.B. (Abdelhak Bouabdli); funding acquisition, L.B. All authors have read and agreed to the published version of the manuscript.
Funding
This research received no external funding.
Data Availability Statement
The data presented in this study are only available on request from the Health Agency ARS of the Provence-Alpes-Côte d'Azur, Occitanie, Auvergne-Rhône-Alpes and Bourgogne-Franche-Comté regions due to sensitivity to possible malicious acts.
Acknowledgments
The authors thank the RMC Basin Agency for its administrative and technical support.
Conflicts of Interest
The authors declare no conflicts of interest.
Abbreviations
The following abbreviations are used in this manuscript:
| RMC | Rhône–Mediterranean–Corsica (basin) |
| GWB | Groundwater body |
| WFD | Water Framework Directive (2000/60/EC) |
| SDAGE | Schéma Directeur d'Aménagement et de Gestion des Eaux (River Basin Management Plan) |
| PCA | Principal Component Analysis |
| HCA | Hierarchical Cluster Analysis |
| ANOVA | Analysis of Variance |
| LDA | Linear Discriminant Analysis |
| k-NN | k-Nearest Neighbours |
| ARS | Agence Régionale de Santé (Regional Health Agency) |
References
- Katsanou, K.; Karapanagioti, H.K. Surface Water and Groundwater Sources for Drinking Water. In Applications of Advanced Oxidation Processes (AOPs) in Drinking Water Treatment; Gil, A., Galeano, L.A., Vicente, M.Á., Eds.; Springer International Publishing: Cham, 2019; pp. 1–19. ISBN 978-3-319-76882-3. [Google Scholar]
- Carrard, N.; Foster, T.; Willetts, J. Groundwater as a Source of Drinking Water in Southeast Asia and the Pacific: A Multi-Country Review of Current Reliance and Resource Concerns. Water 2019, 11. [Google Scholar] [CrossRef]
- Maréchal, J.-C.; Rouillard, J. Groundwater in France: Resources, Use and Management Issues. In Sustainable Groundwater Management: A Comparative Analysis of French and Australian Policies and Implications to Other Countries; Rinaudo, J.-D., Holley, C., Barnett, S., Montginoul, M., Eds.; Springer International Publishing: Cham, 2020; pp. 17–45. ISBN 978-3-030-32766-8. [Google Scholar]
- Khatri, N.; Tyagi, S. Influences of Natural and Anthropogenic Factors on Surface and Groundwater Quality in Rural and Urban Areas. Front. Life Sci. 2015, 8, 23–39. [Google Scholar] [CrossRef]
- Abanyie, S.K.; Apea, O.B.; Abagale, S.A.; Amuah, E.E.Y.; Sunkari, E.D. Sources and Factors Influencing Groundwater Quality and Associated Health Implications: A Review. Emerg. Contam. 2023, 9, 100207. [Google Scholar] [CrossRef]
- Zeiki, Z.; Mohsine, I.; Bousouis, A.; El Jirari, M.; Touzani, M.; Bouabdli, A.; Sadiki, M.; Valles, V.; Barbiero, L. Deciphering Groundwater Quality Mechanisms in the Rhône-Mediterranean-Corsica Basin (RMC) Through Multi-Source Data Integration. Water 2026, 18. [Google Scholar] [CrossRef]
- Appelo, C.A.J.; Postma, D. Geochemistry, Groundwater and Pollution, 2nd ed.; CRC Press: Boca Raton, 2005. [Google Scholar]
- Edmunds, W.M.; Shand, P.; Hart, P.; Ward, R.S. The Natural (Baseline) Quality of Groundwater: A UK Pilot Study. Sci. Total Environ. 2003, 310, 25–35. [Google Scholar] [CrossRef] [PubMed]
- Burch, T.; Stokdyk, J.; Durso, L.; Borchardt, M. Quantitative Microbial Risk Assessment for Ingestion of Antibiotic Resistance Genes from Private Wells Contaminated by Human and Livestock Fecal Sources. Appl. Environ. Microbiol. 2024, 90, e01629-23. [Google Scholar] [CrossRef] [PubMed]
- Delpla, I.; Jung, A.-V.; Baures, E.; Clement, M.; Thomas, O. Impacts of Climate Change on Surface Water Quality in Relation to Drinking Water Production. Environ. Int. 2009, 35, 1225–1233. [Google Scholar] [CrossRef] [PubMed]
- Rivett, M.O.; Buss, S.R.; Morgan, P.; Smith, J.W.N.; Bemment, C.D. Nitrate Attenuation in Groundwater: A Review of Biogeochemical Controlling Processes. Water Res. 2008, 42, 4215–4232. [Google Scholar] [CrossRef] [PubMed]
- European Commission Council Directive 91/676/EEC of 12 December Concerning the Protection of Waters against Pollution Caused by Nitrates from Agricultural Sources. Off. J. 1991, 375.
- Hem, J.; Survey, U.S.G. Study and Interpretation of the Chemical Characteristics of Natural Water, 3rd ed.; Reston, VA, 1985. [Google Scholar]
- Okyere, E.; Podgorski, J.; Berg, M.; Abass, G.; Preko, L.; Ganyaglo, S. Groundwater Quality and Fluoride Enrichment: Hydrochemical and Lithological Controls in a Crystalline Basement Aquifer of Northern Ghana. Water 2026, 18. [Google Scholar] [CrossRef]
- Rheaume, S.; Survey, U.S.G. Geohydrology and Water Quality of Kalamazoo County, Michigan, 1986-88; Lansing, MI, 1990. [Google Scholar]
- Kozar, M.; McCoy, K.; Weary, D.; Field, M.; Pierce, H.A.; Schill, W.; Young, J.; Survey, U.S.G. Hydrogeology and Water Quality of the Leetown Area, West Virginia; Reston, VA, 2008. [Google Scholar]
- Page, R.; LeBlanc, R.A.; Survey, U.S.G. Geology, Hydrology, and Water Quality in the Fresno Area, California; 1969. [Google Scholar]
- Gowd, S.S. Assessment of Groundwater Quality for Drinking and Irrigation Purposes: A Case Study of Peddavanka Watershed, Anantapur District, Andhra Pradesh, India. Environ. Geol. 2005, 48, 702–712. [Google Scholar] [CrossRef]
- European Commission Directive 2000/60/EC of the European Parliament and of the Council of 23 October 2000 Establishing a Framework for Community Action in the Field of Water Policy. Off. J. Eur. Communities 2000, 22, 2000.
- BRGM; Référentiel Des Masses d’eau Souterraine de France Métropolitaine BRGM RP-52118-FR. Orléans, 2003.
- Krasovskaia, I.; Gottschalk, L.; Leblois, E. Signature d’un Climat En Évolution Dans Les Régimes Hydrologiques de La Région Rhône-Méditerranée-Corse. La. Houille Blanche 2002, 88, 25–30. [Google Scholar] [CrossRef]
- Henocque, Y.; Andral, B. The French Approach to Managing Water Resources in the Mediterranean and the New European Water Framework Directive. Mar. Pollut. Bull. 2003, 47, 155–161. [Google Scholar] [CrossRef] [PubMed]
- Botrel, I.; Mercier, L.; Leger, Y.; Dugleux, E. Restaurer La Qualité de l’eau: Les Outils Fonciers. Tech. Sci. Méthodes 2009, 12, 77–84. [Google Scholar] [CrossRef]
- Mocochain, L.; Clauzon, G.; Bigot, J.-Y.; Brunet, P. Geodynamic Evolution of the Peri-Mediterranean Karst during the Messinian and the Pliocene: Evidence from the Ardèche and Rhône Valley Systems Canyons, Southern France. Sediment. Geol. 2006, 188–189, 219–233. [Google Scholar] [CrossRef]
- Bernon, N.; Chartier, R.; Herniot, P. Atlas Du Potentiel Très Basse Énergie Des Aquifères de La Région Rhône-Alpes. Rapport Final. BRGM RP-60856-FR; Orleans, 2012.
- Sassine, L.; Khaska, M.; Ressouche, S.; Simler, R.; Lancelot, J.; Verdoux, P.; Le Gal La Salle, C. Coupling Geochemical Tracers and Pesticides to Determine Recharge Origins of a Shallow Alluvial Aquifer: Case Study of the Vistrenque Hydrogeosystem (SE France). Appl. Geochem. 2015, 56, 11–22. [Google Scholar] [CrossRef]
- Chery, L.; Laurent, A.; Vincent, B.; Tracol, R. Echanges SISE-Eaux/ADES: Identification Des Protocoles Compatibles Avec Les Scénarios d’échange SANDRE; Vincennes/Orléans, 2011. [Google Scholar]
- Pachepsky, Y.A.; Shelton, D.R. Escherichia Coli and Fecal Coliforms in Freshwater and Estuarine Sediments. Crit. Rev. Environ. Sci. Technol. 2011, 41, 1067–1110. [Google Scholar] [CrossRef]
- Abbas, A.; Baek, S.; Silvera, N.; Soulileuth, B.; Pachepsky, Y.; Ribolzi, O.; Boithias, L.; Cho, K.H. In-Stream Escherichia Coli Modeling Using High-Temporal-Resolution Data with Deep Learning and Process-Based Models. Hydrol. Earth Syst. Sci. 2021, 25, 6185–6202. [Google Scholar] [CrossRef]
- Abou Zakhem, B.; Al-Charideh, A.; Kattaa, B. Using Principal Component Analysis in the Investigation of Groundwater Hydrochemistry of Upper Jezireh Basin, Syria. Hydrol. Sci. J. 2017, 62, 2266–2279. [Google Scholar] [CrossRef]
- Helena, B.; Pardo, R.; Vega, M.; Barrado, E.; Fernandez, J.M.; Fernandez, L. Temporal Evolution of Groundwater Composition in an Alluvial Aquifer (Pisuerga River, Spain) by Principal Component Analysis. Water Res. 2000, 34, 807–816. [Google Scholar] [CrossRef]
- Lazar, H.; Ayach, M.; Bousouis, A.; Huneau, F.; Mori, C.; Garel, E.; Kacimi, I.; Valles, V.; Barbiero, L. Multivariate and Spatial Study and Monitoring Strategies of Groundwater Quality for Human Consumption in Corsica. Hydrology 2024, 11. [Google Scholar] [CrossRef]
- Mohsine, I.; Kacimi, I.; Valles, V.; Leblanc, M.; El Mahrad, B.; Dassonville, F.; Kassou, N.; Bouramtane, T.; Abraham, S.; Touiouine, A.; et al. Differentiation of Multi-Parametric Groups of Groundwater Bodies through Discriminant Analysis and Machine Learning. Hydrology 2023, 10. [Google Scholar] [CrossRef]
- Ayach, M.; Lazar, H.; Lamat, C.; Bousouis, A.; Touzani, M.; El Jarjini, Y.; Kacimi, I.; Valles, V.; Barbiero, L.; Morarech, M. Groundwaters in the Auvergne-Rhône-Alpes Region, France: Grouping Homogeneous Groundwater Bodies for Optimized Monitoring and Protection. Water 2024, 16. [Google Scholar] [CrossRef]
- Jabrane, M.; Touiouine, A.; Bouabdli, A.; Chakiri, S.; Mohsine, I.; Valles, V.; Barbiero, L. Data Conditioning Modes for the Study of Groundwater Resource Quality Using a Large Physico-Chemical and Bacteriological Database, Occitanie Region, France. Water 2023, 15. [Google Scholar] [CrossRef]
- European Commission Guidance Document No. 22. Guidance on Implementing the Geographical Information System (GIS) Elements of the EU Water Policy. Tools and Services for Reporting under RBMP within WISE. Guidance on Reporting of Spatial Data for the WFD (RBMP). 2009.
- European Commission Guidance on Groundwater Status and Trend Assessment, Guidance Document #18; European Communities: Luxembourg, 2009; ISBN 978-92-79-11374-1.
- Bouguettaya, A.; Yu, Q.; Liu, X.; Zhou, X.; Song, A. Efficient Agglomerative Hierarchical Clustering. Expert Syst. Appl. 2015, 42, 2785–2797. [Google Scholar] [CrossRef]
- Madhulatha, T.S. An Overview on Clustering Methods. IOSR J. Eng. 2012, 2, 719–725. [Google Scholar] [CrossRef]
- Miles, J. R Squared, Adjusted R Squared. In Wiley StatsRef: Statistics Reference Online; 2014; ISBN 9781118445112. [Google Scholar]
- Stahle, L.; Wold, S. Analysis of Variance (ANOVA). Chemom. Intell. Lab. Syst. 1989, 6, 259–272. [Google Scholar] [CrossRef]
- Bousouis, A.; Bouabdli, A.; Ayach, M.; Lazar, H.; Ravung, L.; Valles, V.; Barbiero, L. Discrimination of Spatial and Temporal Variabilities in the Analysis of Groundwater Databases: Application to the Bourgogne-Franche-Comté Region, France. Water 2025, 17. [Google Scholar] [CrossRef]
- Huberty, C.J. Discriminant Analysis. Rev. Educ. Res. 1975, 45, 543–598. [Google Scholar] [CrossRef]
- Wilson, S.R.; Close, M.E.; Abraham, P. Applying Linear Discriminant Analysis to Predict Groundwater Redox Conditions Conducive to Denitrification. J. Hydrol. 2018, 556, 611–624. [Google Scholar] [CrossRef]
- Amiri, V.; Nakagawa, K. Using a Linear Discriminant Analysis (LDA)-Based Nomenclature System and Self-Organizing Maps (SOM) for Spatiotemporal Assessment of Groundwater Quality in a Coastal Aquifer. J. Hydrol. 2021, 603, 127082. [Google Scholar] [CrossRef]
- Ho, T.K. Nearest Neighbors in Random Subspaces. In Proceedings of the Advances in Pattern Recognition; Amin, A., Dori, D., Pudil, P., Freeman, H., Eds.; Springer: Berlin, Heidelberg, 1998; pp. 640–648. [Google Scholar]
- Day, W.H.E.; Edelsbrunner, H. Efficient Algorithms for Agglomerative Hierarchical Clustering Methods. J. Classif. 1984, 1, 7–24. [Google Scholar] [CrossRef]
- Heung, B.; Ho, H.C.; Zhang, J.; Knudby, A.; Bulmer, C.E.; Schmidt, M.G. An Overview and Comparison of Machine-Learning Techniques for Classification Purposes in Digital Soil Mapping. Geoderma 2016, 265, 62–77. [Google Scholar] [CrossRef]
- Sun, D.; Wen, H.; Wang, D.; Xu, J. A Random Forest Model of Landslide Susceptibility Mapping Based on Hyperparameter Optimization Using Bayes Algorithm. Geomorphology 2020, 362, 107201. [Google Scholar] [CrossRef]
- Arabameri, A.; Asadi Nalivan, O.; Saha, S.; Roy, J.; Pradhan, B.; Tiefenbacher, J.P.; Thi Ngo, P.T. Novel Ensemble Approaches of Machine Learning Techniques in Modeling the Gully Erosion Susceptibility. Remote Sens. 2020, 12. [Google Scholar] [CrossRef]
- Freitas, A.A. Automated Machine Learning for Studying the Trade-Off Between Predictive Accuracy and Interpretability. In Proceedings of the Machine Learning and Knowledge Extraction; Holzinger, A., Kieseberg, P., Tjoa, A.M., Weippl, E., Eds.; Springer International Publishing: Cham, 2019; pp. 48–66. [Google Scholar]
- Masoud, A.A. Groundwater Quality Assessment of the Shallow Aquifers West of the Nile Delta (Egypt) Using Multivariate Statistical and Geostatistical Techniques. J. Afr. Earth Sci. 2014, 95, 123–137. [Google Scholar] [CrossRef]
- Ha, D.H.; Nguyen, P.T.; Costache, R.; Al-Ansari, N.; Van Phong, T.; Nguyen, H.D.; Amiri, M.; Sharma, R.; Prakash, I.; Van Le, H.; et al. Quadratic Discriminant Analysis Based Ensemble Machine Learning Models for Groundwater Potential Modeling and Mapping. Water Resour. Manag. 2021, 35, 4415–4433. [Google Scholar] [CrossRef]
- Raiber, M.; White, P.A.; Daughney, C.J.; Tschritter, C.; Davidson, P.; Bainbridge, S.E. Three-Dimensional Geological Modelling and Multivariate Statistical Analysis of Water Chemistry Data to Analyse and Visualise Aquifer Structure and Groundwater Composition in the Wairau Plain, Marlborough District, New Zealand. J. Hydrol. 2012, 436–437, 13–34. [Google Scholar] [CrossRef]
- El Jirari, M.; Barry, A.A.; Bousouis, A.; Zeiki, Z.; Ayach, M.; Sadiki, M.; Bouabdli, A.; Touzani, M.; Guiraud, M.; Valles, V.; et al. Deciphering Spatial Patterns in Groundwater Quality Across Nouvelle-Aquitaine, France: A Multivariate Analysis of Two Decades of Monitoring Data. Hydrology 2026, 13. [Google Scholar] [CrossRef]
- Ayach, M.; Lazar, H.; Bousouis, A.; Touiouine, A.; Kacimi, I.; Valles, V.; Barbiero, L. Multi-Parameter Analysis of Groundwater Resources Quality in the Auvergne-RhôNe-Alpes Region (France) Using a Large Database. Resources 2023, 12. [Google Scholar] [CrossRef]
- Bousouis, A.; Bouabdli, A.; Ayach, M.; Ravung, L.; Valles, V.; Barbiero, L. The Multi-Parameter Mapping of Groundwater Quality in the Bourgogne-Franche-Comté Region (France) for Spatially Based Monitoring Management. Sustainability 2024, 16. [Google Scholar] [CrossRef]
- Kulabako, N.R.; Nalubega, M.; Thunvik, R. Study of the Impact of Land Use and Hydrogeological Settings on the Shallow Groundwater Quality in a Peri-Urban Area of Kampala, Uganda. Sci. Total Environ. 2007, 381, 180–199. [Google Scholar] [CrossRef] [PubMed]
Figure 1.
Location and main characteristics of the RMC basin.
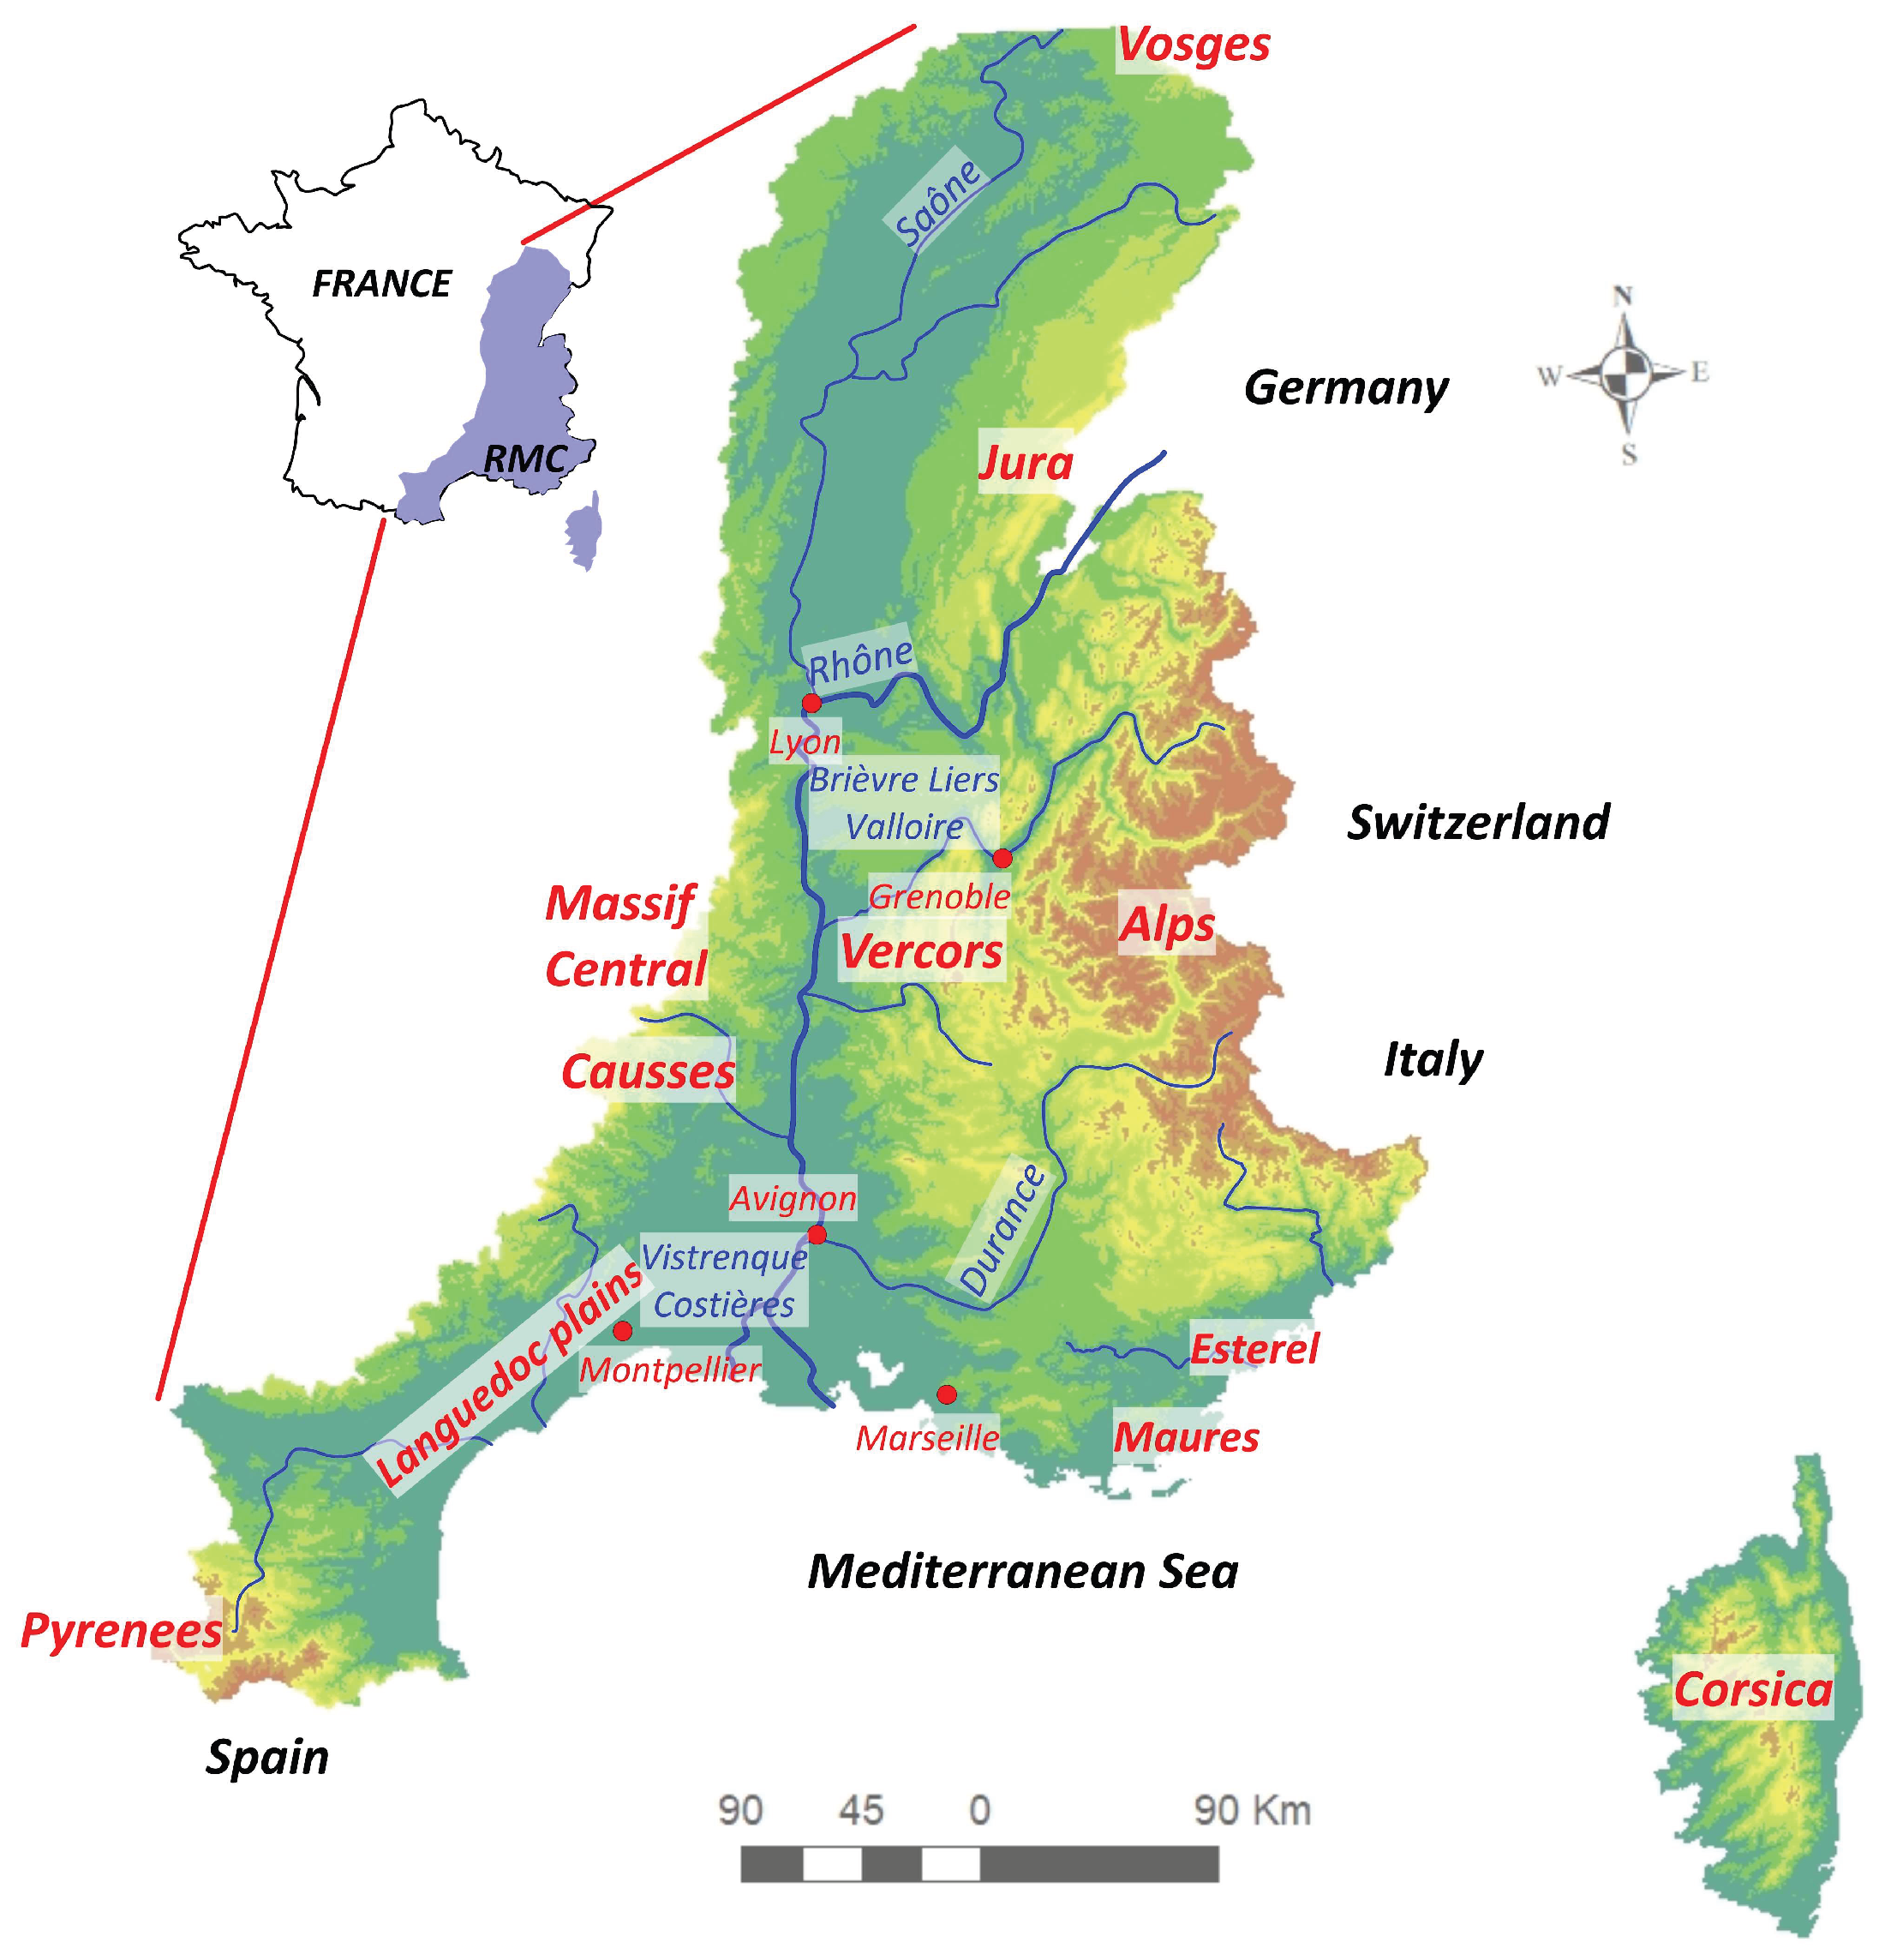
Figure 2.
Flow diagram of the methodological procedure. Two independent classifications of the groundwater bodies (GWBs) are built in parallel: a geology-based lithological classification (Z1 to Z6b) and an empirical hydrochemical classification derived from PCA and HCA on the SISE-Eaux data. They are tested through nested ANOVA and supervised/unsupervised classification methods to characterise the spatio-temporal variability of groundwater quality in the RMC basin.
Figure 2.
Flow diagram of the methodological procedure. Two independent classifications of the groundwater bodies (GWBs) are built in parallel: a geology-based lithological classification (Z1 to Z6b) and an empirical hydrochemical classification derived from PCA and HCA on the SISE-Eaux data. They are tested through nested ANOVA and supervised/unsupervised classification methods to characterise the spatio-temporal variability of groundwater quality in the RMC basin.
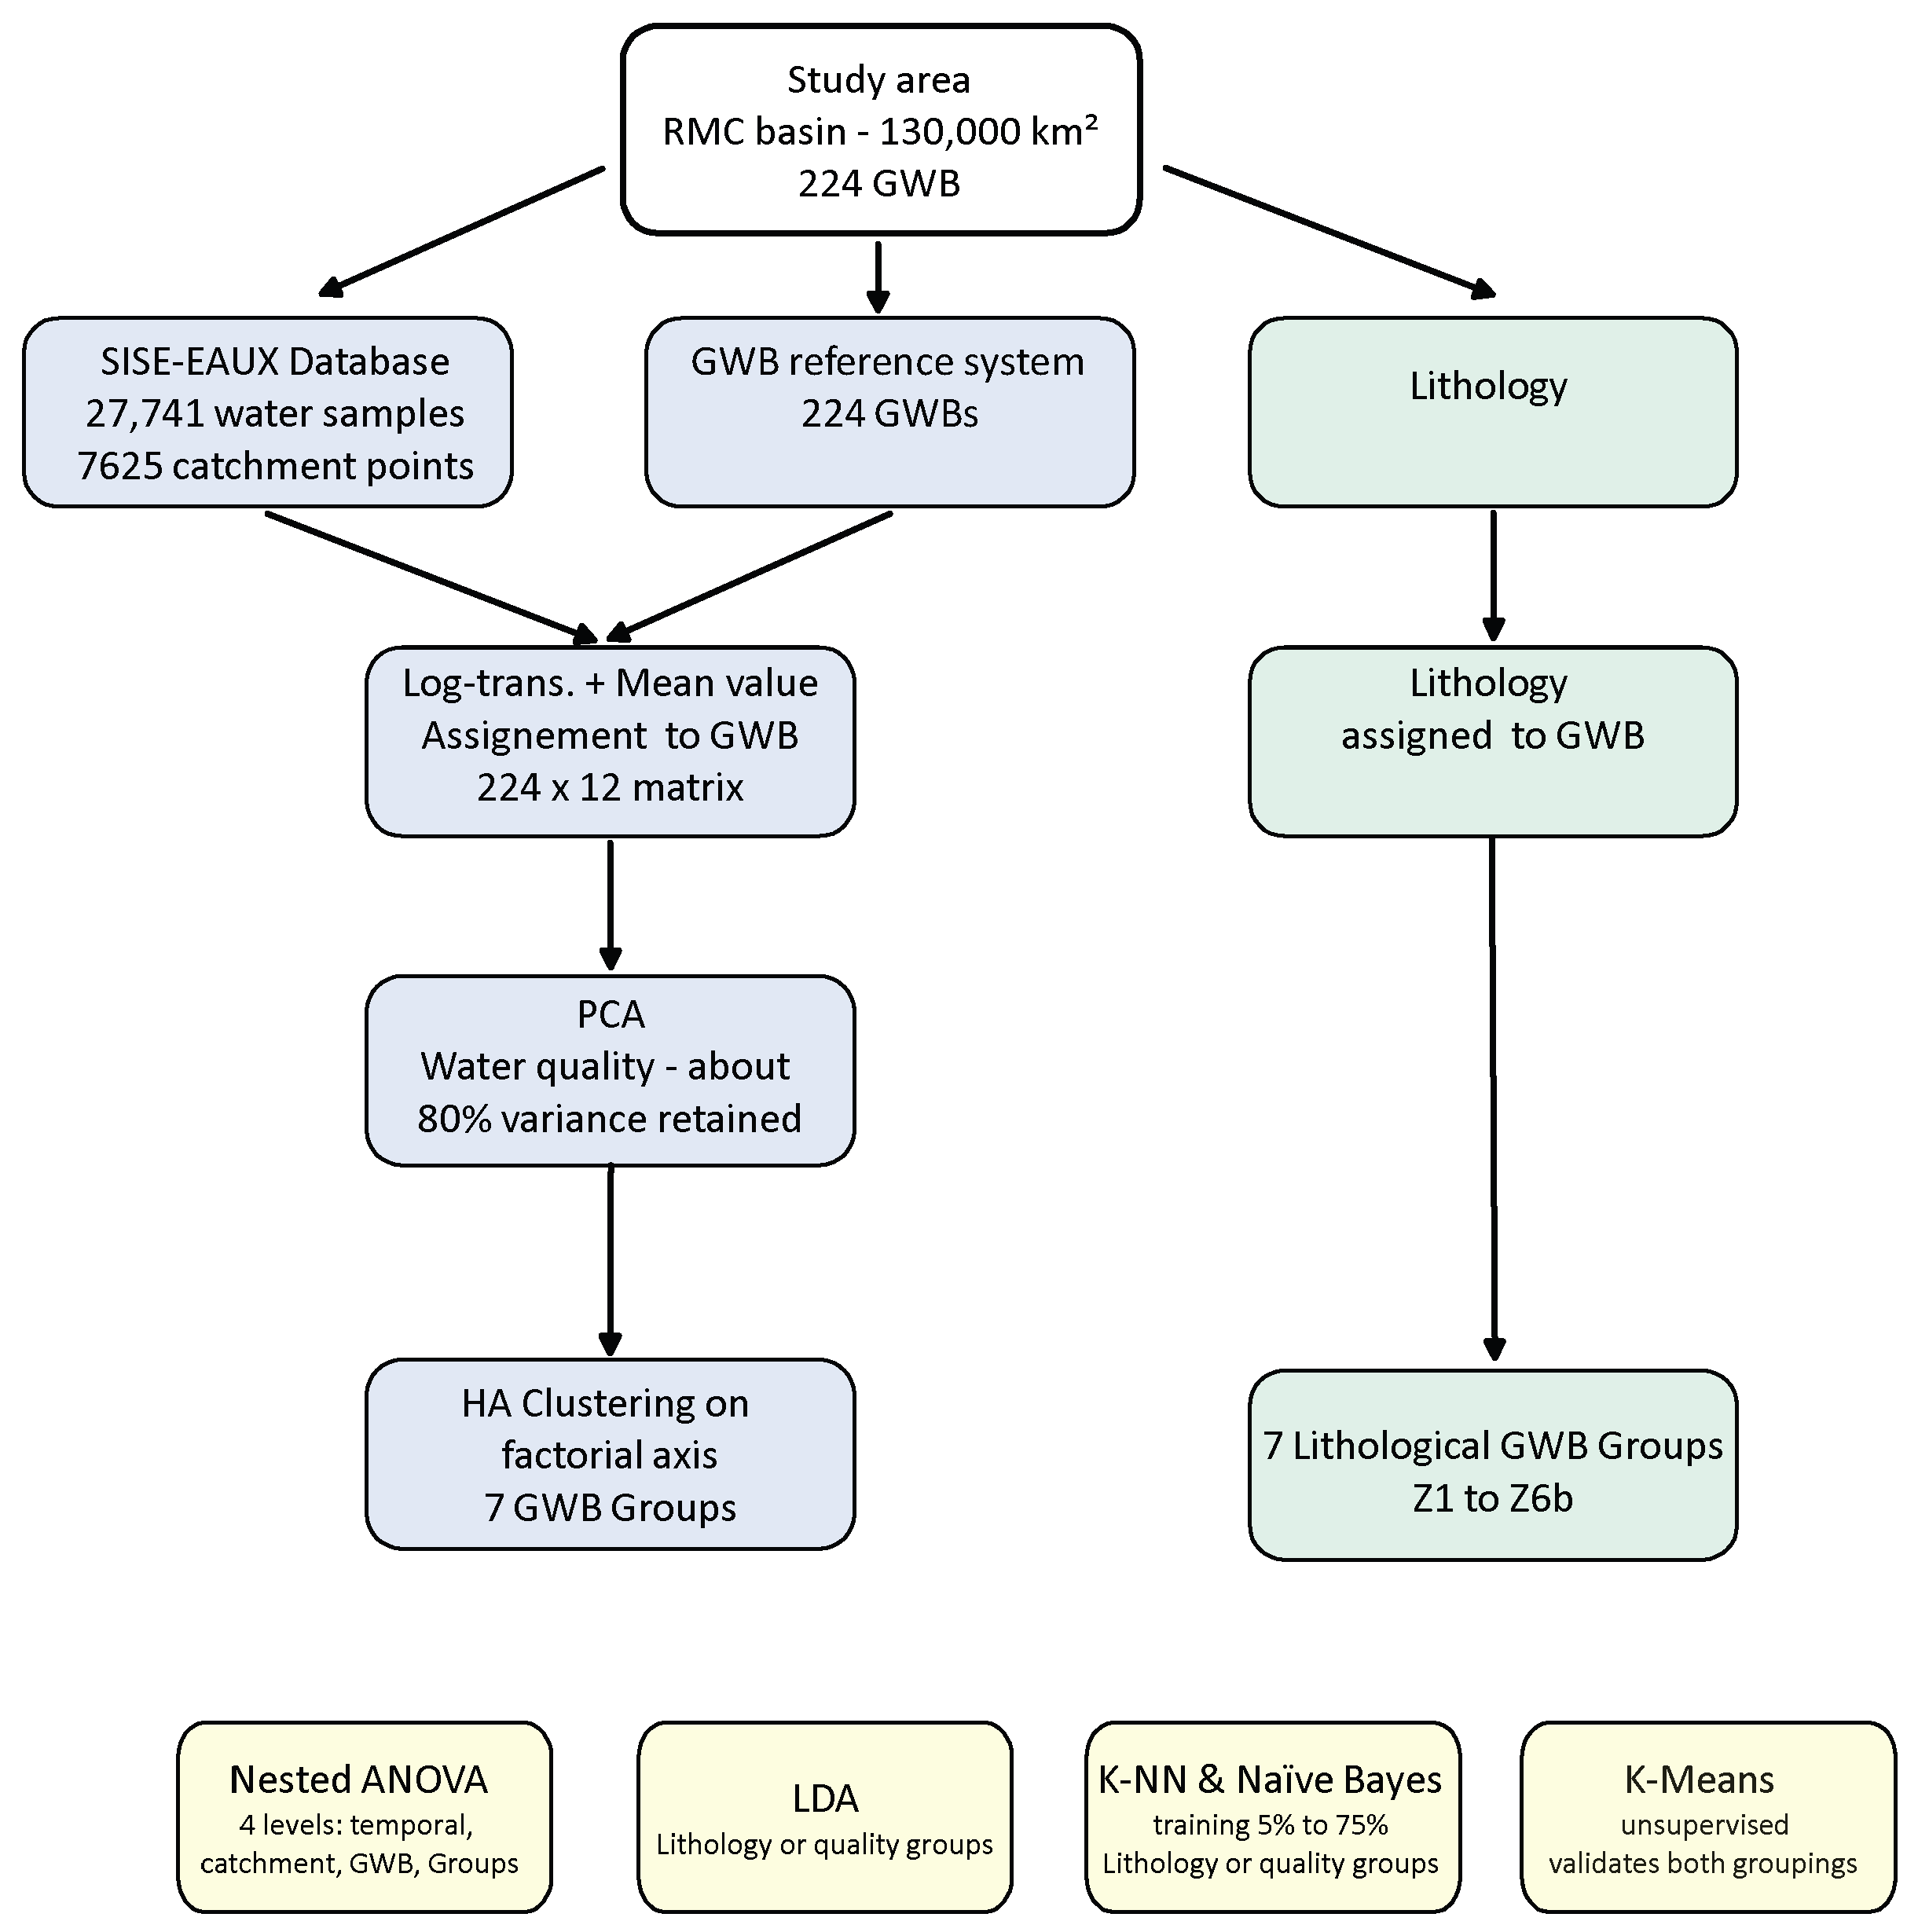
Figure 3.
Dendrogram from the PCA + HCA processing, showing the distinction of 7 classes of GWB, based on physicochemical and bacteriological compositions.
Figure 3.
Dendrogram from the PCA + HCA processing, showing the distinction of 7 classes of GWB, based on physicochemical and bacteriological compositions.
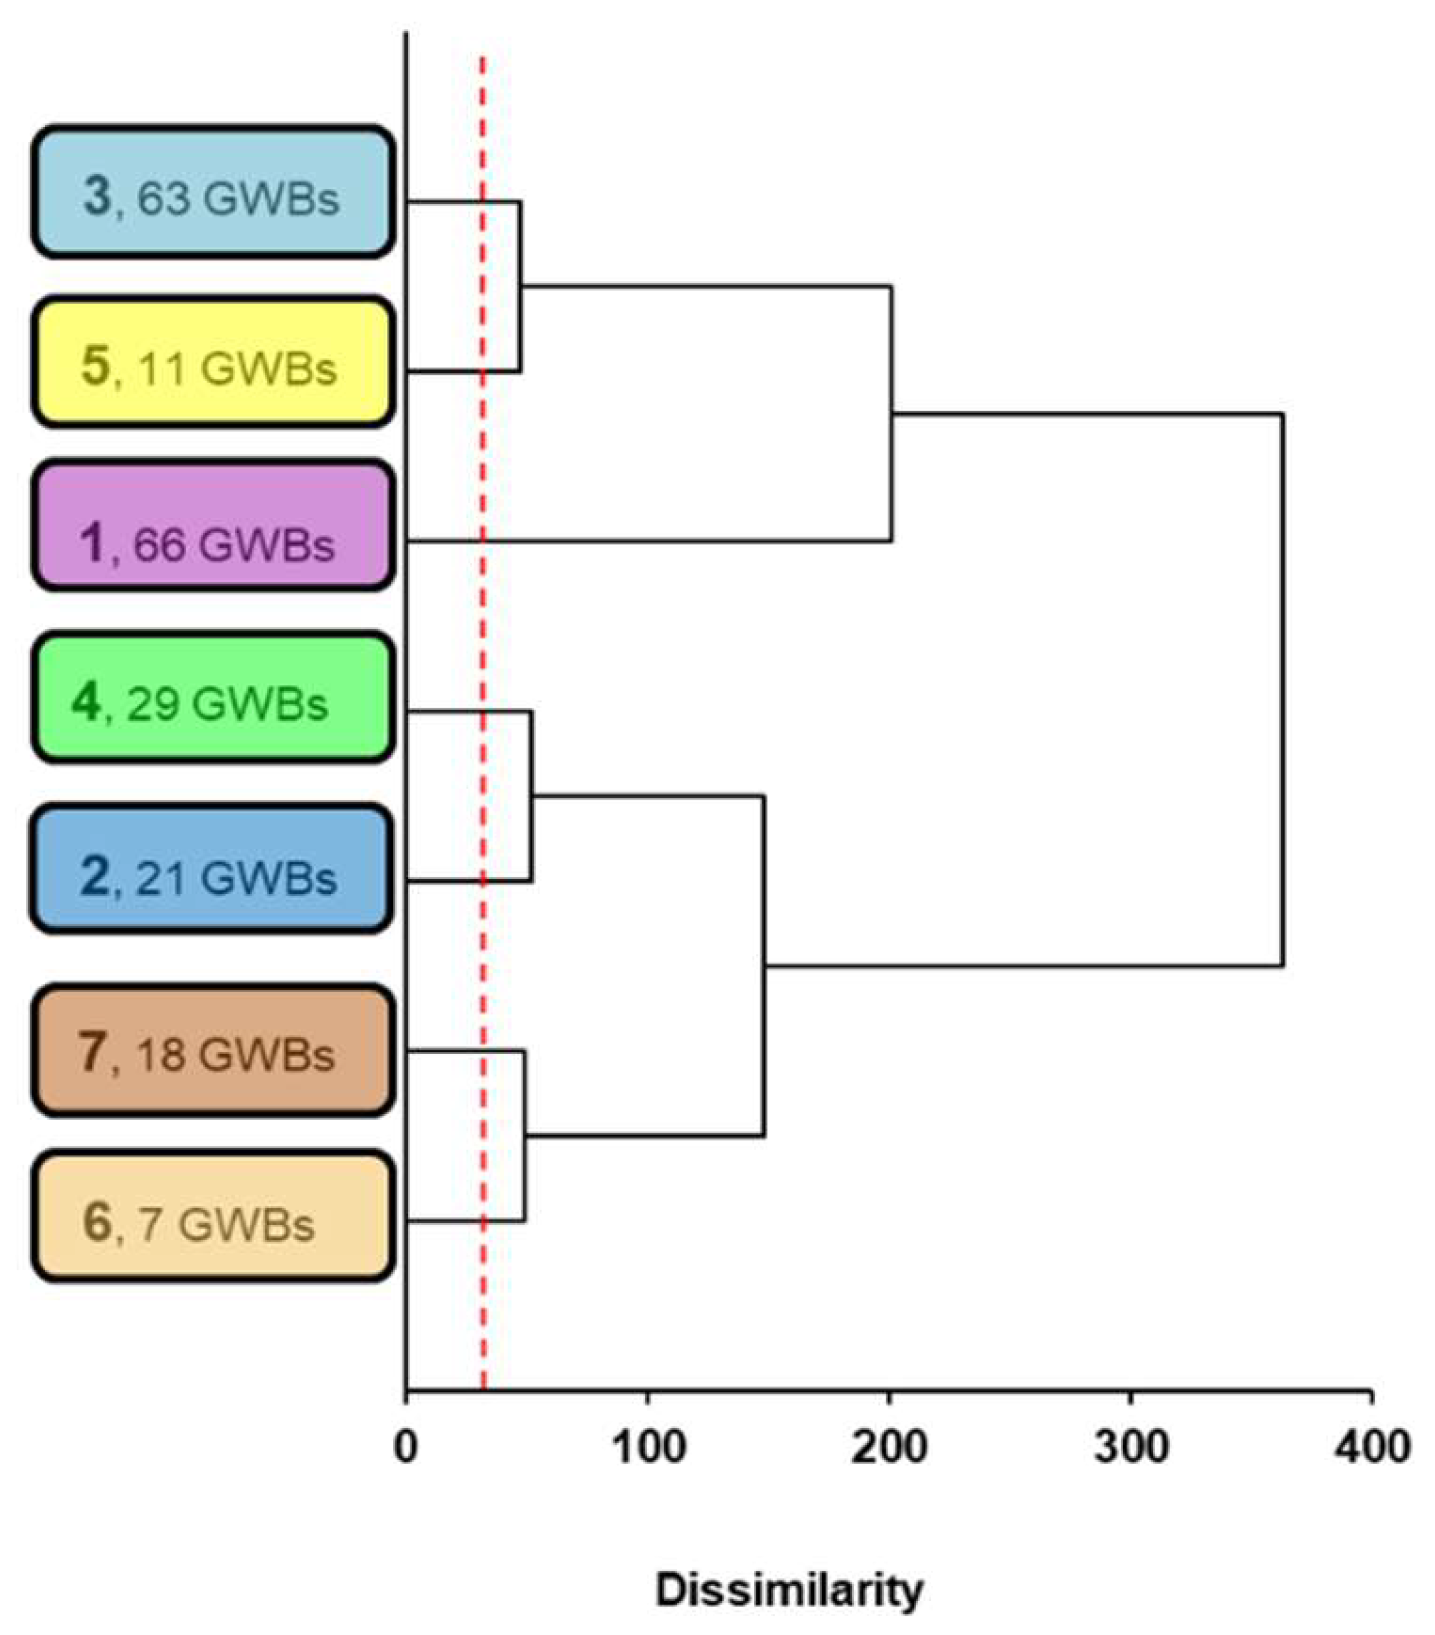
Figure 4.
Distribution of groundwater body classes based on: (a) processing of the SISE-Eaux database by PCA followed by HCA, and (b) the dominant lithology of each of the 224 GWB. The 9 GWB shown in white were excluded from the processing due to insufficient data in the SISE-Eaux database.
Figure 4.
Distribution of groundwater body classes based on: (a) processing of the SISE-Eaux database by PCA followed by HCA, and (b) the dominant lithology of each of the 224 GWB. The 9 GWB shown in white were excluded from the processing due to insufficient data in the SISE-Eaux database.
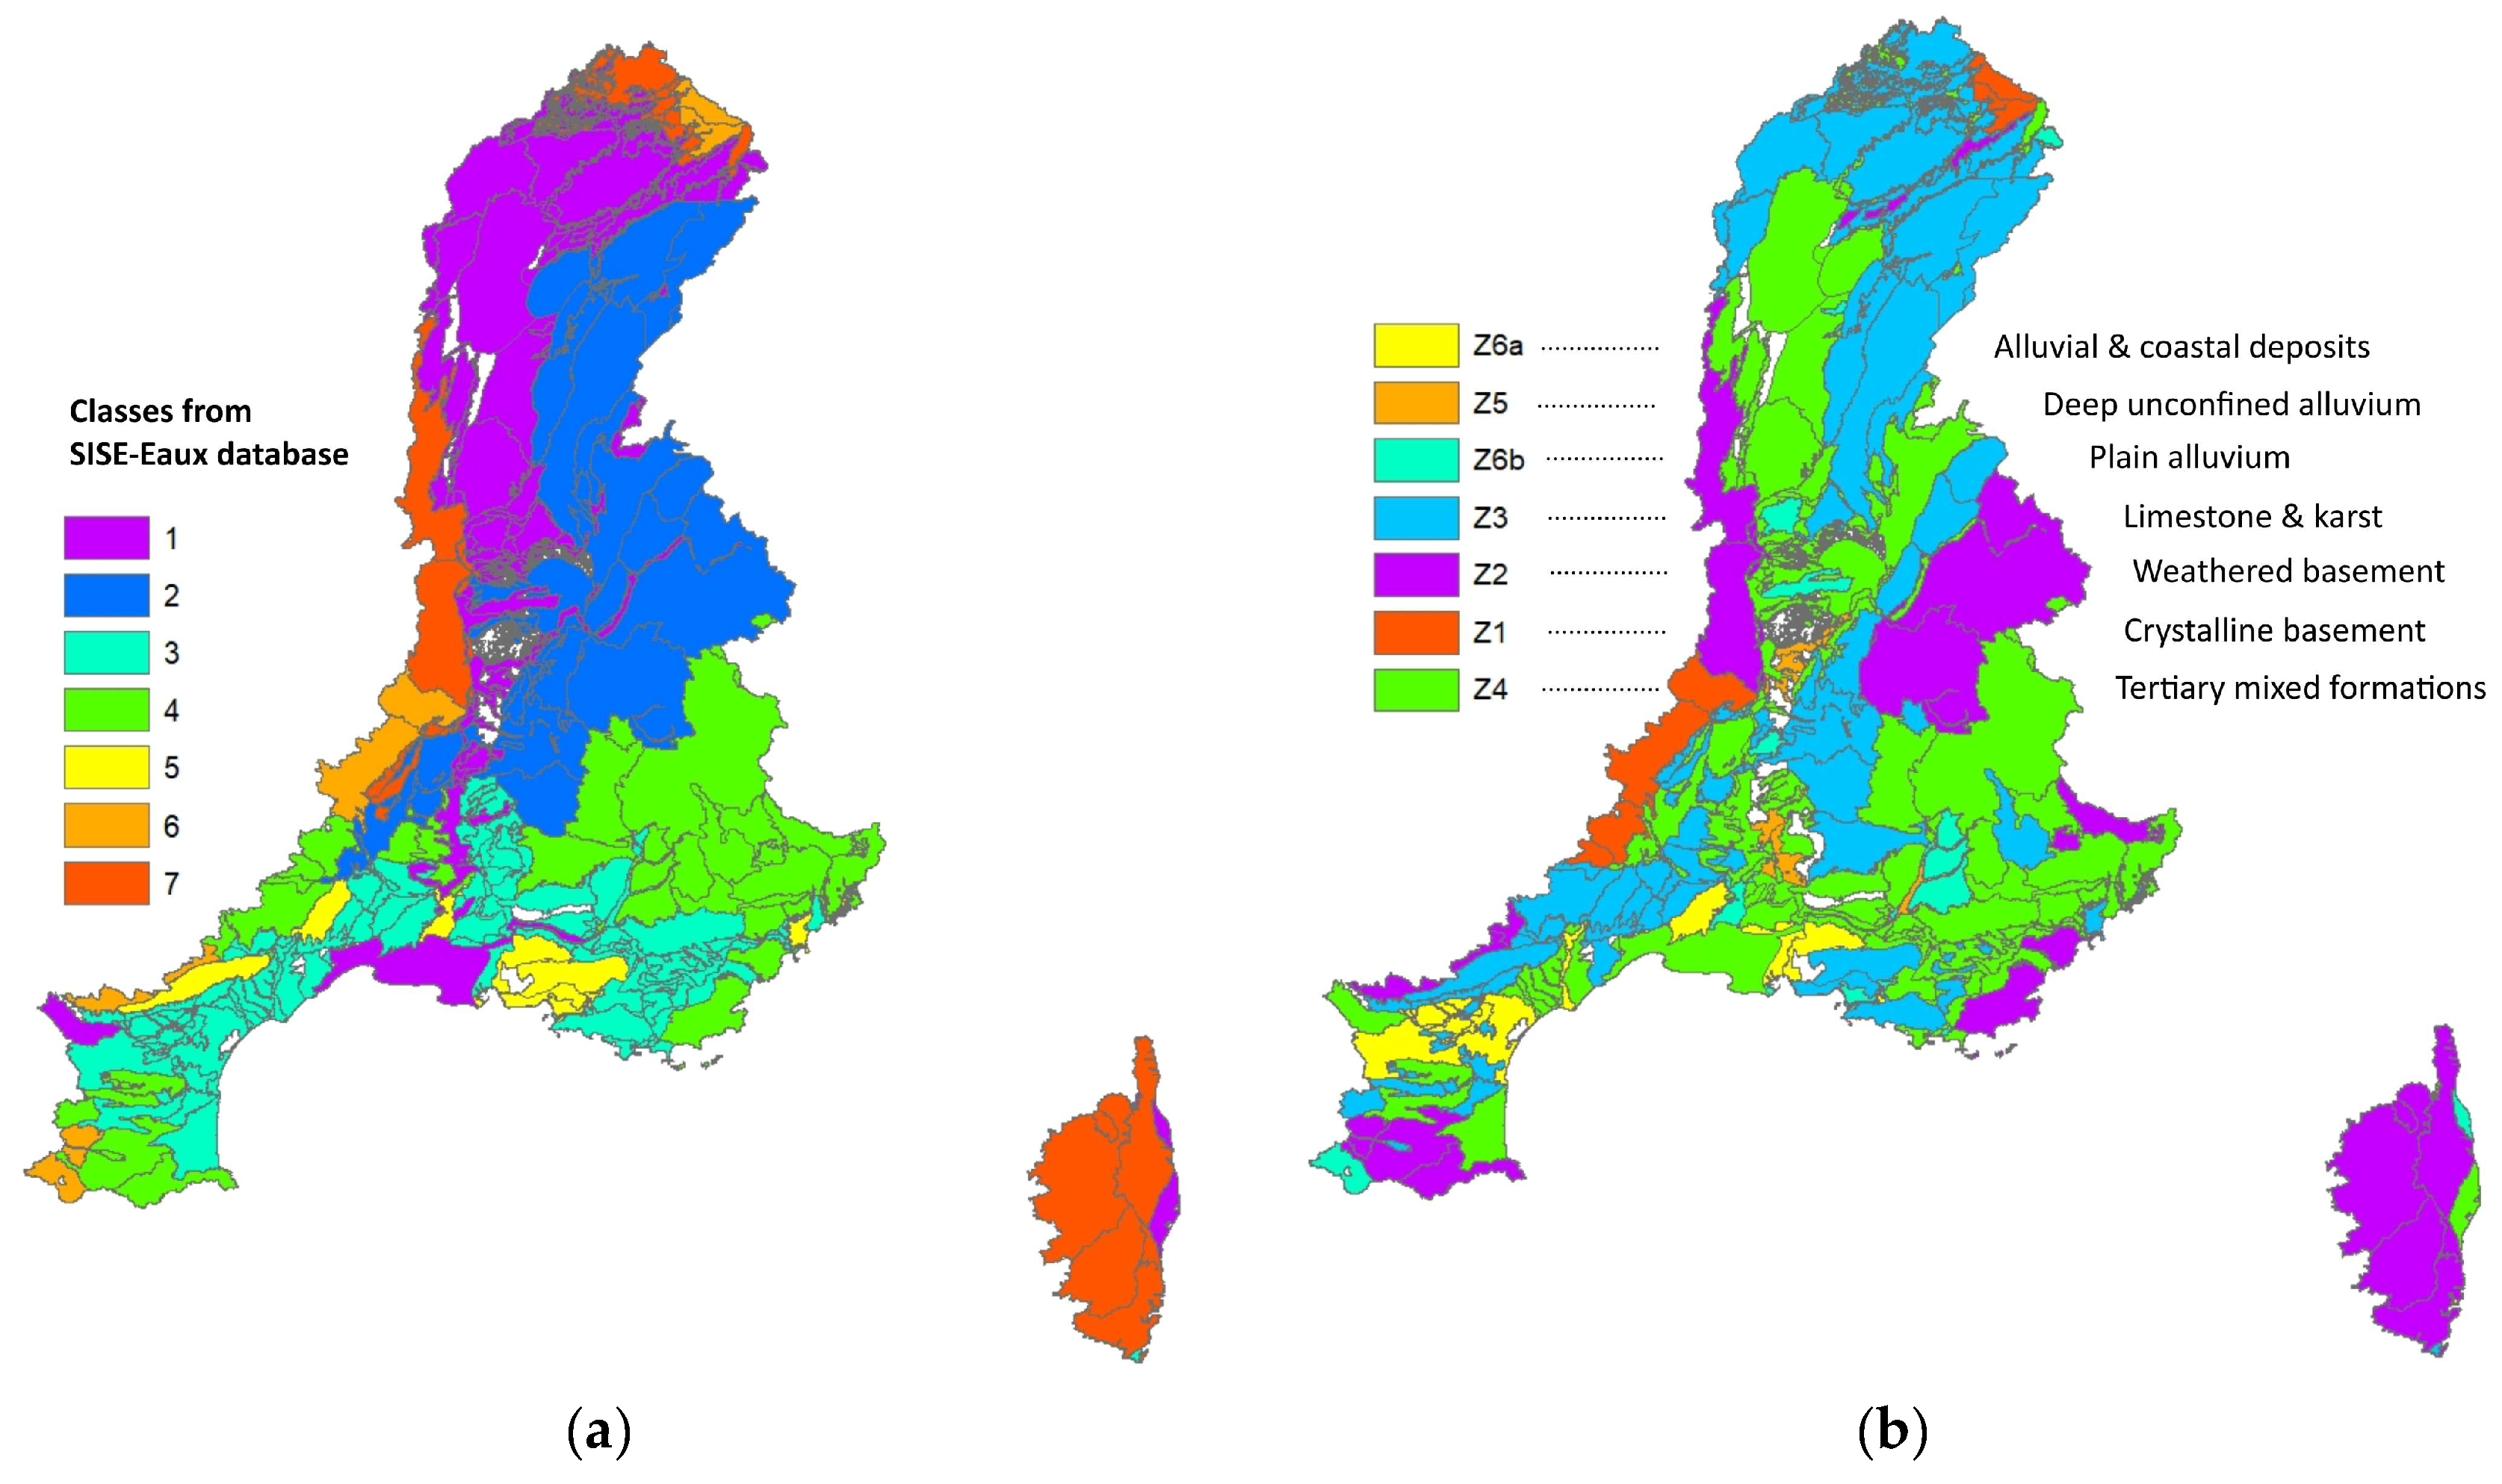
Table 1.
Proportions of explained variance (η²) for each parameter, cumulated at each spatial aggregation level. The net variance attributable to each level is obtained by subtracting the cumulated variance of the lower level, thus allowing the specific contribution of each nested scale to be isolated.
Table 1.
Proportions of explained variance (η²) for each parameter, cumulated at each spatial aggregation level. The net variance attributable to each level is obtained by subtracting the cumulated variance of the lower level, thus allowing the specific contribution of each nested scale to be isolated.
| Parameter | Temp. Variance | Catchment Point | GWB | Gr. GWB Lithology | Gr GWB HCA-PCA |
|---|---|---|---|---|---|
| Enter. | 0.360 | 0.640 | 0.377 | 0.107 | 0.242 |
| E.coli | 0.334 | 0.666 | 0.382 | 0.110 | 0.193 |
| E.C. | 0.004 | 0.996 | 0.656 | 0.450 | 0.542 |
| Ca²⁺ | 0.029 | 0.971 | 0.779 | 0.505 | 0.631 |
| HCO₃⁻ | 0.034 | 0.966 | 0.694 | 0.221 | 0.349 |
| Mg²⁺ | 0.055 | 0.945 | 0.485 | 0.147 | 0.297 |
| SO₄²⁻ | 0.070 | 0.930 | 0.534 | 0.186 | 0.376 |
| Na⁺ | 0.063 | 0.937 | 0.568 | 0.126 | 0.390 |
| Cl⁻ | 0.064 | 0.936 | 0.618 | 0.116 | 0.448 |
| Fe | 0.308 | 0.692 | 0.681 | 0.213 | 0.258 |
| Mn | 0.216 | 0.784 | 0.695 | 0.113 | 0.441 |
| NO₃⁻ | 0.121 | 0.879 | 0.512 | 0.102 | 0.347 |
Table 2.
Confusion matrix of the linear discriminant analysis. Overall correct classification rate in estimation: 56.2%. Diagonal values (in bold) correspond to correctly classified observations.
Table 2.
Confusion matrix of the linear discriminant analysis. Overall correct classification rate in estimation: 56.2%. Diagonal values (in bold) correspond to correctly classified observations.
| Obs. \ Pred. | Z1 | Z2 | Z3 | Z4 | Z5 | Z6a | Z6b | Total | % correct |
|---|---|---|---|---|---|---|---|---|---|
| Z1 | 222 | 57 | 6 | 6 | 0 | 1 | 0 | 292 | 76.0% |
| Z2 | 181 | 1328 | 102 | 459 | 0 | 4 | 0 | 2074 | 64.0% |
| Z3 | 35 | 207 | 974 | 702 | 1 | 20 | 0 | 1939 | 50.2% |
| Z4 | 28 | 268 | 491 | 1676 | 0 | 105 | 1 | 2569 | 65.2% |
| Z5 | 0 | 13 | 7 | 145 | 0 | 19 | 0 | 184 | 0% |
| Z6a | 0 | 25 | 18 | 222 | 0 | 89 | 0 | 354 | 25.1% |
| Z6b | 18 | 18 | 35 | 137 | 0 | 5 | 0 | 213 | 0% |
| TOTAL | 484 | 1916 | 1633 | 3347 | 1 | 243 | 1 | 7625 | 56.2% |
Disclaimer/Publisher’s Note: The statements, opinions and data contained in all publications are solely those of the individual author(s) and contributor(s) and not of MDPI and/or the editor(s). MDPI and/or the editor(s) disclaim responsibility for any injury to people or property resulting from any ideas, methods, instructions or products referred to in the content. |
© 2026 by the authors. Licensee MDPI, Basel, Switzerland. This article is an open access article distributed under the terms and conditions of the Creative Commons Attribution (CC BY) license (http://creativecommons.org/licenses/by/4.0/).
Copyright: This open access article is published under a Creative Commons CC BY 4.0 license, which permit the free download, distribution, and reuse, provided that the author and preprint are cited in any reuse.