

Submitted:
30 September 2026
Posted:
01 October 2026
You are already at the latest version
Abstract
Youth exclusion from employment, education and training is a challenge to social sustainability because it limits participation and may reinforce territorial inequalities. This study examines the spatial structure of young people not in employment, education or training (NEET) across 208 Nomenclature of Territorial Units for Statistics level 2 (NUTS 2) regions in 21 EU Member States, combining spatial clustering, cluster profiling and spatial regression analysis. Queen contiguity defines the main spatial structure, while a four-nearest-neighbors matrix tests robustness and false discovery rate (FDR) correction addresses multiple local testing. NEET rates display strong positive spatial autocorrelation, with high-NEET clusters concentrated mainly in Southern and South-Eastern Europe and low-NEET clusters predominantly in Northern and Central Europe. Hotspots are characterized by greater poverty risk, lower disposable income, weaker adult educational attainment, lower service-establishment intensity and lower population density. Spatial regression prefers a spatial error model (SEM): poverty risk and low educational attainment are positively associated with NEET, while disposable income is negatively associated and these associations remain stable under the alternative weights matrix. The findings show that youth disengagement has a clear territorial structure, linking inequalities in participation to persistent regional disparities, placing the geography of youth exclusion within the social-sustainability debate.
Keywords:
NEET
; youth vulnerability
; social sustainability
; spatial autocorrelation
; spatial error model
; NUTS 2
; territorial inequalities
1. Introduction
Young people's ability to participate in education, training and employment is central to inclusive and sustainable development. Education develops skills and widens individual opportunities, supports participation in economic and social life and can reduce exposure to poverty and exclusion. Educational deprivation is therefore not limited to a lack of schooling or formal qualifications. It also encompasses barriers to learning, capability development, social participation and autonomy [1]. These obstacles are unevenly distributed. National averages can conceal substantial regional differences and obscure the territorial contexts in which disadvantage becomes persistent [2,3]. Research on young people not in employment, education or training (NEET) documents pronounced regional variation and spatial interdependence across Europe [4,5], while explicit spatial clustering of regional NEET rates has also been documented in selected national settings [6]. Recent evidence also points to the importance of the subnational context, with variation in youth labour-market opportunities documented across European Nomenclature of Territorial Units for Statistics level 2 (NUTS 2) regions and more recent longitudinal evidence showing that school-to-work outcomes vary with both national institutional configurations and regional socioeconomic contexts [7,8]. Contextual factors, regional disparities and the urban-rural dimension are recurrent elements in explaining NEET status alongside individual characteristics [9]. A spatial perspective therefore makes it possible to move beyond country rankings by examining whether regions with similar NEET rates shape geographically contiguous clusters.
This question is relevant to social sustainability. The United Nations Convention on the Rights of the Child established an international commitment to education and participation, while the 2030 Agenda connects inclusive education, decent work and reduced inequalities through Sustainable Development Goals 4, 8 and 10 [10,11]. A recurring concern in the social-sustainability literature is whether people can access services and opportunities on equitable terms and participate in social life [12,13,14]. Access to education, training and employment is particularly relevant from this perspective because it affects both participation and the distribution of opportunities. Territorial context is also important: persistent spatial inequalities can condition the effectiveness of social policies and provide a rationale for context- and place-sensitive approaches to sustainable development [15]. Persistent exclusion from education and training may therefore restrain the effective opportunities available to young people while weakening social cohesion. The policy relevance of NEET is also recognized by the reinforced Youth Guarantee and the European Pillar of Social Rights Action Plan [16,17]. From this perspective, spatial concentrations of high NEET rates should not be viewed only as labour-market anomalies, but may also identify territories where limited opportunities and broader socioeconomic disadvantages reinforce one another.
The emphasis on education, participation and territorial opportunity also requires a clear distinction between NEET and educational poverty. The two may overlap, but they capture different forms of disadvantage. NEET is a specific and heterogeneous statistical classification rather than a direct measure of educational poverty: educationally disadvantaged young people may be employed and therefore fall outside the category, while the NEET population itself encompasses heterogeneous forms of non-participation and should not be interpreted as a homogeneous social condition [9,18,19]. Because a harmonized multidimensional indicator of educational poverty was not available for the regional coverage required by this analysis, this study uses the NEET rate as an observable indicator of youth vulnerability at the intersection of education, training and labour-market participation. The analysis does not treat NEET as equivalent to, or as a complete measure of, educational poverty, but its purpose is to try to examine whether this form of youth exclusion is spatially concentrated and whether high-NEET clusters occur in territorial contexts characterized by less favorable material, educational and structural resources.
Regional NEET research has documented substantial subnational disparities and examined convergence, determinants and spatial interdependence across European regions, using different geographical scopes and analytical strategies [4,5,6,20]. Building on this literature, the present study combines global and local spatial autocorrelation, territorial profiling and spatial regression within a common cross-national NUTS 2 framework. This integrated approach examines how NEET rates are spatially structured across the study regions and which socioeconomic and educational associations persist once spatial dependence is taken into account. Against this background, the study asks: how are NEET rates spatially structured across EU NUTS 2 regions and how are these patterns associated with socioeconomic, educational and territorial conditions. The analysis first identifies global and local spatial clustering, then compares the territorial profiles of high- and low-NEET clusters and finally uses spatial regression to examine the observed associations after accounting for spatial dependence. By examining spatial clustering together with regional socioeconomic conditions, the study assesses whether spatial dependence remains after observable regional differences are taken into account. In doing so, it attempts to connect the regional analysis of NEET with the social-sustainability literature on unequal access to opportunities and with place-sensitive approaches to regional policy [21].
2. Literature Review and Theoretical Framework
Understanding NEET as a form of youth vulnerability requires considering both the resources that young people acquire through education and the opportunities available to use those resources in social and economic life. Human-capital theory emphasizes the role of education and training as investments that can generate returns through productivity, employment and income [22,23]. These resources, however, do not translate into the same opportunities in every social and territorial context. The capability approach provides a complementary perspective by shifting attention from resources and expected returns to the substantive opportunities people have to convert them into valued forms of participation and well-being [24]. This broader understanding also underlies the human-development approach, in which education is a component of well-being rather than simply an instrument of economic growth [25]. From this perspective, educational poverty cannot be understood only in terms of formal qualifications, as it has been approached through both qualification-based and broader competence-based measures [26,27,28]. Research on skill formation further recognizes cognitive, non-cognitive and social dimensions of learning [29,30]. Save the Children similarly defines educational poverty in terms of restricted opportunities to learn, experiment and develop capabilities, talents and aspirations [1], while the Istat framework (Table 1) distinguishes resources available through family, school and territorial contexts from cognitive, personal and social outcomes [31,32], a distinction used here as a conceptual reference for separating contextual resources from individual outcomes, rather than as an empirical measurement framework. This multidimensional perspective also sets the boundary for the use of NEET in this study: the indicator does not measure competences, educational quality, family resources or cultural participation, but captures a specific form of disengagement from education, training and employment.
2.1. NEET and Territorial Vulnerability
The NEET indicator captures a specific point of disconnection in the transition to adulthood: young people are simultaneously outside employment and outside the institutions of education and training. This makes NEET analytically broader than youth unemployment. The unemployment rate includes only people who are without work, available for work and actively seeking it, whereas NEET also includes inactive young people who may have become discouraged, face health or caring constraints or remain distant from formal support systems. For this reason, the indicator can reveal types of vulnerability that conventional labour-market measures overlook [33,34]. Its policy relevance is reflected in the Youth Guarantee and in Sustainable Development Goal 8 (SDG8), which explicitly targets a reduction in the proportion of young people not in employment, education or training [11,16].
The NEET population is nevertheless heterogeneous. Eurofound distinguishes re-entrants, short- and long-term unemployed young people, those unavailable because of illness or disability or family responsibilities, discouraged workers and other inactive young people [19]. This heterogeneity remains a central issue in recent literature. A review of 83 European studies finds no consensus on the definition of the population classified as NEET and substantial variation in the subgroups, circumstances and contextual conditions considered [9]. NEET should therefore not be treated as an individual diagnosis or a homogeneous social identity [18]. Nor should it be treated as a direct synonym for educational poverty, given the broader multidimensional conceptualization adopted above [1,31,32]. In this study, its value lies at the aggregate level: the regional NEET rate indicates the proportion of young people whose transitions through education, training and work have not resulted in current participation in any of these domains.
Transitions from education to employment depend on both individual resources and the opportunities available in the places where young people live. Education and training can improve access to employment, but whether qualifications translate into occupational opportunities also depends on regional labour demand, the productive structure, access to training, transport and employment services and the institutional organization of school-to-work transitions. Family resources and the educational profile of the adult population further shape the conditions in which these transitions take place. Evidence at different levels of analysis supports this territorial interpretation. Individual characteristics operate alongside national educational, institutional and labour-market conditions [35]. Evidence based on LFS microdata combined with regional indicators similarly suggests that individual educational characteristics coexist with territorial factors such as regional poverty, although their relevance varies across countries [36]. At the regional level, different convergence trajectories in NEET rates have been identified across European regions, with unemployment and early leaving from education and training emerging as major correlates of long-run NEET rates in the main convergence groups [5].
A territorial interpretation is particularly important because local disadvantages can become cumulative and self-reinforcing. Regions with limited employment opportunities may experience selective out-migration of more highly qualified young people, a narrower economic base and weaker incentives to invest in locally demanded skills. Rural and peripheral areas may additionally face disadvantages linked to underdeveloped infrastructure, limited access to education and limited employment opportunities [37]. Conversely, diversified urban and regional economies may offer a wider range of transition pathways, although urban location does not in itself eliminate exclusion. Spatial concentrations of NEET rates may therefore reflect geographically embedded combinations of educational, economic, demographic and institutional conditions rather than isolated individual choices.
NEET is used here for both substantive and practical reasons. It captures a consequential form of non-participation associated with risks of social exclusion, loss of work experience, reduced future earnings and difficulties in the transition to adult life [33,38]. It is also a harmonised indicator available across the EU NUTS 2 coverage used in this study and connects educational participation with labour-market integration. At the same time, it does not capture the multidimensional concept of educational poverty in full, not providing direct information about competences, educational quality, family circumstances or cultural participation. For this reason, the profiling variables are not treated as components of an educational-poverty index, but they are used more narrowly to describe the material, educational and territorial settings in which high- and low-NEET clusters occur.
2.2. Mechanisms of Spatial Clustering in Youth Outcomes
Beyond individual-level determinants, regional opportunity structures provide several mechanisms through which NEET rates may become spatially clustered. In cumulative-causation accounts, weak labour demand can encourage the selective out-migration of qualified workers, narrowing the local skills base and weakening subsequent investment [39]. Agglomeration theory describes the opposite dynamic: dense and diversified economies tend to sustain thicker labour markets and a wider range of transition pathways, while commuting and other forms of interaction can extend these effects beyond administrative boundaries [40]. Evidence from European regional labour markets supports the relevance of these interregional connections. Unemployment has been shown to cluster across regions [41], while spatial dependence in local unemployment rates has been linked, among other factors, to commuting flows [42]. More generally, labour demand, labour supply, migration and commuting help explain why regional labour markets remain both differentiated and interconnected [43]. Youth transitions are also shaped by institutional and policy conditions that vary across territories. Regional differences in education and labour-market policy have been associated with heterogeneity in NEET rates, while the regional scale has been shown to matter for youth labour-market integration and school-to-work outcomes [44,45,46]. Spatial clustering may therefore reflect not only interaction across neighbouring labour markets, but also geographically patterned differences in the institutional and economic conditions under which young people move from education to employment. Applied to youth transitions, these findings suggest that NEET rates may reflect not only conditions within individual regions, but also the wider territorial systems in which those regions are embedded. This interpretation is consistent with place-based approaches to regional development, which emphasise persistent territorial differences and the limits of spatially neutral interventions [21].
Spatial clustering does not, however, necessarily imply that NEET outcomes themselves diffuse between neighbouring regions. Similar regional rates may arise because adjacent territories share labour-market catchment areas, transport networks, productive structures or other contextual conditions that are imperfectly observed. This distinction is important for the empirical analysis: a spatial-lag process represents dependence in the outcome itself, whereas a spatial-error process represents spatial correlation in unobserved contextual factors [47,48]. Comparing SAR and SEM therefore makes it possible to examine which representation is more consistent with the observed regional pattern.
3. Materials and Methods
3.1. Study Area, Data and Variables
Using 2022 as the reference year, the empirical sample contains 208 NUTS 2 regions in 21 European Union Member States: Austria, Bulgaria, Croatia, Czechia, Denmark, Finland, France, Germany, Greece, Hungary, Ireland, Italy, Lithuania, the Netherlands, Poland, Portugal, Romania, Slovakia, Slovenia, Spain and Sweden. Belgium, Cyprus, Estonia, Latvia, Luxembourg and Malta are not represented because a complete harmonized set of the selected variables was not available when the dataset was built. Regions are therefore included only when complete data are available for all selected variables. This allows consistent comparison across all variables but means that the sample should not be interpreted as exhaustive coverage of the EU. NUTS 2 provides a harmonized subnational scale for comparing regional disparities and constitutes the basic regional level for important EU regional-policy applications [49]. The year 2022 was selected as the most recent reference year for which the selected regional indicators could be assembled with sufficiently consistent NUTS 2 coverage.
NEET is the share of people aged 15–29 who are neither employed nor participating in education or training. The profiling and regression variables represent selected dimensions of territorial context. AROP concerns material vulnerability, DISP_INC measures household economic resources, LOW_EDU and HIGH_EDU describe adult educational capital, SERV_PC measures administrative and support service local units (NACE “N”) per 10,000 inhabitants and POP_DEN captures settlement structure. These variables are not intended to replicate the Istat educational-poverty framework, but some of them capture contextual characteristics that are broadly consistent with its resource-side distinction, particularly material conditions, adult educational resources and territorial context. For spatial regression, disposable income is expressed per EUR 10,000, while SERV_PC and POP_DEN are logarithmically transformed because of strong positive skewness. The model uses LOW_EDU, but not HIGH_EDU to avoid simultaneously treating multiple educational shares as independent dimensions. Two variables frequently associated with regional NEET rates were not included in the model. Early leaving from education and training was considered substantively relevant, but sufficiently complete and harmonized NUTS 2 data for 2022 were not available without materially reducing regional coverage. The unemployment rate was not included in the baseline specification because the analysis focuses on broader socioeconomic, educational and territorial correlates, while youth unemployment is conceptually close to the NEET outcome; moreover, sufficiently complete age-comparable regional data for the 15–29 population were not available for the reference year. Table 2 provides variable definitions and Table 3 reports descriptive statistics. Dataset harmonization is documented in Appendix C, while Eurostat dataset identifiers and DOIs are reported in Appendix D.
3.2. Spatial Analytical Strategy
The empirical strategy comprises five stages. First, descriptive statistics and mapping establish the regional distribution of NEET. Second, Global Moran's I tests whether similar NEET rates are spatially clustered [50]. Third, Local Moran statistics identify high-high (H-H) hotspots, low-low (L-L) coldspots and spatial outliers (H-L and L-H). Fourth, H-H and L-L regions are profiled using non-parametric comparisons and effect sizes. Fifth, ordinary least squares (OLS), spatial lag (SAR) and spatial error (SEM) models assess whether the observed territorial associations persist when covariates are considered jointly and determine whether remaining spatial dependence is better represented by outcome interaction or spatially correlated omitted context. Global spatial autocorrelation is measured using Moran's I [50], calculated as follows:
where n is the number of regions, xi and xj are the NEET rates observed in regions i and j, is the mean regional NEET rate, wij is the corresponding element of the spatial weights matrix W and S0 is the sum of all spatial weights. The main spatial weights matrix is based on row-standardized first-order Queen contiguity. Six geographically disconnected regions (ITG1, ITG2, ES53, ES63, ES64 and EL42) had no contiguous neighbors and were therefore assigned one documented bridge link each, as reported in Appendix A. A topology check was also carried out for six capital-region enclaves. In these cases, the polygons touch their surrounding regions, but the shared-vertex procedure failed to detect the relation because the boundaries had been generalized separately. The six corresponding Queen contiguities were therefore reinstated before row standardization. The resulting matrix contains no isolates and has an average of 4.43 neighbors per region. A row-standardized four-nearest-neighbors matrix (KNN4) is used as an alternative specification to assess the sensitivity of the results to the definition of spatial neighborhood (Appendix B). Global significance is evaluated with 9,999 permutations.
Local spatial association is examined using Local Moran's I within the Local Indicators of Spatial Association (LISA) framework [51]:
where zi is the standardized NEET rate in region i and zj is the standardized rate in neighboring region. The Moran scatterplot distinguishes H-H, L-L, H-L and L-H configurations. Conditional pseudo-p-values are obtained from 9,999 permutations. The p ≤ 0.05 threshold is used for the exploratory LISA classification. Because 208 local tests are performed simultaneously, the resulting p-values are also adjusted using the Benjamini–Hochberg false discovery rate (FDR) procedure [52]. Both results are reported: the classification describes the broader local pattern, while the FDR-adjusted results identify the subset of clusters that remains statistically significant after accounting for multiple testing. To compare the territorial profiles of H-H and L-L clusters, Mann–Whitney U tests are applied to the six contextual variables, several of which have markedly skewed distributions. Results are reported using medians and interquartile ranges, Benjamini–Hochberg-adjusted p-values and rank-biserial correlations as effect-size measures. The NEET rate is reported only to describe the two cluster types, since NEET itself determines their LISA classification. Because the regions entering each cluster are spatially related, these comparisons are used to describe differences between cluster profiles rather than to infer independent causal effects.
The regression analysis uses the regional NEET rate as the dependent variable and AROP, disposable income per EUR 10,000, LOW_EDU, log(SERV_PC) and log(POP_DEN) as covariates. OLS provides the non-spatial benchmark:
y = Xβ + ε
Two spatial specifications are then estimated. The spatial autoregressive model (SAR) introduces a spatial lag of the dependent variable:
where ρ measures dependence between a region's NEET rate and the NEET rates observed in neighbouring regions. The spatial error model (SEM) instead allows spatial dependence to enter through the disturbance term:
where λ measures spatial dependence in the unobserved component. Models are estimated by maximum likelihood using both Queen and KNN4 weights. Model comparison is based on log-likelihood, AIC, BIC and Moran's I calculated on the residual. The coefficients are interpreted as conditional associations rather than causal effects [47,48].
y = ρWy + Xβ + ε
y = Xβ + u
u = λWu + ε
4. Results
Figure 1 maps NEET rates across the 208 NUTS 2 regions included in the analysis. Higher rates are concentrated in Southern and South-Eastern Europe, most visibly in Southern Italy, Romania, Bulgaria and Greece, while lower rates are more frequent in Northern and Central Europe. The visual pattern is confirmed by Global Moran's I. Under Queen contiguity, I=0.7198 (p=0.0001), indicating strong positive spatial autocorrelation. Clustering remains pronounced under KNN4 (I=0.6566, p=0.0001), showing that the global result is not driven by a single definition of spatial neighborhood.
At the p ≤ 0.05 threshold, 42 of 208 regions (20.19%) display significant local spatial association under Queen spatial weight matrix: 23 are H-H, 17 are L-L and two are L-H, while no H-L outliers are significant. Individual classifications close to p = 0.05 can vary slightly with the permutation sequence. Benjamini-Hochberg correction across all 208 local tests yields 13 regions: 12 H-H and one L-L. The retained hotspots are in Bulgaria, Italy and Romania, while Gelderland (Netherlands) is the only retained L-L region. The FDR result narrows the set of locally robust clusters, but preserves the main geographical concentration of high NEET rates (Table 4).
Figure 2 maps the LISA classification. H-H regions form contiguous concentrations in South-Eastern Europe and Southern Italy, whereas L-L regions are concentrated mainly in Northern and Central Europe. The local geography is therefore dominated by clusters of similar values, rather than by spatial outliers.
Table 5 shows a marked socioeconomic gradient between the two cluster types. The median NEET rate is 20.9% in H-H regions and 4.8% in L-L regions. High-NEET clusters are also characterized by greater poverty exposure and substantially lower disposable income. Their educational profile points in the same direction, combining a higher share of adults with low educational attainment with a markedly lower share of tertiary-educated adults. H-H regions also show lower service-establishment intensity and lower population density. All six contextual comparisons remain significant after Benjamini–Hochberg adjustment. The largest rank-biserial effects concern poverty, income, tertiary education and service intensity, while the differences in low educational attainment and density are somewhat smaller but remain substantial.
Spatial regression confirms the core socioeconomic pattern identified in the cluster profiles, but shows that some profile differences do not remain independently associated with NEET once the covariates and spatial dependence are considered jointly. OLS residuals remain strongly spatially autocorrelated under Queen weights (I = 0.538, p < 0.001), showing that a non-spatial model is inadequate. SAR improves fit substantially (AIC = 985.03; ρ = 0.519, p < 0.001), but its Moran statistic remains marginal under Queen weights and significant under KNN4. SEM provides the best fit under both matrices (Table 6).
Table 6 also helps distinguish the type of spatial dependence. OLS residuals remain strongly autocorrelated (Moran’s I = 0.538), indicating that unexplained regional NEET rates remain spatially clustered after conditioning on poverty, income, education, service intensity and density. SAR substantially improves model fit (AIC = 985.03, compared with 1063.94 for OLS), but residual spatial dependence is only marginally non-significant under Queen weights and remains significant under KNN4. SEM performs better still: under Queen weights, AIC falls to 958.97, more than 100 points below OLS and about 26 points below SAR, while the Moran’s I is not statistically significant under either weights matrix. Among the specifications considered, the results therefore support a spatial-error representation over a spatial-lag representation. This pattern is consistent with spatially structured unobserved influences, although the model comparison does not identify their source or rule out other forms of interregional interaction.
Because spatial dependence enters through the disturbance term, the SEM satisfies E[y∣X] = Xβ, so its coefficients retain the usual conditional interpretation: each coefficient describes the association between a regional covariate and the region's own NEET rate, holding the remaining covariates constant. This differs from the SAR model, where the spatially lagged dependent variable generates feedback across regions through the spatial multiplier (I − ρW)−1, requiring a distinction between direct and indirect effects [48]. No such decomposition is required for the SEM and the significant spatial-error parameter λ indicates that the unobserved component of regional NEET remains spatially correlated across neighboring regions.
The magnitude of the SEM coefficients (Table 7) gives the covariate associations concrete meaning. A ten-percentage-point difference in the at-risk-of-poverty rate is associated with a 2.66-percentage-point difference in the regional NEET rate (beta = 0.266), making AROP the largest single driver among the considered covariates. Disposable income shows a comparable but inverse relationship: each additional EUR 10,000 of household income per inhabitant is associated with a 2.53-percentage-point lower NEET rate, so the roughly EUR 27,300 gap between the highest- and lowest-income regions in the sample corresponds to a difference of nearly seven NEET percentage points through income alone, before any contribution from poverty or education. Low educational attainment among adults contributes more modestly: a ten-percentage-point higher LOW_EDU share is associated with 1.67 additional NEET percentage points, consistent with the intergenerational transmission of limited educational and labour-market resources highlighted in the theoretical framework. By contrast, log(SERV_PC) and log(POP_DEN) do not reach significance under Queen weights (p = 0.075 and p = 0.173, respectively). The associations with NEET visible in the earlier hotspot-coldspot comparison are substantially attenuated once poverty, income and education are considered jointly, suggesting that service intensity and population density are not robust independent correlates in the Queen specification.
The spatial-error parameter is large, positive and highly significant under both specifications (λ = 0.703 with Queen and λ = 0.698 with KNN4), indicating strong positive spatial dependence in the error process after conditioning on the included covariates. This is consistent with the view, developed further in the discussion section, that youth disengagement is embedded in territorial systems whose relevant processes are only partly captured by the five covariates measured here: labour-market catchment areas, transport and commuting corridors and historically accumulated institutional and industrial structures plausibly extend across neighboring NUTS 2 regions in ways that a cross-sectional, region-level model cannot fully capture. The stability of the poverty, income and education coefficients across both weights specifications, set against the weights-sensitivity of the service and density associations, indicates which part of this story is robust: material and educational disadvantage are consistently linked to NEET regardless of how spatial dependence is specified, whereas the role of local service provision and settlement density remains an open empirical question warranting more targeted data and further investigation.
The ESDA, cluster profiling and spatial regression point to a consistent territorial pattern. Regional NEET rates are spatially clustered, H-H and L-L regions differ markedly in their socioeconomic profiles and the associations of poverty risk, disposable income and low educational attainment persist when spatial dependence is explicitly modelled. Among the considered specifications, SEM provides the best fit and leaves no significant residual spatial autocorrelation under either Queen or KNN4 weights.
5. Discussion
The analysis establishes a strongly structured regional geography of NEET vulnerability. The Global Moran results, LISA clusters and KNN4 robustness check are consistent with earlier evidence of substantial regional variation in NEET and youth labour-market outcomes across Europe [4,5,7,20]. More specifically, the spatial clustering identified here extends evidence of spatial interdependence in regional NEET rates documented for Italy, Spain and the UK [6]. This interpretation is also consistent with broader evidence on European territorial disadvantage. The most disadvantaged regional clusters have been identified predominantly in Greece, Romania, Southern Italy and the Balkans [53]. Although their outcome is broader than NEET, the similarity in macro-regional geography suggests that the clustering identified here is embedded in a wider European pattern of socioeconomic inequality. FDR correction reduces the number of locally significant regions, which cautions against interpreting every LISA classification as definitive. Yet the principal high-NEET concentration in parts of Bulgaria, Italy and Romania remains visible after FDR adjustment.
The territorial profile and SEM results reveal a robust socioeconomic backbone. Greater poverty exposure and low adult educational attainment are associated with higher regional NEET rates, while disposable income is associated with lower rates. This combination of material and educational disadvantage is consistent with evidence obtained using different levels of analysis. Low education and disadvantaged family background have been identified among the factors associated with NEET status, together with unfavourable labour-market and educational contexts [35]. Socioeconomic background remains consequential even among individuals with comparable educational attainment, with higher-background young people experiencing shorter NEET spells and a higher probability of transition to employment [54]. Regional poverty has also been identified among contextual risk factors associated with NEET status, although the relevance of regional covariates differs across countries [36]. Taken together, this literature is consistent with our finding that material conditions and educational resources are simultaneously associated with youth disengagement, while also cautioning against interpreting the regional coefficients as individual-level causal effects. This pattern can also be read alongside the resource–outcome distinction introduced earlier through the Istat educational-poverty framework. The most stable associations in the present analysis concern material conditions and adult educational resources, whereas important dimensions of that broader framework (including school provision, cultural and social opportunities and cognitive and personal outcomes) are not observed here. The results therefore show that regional youth non-participation is associated with some of the contextual disadvantages that a broader multidimensional perspective on educational poverty considers relevant. The spatial-error parameter is large and highly significant, indicating that unobserved influences are themselves geographically structured. This is more consistent with omitted regional labour-market, institutional, accessibility and historical conditions than with a simple direct diffusion of NEET outcomes between neighbors. A further limitation is the possible two-way relationship between poverty and NEET. European panel evidence suggests feedback between the two outcomes [55], so the association estimated here should not be read as a one-directional effect.
From a social-sustainability perspective, the main contribution is to show that youth non-participation is not only unequally distributed across European regions but spatially organized across neighboring territories, connecting questions of equity and access to opportunities with the territorial structure of education-to-work transitions.
The SEM does not identify what generates the remaining spatial pattern. One possibility is that neighboring regions share labour-market conditions, commuting networks and industrial structures that are only partly captured by the included covariates. This interpretation is consistent with evidence on regional unemployment, where migration, commuting and other region-specific factors contribute to spatial dependence [43,56]. Results for SERV_PC and POP_DEN are less stable. Both variables differ sharply between H-H and L-L clusters, but their coefficients are not significant in the Queen SEM and become significant under KNN4. We therefore do not treat them as robust correlates of regional NEET. This is especially important for SERV_PC, which measures a specific segment of the local service economy rather than access to education, welfare, health or transport.
These findings support a place-sensitive interpretation of youth policy. This implication is consistent with a broader strand of regional-policy research arguing that interventions should account for economic, social, political and institutional diversity rather than assuming that identical measures will operate in the same way across territories [57]. Youth-labour-market research warns against an exclusive focus on individual qualifications disconnected from regional economies and recommends place-sensitive policies for deprived regions [7]. The effectiveness of social investment has similarly been linked to locally specific contextual conditions and context-sensitive approaches [15]. The policy implication is not that regional context should replace individual-level intervention, but that the two need to be considered together. Where high NEET rates coincide with poverty and weak educational capital, employability measures may need to be accompanied by education and training provision, anti-poverty policies and measures addressing regional economic conditions.
6. Conclusions
This study examined regional NEET vulnerability across 208 NUTS 2 regions in 21 EU Member States, treating the NEET rate as an indicator of youth non-participation at the intersection of education, training and employment rather than as a direct measure of educational poverty. The results reveal a clear territorial structure. Regional NEET rates show strong positive global spatial autocorrelation under both Queen and KNN4 weights, while the local analysis identifies contiguous concentrations of high NEET mainly in Southern and South-Eastern Europe and of low NEET mainly in Northern and Central Europe. The LISA classification identifies 42 regions with significant local spatial association but, after FDR adjustment, a smaller core of 13 remains, including 12 H-H regions in Bulgaria, Italy and Romania. The differences between H-H and L-L regions extend beyond NEET itself. High-NEET clusters are characterized by greater poverty exposure, lower disposable income, weaker adult educational attainment, lower service-establishment intensity and lower population density. Spatial regression further qualifies this profile. SEM performs better than OLS and SAR under both neighborhood definitions, while poverty risk and low adult educational attainment remain positively associated with regional NEET rates and disposable income remains negatively associated. These three associations are stable across Queen and KNN4 weights, whereas the estimates for service intensity and population density are more sensitive to the neighborhood specification. Together with the large spatial-error parameter, this indicates that the observed socioeconomic and educational variables capture only part of the regional spatial pattern, with a substantial geographically structured component remaining after they are taken into account.
These results have a direct territorial-policy implication. Several of the high-NEET clusters identified in the analysis are located in areas already central to EU Cohesion Policy. Under the 2021–2027 framework, ERDF and ESF+ resources for the Investment for jobs and growth goal are allocated across NUTS 2 regions according to their classification as less developed, transition or more developed regions, whereas Cohesion Fund eligibility is determined at Member State level [58]. Several Southern Italian NUTS 2 regions are classified as less developed for ERDF and ESF+ purposes, while Bulgaria and Romania are among the Member States eligible for Cohesion Fund support [59]. The connection with youth policy is particularly direct in the ESF+, whose specific objectives include access to employment and activation measures for young people, including through the Youth Guarantee. The ESF+ Regulation also requires Member States whose average NEET rate exceeded the EU average in 2017–2019 to allocate at least 12.5% of their resources under shared management to targeted youth actions and structural reforms [60]. The spatial clusters identified here should not be interpreted as an alternative allocation criterion, but they can instead add a finer territorial layer to these broader policy geographies by identifying groups of neighboring regions in which high youth non-participation coincides with wider socioeconomic disadvantage. This use of spatially disaggregated evidence is consistent with the place-based orientation of Cohesion Policy [61] and with evidence that NUTS 2 analysis can reveal disparities that remain less visible at national level [62].
These findings should be read in light of several limitations. The study is a cross-sectional attempt to characterize the territorial patterning of NEET and its regional correlates. By requiring complete data, this approach excludes six EU Member States and the regional cross-sectional design also does not separately identify country-level institutional differences from regional covariates and spatial dependence, so part of the remaining spatial structure may reflect unobserved national heterogeneity. NUTS 2 averages conceal inequalities within regions, while the NEET indicator itself encompasses heterogeneous forms of non-participation. The construction of the spatial weights matrix also requires explicit methodological decisions: six geographically disconnected regions have no Queen-contiguous neighbors and were assigned documented bridge links, while six enclave contiguities had to be restored because they were not recovered by the shared-vertex procedure. The KNN4 analysis provides an alternative neighborhood definition against which the principal results can be assessed. Data availability further constrained both territorial coverage and covariate selection. In particular, sufficiently complete NUTS 2 data on early leaving from education and training and age-comparable youth unemployment were not available for the reference year without materially reducing or fragmenting the analytical sample. Finally, cross-sectional comparability is affected by the use of 2019 observations for five German regions and by the manual harmonization of Portuguese territorial identifiers, as documented in Appendix C.
Future research should extend the analysis in both temporal and spatial terms. Longitudinal regional data would make it possible to examine whether the identified clusters persist, contract or shift over time and to address more directly the temporal relationship between NEET and socioeconomic disadvantage. Richer indicators of educational provision, accessibility and local services would help identify which territorial conditions account for the spatially correlated unobserved component captured by the SEM. Future work could also move beyond administrative NUTS 2 boundaries by considering commuting zones or functional labour-market areas, which may correspond more closely to the spatial mechanisms suggested by labour-market interactions. Finally, linking regional spatial information with individual-level Labour Force Survey data would allow individual characteristics, national institutional settings and regional context to be modelled jointly, following the direction taken by recent multilevel and multilevel-regional research [8,36]. Such an extension would also respond to recent evidence emphasizing the importance of contextual and within-country territorial variation in understanding NEET status [9]. Even within these limits, the analysis shows that regional NEET disparities in Europe have a spatial structure that national comparisons alone do not reveal. For social sustainability, this matters because inequalities in participation are not only individual but territorially patterned. Spatially differentiated monitoring can therefore complement youth and cohesion policy by identifying contiguous areas in which high youth non-participation coincides with material and educational disadvantage.
Author Contributions
Conceptualization, F.C. and K.L.; Investigation, F.C. and K.L.; Writing—original draft preparation, F.C. and K.L.; Writing—review and editing, F.C. and K.L. All authors have read and agreed to the published version of the manuscript.
Funding
This research received no external funding.
Institutional Review Board Statement
Not applicable.
Informed Consent Statement
Not applicable.
Data Availability Statement
The data used in this study are publicly available from Eurostat. Dataset identifiers and DOIs are reported in Appendix D. The original contributions presented in the study are included in the article, further inquiries can be directed to the corresponding author.
Conflicts of Interest
The authors declare no conflicts of interest.
Appendix A. Adjustments to the Queen Contiguity Matrix

Table A1.
Adjustments to the Queen contiguity matrix.
|
NUTS 2 code (paired) |
NUTS 2 name (paired) |
| ITG1 - ITF6 | Sicilia-Calabria |
| ITG2 - ITI4 | Sardegna-Lazio |
| ES53 - ES52 | Illes Balears-Comunitat Valenciana |
| ES63 - ES61 | Ceuta-Andalucia |
| ES64 - ES61 | Melilla-Andalucia |
| EL42 - EL65 | Notio Aigaio-Peloponnisos |
| AT13 - AT12 | Wien-Niederösterreich |
| CZ01 - CZ02 | Praha-Střední Čechy |
| DE30 - DE40 | Berlin-Brandenburg |
| HU11 - HU12 | Budapest-Pest |
| PL91 - PL92 | Warszawski stołeczny-Mazowiecki regionalny |
| RO32 - RO31 | București-Ilfov-Sud-Muntenia |
Appendix B. Robustness Check Using KNN4
To assess sensitivity to neighbourhood definition, the complete ESDA and spatial-regression analyses were repeated using a four-nearest-neighbours matrix (KNN4). Unlike Queen contiguity, KNN4 assigns four neighbours to every region, including islands and geographically disconnected units.
Global Moran's I remains positive and statistically significant under KNN4 (I = 0.6566; p = 0.0001). Forty-one regions are locally significant at p ≤ 0.05: 21 H-H, 18 L-L and two L-H, with no significant H-L outliers. These counts reproduce the earlier KNN4 analysis and confirm that the local structure is dominated by hotspots and coldspots.
The KNN4 spatial regressions also favour SEM. KNN4 SEM has AIC = 966.29, compared with 983.58 for SAR and 1063.94 for OLS. The spatial-error coefficient is λ = 0.698 (p < 0.001) and filtered innovations are not spatially autocorrelated (I = -0.042, p = 0.431). AROP and LOW_EDU remain positive and disposable income remains negative. Service intensity is negative and density positive under KNN4. Because the latter two coefficients are not significant in the Queen SEM, they are treated as weights-sensitive rather than robust findings.
Appendix C. Dataset Construction Details
For reasons of data availability, observations from 2019 were used for DED5, DED4, DE22, DE24 and DEB2. The year 2019 was selected instead of 2020 or 2021 to avoid values most directly affected by the COVID-19 disruption. A further harmonisation concerned the Portuguese regions PT16, PT17 and PT18. At the time of dataset construction, their statistical codes were not immediately aligned with the territorial structure of the geographic reference file. The regions were therefore manually matched using the available territorial codes and their correspondence with the units in the final dataset. This procedure did not alter the statistical values; it ensured consistency between regional identifiers, attributes, geometries and the spatial-weights matrices. These temporal and territorial harmonisation decisions should be considered when interpreting cross-sectional differences.
Appendix D. Eurostat Data Sources and Identifiers
Table A2.
Eurostat data sources and identifiers.
| Variable | Eurostat code | DOI |
| NEET | edat_lfse_22 | https://doi.org/10.2908/EDAT_LFSE_22 |
| AROP | ilc_li41 | https://doi.org/10.2908/ILC_LI41 |
| DISP_INC | nama_10r_2hhinc | https://doi.org/10.2908/NAMA_10R_2HHINC |
| LOW_EDU | edat_lfse_04 | https://doi.org/10.2908/EDAT_LFSE_04 |
| HIGH_EDU | edat_lfse_04 | https://doi.org/10.2908/EDAT_LFSE_04 |
| POP_DEN | demo_r_d3dens | https://doi.org/10.2908/DEMO_R_D3DENS |
| SERV_PC | sbs_r_nuts2021 | https://doi.org/10.2908/SBS_R_NUTS2021 |
References
- Save the Children. La Lampada di Aladino: L’Indice di Save the Children per Misurare le Povertà Educative e Illuminare il Futuro dei Bambini in Italia; Save the Children Italia: Rome, Italy, 2014. [Google Scholar]
- Iammarino, S.; Rodríguez-Pose, A.; Storper, M. Regional inequality in Europe: Evidence, theory and policy implications. J. Econ. Geogr. 2019, 19, 273–298. [Google Scholar] [CrossRef]
- Eva, M.; Cehan, A.; Corodescu-Roșca, E.; Bourdin, S. Spatial patterns of regional inequalities: Empirical evidence from a large panel of countries. Appl. Geogr. 2022, 140, 102638. [Google Scholar] [CrossRef]
- Bruno, G.S.F.; Marelli, E.; Signorelli, M. The rise of NEET and youth unemployment in EU regions after the crisis. Comp. Econ. Stud. 2014, 56, 592–615. [Google Scholar] [CrossRef]
- Maynou, L.; Ordóñez, J.; Silva, J.I. Convergence and determinants of young people not in employment, education or training: An European regional analysis. Econ. Model. 2022, 110, 105808. [Google Scholar] [CrossRef]
- Bradley, S.; Migali, G.; Navarro Paniagua, M. Spatial variations and clustering in the rates of youth unemployment and NEET: A comparative analysis of Italy, Spain and the UK. J. Reg. Sci. 2020, 60, 1074–1107. [Google Scholar] [CrossRef]
- Cefalo, R.; Scandurra, R. Territorial disparities in youth labour market chances in Europe. Reg. Stud. Reg. Sci. 2021, 8, 228–238. [Google Scholar] [CrossRef]
- Cefalo, R.; Scandurra, R. Welfare regimes, subnational territories and dynamics of school-to-work transitions. Soc. Policy Adm. 2026, 60, 941–954. [Google Scholar] [CrossRef]
- Petrescu, C.; Voicu, B.; Heinz-Fischer, C.; Tosun, J. Conceiving of and politically responding to NEETs in Europe: A scoping review. Humanit. Soc. Sci. Commun. 2024, 11, 226. [Google Scholar] [CrossRef]
- United Nations. Convention on the Rights of the Child; United Nations: New York, NY, USA, 1989. [Google Scholar]
- United Nations. Transforming Our World: The 2030 Agenda for Sustainable Development; A/RES/70/1; United Nations: New York, NY, USA, 2015. [Google Scholar]
- Dempsey, N.; Bramley, G.; Power, S.; Brown, C. The social dimension of sustainable development: Defining urban social sustainability. Sustain. Dev. 2011, 19, 289–300. [Google Scholar] [CrossRef]
- Vallance, S.; Perkins, H.C.; Dixon, J.E. What is social sustainability? A clarification of concepts. Geoforum 2011, 42, 342–348. [Google Scholar] [CrossRef]
- Eizenberg, E.; Jabareen, Y. Social sustainability: A new conceptual framework. Sustainability 2017, 9, 68. [Google Scholar] [CrossRef]
- Cordini, M.; Boczy, T.; Cefalo, R. Place-sensitive social investment and territorial cohesion: Implications for sustainability. Sustainability 2021, 13, 7085. [Google Scholar] [CrossRef]
- Council of the European Union. Council Recommendation of 30 October 2020 on A Bridge to Jobs—Reinforcing the Youth Guarantee and replacing the Council Recommendation of 22 April 2013 on establishing a Youth Guarantee (2020/C 372/01). Off. J. Eur. Union 2020, C 372, 1–9. [Google Scholar]
- European Commission. The European Pillar of Social Rights Action Plan; Publications Office of the European Union: Luxembourg, 2021. [Google Scholar] [CrossRef]
- Yates, S.; Payne, M. Not so NEET? A critique of the use of ‘NEET’ in setting targets for interventions with young people. J. Youth Stud. 2006, 9, 329–344. [Google Scholar] [CrossRef]
- Mascherini, M.; Ledermaier, S. Exploring the Diversity of NEETs; Publications Office of the European Union: Luxembourg, 2016. [Google Scholar] [CrossRef]
- Avagianou, A.; Kapitsinis, N.; Papageorgiou, I.; Strand, A.H.; Gialis, S. Being NEET in Youthspaces of the EU South: A post-recession regional perspective. YOUNG 2022, 30, 425–454. [Google Scholar] [CrossRef]
- Barca, F. An Agenda for a Reformed Cohesion Policy: A Place-Based Approach to Meeting European Union Challenges and Expectations; Independent Report prepared at the request of Danuta Hübner, Commissioner for Regional Policy; Brussels, Belgium, 2009. [Google Scholar]
- Schultz, T.W. The Economic Value of Education; Columbia University Press: New York, NY, USA, 1963. [Google Scholar]
- Becker, G.S. Human Capital: A Theoretical and Empirical Analysis, with Special Reference to Education; Columbia University Press: New York, NY, USA, 1964. [Google Scholar]
- Sen, A. Development as Freedom; Oxford University Press: Oxford, UK, 1999. [Google Scholar]
- United Nations Development Programme. Human Development Report 1990: Concept and Measurement of Human Development; Oxford University Press: New York, NY, USA, 1990. [Google Scholar]
- Allmendinger, J. Bildungsarmut: Zur Verschränkung von Bildungs- und Sozialpolitik. Soz. Welt 1999, 50, 35–50. [Google Scholar]
- Allmendinger, J.; Leibfried, S. Education and the welfare state: The four worlds of competence production. J. Eur. Soc. Policy 2003, 13, 63–81. [Google Scholar] [CrossRef]
- Checchi, D. Povertà e istruzione: Alcune riflessioni e una proposta di indicatori. Polit. Econ. 1998, 14, 245–282. [Google Scholar] [CrossRef] [PubMed]
- Cunha, F.; Heckman, J.J.; Lochner, L.; Masterov, D.V. Interpreting the evidence on life cycle skill formation. In Handbook of the Economics of Education; Hanushek, E.A., Welch, F., Eds.; Elsevier: Amsterdam, The Netherlands, 2006; Volume 1, pp. 697–812. [Google Scholar] [CrossRef]
- Cunha, F.; Heckman, J.J. Formulating, identifying and estimating the technology of cognitive and noncognitive skill formation. J. Hum. Resour. 2008, 43, 738–782. [Google Scholar] [CrossRef]
- Istat. Rapporto Annuale 2024: La Situazione del Paese; Istat: Rome, Italy, 2024. [Google Scholar]
- Istituto Nazionale di Statistica (Istat). Misurare la povertà educativa. Risultati e prospettive di lavoro della Commissione scientifica interistituzionale. Available online: https://www.istat.it/evento/misurare-la-poverta-educativa-risultati-e-prospettive-di-lavoro-della-commissione-scientifica-interistituzionale/ (accessed on 12 June 2026).
- Mascherini, M.; Salvatore, L.; Meierkord, A.; Jungblut, J.-M. NEETs—Young People Not in Employment, Education or Training: Characteristics, Costs and Policy Responses in Europe; Publications Office of the European Union: Luxembourg, 2012. [Google Scholar] [CrossRef]
- Carcillo, S.; Fernández, R.; Königs, S.; Minea, A. NEET Youth in the Aftermath of the Crisis: Challenges and Policies. In OECD Social, Employment and Migration Working Papers; OECD Publishing: Paris, France, 2015; Volume No. 164. [Google Scholar] [CrossRef]
- Caroleo, F.E.; Rocca, A.; Mazzocchi, P.; Quintano, C. Being NEET in Europe before and after the economic crisis: An analysis of the micro and macro determinants. Soc. Indic. Res. 2020, 149, 991–1024. [Google Scholar] [CrossRef]
- Lovaglio, P.G.; Berta, P. Personal and regional risk factors of being a NEET: A comparative study in Italy, France and Germany with LFS microdata. Qual. Quant. 2025, 59, 1203–1234. [Google Scholar] [CrossRef]
- Erdogan, E.; Flynn, P.; Nasya, B.; Paabort, H.; Lendzhova, V. NEET rural–urban ecosystems: The role of urban social innovation diffusion in supporting sustainable rural pathways to education, employment, and training. Sustainability 2021, 13, 12053. [Google Scholar] [CrossRef]
- Bynner, J.; Parsons, S. Social exclusion and the transition from school to work: The case of young people not in education, employment, or training (NEET). J. Vocat. Behav. 2002, 60, 289–309. [Google Scholar] [CrossRef]
- Myrdal, G. Economic Theory and Under-Developed Regions; Duckworth: London, UK, 1957. [Google Scholar]
- Krugman, P. Geography and Trade; MIT Press: Cambridge, MA, USA, 1991. [Google Scholar]
- Overman, H.G.; Puga, D. Unemployment clusters across Europe’s regions and countries. Econ. Policy 2002, 17, 115–148. [Google Scholar] [CrossRef]
- Patacchini, E.; Zenou, Y. Spatial dependence in local unemployment rates. J. Econ. Geogr. 2007, 7, 169–191. [Google Scholar] [CrossRef]
- Elhorst, J.P. The mystery of regional unemployment differentials: Theoretical and empirical explanations. J. Econ. Surv. 2003, 17, 709–748. [Google Scholar] [CrossRef]
- Bacher, J.; Koblbauer, C.; Leitgöb, H.; Tamesberger, D. Small differences matter: How regional distinctions in educational and labour market policy account for heterogeneity in NEET rates. J. Labour Mark. Res. 2017, 51, 4. [Google Scholar] [CrossRef]
- Cefalo, R.; Scandurra, R.; Kazepov, Y. Youth labor market integration in European regions. Sustainability 2020, 12, 3813. [Google Scholar] [CrossRef]
- Scandurra, R.; Cefalo, R.; Kazepov, Y. School to work outcomes during the Great Recession, is the regional scale relevant for young people’s life chances? J. Youth Stud. 2021, 24, 441–465. [Google Scholar] [CrossRef]
- Anselin, L. Spatial Econometrics: Methods and Models; Kluwer Academic Publishers: Dordrecht, The Netherlands, 1988. [Google Scholar]
- LeSage, J.P.; Pace, R.K. Introduction to Spatial Econometrics; CRC Press: Boca Raton, FL, USA, 2009. [Google Scholar] [CrossRef]
- Eurostat. NUTS—Nomenclature of Territorial Units for Statistics. Available online: https://ec.europa.eu/eurostat/web/nuts (accessed on 5 April 2026).
- Moran, P.A.P. Notes on continuous stochastic phenomena. Biometrika 1950, 37, 17–23. [Google Scholar] [CrossRef]
- Anselin, L. Local indicators of spatial association—LISA. Geogr. Anal. 1995, 27, 93–115. [Google Scholar] [CrossRef]
- Benjamini, Y.; Hochberg, Y. Controlling the false discovery rate: A practical and powerful approach to multiple testing. J. R. Stat. Soc. Ser. B 1995, 57, 289–300. [Google Scholar] [CrossRef]
- Bottazzi Schenone, M.; Tomaselli, V.; Vichi, M. Uncovering socioeconomic disparities in European regions: A Tucker 3 clustering approach. Qual. Quant. 2026, 60, 11589–11607. [Google Scholar] [CrossRef]
- Fabrizi, E.; Rocca, A. NEET status duration and socio-economic background. Socio-Econ. Plan. Sci. 2024, 95, 101986. [Google Scholar] [CrossRef]
- Mussida, C.; Sciulli, D. Being poor and being NEET in Europe: Are these two sides of the same coin? J. Econ. Inequal. 2023, 21, 463–482. [Google Scholar] [CrossRef] [PubMed]
- Patuelli, R.; Schanne, N.; Griffith, D.A.; Nijkamp, P. Persistence of regional unemployment: Application of a spatial filtering approach to local labor markets in Germany. J. Reg. Sci. 2012, 52, 300–323. [Google Scholar] [CrossRef]
- Barca, F.; McCann, P.; Rodríguez-Pose, A. The case for regional development intervention: Place-based versus place-neutral approaches. J. Reg. Sci. 2012, 52, 134–152, Digital Object Identifier (DOI). [Google Scholar] [CrossRef]
- European Parliament; Council of the European Union. Regulation (EU) 2021/1060 of 24 June 2021 laying down common provisions on the European Regional Development Fund, the European Social Fund Plus, the Cohesion Fund, the Just Transition Fund and the European Maritime, Fisheries and Aquaculture Fund and financial rules for those and for the Asylum, Migration and Integration Fund, the Internal Security Fund and the Instrument for Financial Support for Border Management and Visa Policy. Off. J. Eur. Union 2021, L 231, 159–706. [Google Scholar]
- European Commission. Commission Implementing Decision (EU) 2021/1130 of 5 July 2021 setting out the list of regions eligible for funding from the European Regional Development Fund and the European Social Fund Plus and of Member States eligible for funding from the Cohesion Fund for the period 2021–2027. Off. J. Eur. Union 2021, L 244, 10–20. [Google Scholar]
- European Parliament; Council of the European Union. Regulation (EU) 2021/1057 of 24 June 2021 establishing the European Social Fund Plus (ESF+) and repealing Regulation (EU) No 1296/2013. Off. J. Eur. Union 2021, L 231, 21–59. [Google Scholar]
- European Commission; Directorate-General for Regional and Urban Policy. Ninth Report on Economic, Social and Territorial Cohesion; Publications Office of the European Union: Luxembourg, 2024. [Google Scholar] [CrossRef] [PubMed]
- Pop, D.; Stamos, I. Regional disparities and the localisation of the Sustainable Development Goals in the EU. JCMS J. Common Mark. Stud. 2025, 63, 1052–1079. [Google Scholar] [CrossRef]
Figure 1.
NEET rates across 208 EU Nomenclature of Territorial Units for Statistics level 2 (NUTS 2) regions, 2022. Source: Own elaboration on Eurostat data.
Figure 1.
NEET rates across 208 EU Nomenclature of Territorial Units for Statistics level 2 (NUTS 2) regions, 2022. Source: Own elaboration on Eurostat data.
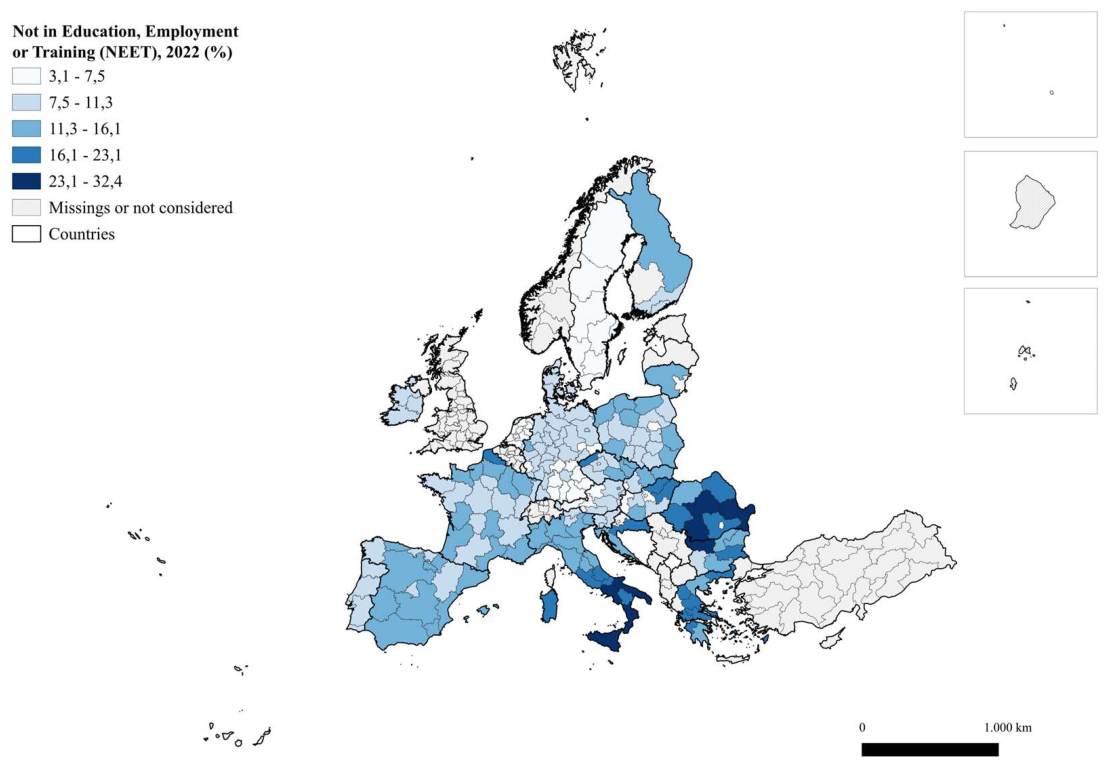
Figure 2.
Local Indicators of Spatial Association (LISA) cluster map of regional NEET rates. Source: Own elaboration on Eurostat data.
Figure 2.
Local Indicators of Spatial Association (LISA) cluster map of regional NEET rates. Source: Own elaboration on Eurostat data.
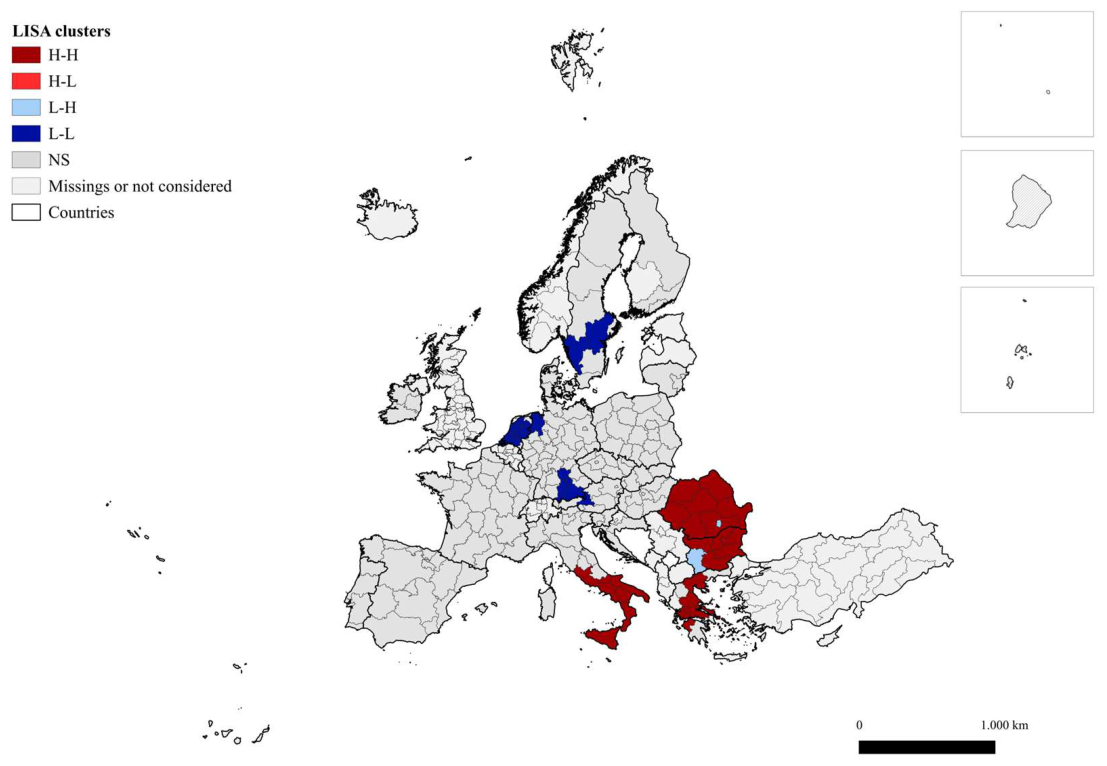
Table 1.
Educational poverty: resources and outcomes.
| Analytical side | Dimension | Examples in the Istat framework |
| Resources | Family context | Material resources; cultural and educational resources |
| School context | Educational provision and learning environment | |
| Territorial, social and cultural context | Accessibility, services and opportunities for participation | |
| Outcomes | Cognitive competences | Knowledge and learning outcomes |
| Personal and social competences | Motivation, relationships, participation and autonomy |
Table 2.
Variables used in the analysis.
| Variable | Description | Unit Measure |
| NEET | Share of young people aged 15–29 neither in employment nor in education or training |
Percentage |
| AROP | At-risk-of-poverty rate | Percentage |
| DISP_INC | Disposable income of private households per inhabitant | EUR / Inhabitant |
| LOW_EDU | Share of population (25–64 years old) with low educational attainment (ISCED 0–2) |
Percentage |
| HIGH_EDU | Share of population (25–64 years old) with high educational attainment (ISCED 5–8) |
Percentage |
| POP_DEN | Population density (inhabitants per km²) | Inhabitant / Km² |
| SERV_PC | Administrative and support service local units per 10,000 inhabitants |
Local unit /10000 Inhabitant |
Source: Own elaboration on Eurostat data.
Table 3.
Descriptive statistics.
| Variable | Mean | SD | Median | Min | Max | Skewness |
| NEET | 11.462 | 5.254 | 10.35 | 3.1 | 32.4 | 1.269 |
| AROP | 16.222 | 6.387 | 14.5 | 3.9 | 37.1 | 1.127 |
| DISP_INC | 18,871.75 | 6,930.06 | 21,150.00 | 5,400.00 | 32,700.00 | -0.317 |
| LOW_EDU | 19.283 | 11.401 | 17.35 | 1.5 | 56.6 | 0.967 |
| HIGH_EDU | 32.607 | 10.084 | 31.85 | 13.7 | 62.1 | 0.487 |
| SERV_PC | 43.595 | 36.674 | 36.013 | 7.613 | 312.285 | 4.486 |
| POP_DEN | 322.837 | 762.476 | 116.1 | 3.5 | 6,086.60 | 5.056 |
Source: Own elaboration on Eurostat data.
Table 4.
LISA statistics and significance levels.
| Moran Scatterplot Quadrant | Total | Significant | Significant (%) | Number of regions by significance level | |||
| p ≤ 0.001 | 0.001 < p ≤ 0.01 | 0.01 < p ≤ 0.05 | NS | ||||
| H-H | 59 | 23 | 38.98 | 8 | 9 | 6 | 36 |
| H-L | 27 | 0 | 0.00 | 0 | 0 | 0 | 27 |
| L-H | 19 | 2 | 10.53 | 0 | 1 | 1 | 17 |
| L-L | 103 | 17 | 16.50 | 0 | 6 | 11 | 86 |
| Total spatial units | 208 | 42 | 20.19 | 8 | 16 | 18 | 166 |
Source: Own elaboration on Eurostat data.
Table 5.
Mann–Whitney U test comparing H-H and L-L clusters.
| Variable | n H-H |
Median H-H (IQR) |
n L-L |
Median L-L (IQR) |
U | Rank-biserial r | BH-adjusted p |
| NEET | 23 | 20.900 (17.200-25.550) |
17 | 4.800 (4.300-6.900) |
391 | 1.000 | <0.001 |
| AROP | 23 | 25.400 (22.350-29.650) |
17 | 13.300 (12.100-15.700) |
383.5 | 0.962 | <0.001 |
| DISP_INC | 23 | 8,900 (6,400-14,800) |
17 | 24,800 (23,500-26,700) |
0 | -1.000 | <0.001 |
| LOW_EDU | 23 | 21.800 (19.150-34.150) |
17 | 19.100 (13.500-19.800) |
308 | 0.575 | 0.0022 |
| HIGH_EDU | 23 | 18.800 (16.750-24.100) |
17 | 40.900 (33.500-45.400) |
8.5 | -0.957 | <0.001 |
| SERV_PC | 23 | 16.853 (12.926-24.246) |
17 | 55.671 (40.302-65.554) |
17 | -0.913 | <0.001 |
| POP_DEN | 23 | 65.600 (53.100-92.450) |
17 | 246.700 (187.200-424.400) |
61 | -0.688 | <0.001 |
Source: Own elaboration on Eurostat data.
Table 6.
Comparison of OLS, SAR and SEM specifications.
| Model / weights | Spatial parameter | Log likelihood | AIC | BIC | Moran I | Permutation p |
| OLS / Queen | - | -524.97 | 1063.94 | 1087.30 | 0.538 | <0.001 |
| SAR / Queen | ρ = 0.519*** | -484.51 | 985.03 | 1011.73 | 0.097 | 0.051 |
| SEM / Queen | λ = 0.703*** | -471.49 | 958.97 | 985.67 | -0.058 | 0.302 |
| SAR / KNN4 | ρ = 0.530*** | -483.79 | 983.58 | 1010.29 | 0.118 | 0.008 |
| SEM / KNN4 | λ = 0.698*** | -475.15 | 966.29 | 992.99 | -0.042 | 0.431 |
Source: Own elaboration on Eurostat data. Note: Maximum-likelihood estimates; 9,999 permutations for residual Moran tests *** p < 0.001.
Table 7.
Spatial error model (SEM) estimates.
| Variable | Queen estimate (SE) | p | KNN4 estimate (SE) | p |
| Intercept | 10.522 (2.380) | <0.001 | 12.884 (2.224) | <0.001 |
| AROP | 0.266 (0.044) | <0.001 | 0.237 (0.042) | <0.001 |
| Income per EUR 10,000 | -2.532 (0.537) | <0.001 | -2.717 (0.527) | <0.001 |
| LOW_EDU | 0.167 (0.030) | <0.001 | 0.167 (0.030) | <0.001 |
| log(SERV_PC) | -0.776 (0.436) | 0.075 | -1.355 (0.421) | 0.001 |
| log(POP_DEN) | 0.220 (0.161) | 0.173 | 0.357 (0.164) | 0.030 |
| Spatial error λ | 0.703 (0.049) | <0.001 | 0.698 (0.052) | <0.001 |
Source: Own elaboration on Eurostat data. Note: Maximum-likelihood standard errors in parentheses.
Disclaimer/Publisher’s Note: The statements, opinions and data contained in all publications are solely those of the individual author(s) and contributor(s) and not of MDPI and/or the editor(s). MDPI and/or the editor(s) disclaim responsibility for any injury to people or property resulting from any ideas, methods, instructions or products referred to in the content. |
© 2026 by the authors. Licensee MDPI, Basel, Switzerland. This article is an open access article distributed under the terms and conditions of the Creative Commons Attribution (CC BY) license (http://creativecommons.org/licenses/by/4.0/).
Copyright: This open access article is published under a Creative Commons CC BY 4.0 license, which permit the free download, distribution, and reuse, provided that the author and preprint are cited in any reuse.