

Submitted:
30 September 2026
Posted:
01 October 2026
You are already at the latest version
Abstract
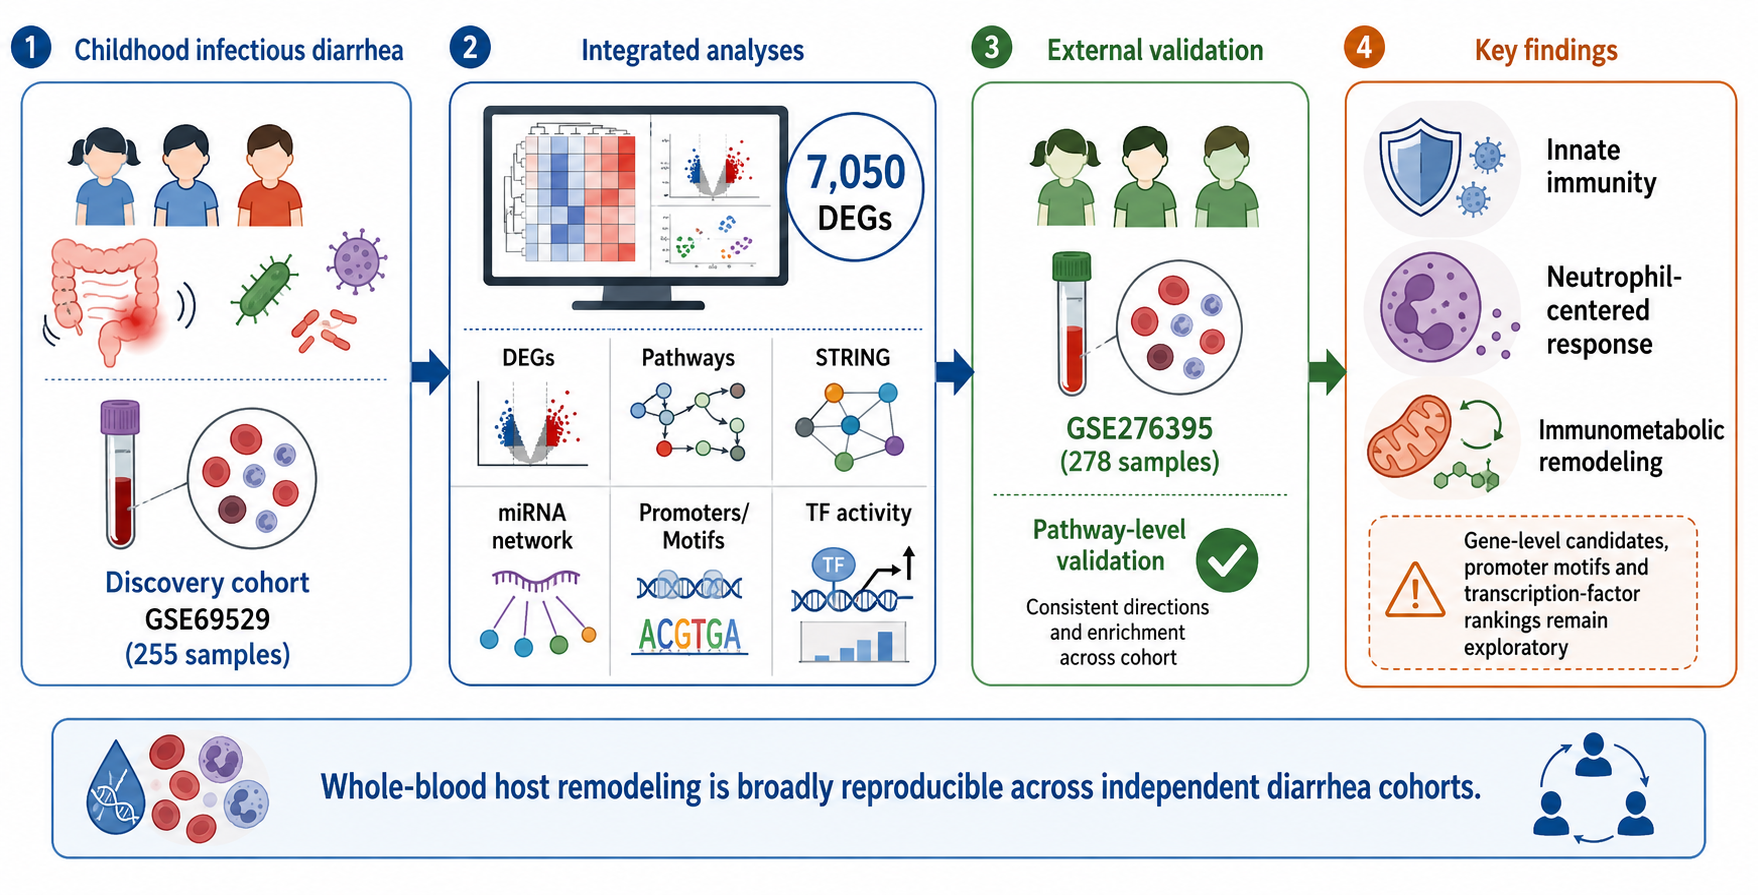
Background: Childhood infectious diarrhea elicits systemic host responses, but computational findings from public transcriptomic data require independent validation. Methods: We reanalyzed the pediatric whole-blood RNA-sequencing dataset GSE69529 using differential-expression, functional-enrichment, protein-association, miRNA-network, promoter-sequence, motif, and transcription-factor activity analyses. Pathway-level external validation used the independent whole-blood cohort GSE276395, comprising 278 samples from multiple diarrhea groups and healthy controls. Results: We identified 7,050 differentially expressed genes among 15,740 analyzed genes at adjusted P < 0.05. Enrichment implicated immune signaling, RNA metabolism, cell-cycle control, intracellular organization, apoptosis, membrane trafficking, and metabolism. Protein-association and experimentally supported miRNA-gene networks were broadly connected. Promoter composition was similar between regulatory directions; AME identified no differentially enriched HOCOMOCO motifs, STREME candidates failed the prespecified E-value threshold, and no CollecTRI-ULM regulator remained significant after false-discovery-rate correction. The independent cohort reproduced innate-immune, neutrophil-centered, and immunometabolic themes, but its 12-gene signature did not overlap the 12 discovery candidates or validate CFTR- or SLC26A3-linked hypotheses. Conclusions: Broad whole-blood host remodeling is supported across cohorts, whereas gene-, motif-, and regulator-level findings remain exploratory and require experimental validation.
Keywords:
infectious diarrhea
; RNA sequencing
; transcriptomics
; external validation
; functional enrichment
; regulatory networks
; promoter analysis
; transcription-factor activity
1. Introduction
Diarrheal diseases remain a major cause of morbidity and mortality in children, especially in low-resource settings. Beyond fluid loss, acute infectious diarrhea produces systemic immune and metabolic responses that can be detected in peripheral blood. Whole-blood transcriptomics therefore offers a complementary approach for characterizing host responses, identifying pathway-level alterations, and generating candidate biomarkers when pathogen-specific diagnosis is incomplete or delayed [1].
The GSE69529 study profiled whole blood from children with diarrhea caused by rotavirus, Escherichia coli, Salmonella, Shigella, adenovirus, or norovirus, together with healthy controls. The original analysis demonstrated shared and organism-specific host-response signatures, including neutrophil-, inflammasome-, chemokine-, and interferon-related programs [1,2]. Reanalysis of this cohort can extend the original findings by integrating functional enrichment, network topology, regulatory interactions, and promoter-level analyses within a single workflow. However, reuse of one discovery cohort cannot independently validate new regulatory claims. The independent clinical cohort GSE276395 profiled whole blood from 278 predominantly older patients and controls across toxigenic and non-toxigenic Clostridioides difficile, inflammatory bowel disease, diarrhea from other causes, and healthy-control groups. It reported shared neutrophil-centered innate-immune and immunometabolic responses and therefore provides an external test of whether broad blood-response programs replicate across age, geography, platform, and disease composition [26,27].
CFTR and SLC26A3 are mechanistically relevant to diarrheal physiology because they regulate opposing components of intestinal chloride movement: CFTR supports chloride secretion, whereas SLC26A3/DRA supports chloride-bicarbonate exchange and absorptive ion transport. Their activity is influenced by enteric toxins, inflammation, epithelial signaling, and post-transcriptional regulation [3,4]. However, the discovery dataset is derived from whole blood rather than intestinal epithelium, and the independent validation cohort was also blood based. These genes were therefore treated only as mechanistic reference points and not as validated determinants of the transcriptomic response.
This study aimed to characterize differentially expressed genes and functional pathways in childhood infectious diarrhea; integrate protein associations, miRNA-gene networks, promoter composition, known and de novo motif analyses, and transcription-factor activity inference; and test the principal biological interpretation against an independent clinical whole-blood cohort. The prespecified objective of external validation was to assess reproducibility of broad host-response programs while distinguishing replicated pathway-level findings from unvalidated gene- and regulator-level hypotheses.
2. Materials and Methods
2.1. Dataset Retrieval and Study Design
Human whole-blood RNA-sequencing data were obtained from the NCBI Gene Expression Omnibus series GSE69529. The series contains 255 samples from 246 children, including diarrhea associated with rotavirus, E. coli, Salmonella, Shigella, adenovirus, and norovirus, and control children [2]. Samples were grouped as diarrheal disease or healthy control according to the GEO metadata. The disease group was defined as the numerator so that positive log2 fold-change values represented higher expression in diarrheal disease.
2.2. Differential-Expression Analysis
Differential expression was evaluated using GEO2R. For RNA-sequencing series, GEO2R uses DESeq2 with NCBI-computed raw count matrices and reports Wald-test statistics for two-group comparisons [5,6]. Benjamini-Hochberg correction was used to control the false discovery rate [7]. Genes with adjusted P < 0.05 were considered differentially expressed; regulatory direction was defined by the sign of log2 fold change. Records without valid gene symbols and duplicate gene identifiers were removed. Representative top-gene visualizations used 50 upregulated and 50 downregulated genes ranked by adjusted significance and fold-change magnitude.
2.3. Functional Enrichment and Comparative Annotation
Upregulated and downregulated genes were analyzed separately for Gene Ontology Biological Process, Molecular Function, and Cellular Component terms, together with PANTHER and Reactome pathways [8,9,10]. Where available, KEGG, WikiPathways, tissue-expression, subcellular-localization, phenotype, and UniProt keyword annotations were included [12,13]. Gene symbols were mapped to Entrez identifiers with biomaRt and org.Hs.eg.db. Enrichment results were ranked by false-discovery-rate significance and summarized with dot, bar, lollipop, and overlap plots using clusterProfiler and related R packages [11]. Each graphical panel was limited to the most informative categories to preserve legibility.
2.4. Protein-Association Network Analysis
Protein-association networks were generated with STRING using Homo sapiens as the reference organism and visualized in Cytoscape [14,15]. STRING edges were interpreted as functional associations supported by curated databases, experiments, co-expression, text mining, and other evidence channels rather than as direct physical binding in every case. Network structure and highly connected regions were used to prioritize candidates for biological interpretation.
2.5. Enrichment-Metric PCA, Regression, and Correlation
Principal component analysis was performed on enrichment-level numerical variables, including fold enrichment, observed and expected counts, reference count, observed-to-expected ratio, FDR, and -log10(FDR). The analysis therefore characterizes functional-enrichment structure rather than patient-level expression clustering. Linear regression assessed the association between fold enrichment and -log10(FDR), separately and jointly by regulatory direction. Spearman correlation matrices and a Pearson correlation analysis were used to summarize relationships among enrichment variables.
2.6. miRNA-Gene Interaction Networks
Upregulated and downregulated gene lists were analyzed separately in NetworkAnalyst [16]. Experimentally supported miRNA-gene interactions were obtained from miRTarBase v9.0 and TarBase v9.0 [17,18]. For each database and regulatory direction, the largest connected subnetwork was retained. Node and edge counts, mapped seed coverage, diameter, radius, average shortest-path length, degree distribution, betweenness distribution, and clustering coefficient were recorded. Degree and betweenness were interpreted as measures of hub connectivity and bridge-like network position, respectively; network topology was calculated through the platform’s igraph-based workflow [19].
2.7. Promoter Mapping and Sequence Composition
Strand-aware promoter intervals were generated against the GRCh38/hg38 human reference assembly [20]. Each interval spanned 2,000 bp upstream and 500 bp downstream of the annotated transcription start site. Standard chromosomes were retained, and promoter sequences were extracted in transcriptional orientation. The complete directional sets included genes with valid symbols and positive or negative log2 fold changes; statistical significance was not required for this descriptive promoter-composition analysis. Chromosomal distributions were summarized as raw counts and within-group percentages. GC content was calculated for each 2,500-bp promoter and compared between regulatory groups using a Wilcoxon rank-sum test.
2.8. Known and De Novo Motif Analysis
Known motif enrichment was tested with AME using Fisher’s exact test, maximum-odds scoring, and the HOCOMOCO v12 CORE human/mouse motif collection [21,22]. Analyses were performed in both directions using the complete directional promoter sets: upregulated promoters versus downregulated promoters and the reverse comparison. De novo motif discovery used STREME with balanced sets of 448 upregulated and 448 downregulated promoters selected at adjusted P < 0.05 and |log2 fold change| >= 0.5, motif widths of 6-20 bp, and an E-value threshold of 0.05 [23]. Candidate motifs not passing the corrected threshold were treated as exploratory.
2.9. Transcription-Factor Activity Inference
Transcription-factor activity was inferred from the complete signed DESeq2 statistic using the univariate linear model in decoupleR and signed TF-target relationships from CollecTRI [24,25]. Regulons with fewer than five overlapping targets were excluded. Positive ULM scores indicate relatively increased inferred activity in diarrheal disease, whereas negative scores indicate relatively reduced activity. P values were adjusted by the Benjamini-Hochberg method. These estimates were interpreted as computational hypotheses, not direct measurements of TF abundance, phosphorylation, localization, or DNA binding.
2.10. Software and Figure Preparation
Data cleaning, statistical analysis, and plotting were performed in RStudio using R version 4.6.0 and the readxl, dplyr, tidyr, ggplot2, ggrepel, stringr, broom, Biostrings, rtracklayer, and related packages. Network visualization used Cytoscape 3.10.4. Composite figures were assembled in 64-bit Python 3.14 and exported at publication resolution. Red/orange denotes upregulated features, blue/cyan denotes downregulated features, and grey/black denotes non-significant observations unless otherwise stated.
2.11. External Cohort Validation and Cross-Study Concordance
An independent clinical whole-blood transcriptomic cohort, GSE276395, was used for external pathway-level validation [26,27]. The cohort contains 278 microarray profiles: 78 baseline toxigenic C. difficile infection samples, 45 diarrhea-control samples from other causes, 37 non-toxigenic C. difficile samples, 40 inflammatory-bowel-disease samples, 51 healthy-control samples, and 27 follow-up samples from patients with toxigenic C. difficile infection. Because the validation cohort differs from GSE69529 in age distribution, clinical setting, assay platform, and etiologic composition, validation was prespecified as cross-study biological concordance rather than pooled effect-size meta-analysis. The validation criteria were: (i) independent replication of innate-immune, neutrophil-related, and immunometabolic programs across diarrhea etiologies; (ii) confirmation that these programs were observed in an independently recruited patient cohort; and (iii) explicit non-validation of individual genes or regulators when gene-level concordance was absent. The published GSE276395 results were evaluated using its cross-etiology set of 2,255 common differentially expressed genes, the stricter 362-gene set obtained at false-discovery-rate-adjusted P < 0.05 and |log2 fold change| > 0.5, and the 12 recurrent high-fold-change genes. The 12-gene external signature was compared with the 12 candidate genes highlighted in the discovery interpretation. This assessment did not constitute experimental validation of intestinal epithelial regulation.
3. Results
3.1. Dataset Structure and Differential-Expression Profile
GSE69529 contains whole-blood transcriptomes from children with pathogen-confirmed infectious diarrhea and control children. The UMAP projection showed broad disease-associated structure but incomplete separation, consistent with heterogeneous pathogens and variable systemic responses. Sample-level count distributions were generally comparable, supporting downstream analysis. Differential-expression analysis identified 7,050 significant genes among 15,740 analyzed genes at adjusted P < 0.05. The mean-difference and volcano plots showed both induction and repression across the expression range (Figure 1).
The adjusted-P-value histogram was strongly concentrated near zero, and the dispersion plot showed gene-wise estimates distributed around the fitted trend. For focused visualization, 50 upregulated and 50 downregulated genes were selected. Their fold-change profile showed a wider positive than negative range in the representative subset (Figure 2).
Hierarchical clustering organized the selected genes into coordinated expression blocks. The MA and volcano summaries confirmed that substantial changes occurred across a range of mean expression levels. These patterns support broad, coordinated host transcriptional remodeling rather than isolated changes in a few genes (Figure 3).
3.2. Functional Enrichment of Upregulated and Downregulated Genes
Upregulated genes were enriched for broad metabolic and macromolecule-processing terms, intracellular and organelle-associated components, and binding-related molecular functions. PANTHER and Reactome results additionally highlighted apoptosis/FAS signaling, chemokine-related pathways, immune-system activity, cell-cycle regulation, protein metabolism, receptor-tyrosine-kinase signaling, Rho GTPases, and RNA metabolism. These findings are consistent with activation of host defense, cellular stress, trafficking, and regulatory programs. The principal enriched GO and pathway terms are summarized in Table 1.
Downregulated genes showed substantial enrichment for metabolic and macromolecule-processing terms, intracellular organelle and nuclear compartments, binding and RNA-related functions, and signaling pathways including Ras, VEGF, T-cell activation, gene expression, RNA metabolism, and immune-system modules. The findings indicate selective suppression within immune, transcriptional, and intracellular regulatory programs rather than a globally inactive downregulated set. The principal downregulated GO and pathway terms are summarized in Table 2, and the direction-specific functional enrichment results are shown in Figure 4.
3.3. Comparative Enrichment and Multi-Database Annotation
Comparative overlap analysis identified 67 terms unique to the upregulated set, 70 terms unique to the downregulated set, and 103 shared terms. Shared terms reflected common cellular programs affected in both directions, whereas direction-specific terms captured differential pathway engagement. Intracellular anatomical structures, membrane-bounded organelles, binding, protein binding, nuclear and cytoplasmic compartments, and metabolic processes were among the strongest combined features (Figure 5 and Figure 6). The numbers of enriched terms by regulatory direction and annotation category are summarized in Table 3.
Multi-database integration expanded the functional context to KEGG, WikiPathways, tissue expression, subcellular localization, phenotype, and protein-keyword annotations. The upregulated profile emphasized signaling, endocytosis, pathogen-associated responses, metabolism, phosphorylation, and intracellular localization. The downregulated profile emphasized transcription, RNA metabolism, intracellular organelles, immune regulation, and selected phenotype-related terms (Figure 7).
3.4. Protein-Association Networks
STRING-based networks showed interconnected components among selected upregulated and downregulated proteins, with several highly connected nodes and dense local regions. These networks provide functional-association context but do not establish direct physical interactions for every edge. The compartment-correlation panel further indicated coordinated variation among selected localization-related enrichment measures (Figure 8).
3.5. PCA, Regression, and Correlation of Enrichment Metrics
PCA of enrichment metrics showed partially overlapping but directionally structured distributions. The score and loading plots identified terms contributing to separation, whereas the scree plot showed that variance was distributed across several components. Because the input comprised enrichment statistics, these components describe functional-profile structure rather than patient-level clustering (Figure 9).
Regression analyses showed an inverse relationship between fold enrichment and -log10(FDR), with differences in strength and dispersion between regulatory directions. The combined Pearson analysis indicated a modest negative association (r = -0.354, P = 1.65 x 10^-13), showing that larger fold-enrichment estimates were not necessarily accompanied by stronger adjusted significance. Correlation analyses also demonstrated expected dependencies among observed counts, expected counts, reference size, fold enrichment, and significance metrics (Figure 10 and Figure 11).
3.6. Experimentally Supported miRNA-Gene Networks
All four NetworkAnalyst analyses generated one dominant connected subnetwork containing most mapped seed genes. For upregulated genes, miRTarBase produced 8,774 nodes and 172,191 edges, whereas TarBase produced 8,356 nodes and 688,995 edges. For downregulated genes, miRTarBase produced 7,684 nodes and 147,440 edges, and TarBase produced 7,068 nodes and 586,923 edges. The larger TarBase edge counts are consistent with broader interaction coverage rather than an independent biological increase in connectivity. The topological characteristics of these subnetworks are summarized in Table 4.
Degree distributions were strongly right-skewed, showing that most nodes had relatively few interactions while a small number formed high-degree hubs. Betweenness values were concentrated near zero with a limited high-centrality tail, indicating a small number of potential bridge nodes. TarBase networks had shorter average path lengths than miRTarBase networks, consistent with denser network coverage. The clustering coefficient was 0.0 in all four outputs, which is compatible with the largely bipartite miRNA-gene architecture (Figure 12 and Figure 13).
3.7. Promoter Mapping and Sequence Composition
Across genes with valid promoter mappings and directional log2 fold changes, promoter coordinates were generated for 7,470 genes with positive values and 6,196 genes with negative values. These complete directional sets were used for descriptive chromosome and GC-content comparisons, whereas the STREME analysis used balanced significant subsets. Chromosome 1 contained the largest number in both groups, but normalization within each group produced nearly overlapping chromosome profiles. The GC-content distributions were likewise similar. Median GC content was 51.9% for promoters in the positive-direction group and 51.8% for promoters in the negative-direction group. Although the Wilcoxon test detected a difference (W = 22,580,468; P = 0.01444), the absolute median difference was only 0.1 percentage points and was biologically small (Figure 14).
3.8. Known and De Novo Motif Analyses
AME evaluated 1,443 HOCOMOCO v12 CORE motifs in reciprocal comparisons of the complete positive- and negative-direction promoter sets. No enriched-motif rows were reported in either direction, indicating that no known HOCOMOCO motif satisfied the selected AME reporting criteria. Subsequent STREME analysis using balanced sets of 448 upregulated and 448 downregulated promoters identified several candidate de novo sequence patterns (Table 5; Figure 15). When upregulated promoters were used as the primary sequences, the leading motifs were CAGGAGAG, CAGCAGCAC, CAAAACCCTA, CAGATCTCA, and GGGCTGGGAGGGA. The highest-ranked candidate, CAGGAGAG, occurred in 210 of 448 promoters (46.9%) and showed nominal enrichment (P = 0.013; E = 0.067). In the reciprocal analysis, the leading motifs were CATGGTGAAACCCCGC, AATTTTAATT, ATACATATATAGGAR, GTGAAATAAA, GTTCCTATGATC, and AAATGGAAGTGWT. However, none of the motifs in either comparison reached the prespecified corrected significance threshold of E ≤ 0.05. Because STREME recommends interpreting the E-value rather than the unadjusted P value when multiple motifs are reported, these patterns were considered exploratory rather than statistically supported group-specific regulatory elements. Overall, the results provide no robust evidence that a single dominant promoter motif distinguishes the upregulated and downregulated gene sets under the examined promoter definition.
3.9. Transcription-Factor Activity Inference
CollecTRI-ULM produced a ranked set of candidate regulators. GATA3 had the highest positive score, followed by CRX, SMARCB1, SOX2, KLF4, GRHL3, AHR, NR1I3, ARNT, and ENO1. ELK3, HESX1, ETV6, TLX1, ZNF350, and TSC22D1 were among the most negative scores. However, no TF passed FDR correction, and the activity-versus-regulon-size analysis showed the same absence of adjusted statistical support.
CollecTRI links identified candidate regulators associated with CFTR and SLC26A3. Positive CFTR-linked scores included SP1, FOXA2, PBX1, YY1, SP3, and CEBPD, whereas KAT7, CUX1, TBP, CTCF, and TFAP2A showed negative scores. For SLC26A3, GATA1, YY1, ETS1, and YBX1 had positive scores, while TBP, HMGA1, POU2F2, CIITA, and FOS had negative scores. Because none was significant after multiple-testing correction, these rankings are intended for prioritization and experimental validation rather than confirmation of active regulation (Figure 16).
3.10. External Cohort Validation
The independent GSE276395 cohort reproduced the principal pathway-level interpretation of the discovery analysis. Across four diarrhea groups, 2,255 differentially expressed genes were common relative to healthy controls, and neutrophil degranulation and innate immune response were the strongest shared Reactome programs. Applying the stricter |log2 fold change| > 0.5 criterion retained 362 common genes, while immunometabolic dysregulation remained prominent [26,27]. The external study’s 12 recurrent high-fold-change genes—ANKRD22, ANXA3, CD177, CEACAM8, DEFA4, GALNT14, HP, LTF, MGAM2, MMP8, OLFM4, and SLC26A8—were all associated with neutrophil functions. None overlapped the 12 genes highlighted in the present discovery interpretation (ABCC3, ABCA7, APOBR, APOBEC3H, ADORA2A, NFKBIZ, DEFA1B, CASP9, COQ4, CRLS1, CD44, and ANXA1). Thus, the external cohort validates the broad innate-immune, neutrophil-centered, and immunometabolic blood response but does not validate the individual discovery candidates or the CFTR- and SLC26A3-linked transcription-factor rankings (Table 6).
3.11. Integrated Biological Interpretation
Together, the discovery and external-validation analyses indicate that infectious diarrhea is associated with broad whole-blood transcriptional remodeling across immune signaling, RNA metabolism, cell-cycle regulation, intracellular organization, apoptosis, trafficking, and metabolic pathways. Independent replication of innate-immune, neutrophil-centered, and immunometabolic programs supports the pathway-level interpretation. In contrast, the promoter, motif, transcription-factor, and highlighted candidate-gene findings remain exploratory because they lacked adjusted statistical support, gene-level external concordance, or tissue-specific biological validation.
4. Discussion
This integrated analysis extends the original GSE69529 study by combining differential expression with multi-database enrichment and several regulatory layers and by testing its principal biological interpretation against an independent clinical cohort. The large number of significant genes and the enrichment of immune, RNA-processing, cell-cycle, organelle, and metabolic terms are consistent with a systemic host response involving changes in leukocyte composition and activation state. The original pediatric cohort showed that neutrophil-associated variation was a major driver of the whole-blood transcriptome and that Salmonella, Shigella, and rotavirus produced partially distinct signatures [1]. Accordingly, the disease-versus-control contrast should be interpreted as a shared response across heterogeneous infectious etiologies.
The independent GSE276395 cohort provides clinically independent pathway-level validation. Despite substantial differences in age, geography, platform, and disease composition, all diarrhea groups in that study shared neutrophil-degranulation and innate-immune programs, together with immunometabolic dysregulation [26,27]. This cross-cohort concordance supports the conclusion that broad peripheral-blood remodeling is reproducible and not restricted to one pediatric RNA-sequencing dataset. At the same time, the absence of overlap between the two highlighted 12-gene sets argues against presenting individual discovery candidates as validated biomarkers. The external cohort therefore strengthens the general biological conclusion while narrowing the defensible scope of gene-specific claims.
The enrichment results reveal simultaneous activation and suppression of related biological systems. Upregulated genes emphasized inflammatory signaling, apoptosis, endocytosis, cellular stress, and cell-cycle programs, whereas downregulated genes retained strong enrichment for RNA metabolism, transcription, immune regulation, and organelle organization. Overlap between the two directions is expected because gene sets can affect different components of the same pathway, and broad annotation categories contain both positive and negative regulators. The comparative framework is therefore more informative than interpreting either direction in isolation.
The large miRNA-gene networks show that the DEG sets are embedded within extensive experimentally supported post-transcriptional systems. Right-skewed degree distributions are typical of biological networks and identify a small set of hubs, while high-betweenness nodes may connect regulatory modules. However, database size and curation strategy strongly influence network density. The roughly fourfold higher TarBase edge count should not be interpreted as stronger biological regulation than miRTarBase; it primarily reflects resource coverage.
Promoter analyses showed nearly identical chromosome and GC-content distributions, which reduces concern that gross sequence composition explains the regulatory-direction differences. The absence of significant AME motifs and the borderline STREME findings indicate that a single common promoter motif is unlikely to account for the observed gene-expression pattern within the -2,000/+500-bp window. Regulatory divergence may instead depend on combinations of weak motifs, distal enhancers, chromatin accessibility, cofactors, cell-type-specific binding, and post-transcriptional mechanisms.
The CollecTRI-ULM ranking offers candidate transcription factors for follow-up but does not establish activity because no regulator passed false-discovery-rate correction. Similarly, CFTR- and SLC26A3-linked rankings are hypothesis-generating. Neither gene was validated mechanistically by the independent blood cohort, and their intestinal roles cannot be resolved from whole-blood data. Biological validation should prioritize intestinal epithelial cells or organoids, reporter assays, perturbation experiments, ATAC-seq, ChIP-seq, and pathogen-stratified pediatric cohorts.
Candidate genes highlighted across the transcriptomic and network analyses, including ABCC3, ABCA7, APOBR, APOBEC3H, ADORA2A, NFKBIZ, DEFA1B, CASP9, COQ4, CRLS1, CD44, and ANXA1, should be regarded as discovery-stage candidates rather than diagnostic, prognostic, or therapeutic markers. None overlapped the independent cohort’s 12 recurrent high-fold-change genes. Their biological and clinical relevance requires direct replication in additional pediatric cohorts, careful adjustment for leukocyte composition, pathogen-specific subgroup analysis, and experimental verification.
4.1. Study Limitations
The discovery analysis is based on secondary analysis of a heterogeneous pediatric whole-blood cohort and does not measure intestinal epithelial expression directly. The disease group combines bacterial and viral etiologies, and residual technical or clinical heterogeneity may influence the results. The independent validation cohort improves evidential support but is predominantly older, hospital based, microarray profiled, and clinically different from GSE69529; validation is therefore restricted to broad pathway-level concordance. The validation assessment used the published differential-expression and pathway results rather than a harmonized raw-data meta-analysis. Enrichment analyses depend on database coverage and category redundancy, and network edges integrate evidence from many tissues and experimental contexts. Promoter analysis was restricted to one proximal interval and did not evaluate distal enhancers, chromatin accessibility, DNA methylation, or three-dimensional contacts. AME, STREME, and CollecTRI-ULM results were negative or exploratory after multiple-testing correction. No in vitro or in vivo validation was performed, and no individual gene, motif, transcription factor, CFTR-linked mechanism, or SLC26A3-linked mechanism should be considered validated.
5. Conclusions
Childhood infectious diarrhea is associated with extensive whole-blood transcriptional remodeling involving immune, metabolic, RNA-processing, cell-cycle, and intracellular-organization programs. An independent clinical cohort supports the reproducibility of the broad innate-immune, neutrophil-centered, and immunometabolic response across different ages, platforms, and diarrhea etiologies. In contrast, promoter composition was similar between regulatory groups, motif enrichment and transcription-factor activity were not statistically robust, and highlighted candidate genes did not replicate in the independent 12-gene signature. The evidence therefore supports a distributed, context-dependent systemic host response, while gene-specific and intestinal regulatory hypotheses require further pediatric-cohort and biological validation.
Author Contributions
Conceptualization, A.A., M.A., Z.H. and S.Z.; Methodology, A.A., M.A. and R.R.; Software, A.A.; Validation, M.A., R.R., H.H., W.Y. and D.X.; Formal Analysis, A.A., M.A., R.R. and D.X.; Investigation, H.H. and D.X.; Data Curation, A.A., M.A. and H.H.; Writing—Original Draft Preparation, A.A. and M.A.; Writing—Review and Editing, R.R., H.H., W.Y., D.X., Z.H. and S.Z.; Visualization, A.A., M.A. and W.Y.; Supervision, Z.H. and S.Z.; Project Administration, Z.H. and S.Z. A.A. and M.A. contributed equally to this work. All authors have read and agreed to the published version of the manuscript.
Funding
This research was funded by the National Natural Science Foundation of China, grant numbers 32372973 and 32260870; Central Guidance for Local Technology Development Fund, grant number 2025YD013; Scientific and Technological Project Plan of the Corps, grant number 2022DB018; National Science and Technology Basic Resources Survey Special Project, grant number 2022xjkk050203; Tianshan Talent Support Program for Young Technology Top Talents, grant number CZ004001; Corps Five Common One Promotion Project, grant numbers CZ003802 and CZ004310; and National Undergraduate Innovation and Entrepreneurship Training Program, grant number 202310759001.
Institutional Review Board Statement
Ethical review and approval were waived for this study because it was a secondary analysis of de-identified, publicly available data and involved no new recruitment or collection of biological specimens. Ethical approval for GSE69529 was obtained by the original investigators as described in the source publication. The GSE276395 clinical study was approved by the National Health Service Ethics Committee (08/H1005/32).
Informed Consent Statement
Informed consent was obtained by the original investigators for participants included in GSE69529 and GSE276395, as reported in the source publications.
Data Availability Statement
The discovery RNA-sequencing data are publicly available in the NCBI Gene Expression Omnibus under accession GSE69529. The independent validation microarray cohort is publicly available under accession GSE276395. Derived tables and figures supporting the discovery analyses are included in the article and associated supplementary files. Analysis scripts are available from the corresponding authors upon reasonable request.
Acknowledgments
The authors gratefully acknowledge the investigators who generated and deposited the GSE69529 pediatric whole-blood RNA-sequencing dataset and the GSE276395 independent clinical whole-blood microarray dataset. The authors also acknowledge the State International Joint Research Center for Animal Health Breeding and the College of Animal Science and Technology, Shihezi University, for providing the institutional environment supporting this research. During the preparation of this manuscript, the authors used ChatGPT (OpenAI) for language editing and document formatting. No generative AI was used to generate or analyze the underlying research data. The authors reviewed and edited the output and take full responsibility for the content of this publication.
Conflicts of Interest
The authors declare no conflicts of interest.
References
- DeBerg, H.A.; Zaidi, M.B.; Altman, M.C.; et al. Shared and organism-specific host responses to childhood diarrheal diseases revealed by whole-blood transcript profiling. PLoS ONE 2018, 13, e0192082. [Google Scholar] [CrossRef] [PubMed]
- National Center for Biotechnology Information. GEO Series GSE69529: Elucidating the etiology and molecular pathogenicity of infectious diarrhea by high-throughput RNA sequencing. Gene Expression Omnibus. Available online: https://www.ncbi.nlm.nih.gov/geo/query/acc.cgi?acc=GSE69529 (accessed on 1 July 2026).
- Thiagarajah, J.R.; Donowitz, M.; Verkman, A.S. Secretory diarrhoea: mechanisms and emerging therapies. Nat. Rev. Gastroenterol. Hepatol. 2015, 12, 446–457. [Google Scholar] [CrossRef] [PubMed]
- Haggie, P.M.; Cil, O.; Lee, S.; Tan, J.A.; Rivera, A.A.; Phuan, P.W.; Verkman, A.S. SLC26A3 inhibitor identified in a small-molecule screen blocks colonic fluid absorption and reduces constipation. JCI Insight 2018, 3, e121370. [Google Scholar] [CrossRef] [PubMed]
- National Center for Biotechnology Information. About GEO2R. Gene Expression Omnibus. Available online: https://www.ncbi.nlm.nih.gov/geo/info/geo2r.html (accessed on 1 July 2026).
- Love, M.I.; Huber, W.; Anders, S. Moderated estimation of fold change and dispersion for RNA-seq data with DESeq2. Genome Biol. 2014, 15, 550. [Google Scholar] [CrossRef] [PubMed]
- Benjamini, Y.; Hochberg, Y. Controlling the false discovery rate: a practical and powerful approach to multiple testing. J. R Stat. Soc. Ser. B Stat. Methodol. 1995, 57, 289–300. [Google Scholar] [CrossRef]
- Gene Ontology Consortium. The Gene Ontology knowledgebase in 2026. Nucleic Acids Res. 2026, 54, D1779–D1792. [Google Scholar] [CrossRef] [PubMed]
- Mi, H.; Ebert, D.; Muruganujan, A.; et al. PANTHER version 16: a revised family classification, tree-based classification tool, enhancer regions and extensive API. Nucleic Acids Res. 2021, 49, D394–D403. [Google Scholar] [CrossRef] [PubMed]
- Ragueneau, E.; Gong, C.; Sinquin, P.; et al. The Reactome Knowledgebase 2026. Nucleic Acids Res. 2026, 54, D673–D681. [Google Scholar] [CrossRef] [PubMed]
- Wu, T.; Hu, E.; Xu, S.; et al. clusterProfiler 4.0: a universal enrichment tool for interpreting omics data. Innovation (Camb) 2021, 2, 100141. [Google Scholar] [CrossRef] [PubMed]
- Martens, M.; Ammar, A.; Riutta, A.; et al. WikiPathways: connecting communities. Nucleic Acids Res. 2021, 49, D613–D621. [Google Scholar] [CrossRef] [PubMed]
- UniProt Consortium. UniProt: the Universal Protein Knowledgebase in 2025. Nucleic Acids Res. 2025, 53, D609–D617. [Google Scholar] [CrossRef] [PubMed]
- Szklarczyk, D.; Nastou, K.; Koutrouli, M.; et al. The STRING database in 2025: protein networks with directionality of regulation. Nucleic Acids Res. 2025, 53, D730–D737. [Google Scholar] [CrossRef] [PubMed]
- Shannon, P.; Markiel, A.; Ozier, O.; et al. Cytoscape: a software environment for integrated models of biomolecular interaction networks. Genome Res. 2003, 13, 2498–2504. [Google Scholar] [CrossRef] [PubMed]
- Zhou, G.; Soufan, O.; Ewald, J.; Hancock, R.E.W.; Basu, N.; Xia, J. NetworkAnalyst 3.0: a visual analytics platform for comprehensive gene-expression profiling and meta-analysis. Nucleic Acids Res. 2019, 47, W234–W241. [Google Scholar] [CrossRef] [PubMed]
- Huang, H.Y.; Lin, Y.C.D.; Cui, S.; et al. miRTarBase update 2022: an informative resource for experimentally validated miRNA-target interactions. Nucleic Acids Res. 2022, 50, D222–D230. [Google Scholar] [CrossRef] [PubMed]
- Skoufos, G.; Kakoulidis, P.; Tastsoglou, S.; et al. TarBase-v9.0 extends experimentally supported miRNA-gene interactions to cell types and virally encoded miRNAs. Nucleic Acids Res. 2024, 52, D304–D310. [Google Scholar] [CrossRef] [PubMed]
- Csardi, G.; Nepusz, T. The igraph software package for complex network research. InterJournal Complex Syst. 2006, 1695. Available online: https://igraph.org/.
- Schneider, V.A.; Graves-Lindsay, T.; Howe, K.; et al. Evaluation of GRCh38 and de novo haploid genome assemblies demonstrates the enduring quality of the reference assembly. Genome Res. 2017, 27, 849–864. [Google Scholar] [CrossRef] [PubMed]
- McLeay, R.C.; Bailey, T.L. Motif enrichment analysis: a unified framework and an evaluation on ChIP data. BMC Bioinform. 2010, 11, 165. [Google Scholar] [CrossRef] [PubMed]
- Vorontsov, I.E.; Eliseeva, I.A.; Zinkevich, A.; et al. HOCOMOCO in 2024: a rebuild of the curated collection of binding models for human and mouse transcription factors. Nucleic Acids Res. 2024, 52, D154–D163. [Google Scholar] [CrossRef] [PubMed]
- Bailey, T.L. STREME: accurate and versatile sequence motif discovery. Bioinformatics 2021, 37, 2834–2840. [Google Scholar] [CrossRef] [PubMed]
- Badia-i-Mompel, P.; Velez Santiago, J.; Braunger, J.; et al. decoupleR: ensemble of computational methods to infer biological activities from omics data. Bioinform. Adv. 2022, 2, vbac016. [Google Scholar] [CrossRef] [PubMed]
- Muller-Dott, S.; Tsirvouli, E.; Vazquez, M.; et al. Expanding the coverage of regulons from high-confidence prior knowledge for accurate estimation of transcription-factor activities. Nucleic Acids Res. 2023, 51, 10934–10949. [Google Scholar] [CrossRef] [PubMed]
- Tsakiroglou, M.; Evans, A.; Doce-Carracedo, A.; et al. Gene expression dysregulation in whole blood of patients with Clostridioides difficile infection. Int. J. Mol. Sci. 2024, 25, 12653. [Google Scholar] [CrossRef] [PubMed]
- National Center for Biotechnology Information. GEO Series GSE276395: Gene expression dysregulation in whole blood of patients with C. difficile infection. Gene Expression Omnibus. Available online: https://www.ncbi.nlm.nih.gov/geo/query/acc.cgi?acc=GSE276395 (accessed on 31 July 2026).
Figure 1.
Dataset structure and initial differential-expression overview of GSE69529. (A) Mean-difference plot. (B) Volcano plot. (C) UMAP projection of diarrheal-disease and healthy-control samples. (D) Number of significant genes at adjusted P < 0.05. (E) Sample-level count distribution. Positive log2 fold change represents higher expression in diarrheal disease.
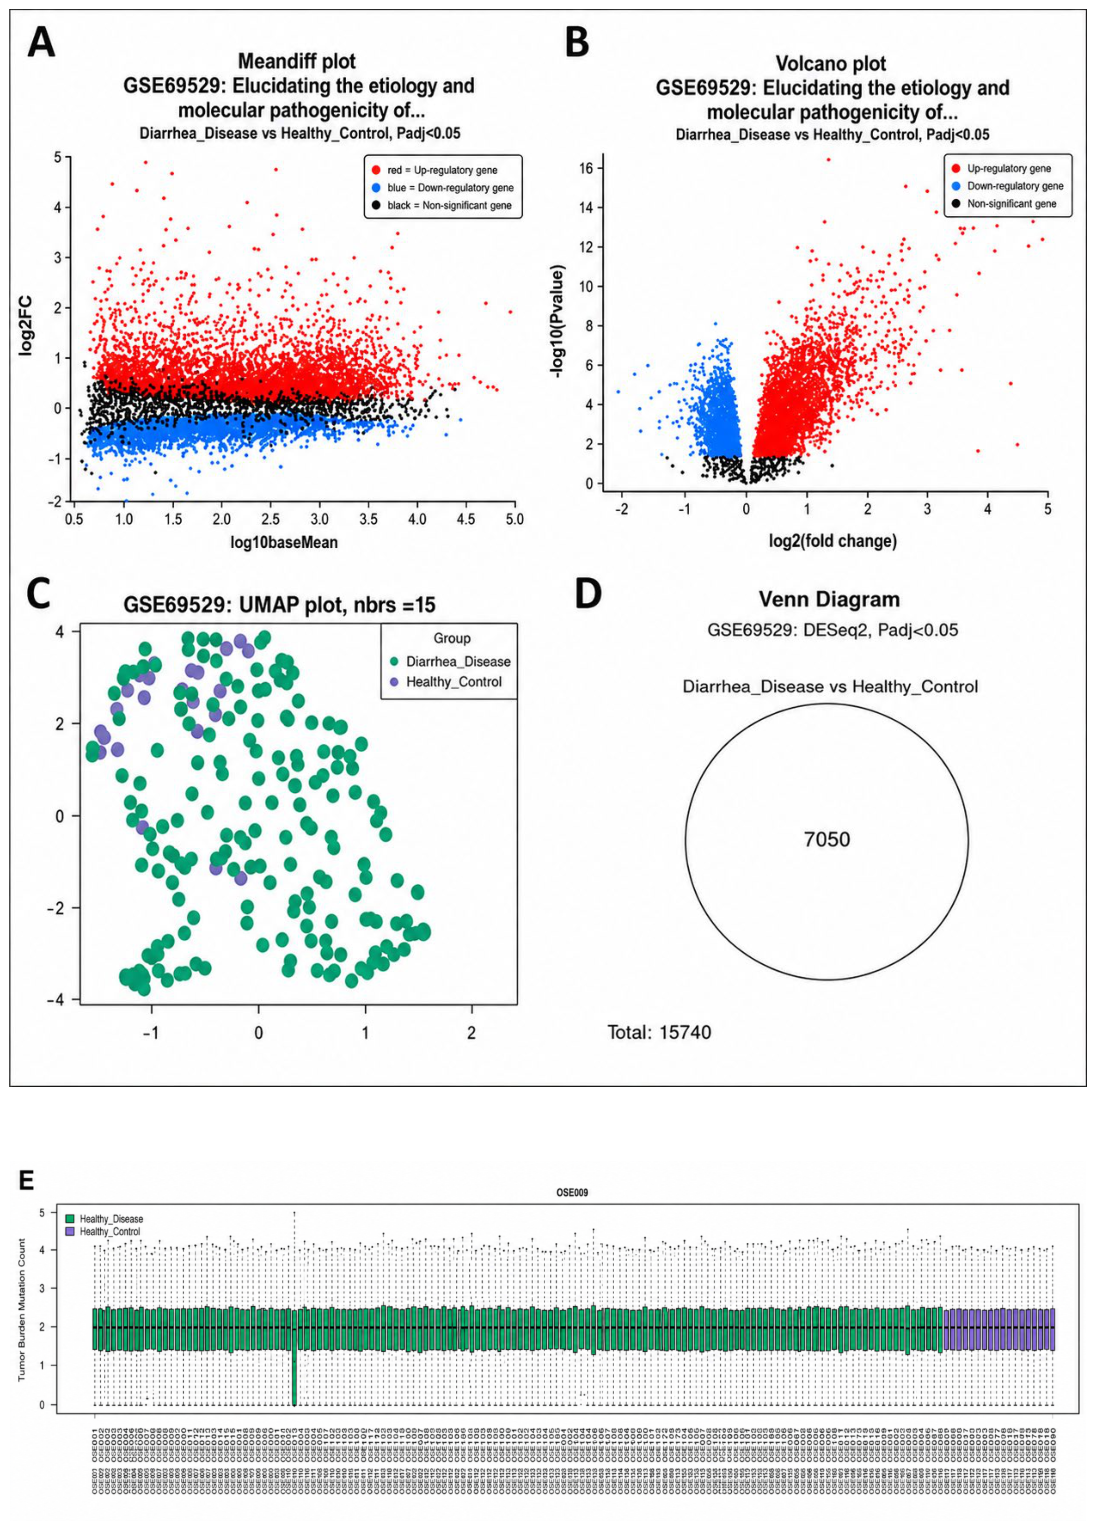
Figure 2.
RNA-sequencing diagnostics and representative differentially expressed genes. (F) Adjusted-P-value distribution. (G) Dispersion estimates. (H) Equal numbers of selected upregulated and downregulated genes. (I) Ranked log2 fold changes for the representative 100-gene set.
Figure 2.
RNA-sequencing diagnostics and representative differentially expressed genes. (F) Adjusted-P-value distribution. (G) Dispersion estimates. (H) Equal numbers of selected upregulated and downregulated genes. (I) Ranked log2 fold changes for the representative 100-gene set.
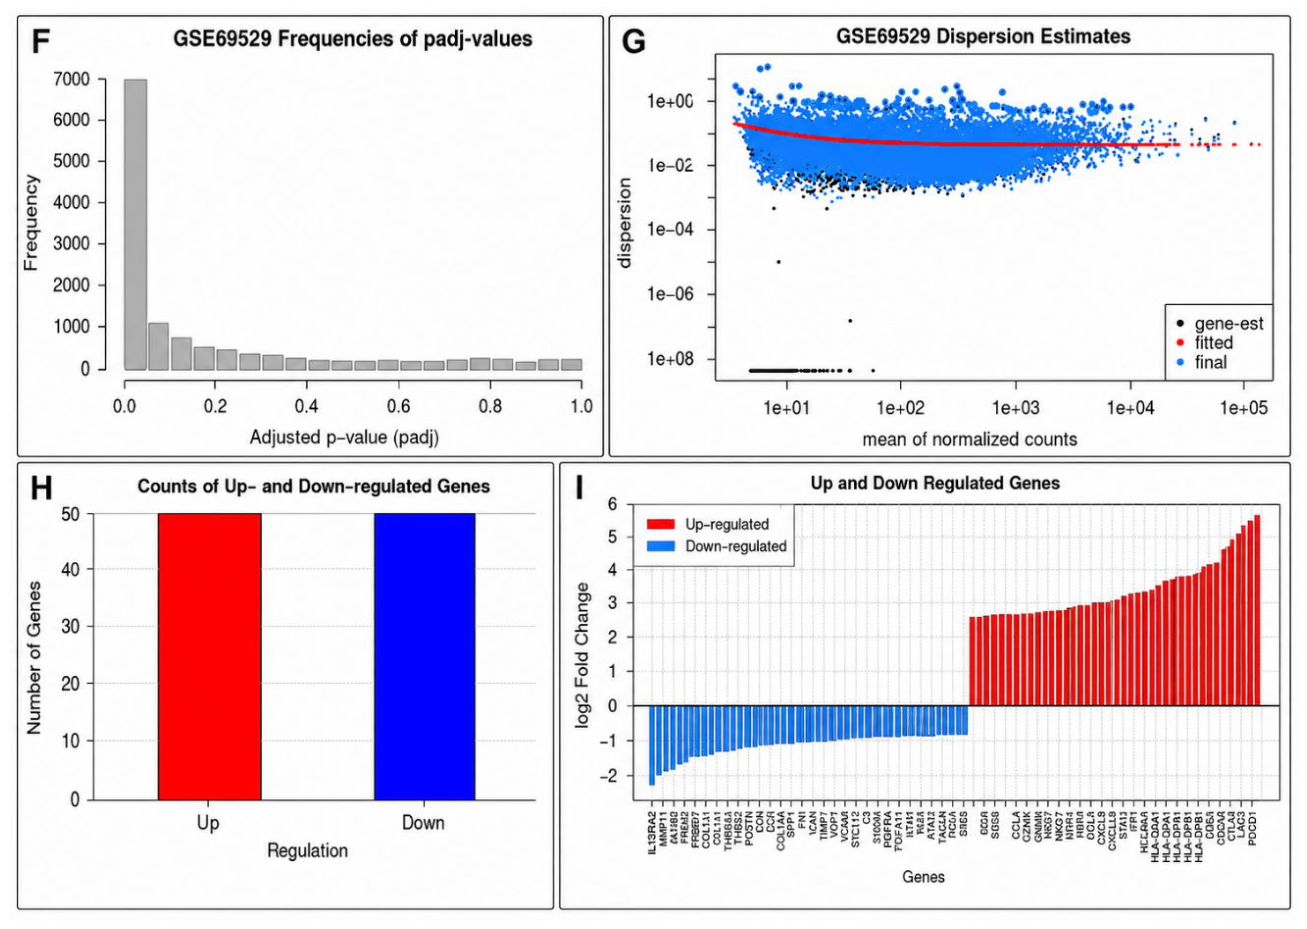
Figure 3.
Expression-pattern visualization and Gene Ontology enrichment overview. (J) Clustered heatmap with dendrograms. (K) Volcano plot of the representative differentially expressed gene subset. (L) MA plot. (M) GO Biological Process, Molecular Function, and Cellular Component enrichment dot plots.
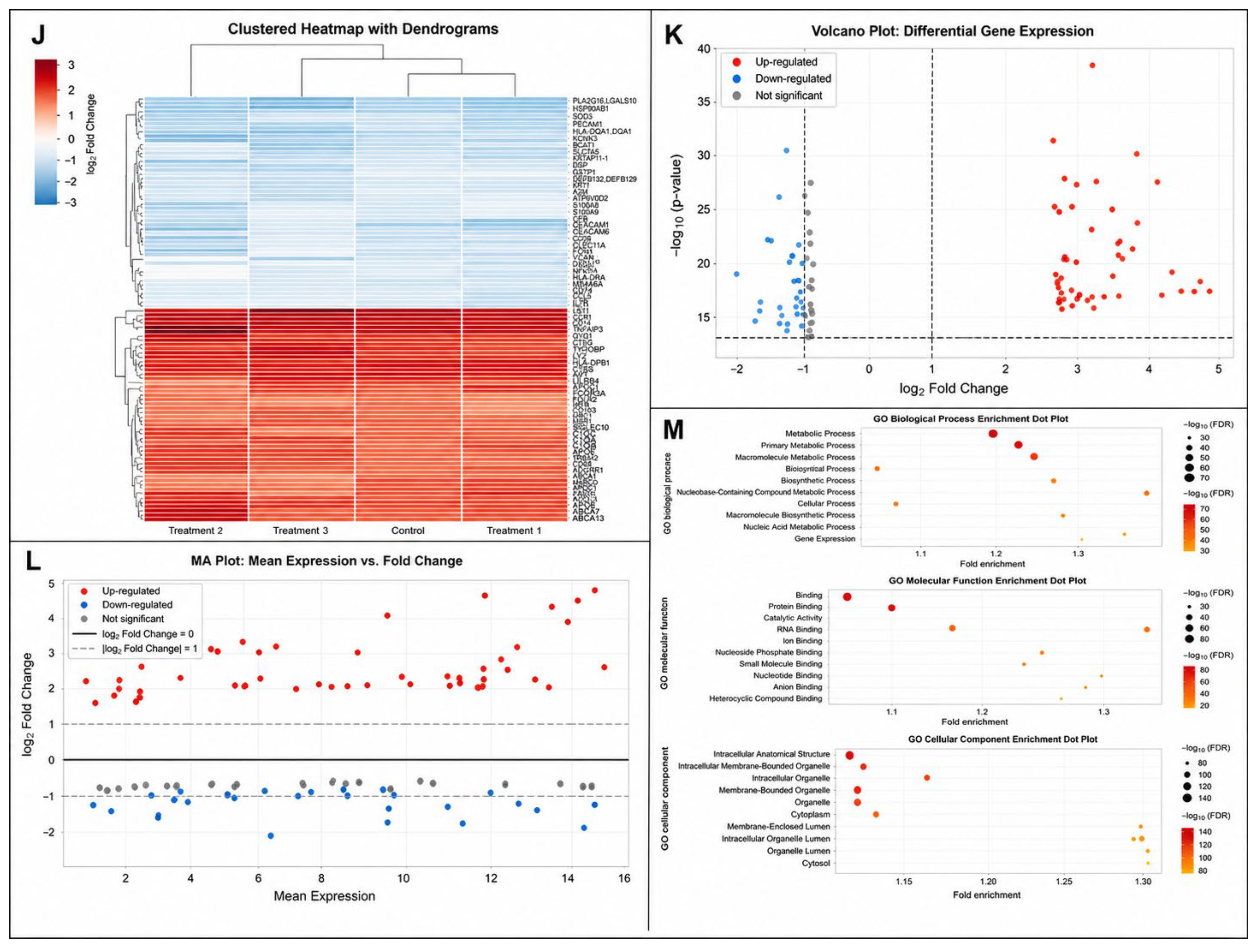
Figure 4.
Direction-specific functional enrichment. The multipanel figure summarizes upregulated pathway enrichment, category overlap, downregulated GO enrichment, and downregulated pathway enrichment across GO, PANTHER, and Reactome resources.
Figure 4.
Direction-specific functional enrichment. The multipanel figure summarizes upregulated pathway enrichment, category overlap, downregulated GO enrichment, and downregulated pathway enrichment across GO, PANTHER, and Reactome resources.
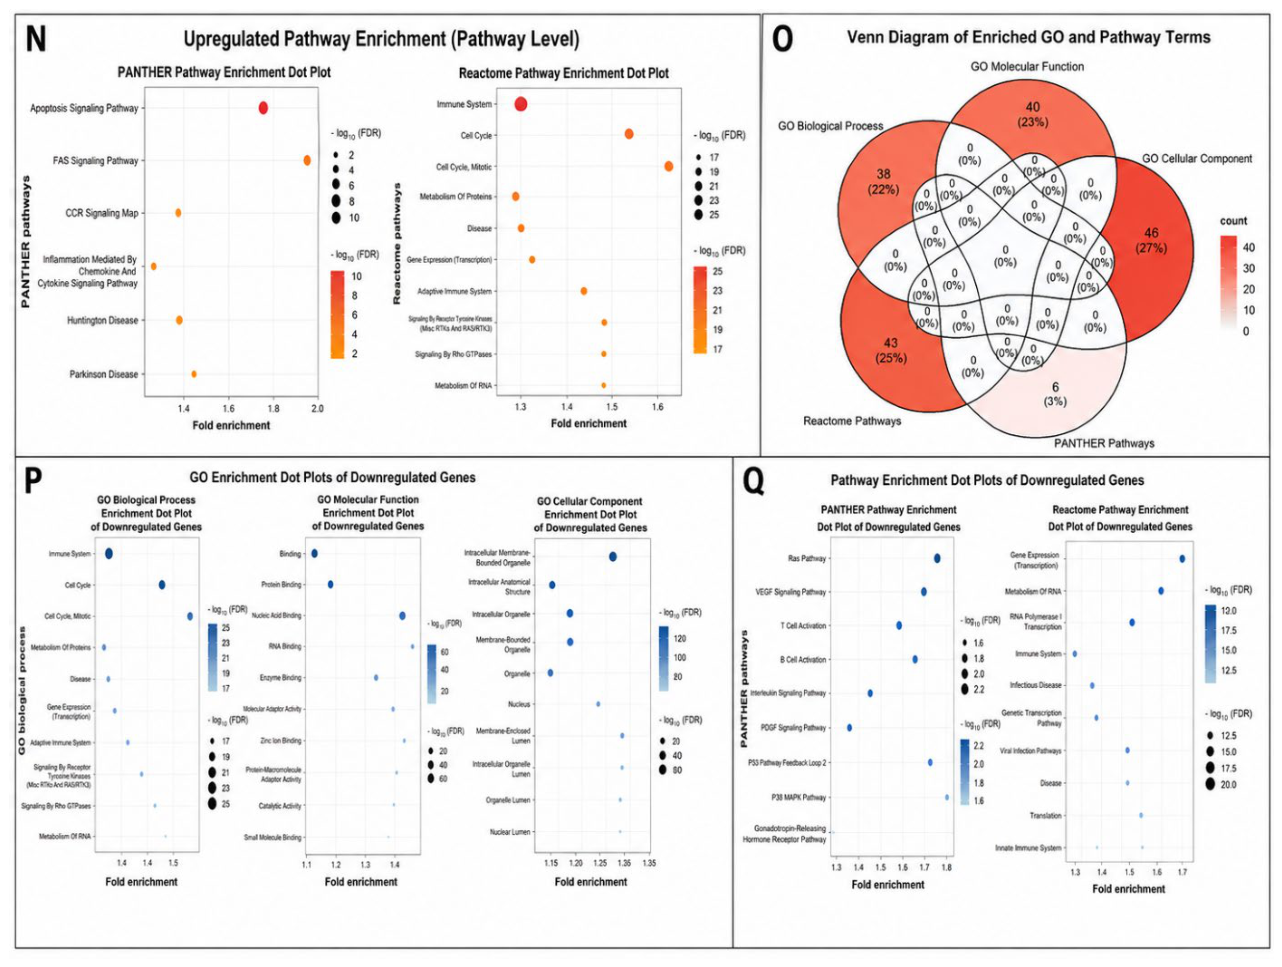
Figure 5.
Comparative enrichment profile of upregulated and downregulated genes. The panels compare GO and pathway dot plots, ranked enriched terms, lollipop summaries, and Venn overlap across annotation categories and regulatory directions.
Figure 5.
Comparative enrichment profile of upregulated and downregulated genes. The panels compare GO and pathway dot plots, ranked enriched terms, lollipop summaries, and Venn overlap across annotation categories and regulatory directions.
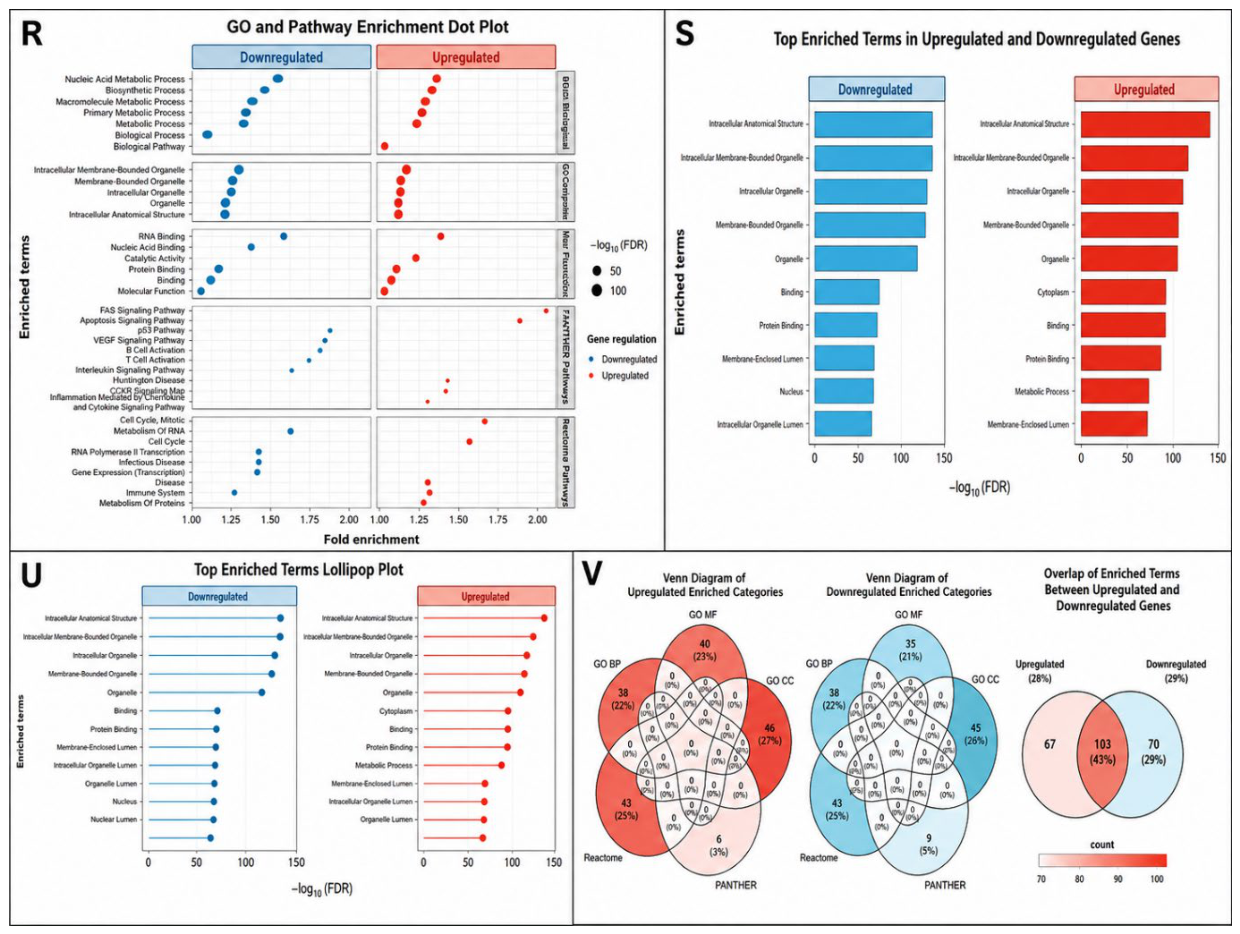
Figure 6.
Number of enriched terms in each functional category. Counts are compared between upregulated and downregulated gene sets across GO Biological Process, GO Molecular Function, GO Cellular Component, PANTHER Pathways, and Reactome Pathways.
Figure 6.
Number of enriched terms in each functional category. Counts are compared between upregulated and downregulated gene sets across GO Biological Process, GO Molecular Function, GO Cellular Component, PANTHER Pathways, and Reactome Pathways.
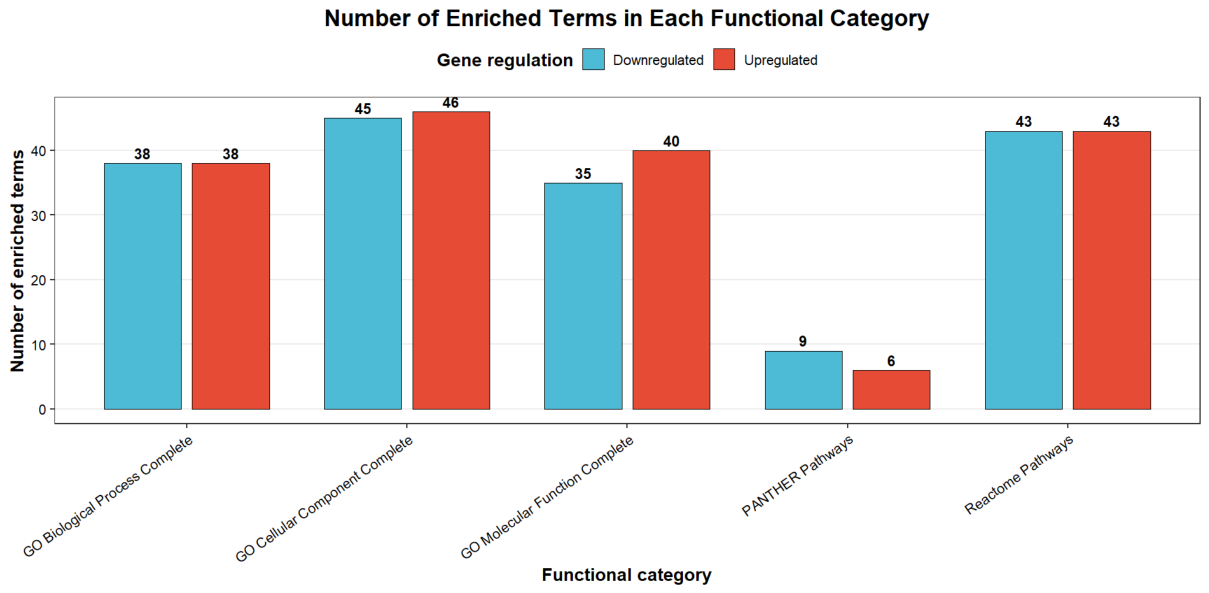
Figure 7.
Multi-database enrichment profiles of upregulated and downregulated genes. Panels summarize GO, KEGG, Reactome, WikiPathways, tissue-expression, subcellular-localization, phenotype, and UniProt-keyword annotations.
Figure 7.
Multi-database enrichment profiles of upregulated and downregulated genes. Panels summarize GO, KEGG, Reactome, WikiPathways, tissue-expression, subcellular-localization, phenotype, and UniProt-keyword annotations.
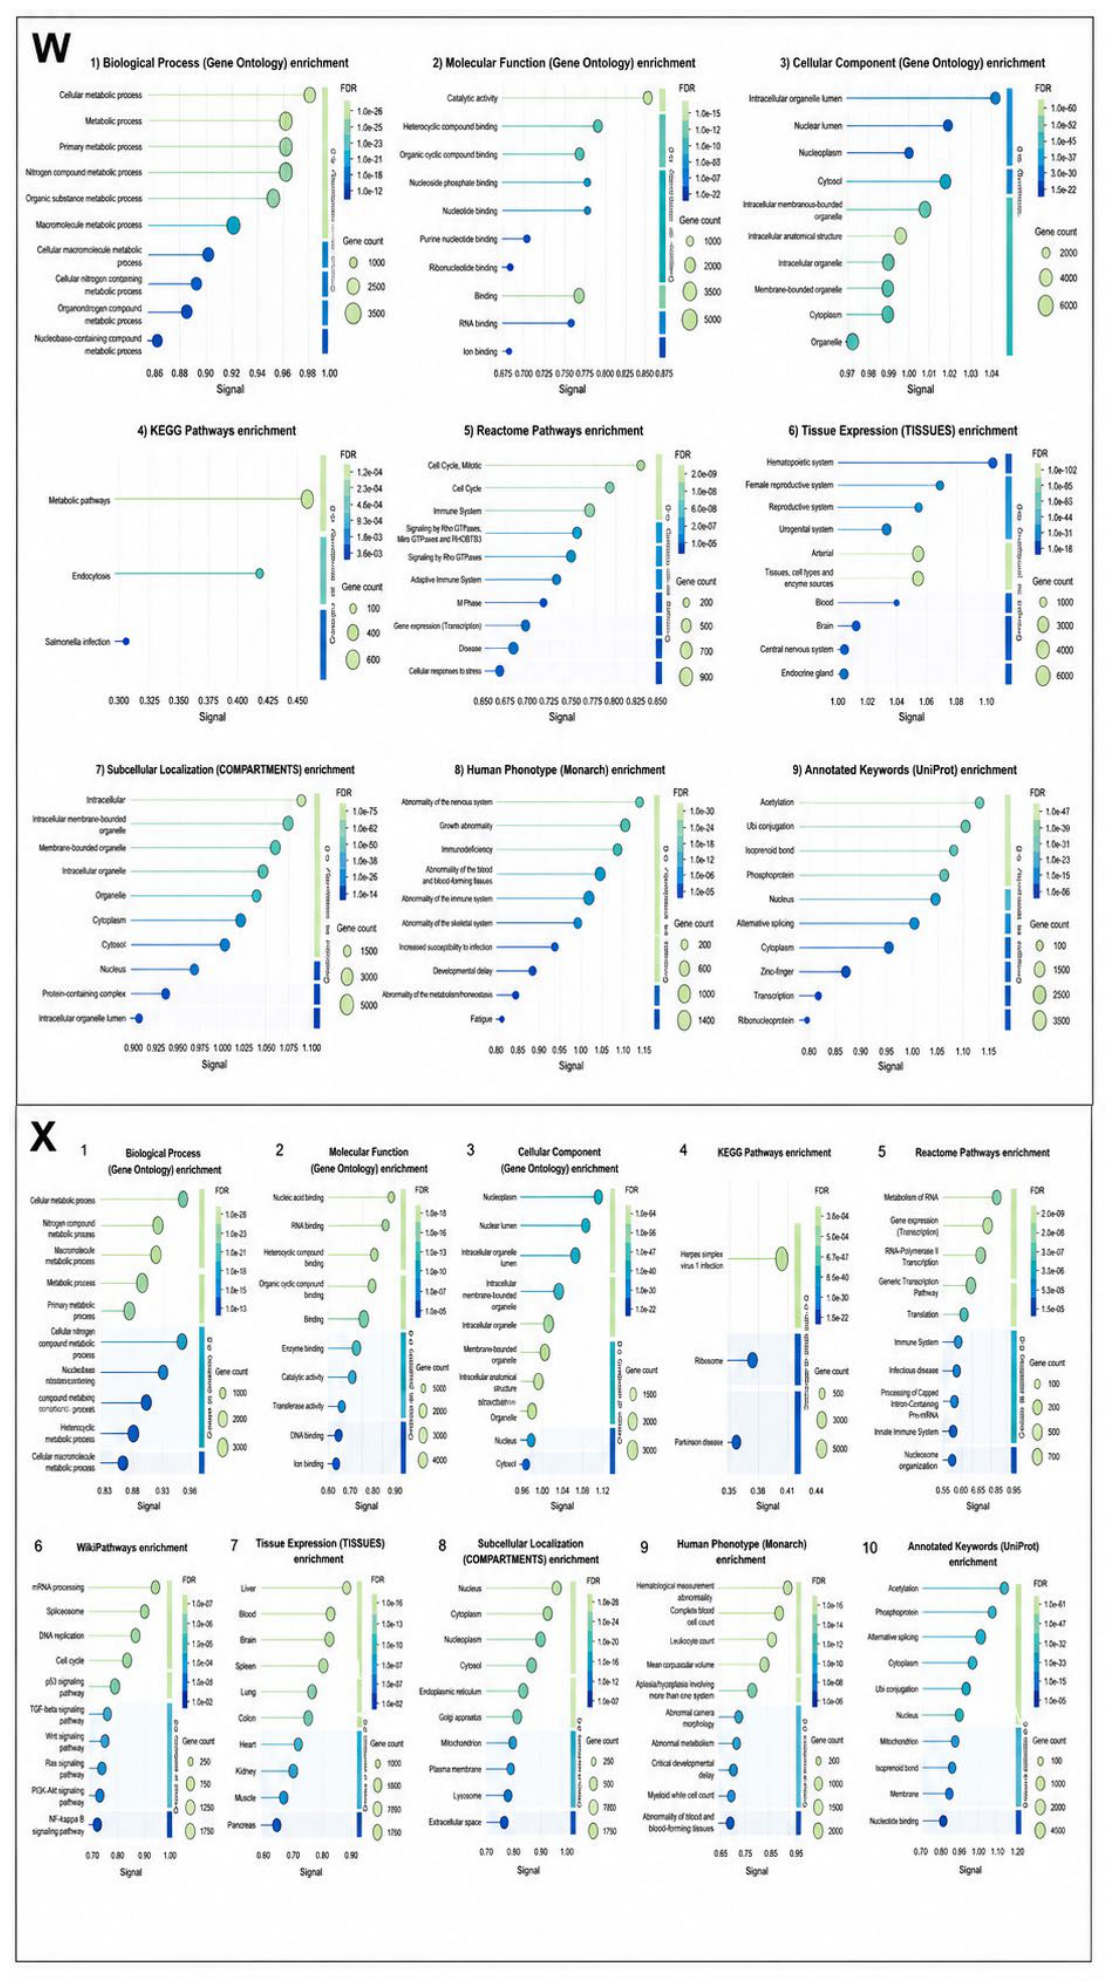
Figure 8.
Protein-association networks and compartment correlation. (Y, Z) STRING/Cytoscape networks for selected upregulated and downregulated proteins. (AA) Correlation between selected compartment-related enrichment measures.
Figure 8.
Protein-association networks and compartment correlation. (Y, Z) STRING/Cytoscape networks for selected upregulated and downregulated proteins. (AA) Correlation between selected compartment-related enrichment measures.
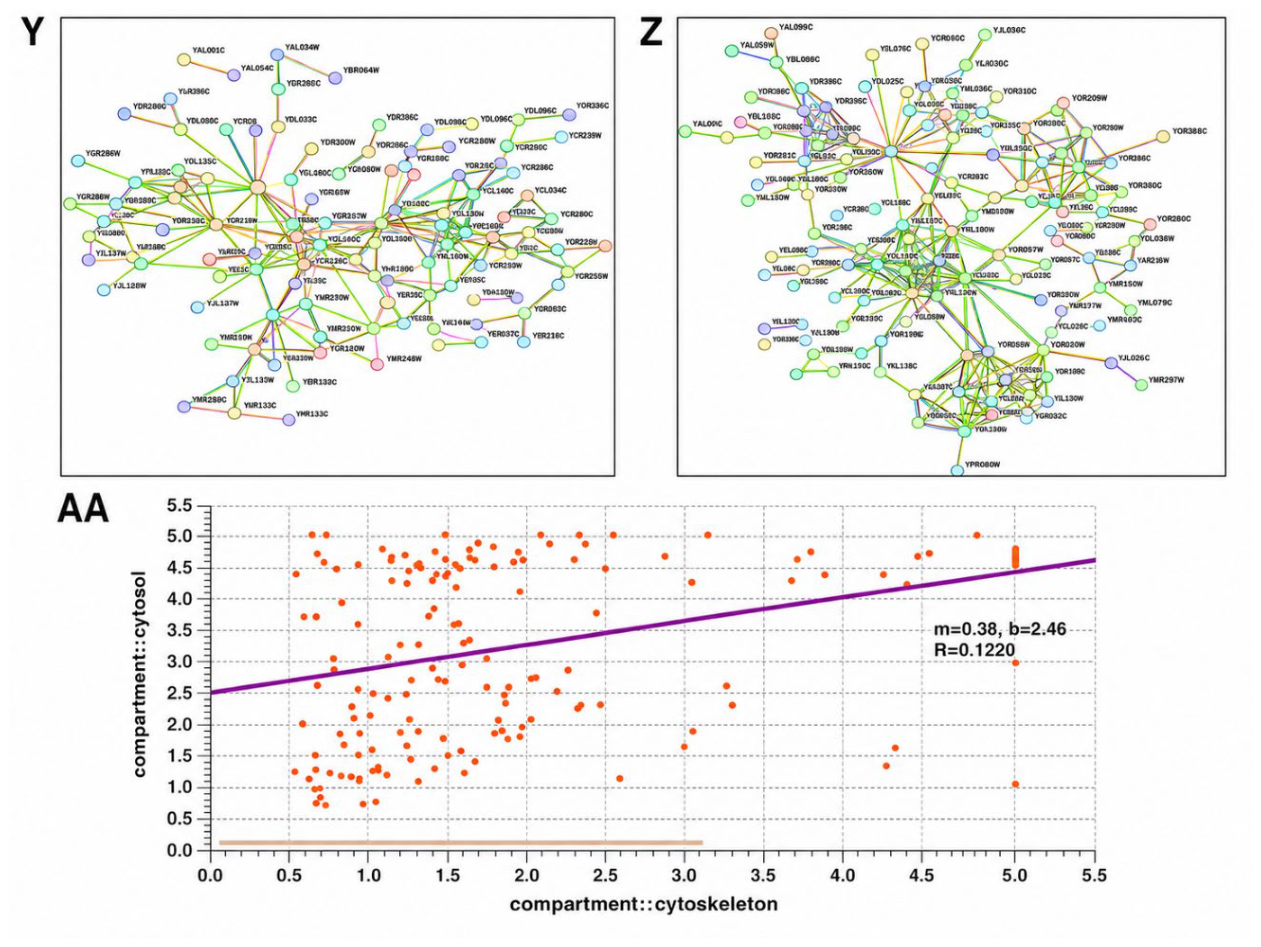
Figure 9.
Principal component analysis of enrichment metrics. Panels AB-AF show score distributions, labeled enriched terms, variance explained, and principal-component comparisons between upregulated and downregulated functional profiles.
Figure 9.
Principal component analysis of enrichment metrics. Panels AB-AF show score distributions, labeled enriched terms, variance explained, and principal-component comparisons between upregulated and downregulated functional profiles.
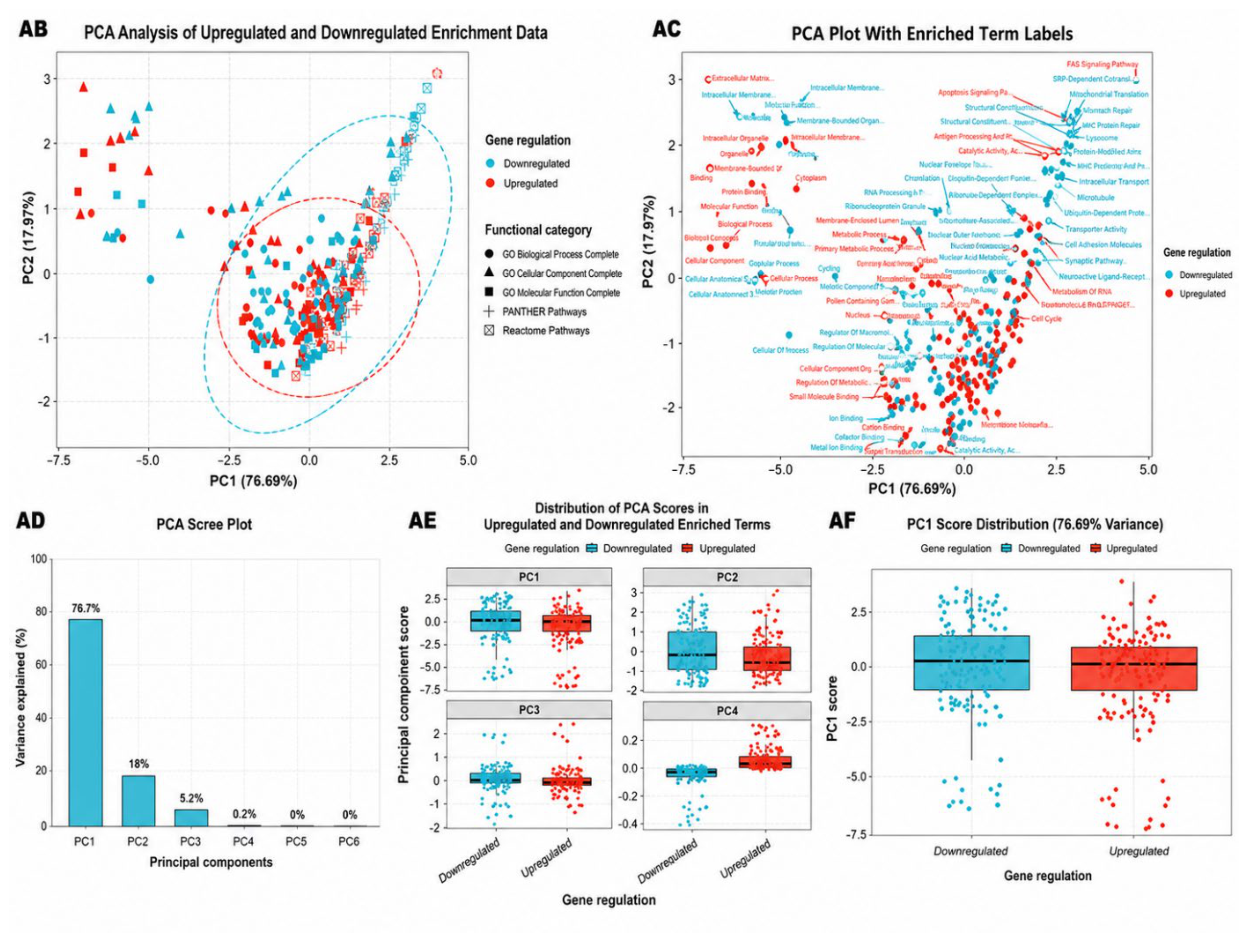
Figure 10.
Regression of enrichment strength and significance. Panels AG-AI show combined and direction-specific associations between fold enrichment and -log10(FDR), with fitted linear models and confidence intervals.
Figure 10.
Regression of enrichment strength and significance. Panels AG-AI show combined and direction-specific associations between fold enrichment and -log10(FDR), with fitted linear models and confidence intervals.
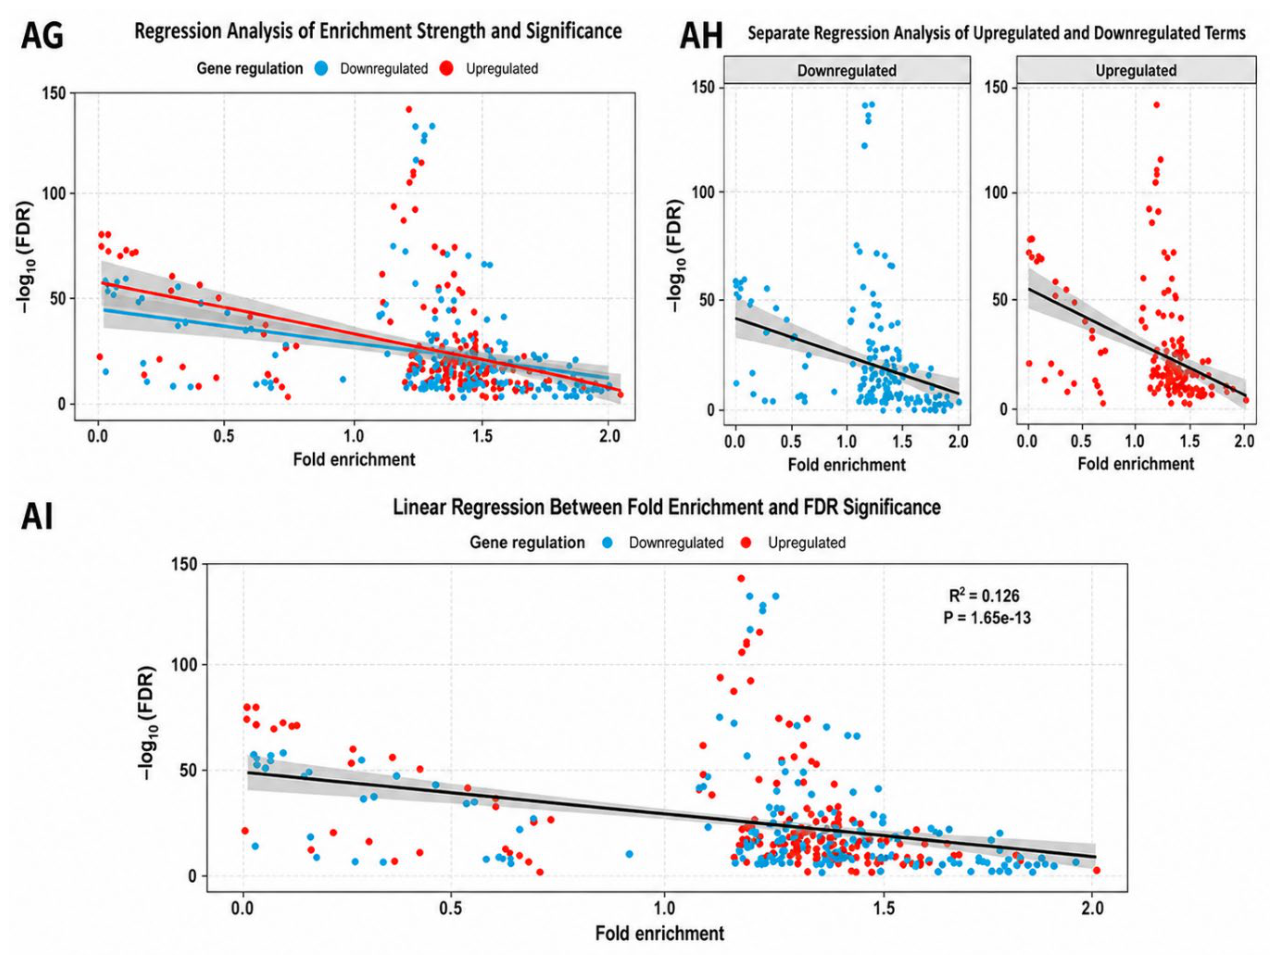
Figure 11.
Correlation analysis of enrichment metrics. (AJ) Spearman correlation matrix among reference count, observed count, expected count, observed-to-expected ratio, fold enrichment, and -log10(FDR). (AK) Pearson association between fold enrichment and -log10(FDR).
Figure 11.
Correlation analysis of enrichment metrics. (AJ) Spearman correlation matrix among reference count, observed count, expected count, observed-to-expected ratio, fold enrichment, and -log10(FDR). (AK) Pearson association between fold enrichment and -log10(FDR).
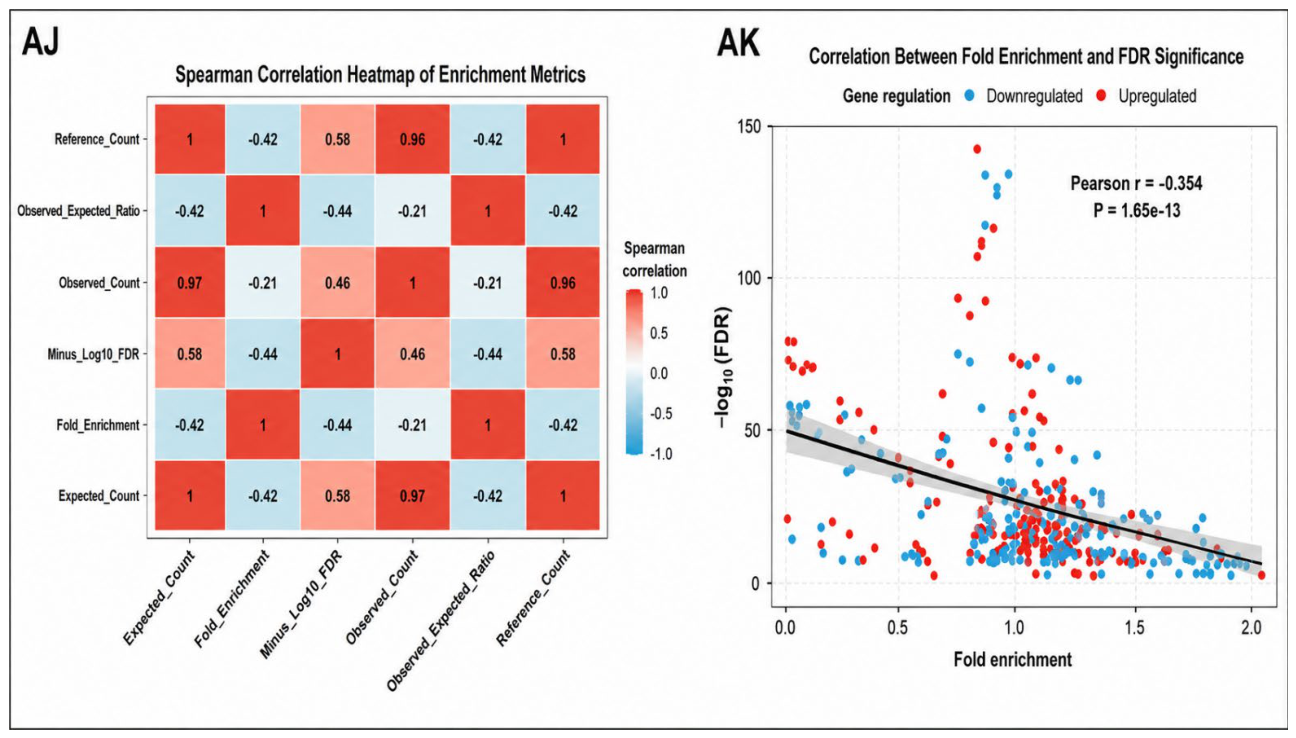
Figure 12.
Topological distributions of experimentally supported miRNA-gene networks for upregulated genes. (A) miRTarBase degree distribution. (B) miRTarBase betweenness distribution. (C) TarBase degree distribution. (D) TarBase betweenness distribution. Log-log distributions reveal a small subset of highly connected or high-betweenness nodes.
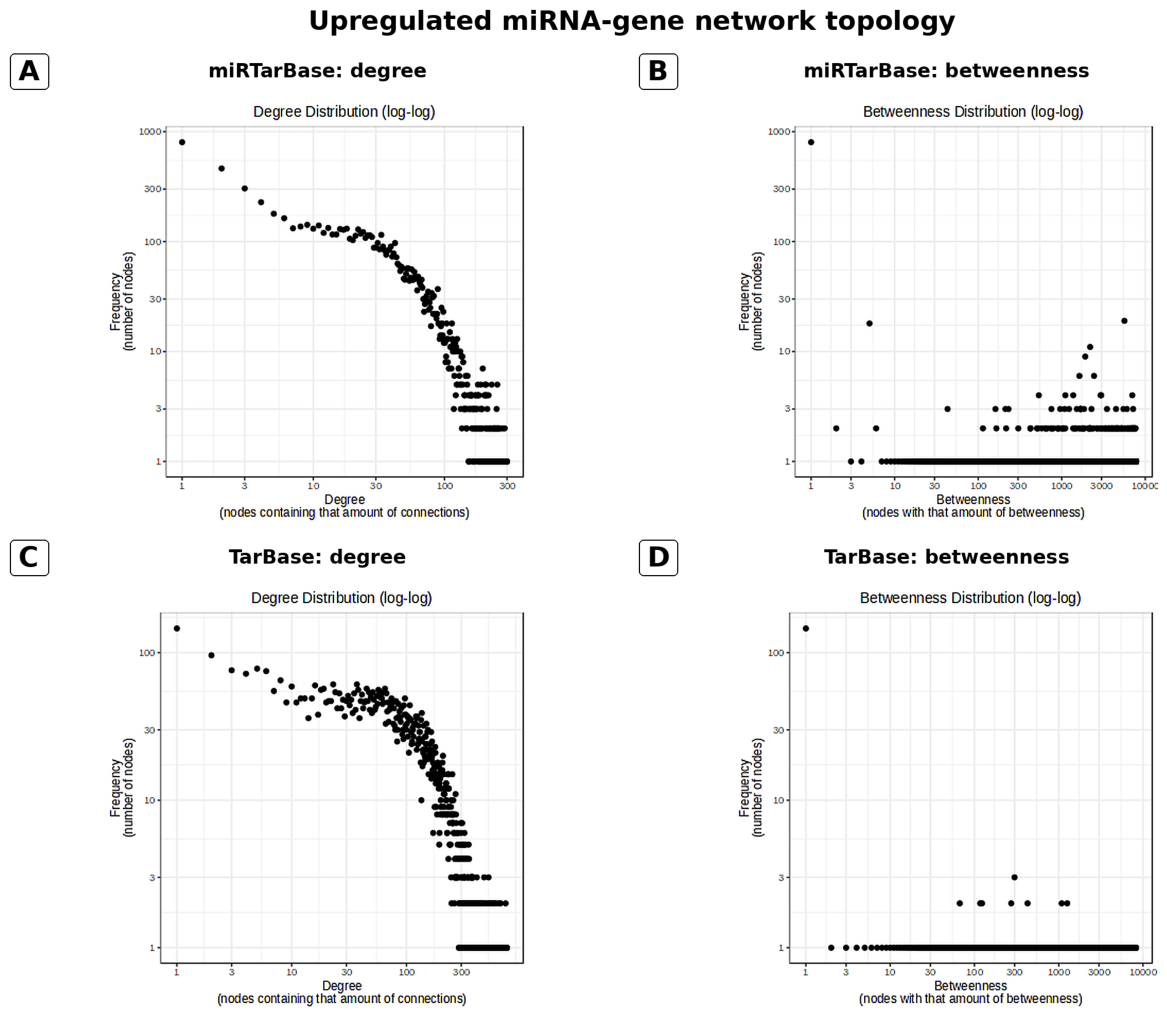
Figure 13.
Topological distributions of experimentally supported miRNA-gene networks for downregulated genes. (A) miRTarBase degree distribution. (B) miRTarBase betweenness distribution. (C) TarBase degree distribution. (D) TarBase betweenness distribution.
Figure 13.
Topological distributions of experimentally supported miRNA-gene networks for downregulated genes. (A) miRTarBase degree distribution. (B) miRTarBase betweenness distribution. (C) TarBase degree distribution. (D) TarBase betweenness distribution.
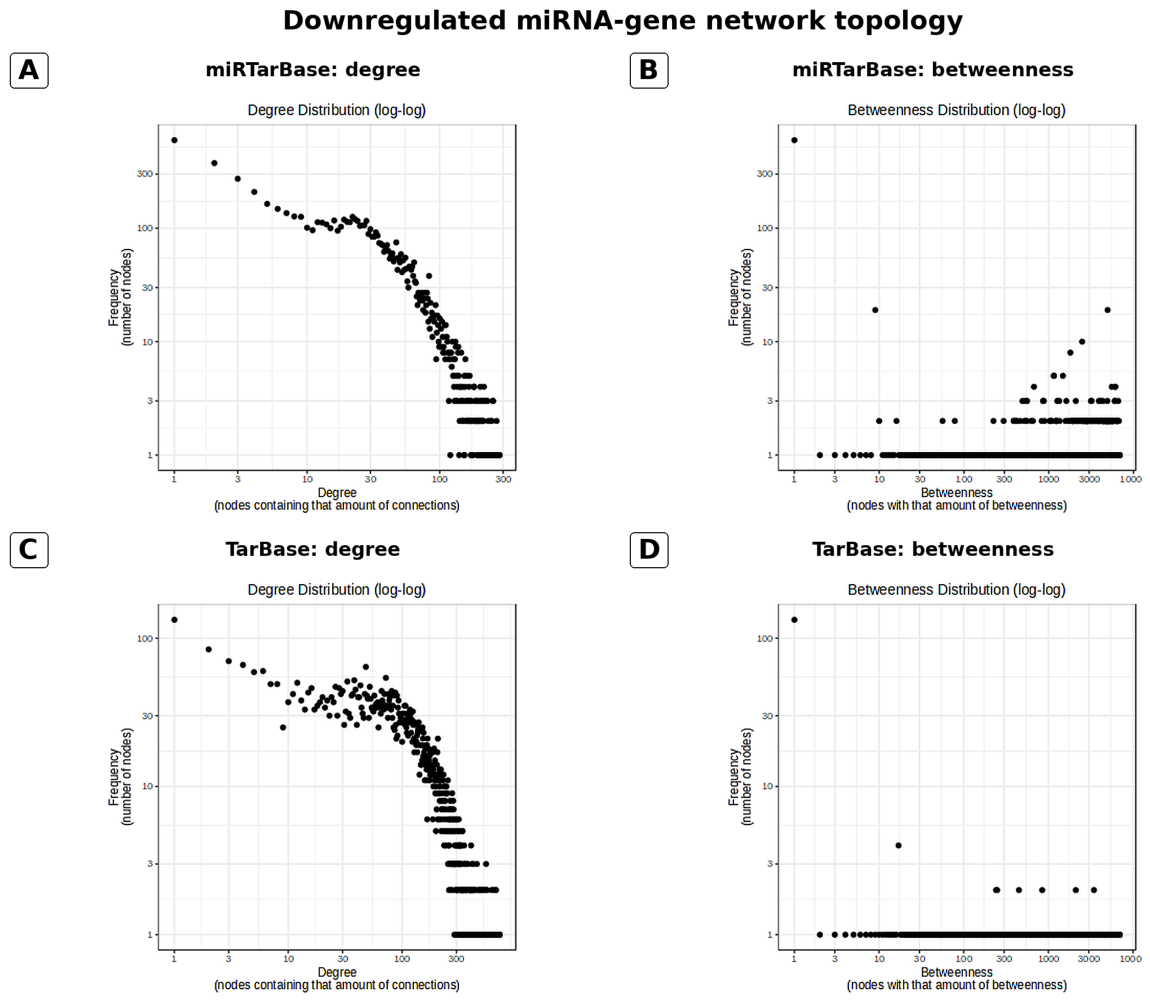
Figure 14.
Genome-wide characterization of GRCh38 promoter sequences. (A) Number of mapped promoter-associated genes. (B) Raw chromosomal counts. (C) Within-group chromosomal percentages. (D) GC-content density distributions. (E) Violin and box plots of promoter GC content. All sequences were 2,500 bp and spanned -2,000 to +500 bp relative to the transcription start site.
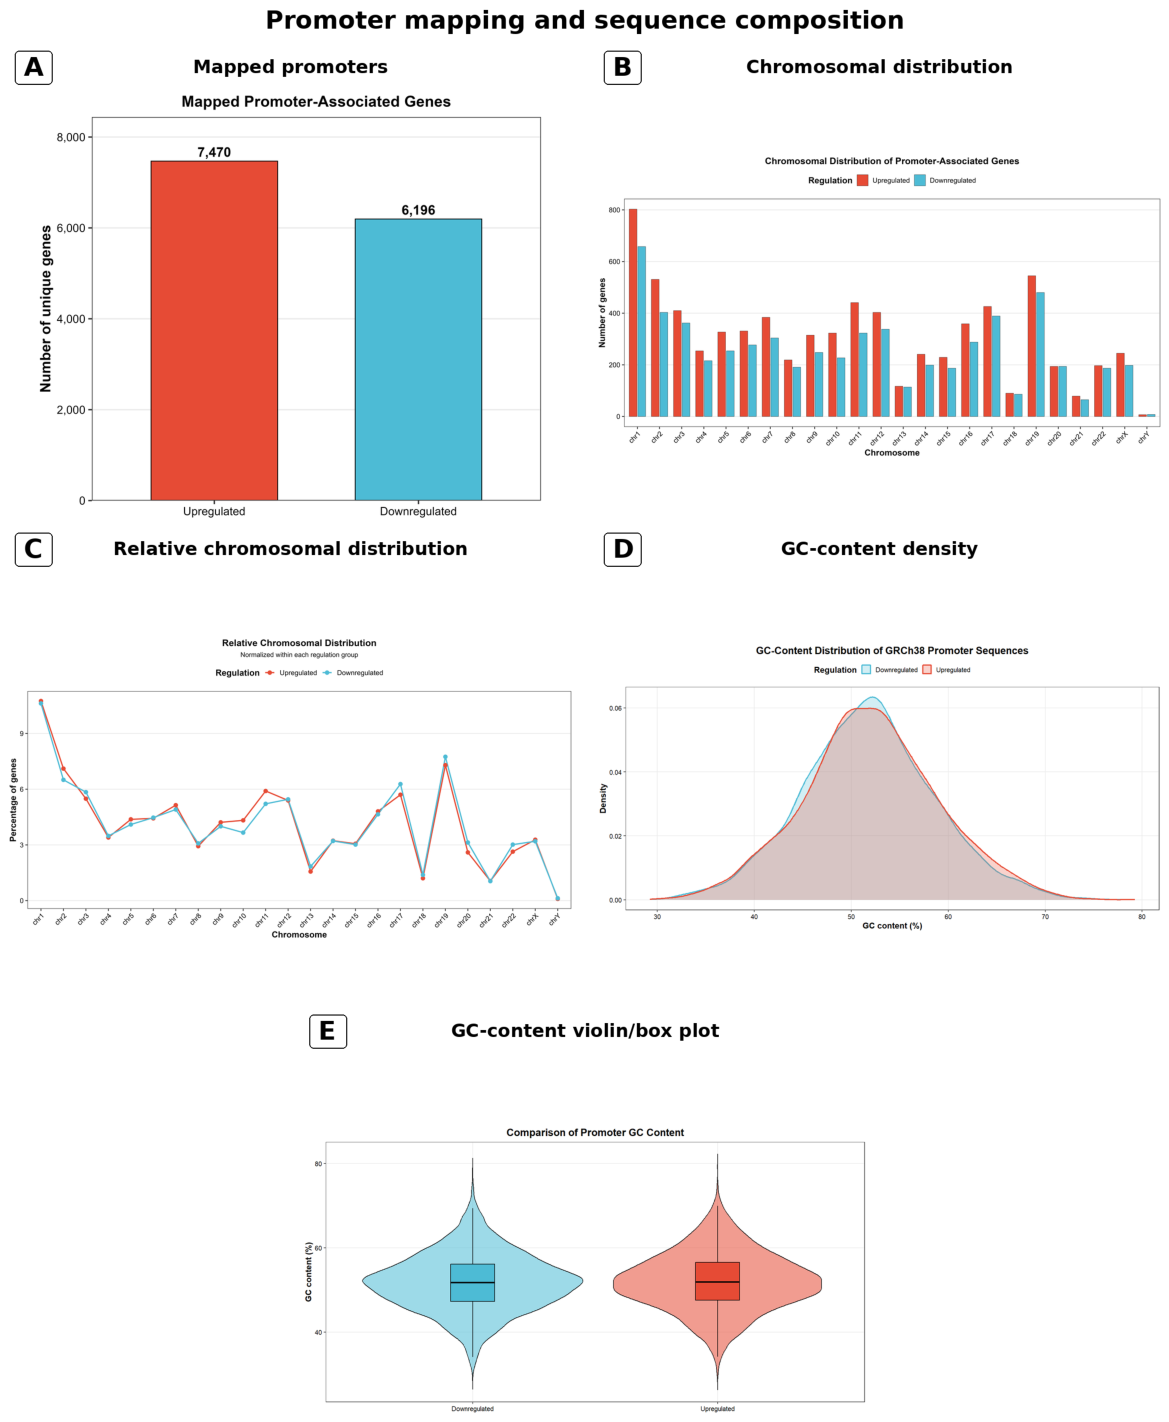
Figure 15.
STREME de novo promoter-motif discovery using balanced promoter sets. (A) Five highest-ranked candidate motifs identified with upregulated promoters as primary sequences and downregulated promoters as controls. (B) Six highest-ranked candidate motifs from the reciprocal comparison. Subpanels are labeled with their consensus sequences, and letter height represents nucleotide information content. None of the candidates reached the prespecified corrected threshold of E ≤ 0.05; therefore, all motifs were interpreted as exploratory.
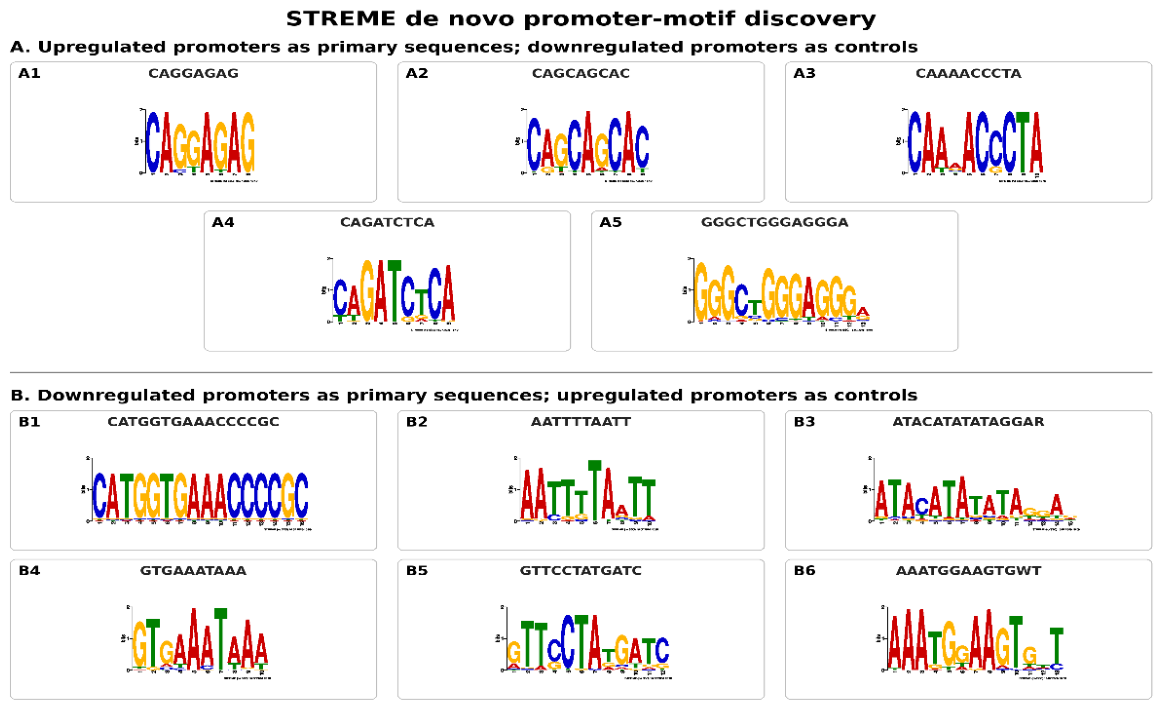
Figure 16.
CollecTRI-ULM transcription-factor activity inference. (A) Highest positive and negative activity scores. (B) Activity score versus -log10(FDR); all TFs were non-significant after correction. (C) Activity in relation to regulon size. (D) Ranked inferred activities of CollecTRI TFs linked to CFTR and SLC26A3. Positive scores indicate relatively increased inferred activity in diarrheal disease; negative scores indicate relatively reduced activity.
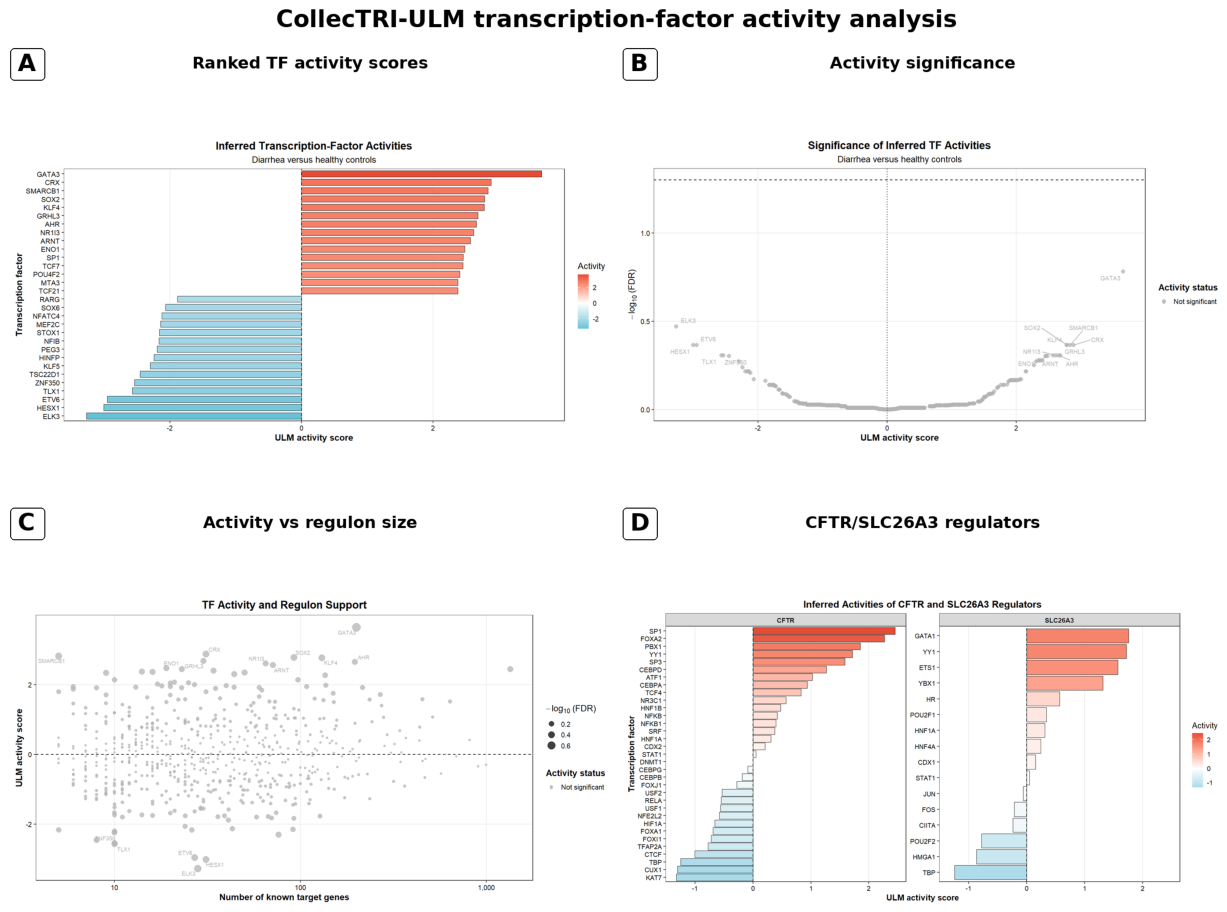

Table 1.
Top enriched GO and pathway terms in upregulated genes.
| Category | Enriched term | Fold enrichment | FDR | -log10(FDR) |
|---|---|---|---|---|
| GO Biological Process | Metabolic Process | 1.23 | 4.90e-74 | 73.31 |
| GO Biological Process | Primary Metabolic Process | 1.25 | 5.00e-72 | 71.30 |
| GO Biological Process | Macromolecule Metabolic Process | 1.26 | 2.85e-65 | 64.54 |
| GO Cellular Component | Intracellular Anatomical Structure | 1.14 | 8.06e-144 | 143.09 |
| GO Cellular Component | Intracellular Membrane-Bounded Organelle | 1.18 | 4.58e-117 | 116.34 |
| GO Cellular Component | Intracellular Organelle | 1.15 | 1.20e-112 | 111.91 |
| GO Molecular Function | Binding | 1.09 | 4.05e-94 | 93.39 |
| GO Molecular Function | Protein Binding | 1.12 | 3.78e-88 | 87.42 |
| GO Molecular Function | Molecular Function | 1.05 | 7.96e-62 | 61.10 |
| PANTHER Pathway | Apoptosis Signaling Pathway | 1.84 | 7.32e-09 | 8.14 |
| PANTHER Pathway | FAS Signaling Pathway | 1.97 | 2.37e-03 | 2.63 |
| PANTHER Pathway | CCKR Signaling Map | 1.39 | 6.89e-03 | 2.16 |
| Reactome Pathway | Immune System | 1.31 | 5.91e-26 | 25.23 |
| Reactome Pathway | Cell Cycle | 1.54 | 4.66e-22 | 21.33 |
| Reactome Pathway | Cell Cycle, Mitotic | 1.61 | 1.08e-21 | 20.97 |
Table 2.
Top enriched GO and pathway terms in downregulated genes.
| Category | Enriched term | Fold enrichment | FDR | -log10(FDR) |
|---|---|---|---|---|
| GO Biological Process | Metabolic Process | 1.23 | 5.78e-54 | 53.24 |
| GO Biological Process | Primary Metabolic Process | 1.24 | 2.32e-49 | 48.63 |
| GO Biological Process | Macromolecule Metabolic Process | 1.28 | 3.88e-49 | 48.41 |
| GO Cellular Component | Intracellular Membrane-Bounded Organelle | 1.22 | 1.49e-135 | 134.83 |
| GO Cellular Component | Intracellular Anatomical Structure | 1.16 | 3.28e-135 | 134.48 |
| GO Cellular Component | Intracellular Organelle | 1.19 | 7.62e-131 | 130.12 |
| GO Molecular Function | Binding | 1.09 | 3.14e-75 | 74.50 |
| GO Molecular Function | Protein Binding | 1.12 | 1.20e-72 | 71.92 |
| GO Molecular Function | Molecular Function | 1.05 | 2.41e-42 | 41.62 |
| PANTHER Pathway | Ras Pathway | 1.76 | 4.25e-03 | 2.37 |
| PANTHER Pathway | T Cell Activation | 1.67 | 6.06e-03 | 2.22 |
| PANTHER Pathway | VEGF Signaling Pathway | 1.74 | 6.06e-03 | 2.22 |
| Reactome Pathway | Gene Expression (Transcription) | 1.41 | 2.24e-22 | 21.65 |
| Reactome Pathway | Metabolism Of RNA | 1.59 | 2.54e-20 | 19.60 |
| Reactome Pathway | RNA Polymerase II Transcription | 1.42 | 2.61e-20 | 19.58 |
Table 3.
Number of enriched terms by regulatory direction and annotation category.
| Regulation | Category | Enriched terms |
|---|---|---|
| Upregulated | GO Biological Process Complete | 38 |
| Upregulated | GO Molecular Function Complete | 40 |
| Upregulated | GO Cellular Component Complete | 46 |
| Upregulated | PANTHER Pathways | 6 |
| Upregulated | Reactome Pathways | 43 |
| Downregulated | GO Biological Process Complete | 38 |
| Downregulated | GO Molecular Function Complete | 35 |
| Downregulated | GO Cellular Component Complete | 45 |
| Downregulated | PANTHER Pathways | 9 |
| Downregulated | Reactome Pathways | 43 |
Table 4.
Topological characteristics of the largest miRNA-gene subnetworks.
| Gene set | Database | Nodes | Edges | Mapped seeds | Average path length |
|---|---|---|---|---|---|
| Upregulated | miRTarBase v9.0 | 8,774 | 172,191 | 6,176 | 3.24 |
| Upregulated | TarBase v9.0 | 8,356 | 688,995 | 7,008 | 2.30 |
| Downregulated | miRTarBase v9.0 | 7,684 | 147,440 | 5,101 | 3.21 |
| Downregulated | TarBase v9.0 | 7,068 | 586,923 | 5,727 | 2.33 |
Table 5.
Summary of known and de novo promoter-motif analyses.
| Analysis | Primary vs control | Main result | Statistical interpretation |
|---|---|---|---|
| AME/HOCOMOCO | Upregulated vs downregulated | No reported enriched motifs | No known motif supported |
| AME/HOCOMOCO | Downregulated vs upregulated | No reported enriched motifs | No known motif supported |
| STREME | Upregulated vs downregulated | CAGGAGAG: 210/448; P=0.013; E=0.067 | Borderline; not significant at E≤0.05 |
| STREME | Downregulated vs upregulated | Top motif: 72/448; P=0.015; E=0.089 | Borderline; not significant at E≤0.05 |
Table 6.
Independent-cohort validation and limits of inference.
| Validation feature | Discovery cohort: GSE69529 | Independent cohort: GSE276395 | Interpretation |
|---|---|---|---|
| Clinical context | 255 whole-blood profiles from children with pathogen-confirmed infectious diarrhea and controls | 278 whole-blood profiles from multiple diarrhea groups, inflammatory bowel disease, and healthy controls | Independent recruitment and different clinical setting |
| Assay platform | RNA sequencing | Affymetrix Human Clariom D microarray | Cross-platform validation |
| Replicated programs | Immune signaling, neutrophil-associated response, and metabolic remodeling | Shared innate immunity, neutrophil degranulation, and immunometabolic dysregulation across diarrhea groups | Broad pathway-level concordance supported |
| Gene-level comparison | 12 highlighted discovery-stage candidate genes | 12 recurrent high-fold-change genes: ANKRD22, ANXA3, CD177, CEACAM8, DEFA4, GALNT14, HP, LTF, MGAM2, MMP8, OLFM4, SLC26A8 | No exact overlap; individual discovery candidates not externally validated |
| Regulatory claims | Exploratory promoter motifs, TF activity, and CFTR/SLC26A3-linked rankings | No intestinal epithelial or mechanistic assessment of CFTR/SLC26A3 regulation | No biological validation of gene-specific regulatory mechanisms |
Disclaimer/Publisher’s Note: The statements, opinions and data contained in all publications are solely those of the individual author(s) and contributor(s) and not of MDPI and/or the editor(s). MDPI and/or the editor(s) disclaim responsibility for any injury to people or property resulting from any ideas, methods, instructions or products referred to in the content. |
© 2026 by the authors. Licensee MDPI, Basel, Switzerland. This article is an open access article distributed under the terms and conditions of the Creative Commons Attribution (CC BY) license.
Copyright: This open access article is published under a Creative Commons CC BY 4.0 license, which permit the free download, distribution, and reuse, provided that the author and preprint are cited in any reuse.