

Submitted:
30 September 2026
Posted:
01 October 2026
You are already at the latest version
Abstract
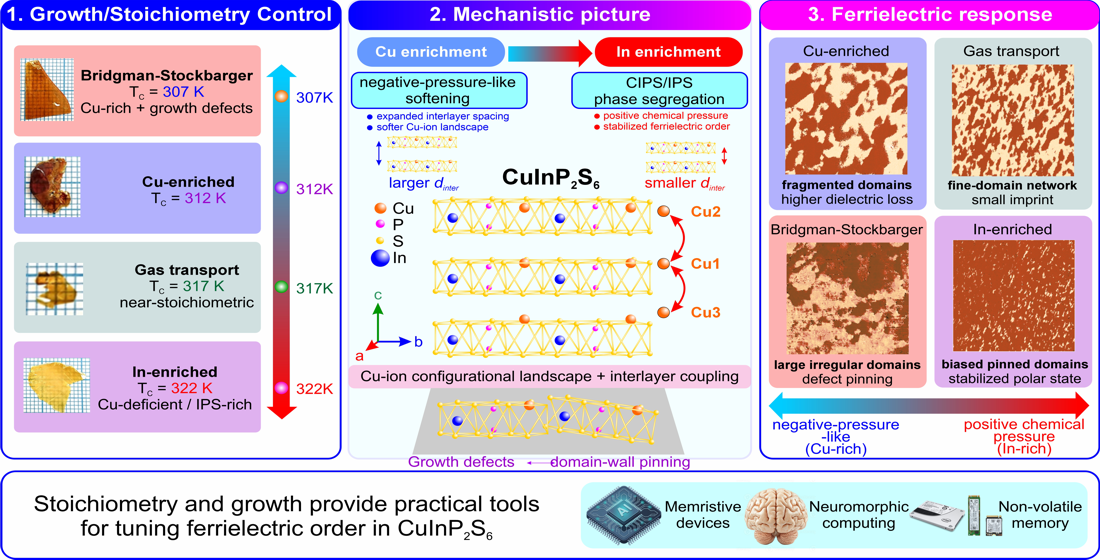
The ferrielectric properties of layered CuInP2S6 (CIPS) are highly sensitive to stoichiometry and growth-induced defects. Here we systematically compare crystals grown by chemical vapor transport and the Bridgman–Stockbarger method with Cu- and In-enriched samples, combining compositional analysis, dielectric spectroscopy, uniaxial-pressure measurements, Raman spectroscopy, piezoresponse force microscopy and first-principles calculations. The transition temperature increases systematically from 307 K (Bridgman) to 312 K (Cu-enriched), 317 K (gas-transport) and 322 K (In-enriched). In enrichment is consistent with spontaneous CIPS/In4/3P2S6 phase segregation that generates effective positive chemical pressure, stabilizing the ferrielectric state and producing a strongly biased, pinned domain configuration. Cu enrichment produces the opposite response—lower TC, enhanced dielectric loss and a fragmented domain morphology—characteristic of a negative-pressure-like perturbation of the Cu-ion energy landscape. Landau–Ginzburg–Devonshire analysis and density-functional calculations provide a unified microscopic picture based on Cu-ion configurational freedom and interlayer coupling. Growth defects act as an independent source of domain-wall pinning. Together, these results establish stoichiometry and synthesis conditions as practical tools for engineering ferrielectric order in van der Waals CIPS.
Keywords:
CuInP2S6
; van der Waals ferrielectrics
; stoichiometry
; phase transition
; dielectric properties
; domain structure
1. Introduction
Layered metal thio- and selenophosphates have attracted considerable attention because their low-dimensional crystal structures combine van der Waals bonding with a broad range of functional electronic and ferroic properties [1,2]. Among these materials, CuInP₂S₆ (CIPS) is particularly interesting as a layered ferrielectric that retains spontaneous polarization down to the nanoscale [3,4]. This combination of reduced dimensionality and switchable polarization has motivated extensive research toward CIPS-based ferroelectric field-effect transistors [5], negative-capacitance devices [6], memristors [7], and neuromorphic and optoelectronic synaptic devices [8,9]. However, the relatively low ferrielectric transition temperature, TC ≈ 315 K, limits the temperature range of the polar state, while the pronounced sensitivity of CIPS properties to growth conditions and stoichiometry presents both a reproducibility challenge and an opportunity for controlled materials engineering.
CuInP₂S₆ has a layered structure in which Cu, In, and P–P pairs occupy octahedral sites within a sulfur framework [10]. Individual layers are weakly coupled by van der Waals interactions, making the structure particularly sensitive to changes in interlayer spacing and cation distribution. The ferrielectric ordering is closely associated with the displacement and redistribution of Cu⁺ ions among several energetically nonequivalent positions (Cu1, Cu2, and Cu3; Figure 1) [11]. Above TC, thermally activated Cu-ion hopping between available sites contributes to dynamic disorder, whereas cooling through the transition preferentially stabilizes off-center Cu positions together with oppositely directed displacements of the In³⁺ sublattice. The resulting partially compensating polar sublattices produce the ferrielectric state. Consequently, modifications of the Cu-ion potential landscape, site occupancy, or interlayer coupling can strongly affect the transition temperature and polarization behavior of CIPS.
An important route for modifying the properties of CIPS is deviation from stoichiometry. Dziaugys et al. [12] demonstrated that In enrichment increases the phase-transition temperature, with TC reaching approximately 330 K in crystals grown with excess In₂S₃. Subsequent studies showed that In-rich, Cu-deficient CIPS undergoes spontaneous chemical phase separation rather than forming a homogeneous solid solution [13,14]. The resulting structure consists of coexisting ferrielectric CuInP₂S₆ and centrosymmetric In₄/₃P₂S₆ (IPS) chemical domains within individual layers. Importantly, the lateral dimensions and spatial organization of these domains depend strongly on the thermal history, providing a means of controlling the mesoscale chemical architecture of CIPS/IPS heterostructures [13,14].
The formation of CIPS/IPS chemical domains has important structural and functional consequences. With decreasing Cu content, the transition temperature of the CIPS component increases despite the reduced fraction of the ferrielectric phase [14]. X-ray diffraction reveals a systematic composition dependence of the interlayer spacing, which increases from approximately 6.5054 Å in In₄/₃P₂S₆ to 6.5146 Å in CuInP₂S₆ [14]. More importantly, the coexistence of the two phases produces substantial and opposite strains in the CIPS and IPS regions [14,15]. This mutual strain provides a physical basis for interpreting the effect of In enrichment on the CIPS phase as an effective positive chemical pressure. The interfaces between the chemical phases also modify Cu-ion transport and conductivity [16], while the observed coupling between CIPS/IPS chemical domains and ferrielectric domains demonstrates that compositional heterogeneity, strain, and polarization organization are intrinsically interconnected [15].
The strain effects associated with compositional heterogeneity suggest a close connection between stoichiometry and mechanical pressure. External pressure is known to strongly modify the ferrielectric transition in CIPS [17,18,19,20]. In the low-pressure regime most relevant to the present work, hydrostatic compression shifts TC toward higher temperatures, with a reported pressure coefficient dTC/dp ≈ 210 K GPa⁻¹ [18,19]. A similar trend is observed under uniaxial compression, where TC increases to approximately 324 K at 0.06 GPa [20]. Hydrostatic pressure also modifies the Cu-ion distribution and can substantially enhance the spontaneous polarization through increased occupation of interlayer Cu sites [21]. These observations emphasize the strong coupling between mechanical compression, Cu-site occupancy, and ferrielectric ordering and are consistent with the order–disorder character of the phase transition in CIPS.
At higher pressures, the response of CIPS becomes substantially more complex, involving pronounced changes in Cu coordination, interlayer geometry, lattice dynamics, and eventually crystal symmetry [17,22]. Pressure-induced changes in Cu-related vibrational modes were observed by Raman spectroscopy [17], while the assignment of these modes to Cu-ion dynamics is consistent with earlier temperature-dependent Raman studies [23]. These transformations further emphasize the exceptional sensitivity of the CIPS lattice to the Cu-ion configuration; however, the high-pressure structural regimes lie outside the effective chemical-pressure analogy considered in the present work. Here, the relevant comparison is restricted primarily to the low-pressure regime, in which CIPS remains in the ferrielectric phase and compression modifies Cu-site occupancy and interlayer coupling without inducing the major structural transformations characteristic of higher pressures [24].
Taken together, these studies reveal a striking parallel between compositional and mechanical control of ferrielectricity in CIPS. External compression increases TC, modifies Cu-site occupancy, and affects Cu-ion mobility [18,19,20,21,24], whereas In-rich, Cu-deficient CIPS is known to form CIPS/IPS chemical heterostructures in which lattice mismatch generates compressive strain in the CIPS regions and is likewise accompanied by an increase in TC [13,14,15]. Conversely, the systematic increase in interlayer spacing with increasing Cu content [14] suggests that Cu enrichment may drive the lattice in the opposite direction, producing a tensile or negative-pressure-like response. These observations raise the possibility that deviations from stoichiometry and externally applied pressure act on common microscopic degrees of freedom associated with Cu-ion configuration and interlayer coupling. However, a systematic experimental connection between stoichiometry, effective pressure, lattice dynamics, dielectric response, and ferrielectric domain organization in CuInP₂S₆ has not yet been established.
In this work, we systematically investigate how crystal growth and controlled deviations from stoichiometry modify the ferrielectric properties of CuInP₂S₆. Crystals grown by chemical vapor transport and the Bridgman–Stockbarger method are compared with Cu- and In-enriched samples using compositional analysis, dielectric spectroscopy, Raman spectroscopy, and piezoresponse force microscopy. We show that In enrichment produces a response characteristic of effective positive chemical pressure, whereas Cu enrichment drives the system toward a negative-pressure-like state. The resulting changes in TC, dielectric response, lattice dynamics, and domain morphology can be consistently understood in terms of modifications of the Cu-ion potential landscape, site occupancy, and interlayer coupling. This establishes a unified physical framework linking growth conditions and stoichiometry to chemical pressure and, ultimately, to the mesoscale ferrielectric domain structure of CuInP₂S₆.
2. Materials and Methods
2.1. Crystal Growth and Sample Preparation
CuInP2S6 crystals were first synthesized by Nitsche using chemical vapor transport reactions [25], and subsequent development of melt-growth approaches, including the Bridgman–Stockbarger method [26], enabled the preparation of substantially larger bulk crystals. In the present work, single crystals were grown by both chemical vapor transport (CVT) and directional crystallization from the melt. In addition to nominally stoichiometric CuInP2S6, crystals with controlled deviations from stoichiometry were prepared from starting mixtures enriched with either Cu2S or In2S3.
For CVT growth, the starting materials were sealed in evacuated quartz ampoules approximately 15 cm in length, with CuI used as the transport agent. The temperature of the hot zone was maintained at 913–943 K and that of the cold zone at 903–913 K, corresponding to a temperature difference of 20–40 K. The resulting crystals formed thin platelets whose major faces were parallel to the structural layers; the layer normal was approximately along c*. In addition to nominally stoichiometric material, Cu- and In-enriched crystals were grown from starting mixtures with nominal compositions of 0.9CuInP2S6–0.1Cu2S and 0.9CuInP2S6–0.1In2S3, respectively.
Bulk CuInP2S6 crystals were also prepared by directional crystallization from the melt using the Bridgman–Stockbarger method in a two-zone furnace [27]. The melt and annealing zones were maintained at 1150 and 870 K, respectively, with a temperature gradient of approximately 3 K mm−1 in the crystallization region. The crystallization front was advanced at 2.5 mm day−1, followed by cooling at approximately 200 K day−1. The starting material was synthesized from high-purity elemental components in stoichiometric proportions in quartz ampoules evacuated to approximately 0.013 Pa. The resulting ingots had a diameter of approximately 14 mm and a cylindrical length of 20–25 mm.
Figure 2.
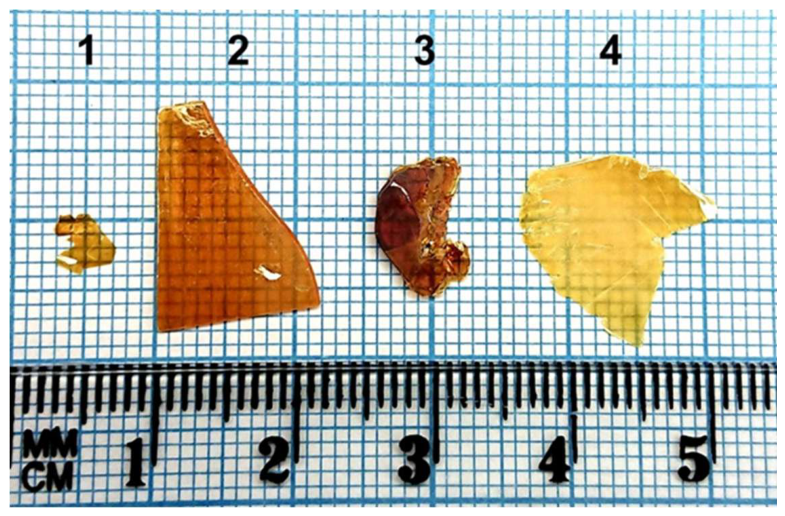
Photographs of CuInP2S6 samples obtained using different growth methods and starting compositions: 1 – gas-transport-grown CuInP2S6, 2 – Bridgman–Stockbarger-grown CuInP2S6, 3 – Cu-enriched CuInP2S6+Cu2S, and 4 – In-enriched CuInP2S6+In2S3.
Figure 2.
Photographs of CuInP2S6 samples obtained using different growth methods and starting compositions: 1 – gas-transport-grown CuInP2S6, 2 – Bridgman–Stockbarger-grown CuInP2S6, 3 – Cu-enriched CuInP2S6+Cu2S, and 4 – In-enriched CuInP2S6+In2S3.
2.2. Structural and Compositional Characterization
Surface morphology and chemical composition were examined using a TESCAN MIRA 3 scanning electron microscope equipped with an EDAX energy-dispersive X-ray spectroscopy (EDS) system. Spectra were acquired and processed using EDAX APEX software. The samples were mounted on double-sided conductive carbon tape (Ted Pella). The compositions reported in Table 1 were obtained by averaging 5–7 local measurements acquired at different positions. Representative SEM images, quantitative results, and EDS spectra are provided in Figure S1–S4 of the Supporting Information. The resulting EDS values are used primarily as comparative indicators of relative Cu/In enrichment rather than as exact bulk stoichiometries.
2.3. Dielectric and Uniaxial-Pressure Measurements
Temperature-dependent dielectric measurements were performed using an automated computer-controlled system incorporating an immersion-type cryostat [28], a Measurement Computing USB-TEMP-AI data-acquisition unit, and an OWON ODP3033 programmable dc power supply. The system allowed heating and cooling rates between 0.001 and 1 K min−1. Temperature was monitored using a PT100/1509A platinum resistance thermometer (TDI Ltd., UK). The temperature-measurement resolution was 0.001 K, with an absolute accuracy of ±2.9 K at 73 K and ±0.27 K at 373 K.
The complex dielectric permittivity was measured using a GW Instek LCR-819 LCR meter over the frequency range 12 Hz–100 kHz [29]. Plate-like samples with thicknesses of approximately 50–100 µm were used, and gold electrodes with areas between approximately 2 × 2 and 5 × 5 mm2 were deposited on the major surfaces. Because these faces are parallel to the structural layers, the ac electric field was applied approximately normal to the layers. The ac measuring voltage was adjusted according to sample thickness so that the electric-field amplitude was maintained at Eac = 1 V cm−1 for all samples. This field is far below the reported coercive field of Ec = 77 kV cm−1 [11], ensuring operation within the linear dielectric-response regime.
To minimize the influence of sample prehistory (“memory” effects), all crystals were held at 100 °C for 3 h before each measurement series. This treatment provided a repeatability of the dielectric data within approximately 1%. Unless otherwise stated, temperature scans used for comparison of the different compositions were performed at a cooling rate of 0.1 K min−1, which minimized temperature gradients across the thin crystals and reduced broadening of the dielectric anomaly near TC.
For measurements under uniaxial compression, the mechanical load was transmitted to the sample through a quartz rod and a gold-coated quartz plate. The plate distributed the force over the sample surface and simultaneously served as one electrical electrode; the opposite electrode was connected to the base of the cryostat sample holder. The applied force was controlled using calibrated weights. In this geometry, the compressive stress was applied approximately normal to the structural layers.
2.4. Raman Spectroscopy
Room-temperature Raman spectra were acquired in reflection geometry using a Renishaw inVia Raman microscope coupled to a Leica DM 2700 optical microscope. An excitation wavelength of 785 nm was used, and the spectral resolution was approximately 0.7 cm⁻¹. The recorded spectra extended from below 50 cm⁻¹ to approximately 600 cm⁻¹, covering both low-frequency cation/lattice modes and higher-frequency internal vibrations of the P₂S₆ units. For cross-sample comparison, the spectra shown in Figure 8 were normalized to the intensity of the prominent P–P-related Raman band. Spectral acquisition and processing were performed using Renishaw WiRE software.
2.5. Piezoresponse Force Microscopy
Piezoresponse force microscopy (PFM) measurements were performed under ambient conditions using a Dimension Icon atomic force microscope (Bruker) equipped with Pt–Ir-coated SCM-PIT conductive probes. Both single-frequency PFM imaging and band-excitation imaging/local polarization-switching measurements were employed. Local switching measurements were typically performed using tip biases between −10 and +10 V.
Because CuInP2S6 exhibits a negative longitudinal piezoelectric coefficient d33, the PFM phase contrast was interpreted accordingly, with a 180° phase difference corresponding to antiparallel out-of-plane polarization states.
The CuInP2S6 samples were electrically connected to metal sample disks (Ted Pella, Prod. No. 16218) using conductive silver paste (Ted Pella, Prod. No. 16035), with the disks connected to ground. Fresh surfaces were prepared immediately before measurement by mechanical exfoliation using the “Scotch-tape” method [30]. PFM images were processed using Gwyddion v.2.49.20171219 [31]. The PFM response was calibrated using a periodically poled lithium niobate reference sample (AR-PPLN 900.241, Asylum Research).
3. Results
3.1. Dielectric Data
The temperature dependences of the real and imaginary components of the complex dielectric permittivity for the four investigated CuInP₂S₆ crystal types are compared in Figure 3. For direct comparison, the curves in Figure 3, Figure 4 and Figure 5 were recorded at a frequency of 10 kHz. The complete temperature–frequency dependences are presented in Figure S5–S8 of the Supporting Information. These data show a pronounced increase in the dielectric response and losses at low frequencies, consistent with a substantial contribution from electrical conductivity and Cu-ion transport [32]. At 10 kHz, this low-frequency conductive contribution is strongly reduced, providing a more reliable comparison of the dielectric anomalies associated with the ferrielectric phase transition.
The complex dielectric permittivity is represented as
ε*(T, f) = ε'(T, f) − iε″(T, f)
Using the eiωt convention, ε′ and ε″ are the real and imaginary (dielectric-loss) components, respectively. The four samples exhibit pronounced differences in both the position and magnitude of the dielectric anomaly. The transition temperatures determined from the dielectric response increase in the sequence 307 K for the Bridgman–Stockbarger crystal, 312 K for the Cu-enriched CuInP₂S₆ + Cu₂S crystal, 317 K for the gas-transport crystal, and 322 K for the In-enriched CuInP₂S₆ + In₂S₃ crystal (Table 1). Thus, deviations from stoichiometry are accompanied by systematic shifts of the ferrielectric transition together with substantial changes in the peak values of ε′ and ε″.
The gas-transport crystal, which has a near-stoichiometric EDS composition, is used here as a practical reference state. Relative to this sample, In enrichment shifts the transition to higher temperature and markedly reduces both ε′ and ε″. This behavior is consistent with the spontaneous chemical phase separation reported for Cu-deficient, In-rich CuInP₂S₆ [13,14], which produces coexisting ferrielectric CuInP₂S₆ (CIPS) and centrosymmetric In₄/₃P₂S₆ (IPS) chemical domains. The reduced fraction of the ferrielectric CIPS component decreases the macroscopic dielectric response, while the lattice mismatch between the CIPS and IPS regions generates compressive strain. The resulting effective positive chemical pressure stabilizes the ferrielectric state and shifts the transition toward higher temperature [13,14].
The systematic displacement of the dielectric anomaly is also evident in the inverse permittivity 1/ε′ shown in Figure 4. The minima and the subsequent high-temperature branches shift progressively toward higher temperature in the same sequence as the transition temperatures listed in Table 1, making the composition-dependent displacement of the phase transition particularly clear.
An additional characteristic of the In-enriched sample is the substantially lower dielectric loss in the paraelectric region (Figure 3b). Cu-ion redistribution among nonequivalent crystallographic sites is closely connected with the dielectric and ionic response of CuInP₂S₆ [11]. The suppressed ε″ observed in the In-rich sample therefore suggests that the CIPS/IPS chemical microstructure, together with the associated strain and pinning, restricts the long-range contribution of mobile Cu-related species to the dielectric response. In contrast, Cu enrichment shifts the transition below that of the gas-transport reference and retains a comparatively strong dielectric-loss contribution, indicating an opposite trend in the stability and mobility of the Cu sublattice.
To establish an experimental reference for the effect of mechanical compression, the dielectric response was also measured under uniaxial pressure. As shown in Figure 5, increasing compression shifts both the ε′ and ε″ anomalies toward higher temperature. The transition temperature increases from approximately 317 K at 0 MPa to about 319 K at 5 MPa and approximately 323 K at 25 MPa. Over this low-pressure interval, the shift is approximately linear and corresponds to a pressure coefficient of the order of 2 × 10² K GPa⁻¹.
Figure 6 compares the present low-pressure results with previously reported pressure dependences [18,19]. Both datasets show a positive pressure coefficient of the transition temperature. The agreement demonstrates that relatively modest mechanical compression stabilizes the ferrielectric phase and provides a direct experimental reference for the comparison between mechanical pressure and stoichiometry-induced internal strain developed in Section 3.2.
3.2. Comparison of Stoichiometry and Pressure Effects
The dielectric results reveal a direct parallel between the effects of external compression and deviations from stoichiometry. Mechanical compression shifts the ferrielectric transition toward higher temperature, while among the compositionally modified samples the same trend is observed for In enrichment. Cu enrichment produces the opposite response and shifts the transition toward lower temperature. These observations indicate that stoichiometry and external pressure act, at least in the low-pressure regime, on closely related structural degrees of freedom that control the stability of the ferrielectric state.
Hydrostatic-pressure studies [18,19] and the uniaxial-pressure measurements discussed above [20] consistently yield a positive pressure coefficient of the transition temperature, with a characteristic low-pressure value of approximately 210 K GPa⁻¹ [18,19]:
∂TC/∂p > 0
This behavior is consistent with the order–disorder character of the transition in CuInP2S6, in which compression modifies the relative stability and occupation of nonequivalent Cu positions. At low pressures, compression is also accompanied by an enhancement of spontaneous polarization and redistribution of Cu ions among available sites [21]. The present comparison is therefore restricted to this low-pressure regime; the more complex structural transformations reported at substantially higher pressures [24] are outside the chemical-pressure analogy considered here.
For a phenomenological comparison, the stoichiometry-induced shift of the transition temperature can be expressed as an equivalent pressure using the experimentally established low-pressure coefficient:
where TC,ref is the transition temperature of the near-stoichiometric reference crystal and (∂TC/∂p)mech is the mechanical pressure coefficient. This relation provides only an operational, order-of-magnitude scale for comparing the magnitude of the stoichiometry-induced TC shift with that produced by external mechanical compression. It is not intended to imply strict thermodynamic equivalence between chemical substitution and applied stress, because stoichiometric variation simultaneously alters local chemistry, defect density and (in the In-rich limit) the CIPS/IPS phase fraction.
The microscopic basis of this correspondence is particularly clear for In-rich crystals. Cu-deficient, In-enriched CuInP2S6 undergoes chemical phase separation into ferrielectric CIPS and centrosymmetric In4/3P2S6 (IPS) regions [13]. The lattice mismatch between these chemical domains produces strain in the CIPS component [14], so that In enrichment acts as an effective positive chemical pressure. The resulting increase of TC therefore follows the same direction as that produced by external compression.
Cu enrichment leads to the opposite tendency. The composition dependence of the interlayer spacing reported for the CIPS/IPS system [14] indicates that increasing the Cu content expands the van der Waals-separated structure relative to the In-rich limit. Accordingly, the decrease of TC observed for Cu-rich crystals can be described as a negative-pressure-like, or tensile, response. This terminology should be understood as an effective structural analogy: changes in stoichiometry simultaneously modify local chemistry, defect concentration, phase fraction, and Cu-ion configuration and therefore cannot be reduced to mechanical pressure alone.
Figure 7 thus summarizes an experimentally useful correspondence between stoichiometry and pressure. Both parameters influence Cu-site occupancy (Cu1, Cu2, and Cu3) [11], interlayer geometry, and the barriers governing Cu-ion redistribution, thereby shifting the balance between long-range ferrielectric order and local dynamic disorder. This framework provides the basis for comparing the vibrational response of the same samples in Section 3.3 and, subsequently, their domain structures.
3.3. Raman Spectroscopy
Room-temperature Raman spectra of CuInP₂S₆ crystals grown by different methods and with controlled deviations from stoichiometry are compared in Figure 8. The spectra extend from below 50 cm⁻¹ to approximately 600 cm⁻¹, encompassing both low-frequency lattice and cation-related modes and higher-frequency internal vibrations of the P₂S₆ units. For comparison of relative spectral intensities, all spectra were normalized to the intensity of the prominent P–P-related Raman band and were subsequently vertically offset for clarity. All four samples retain the characteristic vibrational fingerprint of CuInP₂S₆ reported previously [23], indicating that the principal structural framework is preserved. At the same time, reproducible differences in relative intensities, linewidths, and positions of several bands demonstrate that the lattice dynamics are sensitive to both growth conditions and cation stoichiometry.
Figure 8.
Room-temperature Raman spectra of CuInP₂S₆ crystals: 1 - Cu-enriched CuInP₂S₆ + Cu₂S; 2 - In-enriched CuInP₂S₆ + In₂S₃; 3 - Bridgman–Stockbarger growth; 4 - gas-transport growth. Spectra were normalized to the P–P-related band and vertically offset for clarity; mode assignments for sample 4 follow Ref. [23].
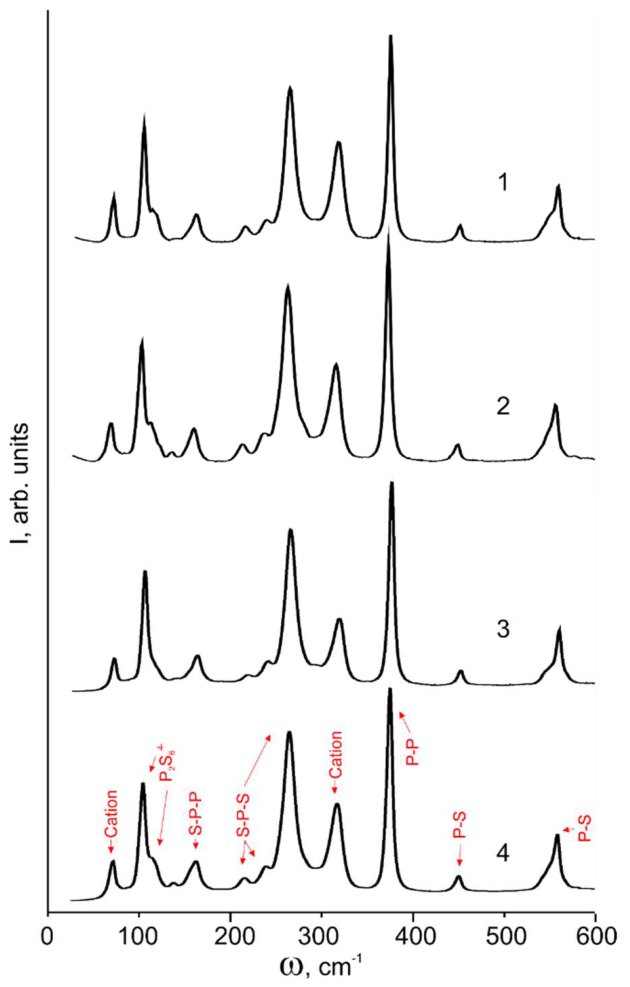
According to the mode assignments established in Ref. [23], the low-frequency part of the spectrum is dominated by lattice and framework vibrations involving Cu- and In-related displacements together with deformations of the sulfur coordination polyhedra, whereas the higher-frequency region contains predominantly internal vibrations of the P₂S₆ units. The spectra below approximately 200 cm⁻¹ contain several well-resolved features whose relative intensities, widths, and positions differ among the four samples. Because these modes involve the cation sublattices and relatively soft framework deformations, their sensitivity to composition and growth conditions provides direct evidence that the local cation environment and the low-energy lattice dynamics are modified by stoichiometry.
Clear composition-dependent differences are also observed in the intermediate-frequency region. In particular, the relative intensities and widths of the bands in the approximately 250–350 cm⁻¹ range vary systematically among the samples. The In-enriched crystal shows a pronounced redistribution of spectral weight in this region, together with small frequency shifts and broadening, consistent with the chemically heterogeneous CIPS/IPS state and its associated local strain and modified cation–framework coupling. The Cu-enriched crystal exhibits a different spectral profile, indicating that excess Cu modifies the local potential landscape and cation–framework interactions in a distinct manner.
At higher frequencies, the strong bands associated predominantly with internal vibrations of the P₂S₆ structural units remain present in all four samples. The prominent P–P-related band near 375 cm⁻¹ and the P–S-related features in the approximately 450–600 cm⁻¹ region [23,24] therefore confirm that the basic anionic framework remains intact. Because the spectra were normalized to the P–P-related band, the observed changes in the other modes represent a redistribution of Raman intensity relative to this internal structural reference. The comparatively stronger changes in the low- and intermediate-frequency regions indicate that stoichiometry primarily perturbs the softer cation- and framework-related degrees of freedom rather than reconstructing the P₂S₆ units.
Pressure-dependent Raman studies at substantially higher, multi-GPa pressures reveal a complex and non-monotonic evolution of the CIPS vibrational spectrum [33]. Those pressure regimes lie far outside the low-pressure range relevant to the present pressure–stoichiometry comparison, and the Raman spectra are therefore not used here to assign a quantitative equivalent mechanical pressure to a particular composition. Instead, they provide an independent probe showing that stoichiometric modification affects the low-energy cation–lattice degrees of freedom that are central to the ferrielectric instability.
Taken together, the Raman data provide an independent microscopic link between stoichiometry and the Cu-ion/lattice dynamics of CIPS. The composition-dependent shift of the ferrielectric transition is accompanied by systematic modifications of low-energy modes associated with cation displacement and framework deformation, while the internal P₂S₆ vibrational framework remains largely preserved. Combined with the dielectric and theoretical results, these observations support a common microscopic picture in which stoichiometry modifies the Cu-ion configurational landscape, local strain, and interlayer coupling. The pressure analogy remains phenomenological: Raman spectroscopy identifies changes in the relevant lattice degrees of freedom, but does not by itself establish a quantitative pressure equivalence.
4. Microscopic Interpretation and First-Principles Support
4.1. Cu-Ion Energy Landscape and the Stoichiometry–Pressure Correspondence
The experimental results presented above can be understood within a common microscopic picture in which the ferrielectric state of CuInP₂S₆ is governed by the occupation and redistribution of Cu ions among several nonequivalent positions, together with the counter-displacement of the In sublattice. Electron-diffraction measurements show that the probability distribution of Cu becomes progressively more symmetric on heating through the ferrielectric transition, while a small but finite population of interlayer tetrahedral Cu sites appears at higher temperature [11]. Thus, the transition is intrinsically connected with a multi-site, multiwell Cu-ion energy landscape rather than with a single displacive coordinate.
Microscopic descriptions based on local multiwell potentials and coupled cation–lattice degrees of freedom have been developed for thiophosphate ferroelectrics [34,35] and, more specifically, for CIPS within a mixed Ising-type description [36]. These approaches emphasize that relatively small changes in local bonding, interlayer coupling, or site energies can redistribute the statistical occupation of competing Cu positions. Pressure studies of related thiophosphates likewise demonstrate that the polar state is highly sensitive to changes in bond character and lattice geometry [19,37]. For the present work, however, the experimentally relevant variables are the Cu-site energy landscape and interlayer coupling, because both are directly affected by external stress and by composition-dependent internal strain.
A particularly useful phenomenological framework was developed by Morozovska et al. [38] using an eighth-order Landau–Ginzburg–Devonshire (LGD) expansion for CIPS. Importantly, the pressure-dependent dielectric data used to parameterize this model included the earlier measurements of compositionally modified and uniaxially compressed CuInP₂S₆ crystals reported in our FM&NT-2020 work [39]. In the homogeneous, zero-field limit, the stress-dependent part of the reconstructed free-energy density can be written in the form
where P₃ is the polarization component normal to the layers, σᵢ denotes the applied stress components (Voigt notation), and Qᵢ₃ and Zᵢ₃₃ are the linear and nonlinear electrostriction coefficients, respectively [38]. The inclusion of the eighth-order term is essential for reproducing the multiwell thermodynamic potential and the experimentally observed pressure dependence of CIPS. Both sets of coefficients are strongly temperature-dependent and possess unconventional (partly inverted) signs that are characteristic of CIPS (see SI section 3). In particular, the longitudinal linear coefficient Q33 is negative over a wide temperature range, which accounts for the experimentally observed negative piezoelectric coefficient d33 of bulk CIPS. The nonlinear coefficients Zi33 are essential for reproducing the multiwell thermodynamic potential and the experimentally observed pressure dependence of the transition temperature. Their inclusion allows intermediate negative (tensile) pressure to render the competing potential wells shallow and nearly equal in energy, producing an almost flat free-energy profile. Such a flattened multiwell landscape is fully consistent with the experimental signatures observed for Cu enrichment: reduced TC, enhanced dielectric loss, Raman evidence of modified low-frequency cation–lattice dynamics, and the fragmented, weakly correlated domain state revealed by PFM. In this regime the energetic barriers between competing Cu-site configurations are lowered, increasing the configurational freedom of Cu ions and reducing the energetic preference for long-range ferrielectric order. Conversely, the response of the In-enriched crystals maps onto the positive-pressure side of the same landscape. Lattice mismatch within the CIPS/IPS chemical heterostructure generates compressive strain in the CIPS regions, deepening the polar wells, raising TC and favoring a more rigid, strongly biased domain configuration. Thus, the entire experimental series - from Cu-enriched (negative-pressure-like) through near-stoichiometric gas-transport to In-enriched (positive-pressure-like) - can be placed on a single continuous axis of the multiwell LGD potential controlled by the effective interlayer strain and Cu-site energetics. The correspondence remains phenomenological rather than strictly thermodynamic, because stoichiometric variation simultaneously alters local chemistry, defect density and, in the In-rich limit, the CIPS/IPS phase fraction. Nevertheless, both chemical and mechanical control parameters act on the same microscopic degrees of freedom.
4.2. First-Principles Calculations
To examine how weakened interlayer coupling affects the local electronic and vibrational structure, first-principles calculations were performed for bulk CIPS and for a single-layer (1L) periodic-supercell model. The calculations were based on density-functional theory [40,41] as implemented in CASTEP [42]. The exchange–correlation energy was described within the generalized-gradient approximation using the PBE functional [43], and a dispersion correction was included to account for long-range van der Waals interactions [44]. Ultrasoft pseudopotentials were employed [45]. Structural optimization was carried out before property calculations, using a plane-wave cutoff energy of 880 eV and a total-energy convergence criterion of 10⁻⁶ eV atom⁻¹. Brillouin-zone integrations used Monkhorst-Pack k-point sampling [46], and vibrational properties were calculated within the finite-displacement approach [47].
The 1L model was generated from the bulk structural unit by introducing a 5 Å vacuum region normal to the natural layers and applying periodic boundary conditions. Because the vacuum-thickness convergence was not examined systematically, this model should be regarded as a qualitative representation of strongly reduced interlayer coupling rather than as a fully isolated monolayer. Its purpose is to identify trends in charge redistribution and lattice dynamics associated with weakening the interlayer environment, rather than to reproduce quantitatively the properties of an isolated CIPS monolayer.
4.3. Bulk–Single-Layer Comparison and Implications for Interlayer Coupling
The Mulliken analysis in Table 2 shows only moderate changes on going from the bulk structure to the 1L model, but the direction of the change is systematic: the positive charge associated with Cu and In decreases slightly, while the magnitude of the negative S charge is also reduced. The calculated values therefore indicate a modest redistribution of charge when the interlayer environment is strongly reduced, consistent with the mixed ionic–covalent character of bonding in CIPS.
The vibrational-frequency distributions provide a clearer fingerprint of the loss of interlayer coupling (Figure 9). Several frequency intervals become narrower in the 1L calculation and individual modes shift, reflecting the strongly reduced interlayer coupling and the relaxation of the 1L periodic model. The changes are not consistent with a simple uniform expansion of all bonds: for example, the calculated monolayer thickness changes from 3.382 to 3.397 Å and the layer-thickness parameter from 9.922 to 9.941 Å, whereas the P–P distance remains essentially unchanged (2.250 and 2.249 Å for bulk and 1L, respectively). The calculated response is therefore better described as a redistribution of interatomic interactions caused by the modified interlayer boundary condition.
The sensitivity of the lattice dynamics to the polar state is independently illustrated by the calculated Raman spectra of bulk CIPS (Figure 10). The ferrielectric and paraelectric structures show pronounced differences in the number, positions, and relative intensities of Raman-active features, confirming that the vibrational spectrum is strongly coupled to the Cu-ion configuration and the associated structural relaxation. This result is consistent with the experimental Raman trends discussed in Section 3.3, where composition-dependent changes are particularly evident in the low-frequency cation/lattice modes and in the intermediate-frequency region involving coupled cation–framework motions.
Overall, the LGD and first-principles results support the same physical picture from complementary scales. The phenomenological model [38] shows that negative pressure can flatten the multiwell free-energy landscape, while the 1L calculations demonstrate that weakening the interlayer environment measurably modifies charge redistribution and lattice dynamics. The 1L model should therefore be viewed as a qualitative limiting case of reduced interlayer coupling rather than as a literal representation of either an isolated monolayer or Cu-rich CIPS. Within this interpretation, Cu enrichment moves CIPS toward a softer, negative-pressure-like state, whereas In-rich CIPS/IPS heterostructures generate an internal compressive environment closer to the positive-pressure side. This microscopic framework provides a direct link between stoichiometry, lattice dynamics, and the strongly composition-dependent ferrielectric domain structures discussed in the following section.
5. Stoichiometry- and Growth-Induced Evolution of Domain Structure in CuInP₂S₆
The pressure–stoichiometry correspondence established from the dielectric and theoretical analyses, together with the Raman evidence for composition-dependent changes in lattice dynamics, is also reflected at the mesoscale in the polar domain structure. Figure 11 compares PFM amplitude and phase images with local switching loops for CuInP₂S₆ crystals grown by the Bridgman–Stockbarger and gas-transport methods and for crystals prepared from Cu₂S- and In₂S₃-enriched starting compositions. All four samples exhibit an approximately 180° PFM phase contrast, consistent with antiparallel out-of-plane polarization states, but the domain size, spatial uniformity, and local switching behavior differ markedly. These differences show that both stoichiometry and the defect landscape introduced during crystal growth strongly influence the organization of the ferrielectric state.
5.1. Reference Domain State and Growth-Induced Defect Pinning
Among the investigated samples, the gas-transport crystal (Figure 11c,g,k,o) provides the closest practical reference to a near-stoichiometric, weakly defect-pinned state. Its phase image consists of a dense and relatively uniform pattern of well-defined domains with sharp contrast, similar to previously reported PFM observations of CIPS [48]. The local phase loop is comparatively symmetric and exhibits only a small imprint. This behavior is consistent with a lower density of extended growth defects and internal bias fields than in crystals grown from the melt, so that the observed domain morphology is governed more strongly by the intrinsic order–disorder character of CIPS.
The Bridgman–Stockbarger crystal (Figure 11a,e,i,m) shows a distinctly different mesoscale organization. Large, irregular domains coexist with strongly nonuniform PFM amplitude contrast, while the local phase loop remains well developed. This combination suggests that the ferrielectric state itself is robust, but that domain-wall positions are strongly influenced by extended structural inhomogeneities created during melt growth. The local switching loop probes only a nanoscale region beneath the tip; consequently, a locally symmetric loop can coexist with pronounced large-scale pinning visible in the domain image.
The AFM topography in Figure 12 provides direct evidence for such structural heterogeneity. A discontinuity of the upper surface layer exposes an underlying region containing elongated topographic features with a different orientation. Because adjacent CIPS layers are coupled by comparatively weak van der Waals interactions, growth features and defect lines need not remain perfectly registered from one layer to the next. The resulting three-dimensional strain and defect landscape can therefore act as a network of preferential pinning sites for domain walls, explaining the large but irregular domains observed in the Bridgman–Stockbarger sample.
It should be noted that the Bridgman–Stockbarger crystal is simultaneously Cu-rich according to EDS (Table 1) and contains extended growth-induced structural inhomogeneities. The lowered transition temperature (307 K) is therefore consistent with a negative-pressure-like stoichiometric contribution, while the large, irregular domains and strong spatial nonuniformity of the PFM amplitude reflect additional domain-wall pinning by the three-dimensional defect landscape created during melt growth. These two contributions — thermodynamic softening of the Cu-ion energy landscape and defect-mediated pinning — act concurrently and cannot be fully separated in the present data.
5.2. Stoichiometry-Driven Evolution of Domain Morphology and Switching
Cu enrichment produces a different type of domain disorder (Figure 11b,f,j,n). The phase pattern becomes more spatially heterogeneous, with irregular and locally discontinuous domain boundaries, while the local switching response broadens and becomes more asymmetric. Within the framework developed in Section 3 and Section 4, this behavior is consistent with a negative-pressure-like perturbation. The reduction of TC and the softening of the Cu-ion energy landscape decrease the energetic separation between competing local polar configurations. Polarization reversal can therefore acquire a stronger contribution from local Cu-ion reconfiguration and random internal fields, rather than being determined solely by coherent domain-wall motion. The PFM images provide the mesoscale counterpart of this softer, more weakly correlated polar state.
The In-enriched sample (Figure 11d,h,l,p) exhibits the opposite limiting behavior. The phase image is dominated by one polarization orientation, with only sparse regions of opposite contrast, and the local phase loop shows a pronounced bias. A related strongly asymmetric domain population was reported for CIPS/In4/3P2S6 heterostructures with compositionally segregated chemical domains [13], although the detailed domain morphology is also sensitive to thermal history. The present response is consistent with In₄/₃P₂S₆-rich chemical regions, which are known to generate compressive strain in the CIPS component and therefore an effective positive chemical pressure [13,14,15]. The corresponding increase in TC and the stabilization of the polar free-energy minima favor a more rigid polarization configuration and stronger domain pinning. Thus, In enrichment stabilizes the ferrielectric state thermodynamically while simultaneously reducing the configurational freedom of the domain pattern.
5.3. Unified Picture of Composition, Growth Defects, and Domain Organisation
The PFM results separate two complementary mechanisms controlling the domain structure of CIPS. Stoichiometric deviation primarily changes the thermodynamic landscape through composition-dependent strain, Cu-site occupancy, and interlayer coupling. Cu enrichment moves the system toward a softer negative-pressure-like regime, whereas the In-enriched response is consistent with a positive chemical-pressure contribution associated with CIPS/IPS phase segregation. The growth method, in contrast, primarily determines the distribution of extended structural defects and the associated pinning and internal-field landscape.
These mechanisms are not independent. A local change in the Cu-ion potential landscape determines how readily a polar region can reconfigure, whereas growth defects and chemical interfaces determine where such reconfiguration is spatially favored or inhibited. The resulting domain morphology is therefore a mesoscale manifestation of the same microscopic variables that control the dielectric anomaly and Raman response: Cu-ion configurational freedom, interlayer coupling, strain, and defect-mediated pinning. This correspondence links the structural, dielectric, vibrational, and PFM observations within a single physical picture and provides the basis for the conclusions drawn below.
The observed differences in domain morphology are consistent with the unconventional switching dynamics of CIPS, in which polarization reversal is mediated primarily by single Cu-dipole flips rather than by classical domain-wall motion. Consequently, local changes in the Cu-ion energy landscape (induced by stoichiometry or growth defects) strongly influence both the mobility of polar regions and the effectiveness of pinning centers.
The observed differences in domain morphology are also consistent with the multi-pathway nature of Cu-ion dynamics in CIPS. Cu-ion migration proceeds via two distinct channels: low-barrier intralayer hopping (primarily responsible for polarization switching) and higher-barrier interlayer hopping across the van der Waals gap (responsible for long-range ionic conductivity). Density-functional calculations yield characteristic migration barriers of approximately 0.05 eV for intralayer Cu1–Cu2 hopping, 0.7 eV for the polar Cu1u–Cu1d flip, and 1.1 eV for interlayer migration [49]. Experimental activation energies extracted from ionic conductivity (0.6–0.7 eV) are consistent with the higher of the intralayer barriers and a partial contribution of interlayer processes [4,32]. Stoichiometric deviations and growth-induced defects modify the relative accessibility of these pathways, thereby coupling the Cu-ion configurational landscape to the observed shifts in TC, dielectric response and domain morphology.
The principal relationships between stoichiometry, growth conditions, domain morphology, local switching behavior, and the corresponding physical interpretation are summarized in Table 3.
6. Conclusions
The present study demonstrates that the ferrielectric properties of CuInP₂S₆ are highly sensitive to both deviations from stoichiometry and the defect landscape introduced by crystal-growth conditions. Systematic comparison of Bridgman–Stockbarger, gas-transport, Cu-enriched and In-enriched crystals reveals consistent shifts in transition temperature, dielectric response and mesoscale domain morphology. These observations are unified by a common microscopic picture based on composition- and growth-dependent changes in Cu-ion configurational freedom, interlayer coupling, strain and defect-mediated pinning. In enrichment shifts the ferrielectric transition to higher temperature and is consistent with the formation of CIPS/In₄/₃P₂S₆ chemical heterostructures. The associated lattice mismatch produces an effective positive chemical pressure on the CIPS regions, stabilizing the polar state and favoring a rigid, strongly biased domain configuration. Cu enrichment produces the opposite trend: lower TC, enhanced dielectric loss and a more fragmented domain state, all of which are characteristic of a negative-pressure-like softening of the Cu-ion energy landscape. This stoichiometry–pressure correspondence is supported by uniaxial-pressure measurements, the multiwell Landau–Ginzburg–Devonshire description and first-principles comparisons of bulk and weakly coupled single-layer CIPS. The analogy is phenomenological rather than strictly thermodynamic, yet both chemical and mechanical control parameters act on the same underlying degrees of freedom associated with Cu-ion configuration and interlayer interactions. Crystal-growth conditions provide an independent control parameter. Gas-transport crystals exhibit the most uniform domain organization and the smallest local imprint, whereas melt-grown crystals contain extended structural inhomogeneities that strongly influence domain-wall pinning. Consequently, the observed PFM morphology is a mesoscale manifestation of the combined thermodynamic and defect landscapes. Overall, the results establish stoichiometry, internal chemical pressure and growth-induced defects as interconnected and experimentally accessible tools for tuning ferrielectric order in CuInP₂S₆. The demonstrated ability to systematically change the transition temperature, dielectric losses and domain morphology through stoichiometry and growth conditions offers a practical route toward optimizing CIPS for memristive, neuromorphic and non-volatile memory applications, where controlled Cu-ion dynamics and stable polar domain configurations are decisive for device performance and reliability.
Supplementary Materials
The following supporting information can be downloaded at the website of this paper posted on Preprints.org. Figure S1–S4, representative SEM images and EDS analyses; Figure S5–S8, complete temperature–frequency dielectric spectra; Section S3, Landau–Ginzburg–Devonshire electrostriction coefficients used in the analysis.
Author Contributions
Conceptualization, A.M.; methodology, D.G., S.L., I.R., M.V., L.P., A.K., N.D., K.G. and A.M.; formal analysis, K.G. and A.M.; investigation, D.G., S.L., I.R., M.V., L.P. and A.M.; data curation, D.G. and A.M.; visualization, D.G., K.G. and A.M.; writing—original draft preparation, A.M.; writing-review and editing, all authors; supervision, A.M. All authors have read and agreed to the published version of the manuscript.
Funding
This research was funded by the Ministry of Education and Science of Ukraine (Research Work No. 0124U004302—PH/41-2024; state-budget projects Nos. 0125U001555 and 0126U001941), the European Union’s Horizon Europe Marie Skłodowska-Curie Staff Exchanges program (Grant No. 101131229—Piezo2D), and project TKP2021-NVA-04. Additional support was provided by the Bolyai János Research Scholarship of the Hungarian Academy of Sciences.
Institutional Review Board Statement
Not applicable.
Informed Consent Statement
Not applicable.
Data Availability Statement
The data presented in this study are available within the article and its Supporting Information. Additional raw data are available from the corresponding author upon reasonable request.
Acknowledgments
During the preparation of this manuscript, the authors used ChatGPT (OpenAI, GPT-5.6) and Grammarly for language editing, restructuring, drafting support, grammar correction, and improving readability. All scientific interpretations, numerical results, data selection, and conclusions were critically reviewed and verified by the authors, who take full responsibility for the content of the publication.
Conflicts of Interest
The authors declare no conflict of interest.
References
- Susner, M.A.; Chyasnavichyus, M.; McGuire, M.A.; Ganesh, P.; Maksymovych, P. Metal Thio- and Selenophosphates as Multifunctional van der Waals Layered Materials. Adv. Mater. 2017, 29, 1602852. [Google Scholar] [CrossRef]
- Wang, F.M.; Shifa, T.A.; Yu, P.; He, P.; Liu, Y.; Wang, F.; Wang, Z.; Zhan, X.; Lou, X.; Xia, F.; He, J. New Frontiers on van der Waals Layered Metal Phosphorous Trichalcogenides. Adv. Funct. Mater. 2018, 28, 1802151. [Google Scholar] [CrossRef]
- Liu, F.; You, L.; Seyler, K.L.; Li, X.; Yu, P.; Lin, J.; Wang, X.; Zhou, J.; Wang, H.; He, H.; Pantelides, S.T.; Zhou, W.; Sharma, P.; Xu, X.; Ajayan, P.M.; Wang, J.; Liu, Z. Room-temperature ferroelectricity in CuInP₂S₆ ultrathin flakes. Nat. Commun. 2016, 7, 12357. [Google Scholar] [CrossRef]
- Zhou, S.; You, L.; Zhou, H.; Pu, Y.; Gui, Z.; Wang, J. Van der Waals layered ferroelectric CuInP₂S₆: Physical properties and device applications. Front. Phys. 2021, 16, 13301. [Google Scholar] [CrossRef]
- Ghani, M.A.; Sarkar, S.; Li, Y.; Wang, Y.; Watanabe, K.; Taniguchi, T.; Wang, Y.; Chhowalla, M. Ferroelectric field effect transistors based on two-dimensional CuInP₂S₆ (CIPS) and graphene heterostructures. MRS Energy Sustain. 2024, 11, 616–623. [Google Scholar] [CrossRef]
- Zhao, L.; Liang, Y.; Ma, J.; Pan, Z.; Liu, X.; Yang, M.; Sun, Y.; Gao, W.; Li, B.; Li, J.; Huo, N. Ultra-Steep-Slope and High-Stability of CuInP₂S₆/WS₂ Ferroelectric Negative Capacitor Transistors by Passivation Effect and Dual-Gate Modulation. Adv. Funct. Mater. 2023, 33, 2306708. [Google Scholar] [CrossRef]
- Liu, Y.; Wu, Y.; Wang, B.; Chen, H.; Yi, D.; Liu, K.; Nan, C.W.; Ma, J. Versatile memristor implemented in van der Waals CuInP₂S₆. Nano Res. 2023, 16, 10191–10197. [Google Scholar] [CrossRef]
- Peng, J.; Zou, G.; Huo, J.; Li, Z.; Sun, T.; Feng, B.; Du, C.; Huo, J.; Liu, L. Robust Neuromorphic Computing Enabled by Femtosecond Laser-Modulated Divergent Ion Dynamics in CuInP₂S₆. Adv. Funct. Mater. 2025, 35, 2504334. [Google Scholar] [CrossRef]
- Wang, Z.; Li, J.; Fan, X.; Tang, W.; Zhu, H.; Li, L. CuInP₂S₆ Heterojunction Based Visible Range Optoelectronic Synapse With Femtojoule Energy Consumption. Adv. Mater. Technol. 2025, 10, 2401589. [Google Scholar] [CrossRef]
- Maisonneuve, V.; Evain, M.; Payen, C.; Cajipe, V.B.; Molinié, P. Room-temperature crystal structure of the layered phase CuInP₂S₆. J. Alloys Compd. 1995, 218, 157–164. [Google Scholar] [CrossRef]
- Maisonneuve, V.; Cajipe, V.B.; Simon, A.; von der Muhll, R.; Ravez, J. Ferrielectric ordering in lamellar CuInP₂S₆. Phys. Rev. B 1997, 56, 10860–10868. [Google Scholar] [CrossRef]
- Dziaugys, A.; Banys, J.; Vysochanskii, Y. Broadband dielectric investigations of indium rich CuInP₂S₆ layered crystals. Z. Krist. 2011, 226, 171–176. [Google Scholar] [CrossRef]
- Susner, M.A.; Chyasnavichyus, M.; Puretzky, A.A.; He, Q.; Conner, B.S.; Ren, Y.; Cullen, D.A.; Ganesh, P.; Shin, D.; Demir, H.; McMurray, J.W.; Borisevich, A.Y.; Maksymovych, P.; McGuire, M.A. Cation–Eutectic Transition via Sublattice Melting in CuInP₂S₆/In₄/₃P₂S₆ van der Waals Layered Crystals. ACS Nano 2017, 11, 7060–7073. [Google Scholar] [CrossRef]
- Susner, M.A.; Belianinov, A.; Borisevich, A.; He, Q.; Chyasnavichyus, M.; Demir, H.; Sholl, D.S.; Ganesh, P.; Abernathy, D.L.; McGuire, M.A.; Maksymovych, P. High-TC Layered Ferrielectric Crystals by Coherent Spinodal Decomposition. ACS Nano 2015, 9, 12365–12373. [Google Scholar] [CrossRef]
- Rao, R.; Selhorst, R.; Jiang, J.; Conner, B.S.; Siebenaller, R.; Rowe, E.; Giordano, A.N.; Pachter, R.; Susner, M.A. Investigating Strain between Phase-Segregated Domains in Cu-Deficient CuInP₂S₆. Chem. Mater. 2023, 35, 8020–8029. [Google Scholar] [CrossRef]
- Checa, M.; Jin, X.; Millan-Solsona, R.; Neumayer, S.M.; Susner, M.A.; McGuire, M.A.; O’Hara, A.; Gomila, G.; Maksymovych, P.; Pantelides, S.T.; Collins, L. Revealing Fast Cu-Ion Transport and Enhanced Conductivity at the CuInP₂S₆–In₄/₃P₂S₆ Heterointerface. ACS Nano 2022, 16, 15347–15357. [Google Scholar] [CrossRef]
- Grzechnik, A.; Cajipe, V.B.; Payen, C.; McMillan, P.F. Pressure-induced phase transition in ferrielectric CuInP₂S₆. Solid State Commun. 1998, 108, 43–47. [Google Scholar] [CrossRef]
- Shusta, V.S.; Prits, I.P.; Guranich, P.P.; Gerzanich, E.I.; Slivka, A.G. Dielectric properties of CuInP₂S₆ crystals under high pressure. Condens. Matter Phys. 2007, 10, 91–94. [Google Scholar] [CrossRef]
- Guranich, P.; Shusta, V.; Gerzanich, E.; Slivka, A.; Kuritsa, I.; Gomonnai, O. Influence of hydrostatic pressure on the dielectric properties of CuInP₂S₆ and CuInP₂Se₆ layered crystals. J. Phys. Conf. Ser. 2007, 79, 012009. [Google Scholar] [CrossRef]
- Shusta, O.V.; Slivka, A.G.; Kedylich, V.M.; Guranich, P.P.; Shusta, V.S.; Gerzanich, E.I.; Prits, I.P. Effect of Uniaxial Pressure on the Dielectric Properties of CuInP₂S₆ Crystals. Sci. Bull. Uzhhorod Univ. Ser. Phys. 2010, 28, 44–46. [Google Scholar] [CrossRef]
- Yao, X.; Bai, Y.; Jin, C.; Zhang, X.; Zheng, Q.; Xu, Z.; Chen, L.; Wang, S.; Liu, Y.; Wang, J.; Zhu, J. Anomalous polarization enhancement in a van der Waals ferroelectric material under pressure. Nat. Commun. 2023, 14, 4301. [Google Scholar] [CrossRef]
- Bu, K.; Fu, T.; Du, Z.; Feng, X.; Wang, D.; Li, Z.; Guo, S.; Sun, Z.; Luo, H.; Liu, G.; Ding, Y.; Zhai, T.; Li, Q.; Lü, X. Enhanced Second-Harmonic Generation of van der Waals CuInP₂S₆ via Pressure-Regulated Cationic Displacement. Chem. Mater. 2023, 35, 242–250. [Google Scholar] [CrossRef]
- Vysochanskii, Y.M.; Stephanovich, V.A.; Molnar, A.A.; Cajipe, V.B.; Bourdon, X. Raman spectroscopy study of the ferroelectric-paraelectric transition in layered CuInP₂S₆. Phys. Rev. B 1998, 58, 9119–9124. [Google Scholar] [CrossRef]
- Zhou, Z.; Zhang, J.-J.; Turner, G.F.; Moggach, S.A.; Lekina, Y.; Morris, S.; Wang, S.; Hu, Y.; Li, Q.; Xue, J.; Feng, Z.; Yan, Q.; Weng, Y.; Xu, B.; Fang, Y.; Shen, Z.X.; Fang, L.; Dong, S.; You, L. Sliding-mediated ferroelectric phase transition in CuInP₂S₆ under pressure. Appl. Phys. Rev. 2024, 11, 011414. [Google Scholar] [CrossRef]
- Nitsche, R.; Wild, P. Crystal growth of metal-phosphorus-sulfur compounds by vapor transport. Mater. Res. Bull. 1970, 5, 419–423. [Google Scholar] [CrossRef]
- Nitsche, R. Crystal chemistry, growth and properties of multi-cation chalcogenides. J. Phys. Colloq. 1975, 36(C3), 9–15. [Google Scholar] [CrossRef]
- Prits, I.P.; Mayor, M.M.; Vysochanskii, Y.M.; Molnar, A.A.; Gurzan, M.I.; Korda, N.F. Preparation of CuInP₂S₆ Single Crystals by Chemical Vapour Transport Reactions and Directional Crystallisation from the Melt and Their Ferroelectric Properties. In Proceedings of the 8th International Symposium High-Purity Metallic and Semiconductor Materials, (In Russian) Kharkiv, Ukraine, 2002; pp. 103–105. [Google Scholar]
- Molnar, A.A. Temperature Controller for an Immersion-Type Cryostat. Uzhhorod Univ. Sci. Her. Ser. Phys. 2016, 40, 148–156. [Google Scholar] [CrossRef]
- Bán, H.; Gál, D.; Gerasimov, V.; Haysak, A.; Molnar, A. Automated Measuring System for Studying the Temperature Dependence of Dielectric Spectra of Ferroelectrics. In Proceedings of the 11th IEEE International Conference on Intelligent Data Acquisition and Advanced Computing Systems: Technology and Applications (IDAACS), Cracow, Poland, 2021; pp. 156–159. [Google Scholar] [CrossRef]
- Novoselov, K.S.; Geim, A.K.; Morozov, S.V.; Jiang, D.; Zhang, Y.; Dubonos, S.V.; Grigorieva, I.V.; Firsov, A.A. Electric Field Effect in Atomically Thin Carbon Films. Science 2004, 306, 666–669. [Google Scholar] [CrossRef]
- Nečas, D.; Klapetek, P. Gwyddion: an open-source software for SPM data analysis. Cent. Eur. J. Phys. 2012, 10, 181–188. [Google Scholar] [CrossRef]
- Maisonneuve, V.; Reau, J.M.; Dong, M.; Cajipe, V.B.; Payen, C.; Ravez, J. Ionic conductivity in ferroic CuInP₂S₆ and CuCrP₂S₆. Ferroelectrics 1997, 196, 257–260. [Google Scholar] [CrossRef]
- Rao, R.; Conner, B.S.; Jiang, J.; Pachter, R.; Susner, M.A. Raman spectroscopy study of pressure-induced phase transitions in single crystal CuInP₂S₆. J. Chem. Phys. 2023, 159, 224706. [Google Scholar] [CrossRef]
- Yevych, R.; Medulych, M.; Vysochanskii, Y. Nonlinear Dynamics of Ferroelectrics with Three-Well Local Potential. Condens. Matter Phys. 2018, 21, 23001. [Google Scholar] [CrossRef]
- Banys, J.; Dziaugys, A.; Glukhov, K.E.; Morozovska, A.N.; Morozovsky, N.V.; Vysochanskii, Y.M. Van der Waals Ferroelectrics: Properties and Device Applications of Phosphorous Chalcogenides; Wiley-VCH: Weinheim, Germany, 2022. [Google Scholar] [CrossRef]
- Yevych, R.; Liubachko, V.; Hryts, V.; Medulych, M.; Kohutych, A.; Vysochanskii, Y. Description of CuInP₂S₆ ferrielectrics in a mixed Ising model. Condens. Matter Phys. 2024, 27, 14701. [Google Scholar] [CrossRef]
- Ovsyannikov, S.V.; Morozova, N.V.; Korobeinikov, I.V.; Haborets, V.; Yevych, R.; Vysochanskii, Y.; Shchennikov, V.V. Tuning the electronic and vibrational properties of Sn₂P₂Se₆ and Pb₂P₂S₆ crystals and their metallization under high pressure. Dalton Trans. 2017, 46, 4245–4258. [Google Scholar] [CrossRef]
- Morozovska, A.N.; Eliseev, E.A.; Kalinin, S.V.; Vysochanskii, Y.M.; Maksymovych, P. Stress-induced phase transitions in nanoscale CuInP₂S₆. Phys. Rev. B 2021, 104, 054102. [Google Scholar] [CrossRef]
- Molnar, A.; Glukhov, K.; Medulych, M.; Gál, D.; Bán, H.; Vysochanskii, Y. The Effect of Changes in Chemical Composition and Uniaxial Compression on the Phase Transition of CuInP₂S₆ Crystals. Abstract Book of the FM&NT-2020 Online Conference, Virtual Vilnius, Lithuania, 23–26 November 2020; p. 108. [Google Scholar]
- Hohenberg, P.; Kohn, W. Inhomogeneous Electron Gas. Phys. Rev. 1964, 136, B864–B871. [Google Scholar] [CrossRef]
- Kohn, W.; Sham, L.J. Self-Consistent Equations Including Exchange and Correlation Effects. Phys. Rev. 1965, 140, A1133–A1138. [Google Scholar] [CrossRef]
- Clark, S.J.; Segall, M.D.; Pickard, C.J.; Hasnip, P.J.; Probert, M.I.J.; Refson, K.; Payne, M.C. First principles methods using CASTEP. Z. Krist. 2005, 220, 567–570. [Google Scholar] [CrossRef]
- Perdew, J.P.; Burke, K.; Ernzerhof, M. Generalized Gradient Approximation Made Simple. Phys. Rev. Lett. 1996, 77, 3865–3868. [Google Scholar] [CrossRef]
- Grimme, S. Semiempirical GGA-Type Density Functional Constructed with a Long-Range Dispersion Correction. J. Comput. Chem. 2006, 27, 1787–1799. [Google Scholar] [CrossRef]
- Vanderbilt, D. Soft self-consistent pseudopotentials in a generalized eigenvalue formalism. Phys. Rev. B 1990, 41, 7892–7895. [Google Scholar] [CrossRef]
- Monkhorst, H.J.; Pack, J.D. Special points for Brillouin-zone integrations. Phys. Rev. B 1976, 13, 5188–5192. [Google Scholar] [CrossRef]
- Montanari, B.; Harrison, N.M. Lattice dynamics of TiO₂ rutile: influence of gradient corrections in density functional calculations. Chem. Phys. Lett. 2002, 364, 528–534. [Google Scholar] [CrossRef]
- Belianinov, A.; He, Q.; Dziaugys, A.; Maksymovych, P.; Eliseev, E.; Borisevich, A.; Morozovska, A.; Banys, J.; Vysochanskii, Y.; Kalinin, S.V. CuInP₂S₆ Room Temperature Layered Ferroelectric. Nano Lett. 2015, 15, 3808–3814. [Google Scholar] [CrossRef]
- Jiang, C.; Zhang, Y.; Wang, L.; Zhang, H.; Chen, X.; Li, Y.; Wang, Z.; Li, J.; Wang, K.; Liu, H.; et al. Dual-role ion dynamics in ferroionic CuInP₂S₆: revealing the transition from ferroelectric to ionic switching mechanisms. Nat. Commun. 2024, 15, 10905. [Google Scholar] [CrossRef]
Figure 1.
(a) Layered crystal structure of CuInP₂S₆ viewed along the a axis. (b) Local sulfur coordination showing the Cu1, Cu2, and Cu3 positions [11].
Figure 1.
(a) Layered crystal structure of CuInP₂S₆ viewed along the a axis. (b) Local sulfur coordination showing the Cu1, Cu2, and Cu3 positions [11].
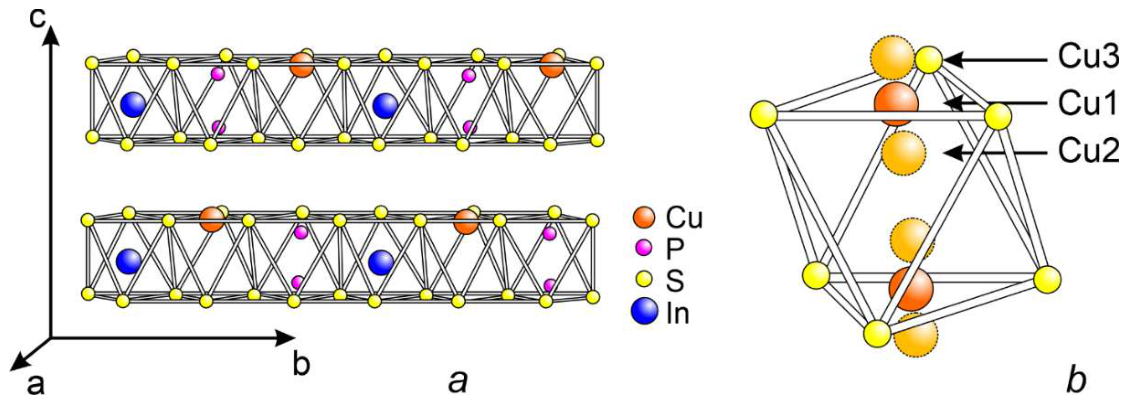
Figure 3.
Temperature dependences of (a) the real ε′ and (b) the imaginary ε″ components of the complex dielectric permittivity at 10 kHz for CuInP₂S₆ crystals: 1 – Bridgman–Stockbarger growth; 2 – Cu-enriched CuInP₂S₆ + Cu₂S; 3 – gas-transport growth; 4 – In-enriched CuInP₂S₆ + In₂S₃.
Figure 3.
Temperature dependences of (a) the real ε′ and (b) the imaginary ε″ components of the complex dielectric permittivity at 10 kHz for CuInP₂S₆ crystals: 1 – Bridgman–Stockbarger growth; 2 – Cu-enriched CuInP₂S₆ + Cu₂S; 3 – gas-transport growth; 4 – In-enriched CuInP₂S₆ + In₂S₃.
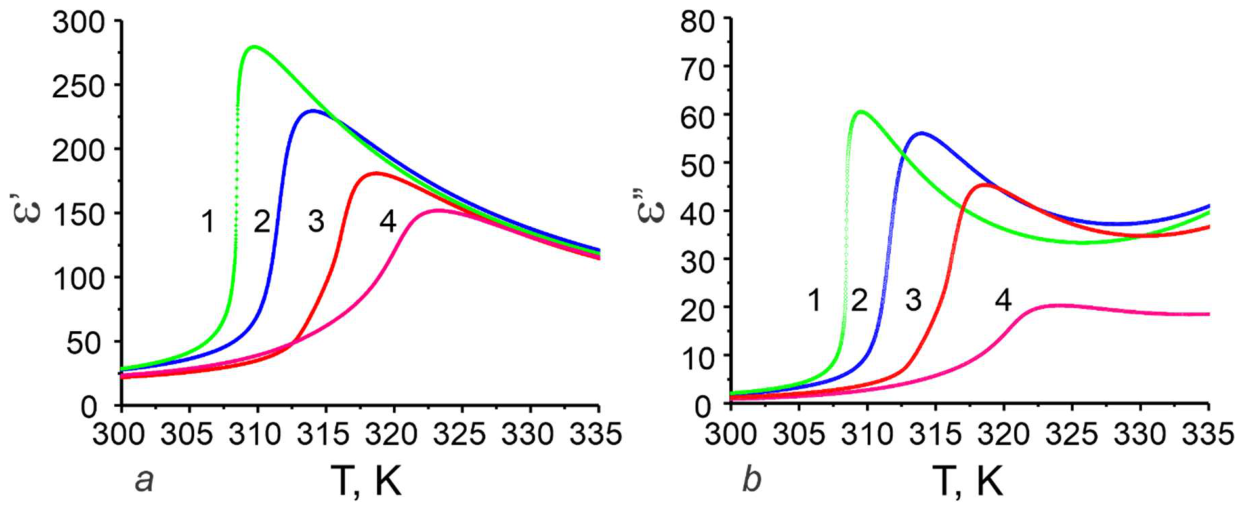
Figure 4.
Temperature dependence of the inverse real dielectric permittivity, 1/ε′, in the phase-transition region of CuInP₂S₆ crystals: 1 – Bridgman–Stockbarger growth; 2 – Cu-enriched CuInP₂S₆ + Cu₂S; 3 – gas-transport growth; 4 – In-enriched CuInP₂S₆ + In₂S₃.
Figure 4.
Temperature dependence of the inverse real dielectric permittivity, 1/ε′, in the phase-transition region of CuInP₂S₆ crystals: 1 – Bridgman–Stockbarger growth; 2 – Cu-enriched CuInP₂S₆ + Cu₂S; 3 – gas-transport growth; 4 – In-enriched CuInP₂S₆ + In₂S₃.
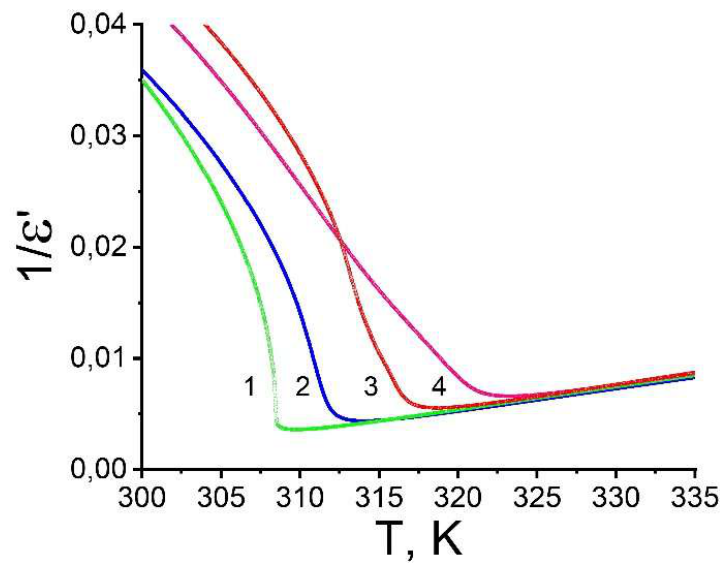
Figure 5.
Temperature dependences of (a) ε″ and (b) ε′ under uniaxial compression: 1 – 0 MPa; 2 – 5 MPa; 3 – 25 MPa.
Figure 5.
Temperature dependences of (a) ε″ and (b) ε′ under uniaxial compression: 1 – 0 MPa; 2 – 5 MPa; 3 – 25 MPa.
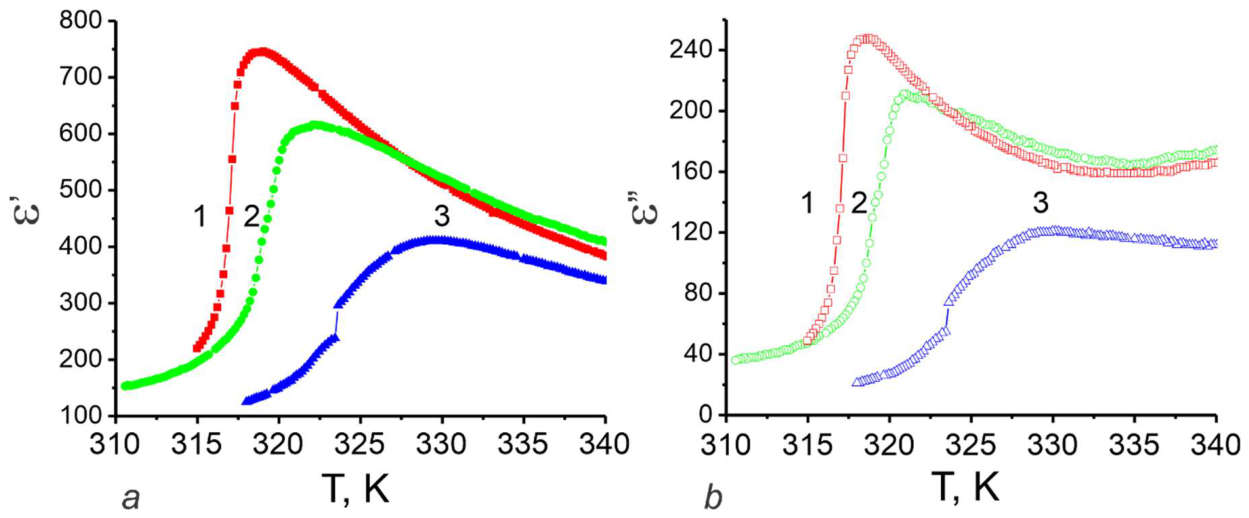
Figure 6.
Pressure dependence of the ferrielectric transition temperature TC. Red symbols and the inset show the present uniaxial-pressure data; blue symbols show literature data from Refs. [18,19].
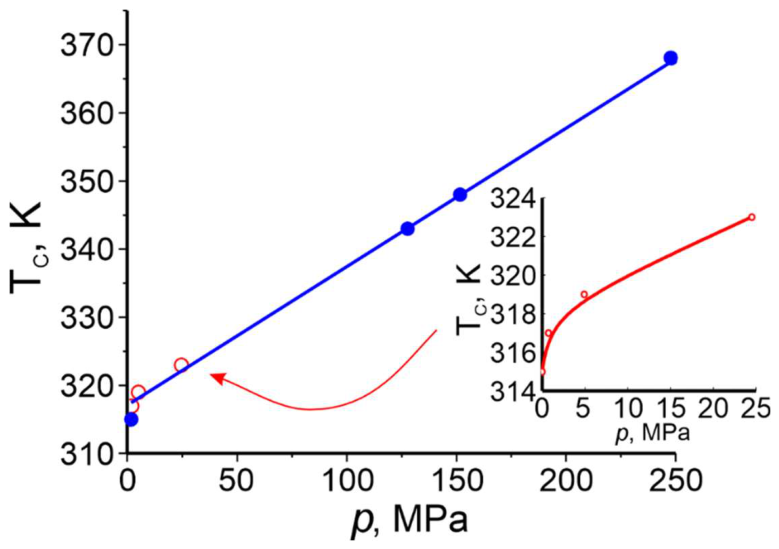
Figure 7.
Pressure–stoichiometry–transition-temperature correspondence for CuInP2S6. Blue circles represent the present composition-dependent data; red squares show literature composition data used for comparison [14]. The right-hand axis gives the equivalent mechanical-pressure scale obtained from the low-pressure TC(p) dependence. The literature dataset was normalized to the Cu₀.₉₉In₁.₀₅P₂.₀₄S₆ reference composition by applying the 16 K temperature offset used in the original comparison.
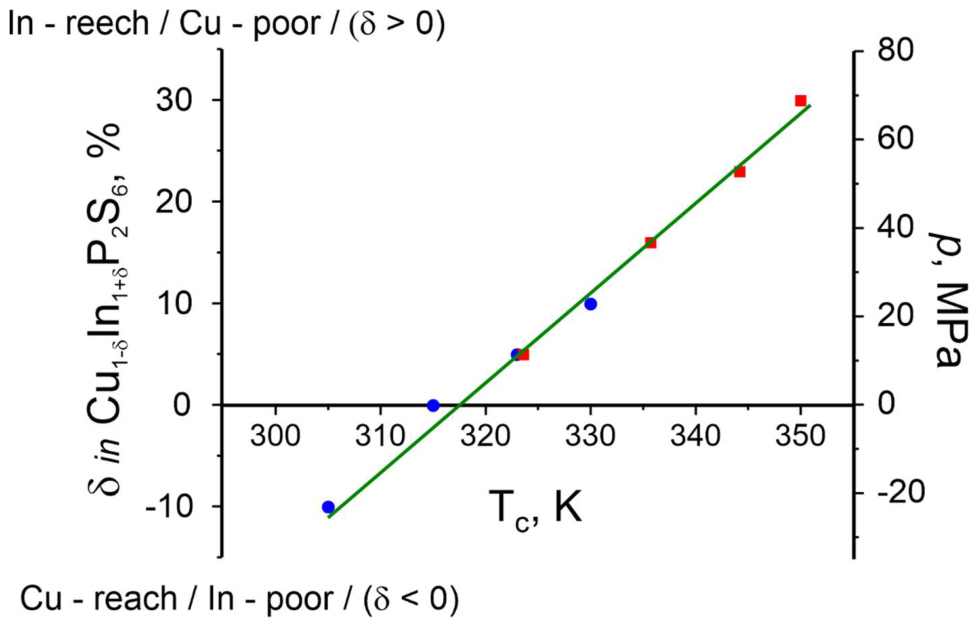
Figure 9.
Calculated Γ-point vibrational-frequency distributions for single-layer (1L, top) and bulk (bottom) CuInP₂S₆. The histogram bin width is Δ = 5 cm⁻¹. In the plotted legends, “w1L” and “W” denote the 1L and bulk calculations, respectively.
Figure 9.
Calculated Γ-point vibrational-frequency distributions for single-layer (1L, top) and bulk (bottom) CuInP₂S₆. The histogram bin width is Δ = 5 cm⁻¹. In the plotted legends, “w1L” and “W” denote the 1L and bulk calculations, respectively.
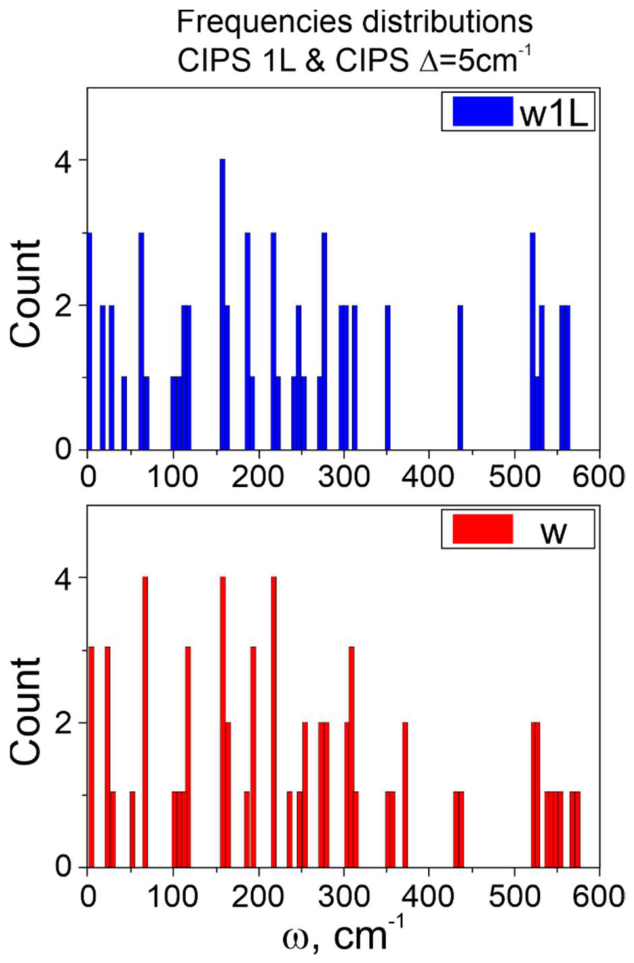
Figure 10.
Calculated Raman spectra of bulk CuInP₂S₆ in the ferrielectric (f-CIPS) and paraelectric (p-CIPS) structures. The two spectra are shown using separate intensity axes for clarity; the horizontal axis represents Raman shift in cm⁻¹.
Figure 10.
Calculated Raman spectra of bulk CuInP₂S₆ in the ferrielectric (f-CIPS) and paraelectric (p-CIPS) structures. The two spectra are shown using separate intensity axes for clarity; the horizontal axis represents Raman shift in cm⁻¹.
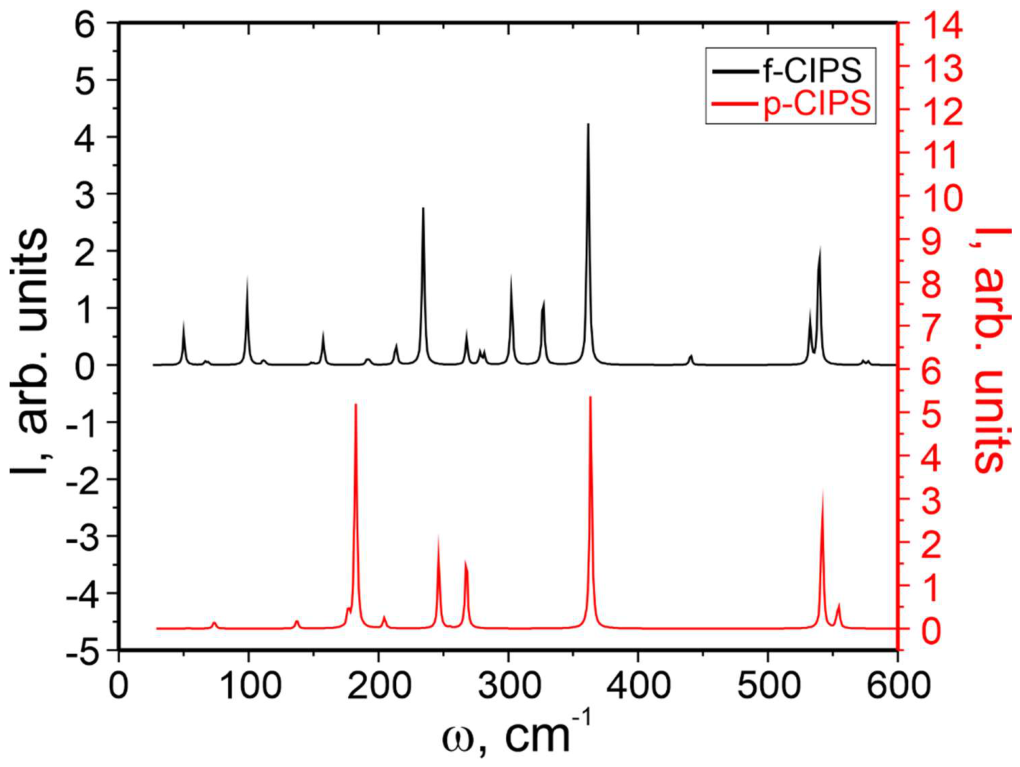
Figure 11.
PFM amplitude (top row) and phase (middle row) images, together with local phase and amplitude switching loops (bottom rows), for CuInP₂S₆ single crystals: (a, e, i, m) Bridgman–Stockbarger growth; (b, f, j, n) Cu-enriched CuInP₂S₆ + Cu₂S; (c, g, k, o) gas-transport growth; and (d, h, l, p) In-enriched CuInP₂S₆ + In₂S₃. The phase images show pronounced differences in domain morphology, from large irregular domains in the melt-grown crystal to a comparatively uniform fine-domain pattern in the gas-transport sample and a strongly biased domain population in the In-enriched crystal. Scale bars: 5 µm.
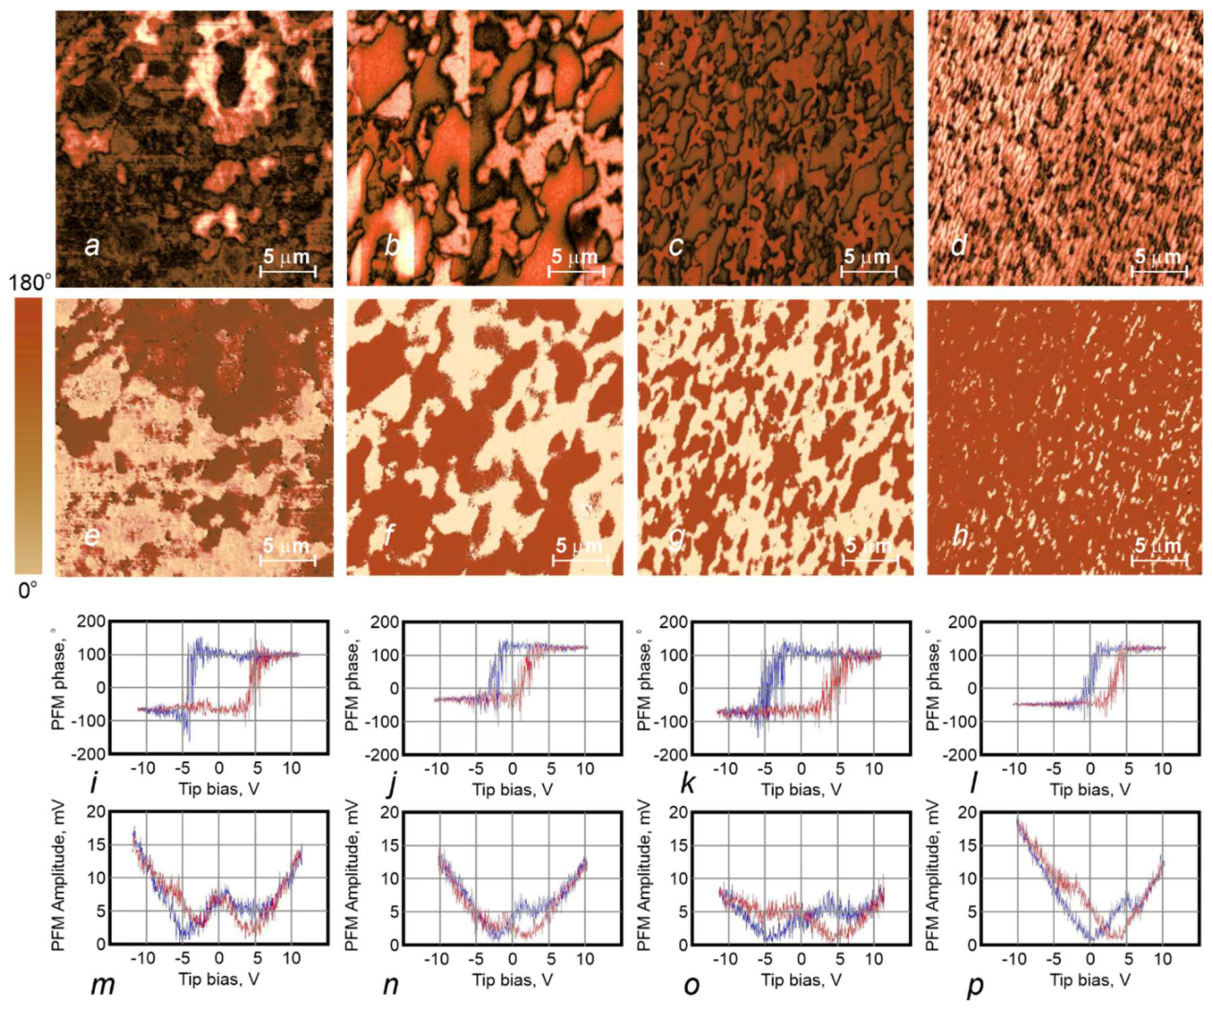
Figure 12.
Three-dimensional AFM topography of a Bridgman–Stockbarger-grown CuInP₂S₆ crystal showing a discontinuity of the upper surface layer and differently oriented elongated features in the underlying region. The weak interlayer coupling allows growth-related structural inhomogeneities to vary between adjacent layers, producing a spatially heterogeneous pinning landscape.
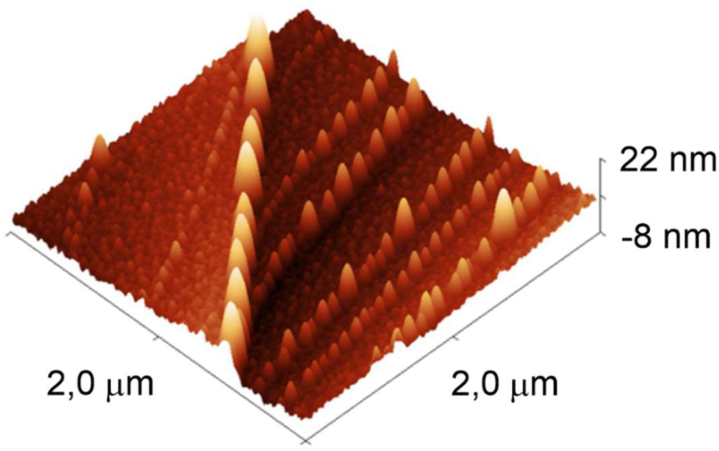

Table 1.
EDS-derived compositions (comparative indicators of relative Cu/In enrichment) and ferrielectric transition temperatures TC of the investigated CuInP2S6 crystals.
Table 1.
EDS-derived compositions (comparative indicators of relative Cu/In enrichment) and ferrielectric transition temperatures TC of the investigated CuInP2S6 crystals.
| Sample | EDS composition | TC (K) |
|---|---|---|
| CuInP2S6 (gas-transport) | Cu1.02In1.04P2.03S6 | 317 |
| CuInP2S6 (Bridgman–Stockbarger) | Cu1.10In0.93P2.04S6 | 307 |
| CuInP2S6 + Cu2S | Cu1.05In0.97P2S6.01 | 312 |
| CuInP2S6 + In2S3 | Cu0.75In1.15P2S6.02 | 322 |
Table 2.
Average Mulliken charges calculated for bulk and single-layer (1L) CIPS.
| Species | Bulk CIPS | 1L CIPS |
|---|---|---|
| Cu | 0.288 | 0.279 |
| In | 0.886 | 0.847 |
| P | 0.751 | 0.750 |
| S | −0.446 | −0.438 |
Table 3.
Summary of stoichiometry- and growth-induced changes in the ferrielectric domain structure and local switching response of CuInP₂S₆.
Table 3.
Summary of stoichiometry- and growth-induced changes in the ferrielectric domain structure and local switching response of CuInP₂S₆.
| Sample | PFM domain morphology | Local switching response | Dominant physical interpretation |
|---|---|---|---|
| Near-stoichiometric, gas-transport | Relatively uniform fine-domain network with well-defined boundaries | Nearly symmetric loops; small imprint | Low density of extended growth defects; closest practical reference state |
| Cu-enriched | Heterogeneous, fragmented domains with irregular and locally discontinuous boundaries | Broader and more asymmetric loops | Softened Cu-ion configurational landscape; negative-pressure-like response |
| In-enriched / Cu-deficient | Strongly asymmetric domain population; one polarization orientation dominates | Strong bias / imprint | CIPS/IPS phase segregation, compressive chemical pressure, and pinning at chemical interfaces |
| Bridgman–Stockbarger | Large irregular domains and strongly nonuniform PFM amplitude | Locally relatively symmetric switching can coexist with strong macroscopic pinning | Growth-induced extended defects and three-dimensional structural inhomogeneity; concurrent Cu-rich stoichiometric contribution |
Disclaimer/Publisher’s Note: The statements, opinions and data contained in all publications are solely those of the individual author(s) and contributor(s) and not of MDPI and/or the editor(s). MDPI and/or the editor(s) disclaim responsibility for any injury to people or property resulting from any ideas, methods, instructions or products referred to in the content. |
© 2026 by the authors. Licensee MDPI, Basel, Switzerland. This article is an open access article distributed under the terms and conditions of the Creative Commons Attribution (CC BY) license (http://creativecommons.org/licenses/by/4.0/).
Copyright: This open access article is published under a Creative Commons CC BY 4.0 license, which permit the free download, distribution, and reuse, provided that the author and preprint are cited in any reuse.