

Submitted:
29 September 2026
Posted:
01 October 2026
You are already at the latest version
Abstract
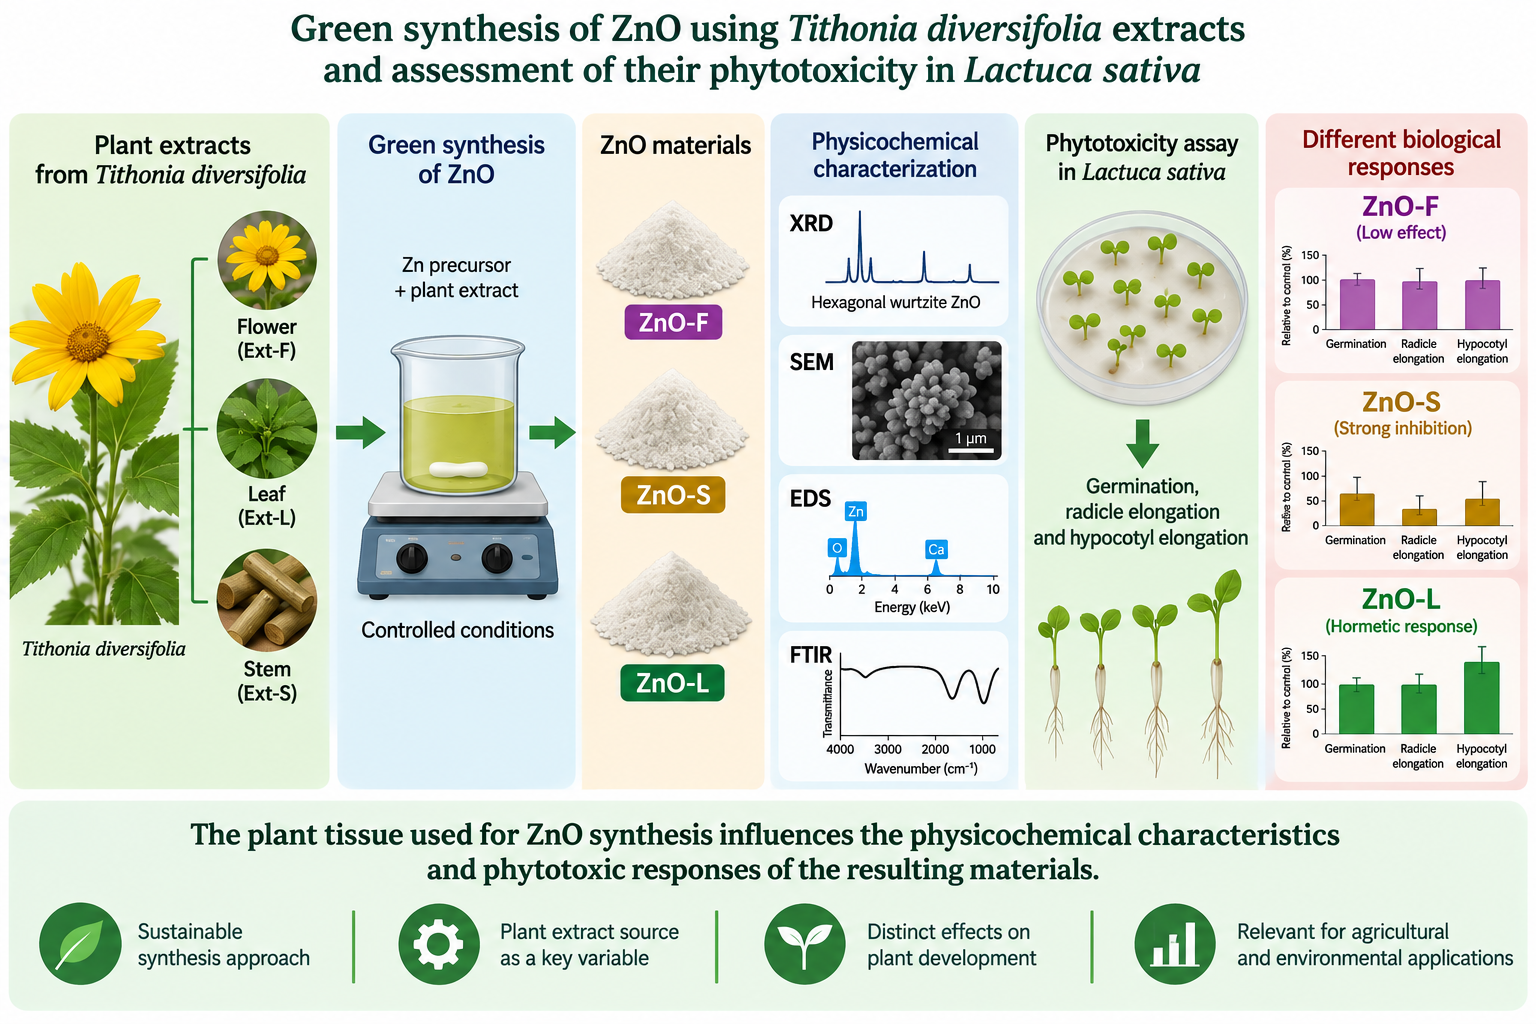
The increasing use of zinc oxide nanoparticles (ZnO-NPs) in agricultural and technological applications raises concerns regarding their potential effects on plant development. In this study, ZnO materials were synthesized using flower, stem, and leaf extracts of Tithonia diversifolia and evaluated for phytotoxicity in Lactuca sativa. X-ray diffraction confirmed the hexagonal wurtzite structure, with crystallite sizes ranging from 25.6 to 34.8 nm. SEM revealed fine granular features assembled into larger agglomerates, while EDS showed differences in elemental composition and Zn/O atomic ratios, with a minor Ca signal detected only in ZnO-L. FTIR revealed Zn–O-related vibrations and differences in the vibrational characteristics of the thermally treated materials. Phytotoxicity assays showed distinct responses among the three materials. ZnO-F produced the lowest overall effect on seedling development, whereas ZnO-S caused the greatest inhibition of radicle and hypocotyl elongation. ZnO-L exhibited a biphasic response, with hypocotyl elongation above the control at 20–60 mg L⁻¹ and inhibition at higher concentrations, consistent with hormesis. Overall, the results indicate that the plant extract source influences the physicochemical characteristics and phytotoxic behavior of the resulting ZnO materials, potentially through the combined influence of multiple material properties.
Keywords:
ZnO nanoparticles
; green synthesis
; Tithonia diversifolia
; phytotoxicity
; Lactuca sativa
; plant extracts
1. Introduction
Zinc oxide nanoparticles (ZnO-NPs) have garnered significant interest in agriculture due to their potential role as nanofertilizers that supply zinc, an essential micronutrient involved in various physiological processes in plants. At relatively low exposure levels, ZnO-NPs may promote plant growth; however, excessive exposure has been shown to negatively impact germination, root development, nutrient uptake, and overall plant productivity.
The increasing incorporation of ZnO-NPs into agricultural and other technological applications has also raised concerns regarding their release into terrestrial ecosystems. Potential pathways through which these materials can reach soils include agricultural formulations and biosolids, where they may undergo processes such as dissolution, aggregation, transformation, uptake, and bioaccumulation [1,2]. Since the biological effects of ZnO-NPs are dependent on both exposure concentration and physicochemical characteristics, an evaluation of plant responses is considered necessary when assessing their potential environmental implications [1,2,3].
ZnO is a wide-band-gap semiconductor that commonly crystallizes in the hexagonal wurtzite structure. At the nanoscale, its physicochemical properties have enabled applications in catalysis, photocatalysis, antimicrobial materials, and other technological fields [4,5,6,7]. Nevertheless, conventional synthesis routes may involve high temperatures, elevated pressures, costly equipment, or chemical reagents that produce undesirable residues. Consequently, plant-mediated synthesis has emerged as an alternative approach for producing ZnO through comparatively simple and potentially more sustainable procedures [4,5,6,7].
Complex mixtures of organic compounds are contained within plant extracts, which are capable of interacting with Zn-containing precursor species during the process of nanoparticle formation. The chemical composition of an extract varies with plant species and tissue type, thus influencing nucleation, crystal growth, aggregation, and other physicochemical characteristics of the resulting ZnO. Although the use of plant extracts in ZnO synthesis has become increasingly common, the relationship between the extract's origin and the subsequent biological response of the synthesized material remains poorly understood.
Non-food plant resources are particularly attractive for green synthesis because they avoid competition with edible biomass. In this context, Tithonia diversifolia, commonly known as Mexican sunflower, is a suitable candidate. This perennial species of the Asteraceae family is native to Mexico and Central America and is characterized by high adaptability and colonization capacity. Different parts of T. diversifolia contain a range of secondary metabolites, including phenolic compounds and other phytochemicals, whose abundance can vary with plant tissue and environmental conditions [8,9]. Moreover, T. diversifolia leaf extract has previously been used in plant-mediated ZnO synthesis [10]. These characteristics provide a basis for investigating whether extracts from different plant organs influence the properties of ZnO formed under otherwise comparable synthesis conditions.
Therefore, this study aimed to synthesize and characterize ZnO using flower, stem and leaf extracts of T. diversifolia and to evaluate the phytotoxic response of the resulting materials in Lactuca sativa. Particular attention was given to determining whether the plant extract source was associated with differences in the physicochemical characteristics of the synthesized ZnO and with distinct responses during seed germination and early seedling development.
2. Materials and Methods
2.1. Preparation of T. diversifolia Extracts
Specimens of T. diversifolia were collected from the municipalities of Atlacomulco and San Felipe del Progreso, State of Mexico, Mexico. Flowers, leaves, and stems were separated and sun-dried. Subsequently, each plant organ was crushed, pulverized, and sieved to obtain a fine powder.
To prepare the aqueous extracts, 2 g of powder from each plant part was suspended in 100 mL of deionized water. The suspensions were heated at 60 °C for 60 min under continuous magnetic stirring at 350 rpm. The resulting mixtures were vacuum-filtered through Whatman filter paper (1.6 µm) to remove residual solids and obtain the corresponding aqueous extracts. The flower, stem, and leaf extracts were designated Ext-F, Ext-S, and Ext-L, respectively. Their measured pH values were 5.8, 5.6 and 7.8, respectively. The extract preparation procedure followed the plant-mediated synthesis approach previously reported [11].
2.2. Green Synthesis of ZnO
For ZnO synthesis, 20 mL of each T. diversifolia extract (Ext-F, Ext-S, and Ext-L) was mixed with 2 g of zinc nitrate hexahydrate [Zn(NO₃)₂·6H₂O] as the Zn precursor. Each mixture was continuously stirred at 350 rpm and maintained at 60–70 °C for 2 h. The resulting materials were subsequently dried and thermally treated in air at 500 °C for 2 h, following the synthesis procedure reported by Yousefinia et al. [12], which served as the methodological reference.
The ZnO materials obtained using Ext-F, Ext-S, and Ext-L were designated ZnO-F, ZnO-S, and ZnO-L, respectively.
2.3. Physicochemical Characterization
The crystalline structure of the synthesized ZnO materials was analyzed by X-ray diffraction (XRD) using a Rigaku Ultima IV diffractometer operated at 40 kV and 44 mA in Bragg–Brentano geometry with Cu Kα radiation (λ = 0.15419 nm). Diffraction patterns were recorded over a 2θ range of 20–80°, using a step size of 0.02° and a scan rate of 2° min⁻¹.
The crystallite size (D) and microstrain (ε) were estimated from the XRD data using the Halder–Wagner method [13], according to equations (1)-(3):
where:
and
β* = βcosθ/λ
d* = 2sinθ/λ
Here, β is the integral breadth of the diffraction peak, θ is the Bragg angle, and λ is the X-ray wavelength. The crystallite size (D) was calculated as the reciprocal of the slope, while the microstrain (ε) was obtained as the square root of the intercept of the linear fit of (β*/d*)² versus β*/d*².
Surface morphology was examined by scanning electron microscopy (SEM) using a Quanta FEG-250 microscope operated at 20 kV. Secondary-electron and backscattered-electron images were obtained at different magnifications. Elemental composition was evaluated using energy-dispersive X-ray spectroscopy (EDS) coupled to the SEM.
Fourier-transform infrared spectra were recorded using a Thermo Scientific Nicolet iS50 FTIR spectrometer equipped with a diamond attenuated-total-reflectance accessory. Spectra were acquired from 4000 to 500 cm⁻¹ at a resolution of 4 cm⁻¹ using 16 accumulated scans in transmittance mode.
2.4. Phytotoxicity Bioassay in L. sativa
Phytotoxicity was evaluated using L. sativa seeds exposed to ZnO suspensions at concentrations of 20, 40, 60, 80, and 100 mg L⁻¹. Before application, the ZnO suspensions were dispersed in an ultrasonic bath.
A volume of 4 mL of each suspension was applied to filter paper in Petri dishes containing 20 L. sativa seeds. Distilled water served as the negative control. The dishes were incubated in the dark for 120 h at 22 °C in a Memmert 40050-IP-20 incubator. All treatments were conducted in triplicate.
The number of germinated seeds was recorded, and measurements of radicle and hypocotyl lengths were taken at the end of the exposure period. These data were subsequently used to calculate the germination seeds index (SG), radicle elongation index (RE), and hypocotyl elongation index (HE) relative to the corresponding control according to equations (4)-(6):
where Gt and Gc represent germination in the treatment and control, respectively; Rt and Rc represent mean radicle length (mm) in the treatment and control, respectively; and Ht and Hc represent mean hypocotyl length (mm) in the treatment and control, respectively.
Positive index values indicate stimulation relative to the control, whereas negative values indicate inhibition. Based on the calculated indices, the phytotoxicity responses were classified according to the scale established by Bagur et al. [14]: hormesis (> 0), low toxicity/inhibition (0 to -0.25), moderate toxicity (-0.25 to -0.50), high toxicity (-0.50 to -0.75), and very high toxicity (-0.75 to -1.00).
Germination and elongation data were analyzed using one-way analysis of variance (ANOVA). Dunnett's multiple-comparison test [15] was subsequently applied to compare each ZnO concentration with the corresponding control. Statistical analyses were performed using Minitab 18 (Minitab LLC, State College, PA, USA). Differences were considered statistically significant at p < 0.05.
3. Results
3.1. XRD Analysis
The XRD patterns of ZnO-F, ZnO-S, and ZnO-L are shown in Figure 1. All samples exhibited similar diffraction profiles, with reflections located at approximately 31.8°, 34.4°, 36.3°, 47.5°, 56.6°, 62.9°, 66.4°, 68.0°, and 69.1° (2θ), indexed to the (100), (002), (101), (102), (110), (103), (200), (112), and (201) planes, respectively. These reflections were consistent with the reference pattern for hexagonal wurtzite ZnO (PDF 01-070-8072).
Although peak positions were comparable among the three materials, relative reflection intensities varied. The (101) reflection exhibited the highest intensity in all three patterns. No additional diffraction peaks attributable to secondary crystalline phases were detected within the analyzed 2θ range.
The estimated crystallite sizes followed the order ZnO-L < ZnO-F < ZnO-S. The calculated values were 25.6 ± 1.4 nm for ZnO-L, 26.1 ± 2.2 nm for ZnO-F, and 34.8 ± 1.5 nm for ZnO-S (Figure 2). While ZnO-L and ZnO-F exhibited comparable crystallite sizes, ZnO-S showed a noticeably larger value, approximately 9 nm higher than that of the other two samples. The estimated microstrain values were 0.16 ± 0.05% for ZnO-F, 0.10 ± 0.02% for ZnO-S, and 0.23 ± 0.02% for ZnO-L.
3.2. SEM and EDS Analysis
SEM micrographs of ZnO-F, ZnO-S, and ZnO-L obtained at ×3,000 and ×5,000 magnifications are shown in Figure 3. All three materials exhibited highly agglomerated morphologies composed of fine granular structures. ZnO-F showed irregularly shaped agglomerates with heterogeneous sizes and spatial distribution. ZnO-S exhibited densely packed, irregular agglomerates with rough granular surfaces, whereas ZnO-L displayed compact agglomerates composed of fine particles with an irregular surface morphology. At ×5,000 magnification, the fine granular features forming the larger agglomerates were more clearly observed in all three materials.
The EDS spectra are presented in Figure 4, while the corresponding elemental compositions and Zn/O atomic ratios are summarized in Table 1. Zn and O were the predominant elements detected in all materials, with Zn/O atomic ratios varying among the three samples. A minor Ca signal was additionally observed in ZnO-L, whereas no additional elemental signals were observed in the spectra of ZnO-F and ZnO-S.
3.3. FTIR Analysis
Figure 5 shows the FTIR spectra of ZnO-F, ZnO-S, and ZnO-L. The three materials exhibited a broad absorption band in the 3369–3419 cm⁻¹ region, together with bands at approximately 1614, 1531, and 1417 cm⁻¹. Additional signals were observed in the 1043–1078 cm⁻¹ and 912–920 cm⁻¹ regions. Weak features were also detected between approximately 1977 and 2507 cm⁻¹, although their positions and relative intensities varied among the samples. In the low-wavenumber region, all three spectra showed a pronounced absorption response below approximately 600 cm⁻¹. Overall, ZnO-F, ZnO-S, and ZnO-L exhibited similar FTIR profiles, with the main differences occurring in the positions and relative intensities of the weaker absorption bands.
3.4. Phytotoxicity
The phytotoxic effects of ZnO-F, ZnO-S, and ZnO-L on L. sativa were evaluated based on seed germination and radicle and hypocotyl elongation at ZnO concentrations ranging from 20 to 100 mg L⁻¹. Table 2 summarizes the corresponding germination and elongation indices.
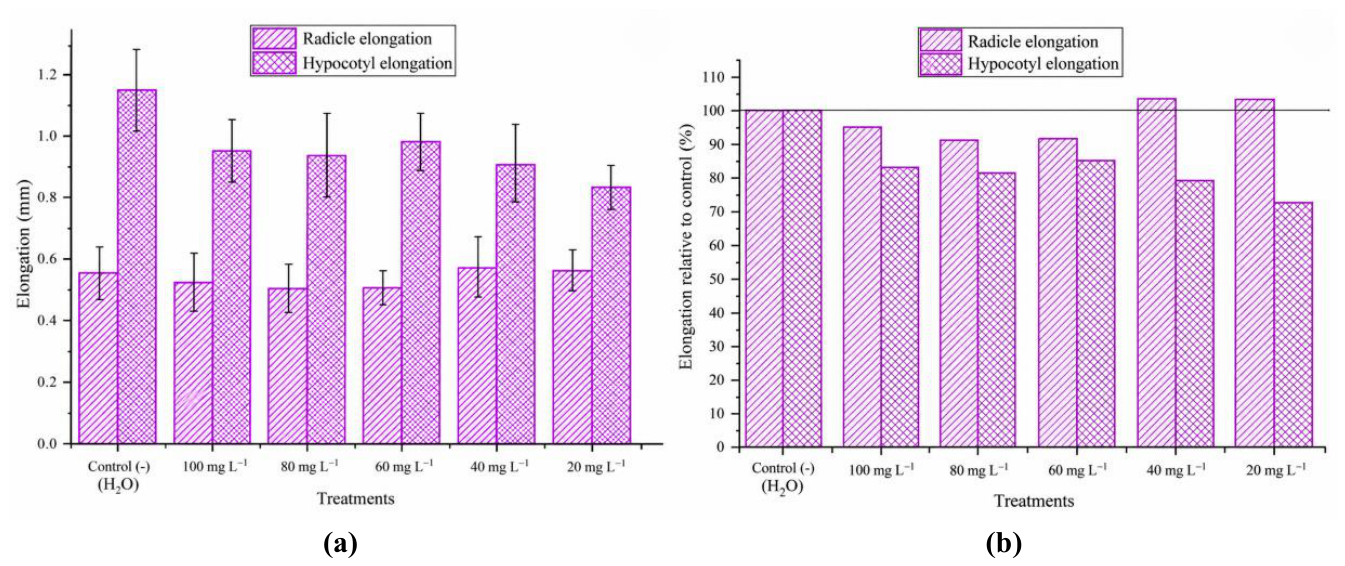
ZnO-F exhibited relatively small changes in the evaluated phytotoxicity parameters. The germination index ranged from −0.297 to −0.027 across the tested concentrations. Radicle elongation remained close to the control, reaching approximately 91–104% of the control values (Figure 6), with elongation indices ranging from −0.088 to 0.040. Hypocotyl elongation showed a greater reduction, corresponding to approximately 72–85% of the control, with indices ranging from −0.278 to −0.149.
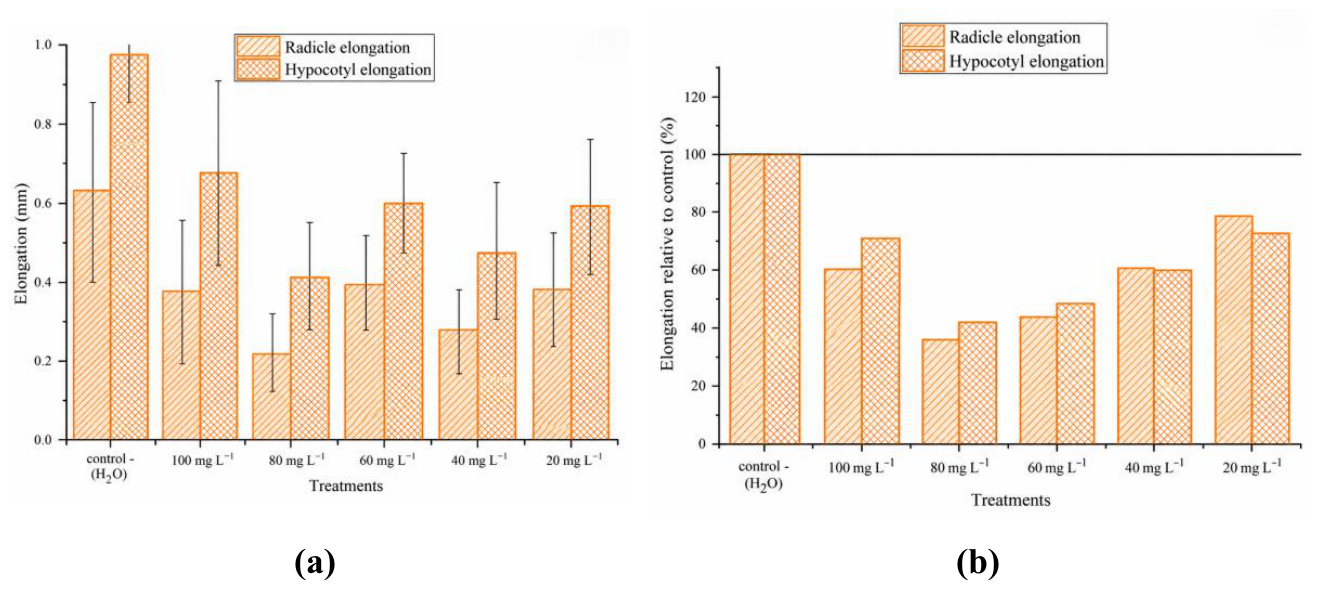
A more pronounced response was observed in seedlings exposed to ZnO-S. The germination index varied from −0.350 to −0.125, while radicle elongation corresponded to approximately 34–78% of the control (Figure 7). The greatest reduction in radicle elongation occurred at 80 mg L⁻¹, and the corresponding elongation indices ranged from −0.587 to −0.291. Hypocotyl elongation was also reduced, reaching approximately 41–71% of the control, with indices ranging from −0.653 to −0.212.
ZnO-L produced a distinct response, particularly in hypocotyl elongation. The germination index ranged from −0.275 to −0.075, whereas radicle elongation remained at approximately 76–97% of the control (Figure 8). Hypocotyl elongation was below the control at 80 and 100 mg L⁻¹ but exceeded the control at 20–60 mg L⁻¹, reaching approximately 109–136%. Accordingly, positive hypocotyl elongation indices of 0.140, 0.299, and 0.359 were obtained at 60, 40, and 20 mg L⁻¹, respectively.
Overall, the three ZnO materials produced distinct responses in L. sativa. ZnO-F showed the smallest changes in radicle elongation, whereas ZnO-S produced the greatest reductions in both radicle and hypocotyl elongation. ZnO-L reduced elongation at the highest concentrations but exhibited hypocotyl elongation above the control at 20–60 mg L⁻¹. Dunnett's test showed no significant differences between the control and ZnO-F treatments. In contrast, significant differences in radicle and/or hypocotyl elongation were observed for ZnO-S and ZnO-L treatments.
4. Discussion
The three plant extracts yielded ZnO with the same hexagonal wurtzite crystalline phase; however, the resulting materials differed in crystallite size, morphology-related features, elemental composition, FTIR response, and phytotoxic behavior. These findings indicate that the plant part used to prepare the extract can influence the characteristics of the resulting ZnO materials.
The crystallite sizes of 26.1 ± 2.2, 25.6 ± 1.4, and 34.8 ± 1.5 nm obtained for ZnO-F, ZnO-L, and ZnO-S, respectively, suggest that the chemical environment provided by the different plant extracts may influence nucleation and crystal growth. Differences in plant-extract composition can affect interactions with Zn-containing precursor species during plant-mediated synthesis and, consequently, influence the physicochemical characteristics of the resulting ZnO [4,5,6,7]. Nevertheless, because all three materials retained the same wurtzite structure and no additional crystalline phases were detected, these differences are better interpreted as variations in microstructural characteristics rather than the formation of distinct crystalline products.
SEM observations support this interpretation. All three materials consisted of fine granular features associated into larger irregular agglomerates, a characteristic frequently observed in ZnO nanomaterials synthesized using plant-derived media [4,5,6,7]. The larger structures observed by SEM should not be directly equated with the crystallite sizes determined by XRD. Whereas XRD-derived sizes correspond to coherent crystalline domains, SEM reveals larger particles, aggregates, or agglomerates that may contain multiple crystallites.
EDS revealed additional differences among the materials. Zn and O were predominant in all samples, although the Zn/O atomic ratio varied considerably. A minor Ca signal was detected exclusively in ZnO-L, possibly originating from mineral constituents of the leaf extract or minor species remaining after synthesis. However, because EDS provides localized semiquantitative elemental information, the observed Zn/O atomic ratios should not be considered direct evidence of ZnO stoichiometry or defect-related species. Likewise, the detection of Ca does not establish its chemical state or incorporation into the ZnO lattice and therefore cannot be considered evidence of Ca doping.
The FTIR spectra provided complementary information on the vibrational characteristics of the synthesized materials. The pronounced absorption below approximately 600 cm⁻¹ is consistent with Zn–O lattice vibrations, supporting ZnO formation [4,5,6,7]. The broad band at 3369–3419 cm⁻¹ can be associated with O–H stretching vibrations arising from surface hydroxyl groups and/or adsorbed water, whereas the additional bands observed at approximately 1614, 1531, and 1417 cm⁻¹ and in the 1043–1078 and 912–920 cm⁻¹ regions indicate additional surface-associated vibrational species.
These bands should be interpreted considering that the materials were thermally treated in air at 500 °C for 2 h before FTIR characterization. Therefore, they do not provide direct evidence of intact phytochemicals from the original plant extracts acting as capping agents in the final ZnO materials. Likewise, the weak features observed between approximately 1977 and 2507 cm⁻¹ cannot be unequivocally assigned to specific molecular species based solely on FTIR. Differences in band positions and relative intensities are therefore more appropriately interpreted as differences in the post-treatment surface and vibrational characteristics of the materials.
The phytotoxicity assays demonstrated distinct responses among the three ZnO materials. ZnO-F produced the lowest overall effect on early seedling development, with no significant differences from the control according to Dunnett's test, whereas significant effects on radicle and/or hypocotyl elongation were observed for ZnO-S and ZnO-L. ZnO-S caused the greatest inhibition of seedling elongation, while ZnO-L exhibited a concentration-dependent response characterized by inhibition at higher concentrations and stimulation of hypocotyl elongation at lower concentrations.
Seedling elongation appeared to be a more sensitive endpoint than germination under the evaluated conditions. Similar differences between germination and subsequent seedling-growth responses have been reported for ZnO nanoparticles [1,2,3,16,17]. Studies using L. sativa and other metal-oxide nanoparticles have likewise shown that early seedling growth, particularly radicle development, can be sensitive to nanoparticle exposure [18,19,20]. These observations support the use of radicle and hypocotyl elongation as relevant endpoints for evaluating ZnO phytotoxicity.
Several processes have been associated with ZnO nanoparticle phytotoxicity, including Zn²⁺ release, interactions between nanoparticles and root surfaces, and oxidative stress [1,2,21]. Because these processes were not directly measured in the present study, the inhibition observed particularly for ZnO-S and at higher ZnO-L concentrations cannot be attributed to a specific molecular mechanism.
The response of ZnO-L was particularly noteworthy. Hypocotyl elongation exceeded the control at 20–60 mg L⁻¹ but was inhibited at 80 and 100 mg L⁻¹, indicating a biphasic pattern consistent with hormesis. Low-concentration stimulatory effects associated with ZnO exposure have also been reported in plant-growth studies [16,17]. Because Zn is an essential micronutrient, increased Zn availability may support physiological processes at low exposure levels, whereas excessive exposure can produce adverse effects [1,2]. Therefore, the observed pattern should be interpreted as consistent with hormesis rather than as evidence of a specific hormetic mechanism.
When the physicochemical and biological results are considered together, no single measured physicochemical characteristic appears sufficient to explain the contrasting phytotoxic responses of the ZnO materials. Differences were observed in crystallite size, elemental composition, Zn/O atomic ratio, and FTIR characteristics, while SEM revealed agglomerated structures in all three materials. These differences coincided with distinct biological responses: ZnO-F produced comparatively limited effects, ZnO-S caused the strongest inhibition of seedling elongation, and ZnO-L exhibited a concentration-dependent response that included stimulation at lower concentrations. Thus, the phytotoxic behavior may reflect the combined influence of multiple physicochemical properties rather than any individual characteristic.
5. Conclusions
T. diversifolia flower, leaf, and stem extracts were successfully employed for the green synthesis of ZnO-F, ZnO-L, and ZnO-S, respectively. All three materials exhibited the hexagonal wurtzite ZnO structure but differed in crystallite size, elemental composition, and FTIR characteristics, indicating that the plant part used as the extract source can influence the physicochemical characteristics of the resulting ZnO.
Phytotoxicity assays demonstrated distinct responses of L. sativa to the three materials. ZnO-F produced the lowest overall effect on early seedling development, whereas ZnO-S caused the greatest inhibition of radicle and hypocotyl elongation. ZnO-L exhibited a biphasic response, with hypocotyl elongation above the control at 20–60 mg L⁻¹ and inhibition at higher concentrations, a pattern consistent with hormesis. These contrasting responses, together with the physicochemical differences among the materials, suggest that phytotoxic behavior may reflect the combined influence of multiple material properties rather than a single physicochemical characteristic.
These findings also emphasize the importance of ZnO dosage in potential plant-related applications. Low and carefully controlled concentrations should be considered to minimize phytotoxicity while preserving potential stimulatory responses. However, an appropriate concentration cannot be considered universal, as the biological response may depend on both the physicochemical characteristics of the ZnO material and the sensitivity of the target plant species.
Furthermore, the use of plant-derived reagents should not be assumed to produce environmentally innocuous ZnO materials. Therefore, the plant extract source, ZnO concentration, and target-plant sensitivity should be considered when designing and evaluating green-synthesized ZnO for plant-related applications.
Author Contributions
Conceptualization, P.D.O.C. and V.P.M.; methodology, P.D.O.C., A.A.C. and P.L.P.; software, P.D.O.C., B.A.S. and V.P.M.; validation, P.D.O.C., B.A.S. and V.P.M.; formal analysis, A.A.C., A.L.L., P.L.P. and B.A.S.; investigation, P.D.O.C., P.L.P., A.A.C. and V.P.M.; resources, P.D.O.C. and P.L.P.; writing—original draft preparation, P.D.O.C., B.A.S. and V.P.M.; writing—review and editing, B.A.S.; visualization, P.D.O.C., B.A.S., A.L.L. and V.P.M.; funding acquisition, P.D.O.C. All authors have read and agreed to the published version of the manuscript.
Funding
This research received no external funding.
Institutional Review Board Statement
Not applicable.
Informed Consent Statement
Not applicable.
Data Availability Statement
The original contributions presented in this study are included in the article. Further inquiries can be directed to the corresponding authors.
Acknowledgments
The authors thank the Tecnológico de Estudios Superiores de San Felipe del Progreso, División de Ingeniería en Energías Renovables, and the Instituto de Investigación e Innovación en Energías Renovables (IIIER), Universidad de Ciencias y Artes de Chiapas (UNICACH), for providing the infrastructure, materials, and reagents that supported this research. The authors also thank the Consejo Mexiquense de Ciencia y Tecnología (COMECyT) for the postdoctoral fellowship awarded to Paula Orantes (Recipient ID ESYCA2023-111150). During the preparation of this manuscript, the authors used ChatGPT (OpenAI, GPT-5.6) for language editing and improvement of clarity and readability. The authors reviewed and edited the output and take full responsibility for the content of this publication.
Conflicts of Interest
The authors declare no conflicts of interest.
Abbreviations
The following abbreviations are used in this manuscript:
| ANOVA | Analysis of Variance |
| EDS | Energy-Dispersive X-ray Spectroscopy |
| Ext-F | Flower Extract |
| Ext-L | Leaf Extract |
| Ext-S | Stem Extract |
| FTIR | Fourier-Transform Infrared Spectroscopy |
| GI | Germination Index |
| HEI | Hypocotyl Elongation Index |
| NPs | Nanoparticles |
| REI | Radicle Elongation Index |
| SD | Standard Deviation |
| SEM | Scanning Electron Microscopy |
| XRD | X-ray Diffraction |
| ZnO | Zinc Oxide |
| ZnO-F | ZnO Synthesized Using Flower Extract |
| ZnO-L | ZnO Synthesized Using Leaf Extract |
| ZnO-S | ZnO Synthesized Using Stem Extract |
| ZnO-NPs | Zinc Oxide Nanoparticles |
References
- Shen, M.; Liu, W.; Zeb, A.; Lian, J.; Wu, J.; Lin, M. Bioaccumulation and phytotoxicity of ZnO nanoparticles in soil-grown Brassica chinensis L. and potential risks. J. Environ. Manag. 2022, 306, 114454. [Google Scholar] [CrossRef]
- Lv, Z.; Sun, H.; Du, W.; Li, R.; Mao, H.; Kopittke, P.M. Interaction of different-sized ZnO nanoparticles with maize (Zea mays): Accumulation, biotransformation and phytotoxicity. Sci. Total Environ. 2021, 796, 148927. [Google Scholar] [CrossRef]
- Yashni, G.; Al-Gheethi, A.; Mohamed, R.; Shanmugan, V.A.; Al-Sahari, M.N.A. Phytotoxicity evaluation of ZnO nanoparticles synthesized from Corriandrum sativum leaf extract. Mater. Today Proc. 2021, 47, 1336–1340. [Google Scholar] [CrossRef]
- Tabrizi Hafez Moghaddas, S.M.; Elahi, B.; Javanbakht, V. Biosynthesis of pure zinc oxide nanoparticles using quince seed mucilage for photocatalytic dye degradation. J. Alloys Compd. 2020, 821, 153519. [Google Scholar] [CrossRef]
- Ngom, I.; Ngom, B.D.; Sackey, J.; Khamlich, S. Biosynthesis of zinc oxide nanoparticles using extracts of Moringa oleifera: Structural & optical properties. Mater. Today Proc. 2021, 36, 526–533. [Google Scholar] [CrossRef]
- Abdullah, F.H.; Abu Bakar, N.H.H.; Abu Bakar, M. Low temperature biosynthesis of crystalline zinc oxide nanoparticles from Musa acuminata peel extract for visible-light degradation of methylene blue. Optik 2020, 206, 164279. [Google Scholar] [CrossRef]
- Ekennia, A.; Uduagwu, D.; Olowu, O.; Nwanji, O.; Oje, O.; Daniel, B.; Mgbii, S.; Emma-Uba, C. Biosynthesis of zinc oxide nanoparticles using leaf extracts of Alchornea laxiflora and its tyrosinase inhibition and catalytic studies. Micron 2021, 141, 102964. [Google Scholar] [CrossRef]
- Sampaio, B.L.; Edrada-Ebel, R.; Da Costa, F.B. Effect of the environment on the secondary metabolic profile of Tithonia diversifolia: A model for environmental metabolomics of plants. Sci. Rep. 2016, 6, 29265. [Google Scholar] [CrossRef]
- Ajao, A.A.; Moteetee, A.N. Tithonia diversifolia (Hemsl) A. Gray. (Asteraceae: Heliantheae), an invasive plant of significant ethnopharmacological importance: A review. S. Afr. J. Bot. 2017, 113, 396–403. [Google Scholar] [CrossRef]
- Obayomi, K.S.; Oluwadiya, A.E.; Lau, S.Y.; Dada, A.O.; Akubuo-Casmir, D.; Adelani-Akande, T.A.; Bari, A.S.M.F.; Temidayo, S.O.; Rahman, M.M. Biosynthesis of Tithonia diversifolia leaf mediated zinc oxide nanoparticles loaded with flamboyant pods (Delonix regia) for the treatment of methylene blue wastewater. Arab. J. Chem. 2021, 14, 103363. [Google Scholar] [CrossRef]
- Shekofteh Narm, T.; Hamidinezhad, H.; Sabouri, Z.; Darroudi, M. Biosynthesis of Se-doped ZnO/Ag₂O/Fe₃O₄ nanocomposite using Sclerorhachis leptoclada extract: Characterization and investigation of their photocatalytic effects. Environ. Technol. Innov. 2024, 34, 103617. [Google Scholar] [CrossRef]
- Yousefinia, A.; Khodadadi, M.; Mortazavi-Derazkola, S. An efficient biosynthesis of novel ZnO/CuO nanocomposites using Berberis vulgaris extract (ZnO/CuO@BVENCs) for enhanced photocatalytic degradation of pollution, antibacterial and antifungal activity. Environ. Technol. Innov. 2023, 32, 103340. [Google Scholar] [CrossRef]
- Halder, N.C.; Wagner, C.N.J. Separation of particle size and lattice strain in integral breadth measurements. Acta Crystallogr. 1966, 20, 312–313. [Google Scholar] [CrossRef]
- Bagur, M.G.; Estepa, C.; Martín, F.; Morales, S. Toxicity assessment using Lactuca sativa L. bioassay of the metal(loid)s As, Cu, Mn, Pb and Zn in soluble-in-water saturated soil extracts from an abandoned mining site. J. Soils Sediments 2011, 11, 281–289. [Google Scholar] [CrossRef]
- Dunnett, C.W. A multiple comparison procedure for comparing several treatments with a control. J. Am. Stat. Assoc. 1955, 50, 1096–1121. [Google Scholar] [CrossRef]
- Samuditha, P.S.; Adassooriya, N.M.; Salim, N. Assessing phytotoxicity and tolerance levels of ZnO nanoparticles on Raphanus sativus: Implications for widespread adoptions. Beilstein J. Nanotechnol. 2024, 15, 115–125. [Google Scholar] [CrossRef]
- Umavathi, S.; Mahboob, S.; Govindarajan, M.; Al-Ghanim, K.A.; Ahmed, Z.; Virik, P.; Al-Mulhm, N.; Subash, M.; Gopinath, K.; Kavitha, C. Green synthesis of ZnO nanoparticles for antimicrobial and vegetative growth applications: A novel approach for advancing efficient high quality health care to human wellbeing. Saudi J. Biol. Sci. 2021, 28, 1808–1815. [Google Scholar] [CrossRef]
- Xiong, T.; Zhang, S.; Kang, Z.; Zhang, T.; Li, S. Dose-dependent physiological and transcriptomic responses of lettuce (Lactuca sativa L.) to copper oxide nanoparticles—Insights into the phytotoxicity mechanisms. Int. J. Mol. Sci. 2021, 22, 3688. [Google Scholar] [CrossRef]
- Hong, J.; Rico, C.M.; Zhao, L.; Adeleye, A.S.; Keller, A.A.; Peralta-Videa, J.R.; Gardea-Torresdey, J.L. Toxic effects of copper-based nanoparticles or compounds to lettuce (Lactuca sativa) and alfalfa (Medicago sativa). Environ. Sci. Process. Impacts 2015, 17, 177–185. [Google Scholar] [CrossRef]
- Pelegrino, M.T.; Kohatsu, M.Y.; Seabra, A.B.; Monteiro, L.R.; Gomes, D.G.; Oliveira, H.C.; Rolim, W.R.; de Jesus, T.A.; Batista, B.L.; Lange, C.N. Effects of copper oxide nanoparticles on growth of lettuce (Lactuca sativa L.) seedlings and possible implications of nitric oxide in their antioxidative defense. Environ. Monit. Assess. 2020, 192, 232. [Google Scholar] [CrossRef]
- Dimkpa, C.O.; McLean, J.E.; Latta, D.E.; Manangón, E.; Britt, D.W.; Johnson, W.P.; Boyanov, M.I.; Anderson, A.J. CuO and ZnO nanoparticles: Phytotoxicity, metal speciation, and induction of oxidative stress in sand-grown wheat. J. Nanopart. Res. 2012, 14, 1125. [Google Scholar] [CrossRef]
Figure 1.
X-ray diffraction patterns of ZnO synthesized using flower (ZnO-F), stem (ZnO-S), and leaf (ZnO-L) extracts of T. diversifolia.
Figure 1.
X-ray diffraction patterns of ZnO synthesized using flower (ZnO-F), stem (ZnO-S), and leaf (ZnO-L) extracts of T. diversifolia.
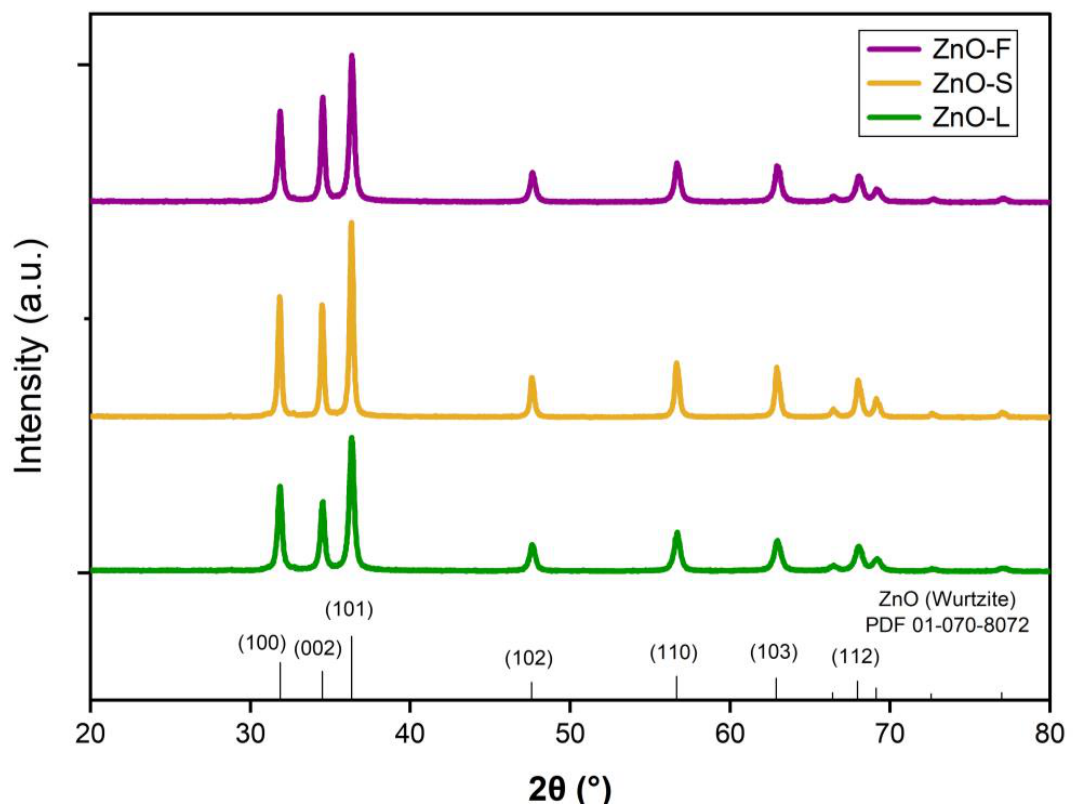
Figure 2.
Halder–Wagner plots obtained from the XRD data for the ZnO samples: (a) ZnO-F, (b) ZnO-S, and (c) ZnO-L. The solid lines represent the linear fits used to determine the crystallite size (D) and microstrain (ε).
Figure 2.
Halder–Wagner plots obtained from the XRD data for the ZnO samples: (a) ZnO-F, (b) ZnO-S, and (c) ZnO-L. The solid lines represent the linear fits used to determine the crystallite size (D) and microstrain (ε).
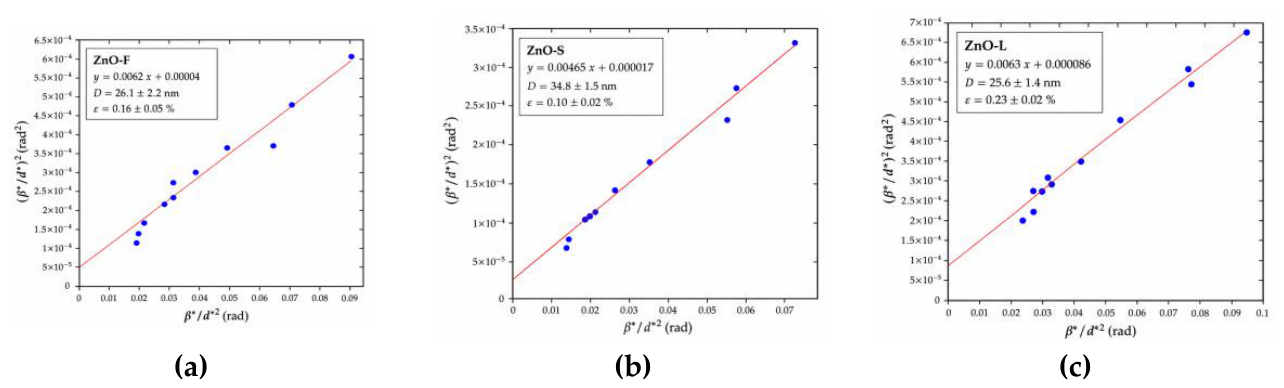
Figure 3.
SEM micrographs of ZnO synthesized using different T. diversifolia extracts: (a–b) ZnO-F, (c–d) ZnO-S, and (e–f) ZnO-L, recorded at magnifications of ×3,000 and ×5,000, respectively.
Figure 3.
SEM micrographs of ZnO synthesized using different T. diversifolia extracts: (a–b) ZnO-F, (c–d) ZnO-S, and (e–f) ZnO-L, recorded at magnifications of ×3,000 and ×5,000, respectively.
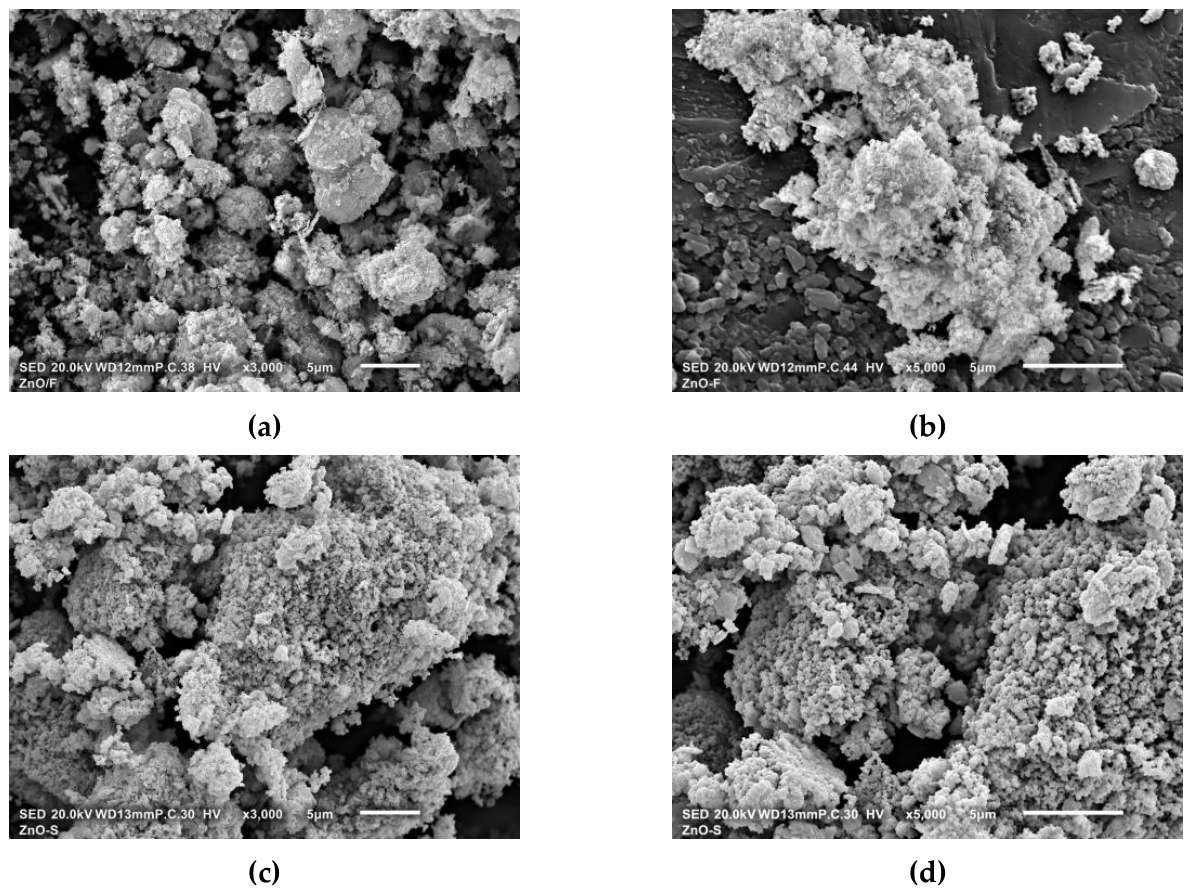
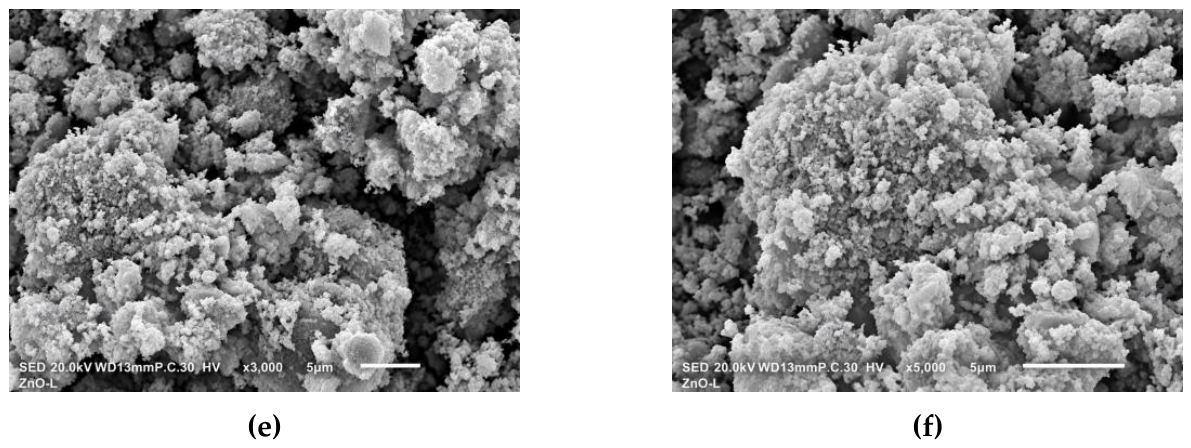
Figure 4.
EDS spectra of (a) ZnO-F, (b) ZnO-S, and (c) ZnO-L.
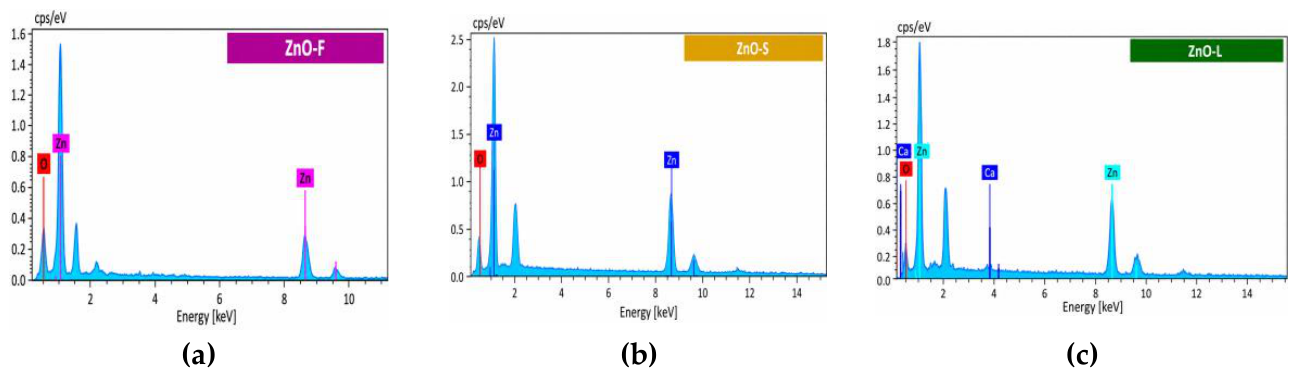
Figure 5.
FTIR spectra of ZnO-F, ZnO-S, and ZnO-L. The spectra are vertically offset for clarity.
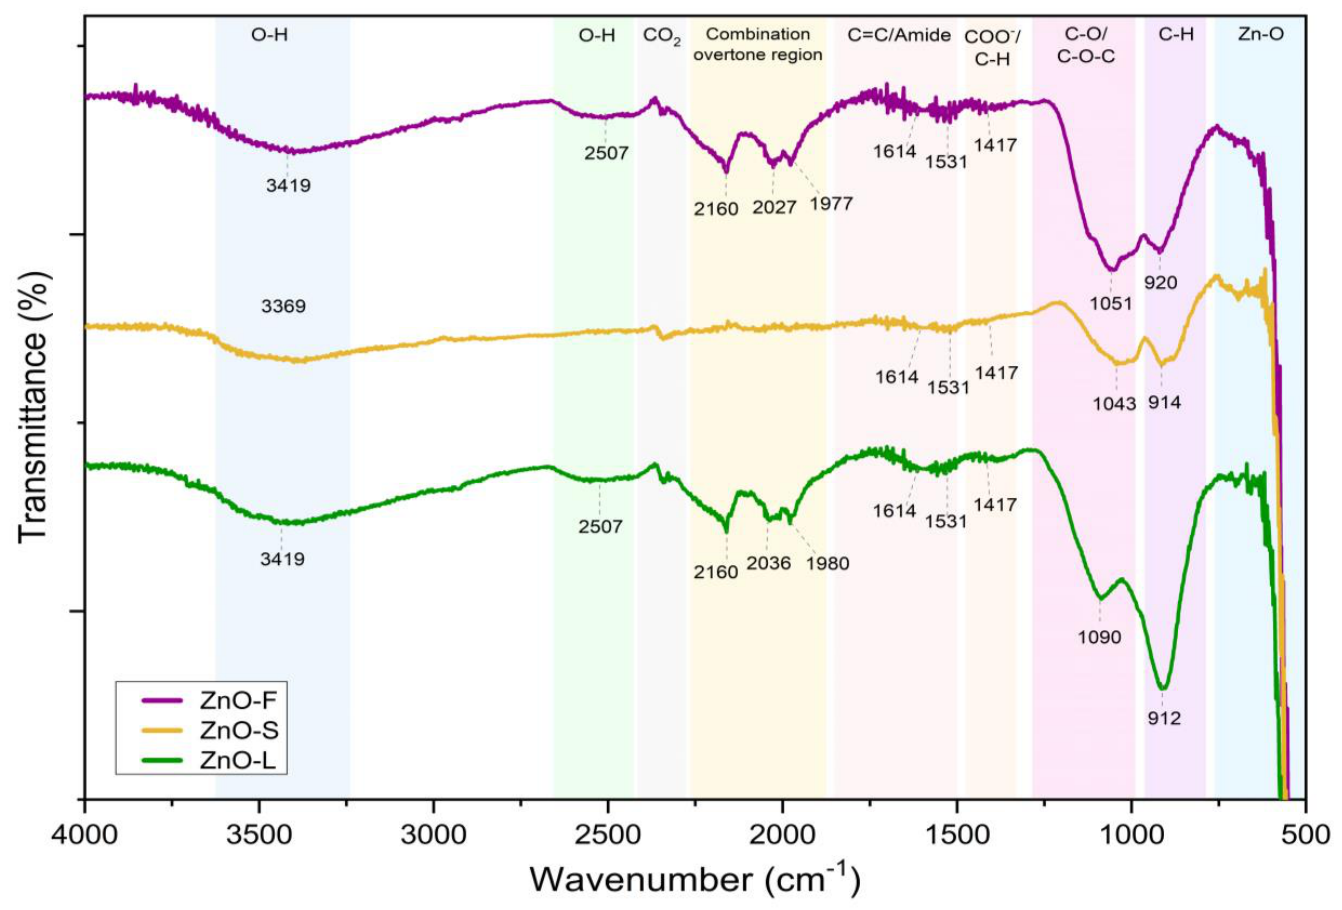
Figure 6.
Effect of ZnO-F concentration on Lactuca sativa seedling growth: (a) radicle and hypocotyl elongation and (b) elongation relative to the control. Data in (a) are presented as mean ± SD (n = 3). Values in (b) were calculated from the corresponding mean elongation values relative to the control.
Figure 6.
Effect of ZnO-F concentration on Lactuca sativa seedling growth: (a) radicle and hypocotyl elongation and (b) elongation relative to the control. Data in (a) are presented as mean ± SD (n = 3). Values in (b) were calculated from the corresponding mean elongation values relative to the control.
|
Toxicity Parameters |
ZnO concentration (mg L⁻¹) | |||||||||||||||||
| ZnO-F | ZnO-S | ZnO-L | ||||||||||||||||
| Control (-) |
100 | 80 | 60 | 40 | 20 | Control (-) |
100 | 80 | 60 | 40 | 20 | Control (-) |
100 | 80 | 60 | 40 | 20 | |
|
Germination index |
0 | -0.027 | -0.027 | -0.081 | -0.054 | -0.297 | 0 | -0.350 | -0.175 | -0.200 | -0.125 | -0.300 | 0 | -0.252 | -0.275 | -0.125 | -0.075 | -0.125 |
| Toxicity | -- | Low | Low | Low | Low | Mod | -- | Low | Low | Low | Low | Low | -- | Mod | Mod | Low | Low | Low |
|
Radicle elongation index |
0 | -0.050 | -0.088 | -0.087 | 0.040 | 0.020 | 0 | -0.587 | -0.524 | -0.407 | -0.291 | -0.297 | 0 | -0.564 | -0.443 | -0.178 | -0.047 | -0.047 |
| Toxicity | -- | Low | Low | Low | Horm | Horm | -- | High | High | Mod | Mod | Mod | -- | High | Mod | Low | Low | Low |
|
Hypocotyl elongation index |
0 | -0.174 | -0.187 | -0.149 | -0.209 | -0.278 | 0 | -0.653 | -0.574 | -0.397 | -0.212 | -0.399 | 0 | -0.477 | -0.404 | 0.140 | 0.299 | 0.359 |
| Toxicity | -- | Low | Low | Low | Low | Mod | -- | High | High | Mod | Low | Mod | -- | Mod | Mod | Horm | Horm | Horm |
Figure 7.
Effect of ZnO-S concentration on Lactuca sativa seedling growth: (a) radicle and hypocotyl elongation and (b) elongation relative to the control. Data in (a) are presented as mean ± SD (n = 3). Values in (b) were calculated from the corresponding mean elongation values relative to the control.
Figure 7.
Effect of ZnO-S concentration on Lactuca sativa seedling growth: (a) radicle and hypocotyl elongation and (b) elongation relative to the control. Data in (a) are presented as mean ± SD (n = 3). Values in (b) were calculated from the corresponding mean elongation values relative to the control.
|
Toxicity Parameters |
ZnO concentration (mg L⁻¹) | |||||||||||||||||
| ZnO-F | ZnO-S | ZnO-L | ||||||||||||||||
| Control (-) |
100 | 80 | 60 | 40 | 20 | Control (-) |
100 | 80 | 60 | 40 | 20 | Control (-) |
100 | 80 | 60 | 40 | 20 | |
|
Germination index |
0 | -0.027 | -0.027 | -0.081 | -0.054 | -0.297 | 0 | -0.350 | -0.175 | -0.200 | -0.125 | -0.300 | 0 | -0.252 | -0.275 | -0.125 | -0.075 | -0.125 |
| Toxicity | -- | Low | Low | Low | Low | Mod | -- | Low | Low | Low | Low | Low | -- | Mod | Mod | Low | Low | Low |
|
Radicle elongation index |
0 | -0.050 | -0.088 | -0.087 | 0.040 | 0.020 | 0 | -0.587 | -0.524 | -0.407 | -0.291 | -0.297 | 0 | -0.564 | -0.443 | -0.178 | -0.047 | -0.047 |
| Toxicity | -- | Low | Low | Low | Horm | Horm | -- | High | High | Mod | Mod | Mod | -- | High | Mod | Low | Low | Low |
|
Hypocotyl elongation index |
0 | -0.174 | -0.187 | -0.149 | -0.209 | -0.278 | 0 | -0.653 | -0.574 | -0.397 | -0.212 | -0.399 | 0 | -0.477 | -0.404 | 0.140 | 0.299 | 0.359 |
| Toxicity | -- | Low | Low | Low | Low | Mod | -- | High | High | Mod | Low | Mod | -- | Mod | Mod | Horm | Horm | Horm |
Figure 8.
Effect of ZnO-L concentration on Lactuca sativa seedling growth: (a) radicle and hypocotyl elongation and (b) elongation relative to the control. Data in (a) are presented as mean ± SD (n = 3). Values in (b) were calculated from the corresponding mean elongation values relative to the control.
Figure 8.
Effect of ZnO-L concentration on Lactuca sativa seedling growth: (a) radicle and hypocotyl elongation and (b) elongation relative to the control. Data in (a) are presented as mean ± SD (n = 3). Values in (b) were calculated from the corresponding mean elongation values relative to the control.
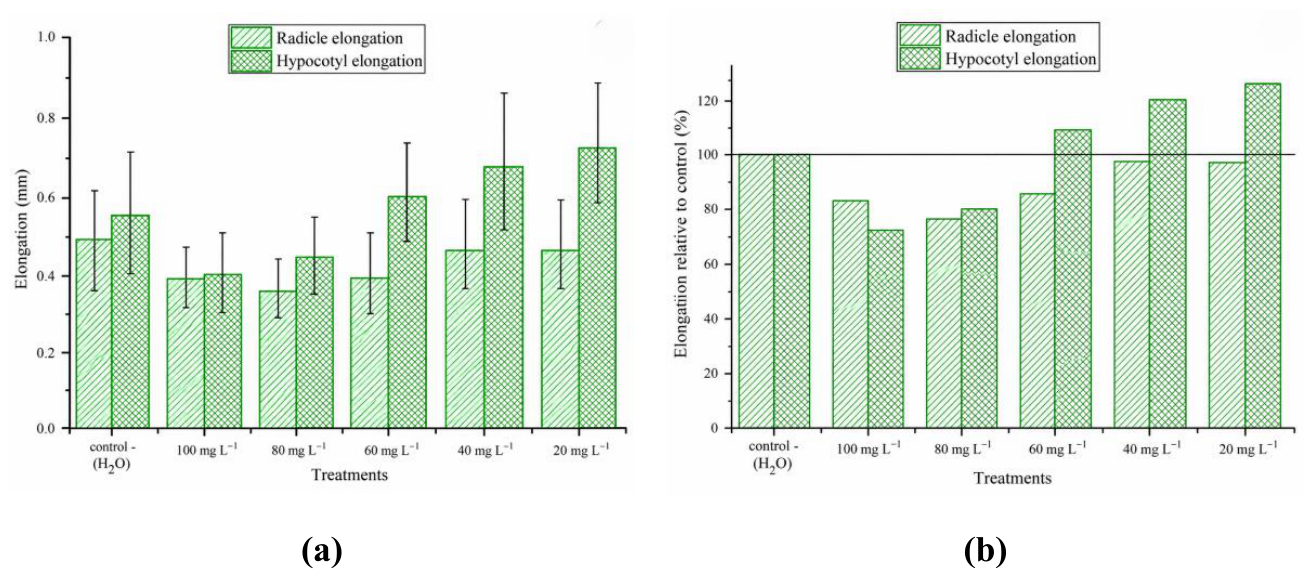

Table 1.
Elemental composition and Zn/O atomic ratios determined by EDS analysis.
| Sample | Zn (at.%) |
O (at.%) |
Ca (at.%) |
Zn/O atomic ratio |
|---|---|---|---|---|
| ZnO-F | 35.85 | 64.15 | — | 0.56 |
| ZnO-S | 59.54 | 40.46 | — | 1.47 |
| ZnO-L | 63.24 | 34.68 | 2.08 | 1.82 |
Note: at.% = atomic percentage; — = no signal detected for the corresponding element.
Table 2.
Germination and elongation indices of L. sativa exposed to different concentrations of ZnO-F, ZnO-S, and ZnO-L.
Table 2.
Germination and elongation indices of L. sativa exposed to different concentrations of ZnO-F, ZnO-S, and ZnO-L.
|
Toxicity Parameters |
ZnO concentration (mg L⁻¹) | |||||||||||||||||
| ZnO-F | ZnO-S | ZnO-L | ||||||||||||||||
| Control (-) |
100 | 80 | 60 | 40 | 20 | Control (-) |
100 | 80 | 60 | 40 | 20 | Control (-) |
100 | 80 | 60 | 40 | 20 | |
|
Germination index |
0 | -0.027 | -0.027 | -0.081 | -0.054 | -0.297 | 0 | -0.350 | -0.175 | -0.200 | -0.125 | -0.300 | 0 | -0.252 | -0.275 | -0.125 | -0.075 | -0.125 |
| Toxicity | -- | Low | Low | Low | Low | Mod | -- | Low | Low | Low | Low | Low | -- | Mod | Mod | Low | Low | Low |
|
Radicle elongation index |
0 | -0.050 | -0.088 | -0.087 | 0.040 | 0.020 | 0 | -0.587 | -0.524 | -0.407 | -0.291 | -0.297 | 0 | -0.564 | -0.443 | -0.178 | -0.047 | -0.047 |
| Toxicity | -- | Low | Low | Low | Horm | Horm | -- | High | High | Mod | Mod | Mod | -- | High | Mod | Low | Low | Low |
|
Hypocotyl elongation index |
0 | -0.174 | -0.187 | -0.149 | -0.209 | -0.278 | 0 | -0.653 | -0.574 | -0.397 | -0.212 | -0.399 | 0 | -0.477 | -0.404 | 0.140 | 0.299 | 0.359 |
| Toxicity | -- | Low | Low | Low | Low | Mod | -- | High | High | Mod | Low | Mod | -- | Mod | Mod | Horm | Horm | Horm |
Disclaimer/Publisher’s Note: The statements, opinions and data contained in all publications are solely those of the individual author(s) and contributor(s) and not of MDPI and/or the editor(s). MDPI and/or the editor(s) disclaim responsibility for any injury to people or property resulting from any ideas, methods, instructions or products referred to in the content. |
© 2026 by the authors. Licensee MDPI, Basel, Switzerland. This article is an open access article distributed under the terms and conditions of the Creative Commons Attribution (CC BY) license.
Copyright: This open access article is published under a Creative Commons CC BY 4.0 license, which permit the free download, distribution, and reuse, provided that the author and preprint are cited in any reuse.