

Submitted:
29 September 2026
Posted:
30 September 2026
You are already at the latest version
Abstract
Water resources in the semi-arid agricultural landscapes of Northern Kazakhstan are under intense stress from the climatic, ecological, socioeconomic issues, which increase the human–wildlife confrontations. Within this project the Extended Livelihood Vulnerability Index (LVI) was developed to assess farm holdings’ water-related vulnerability and climate change adaptive capacity for the Saiga Antelope (Saiga tatarica) recovery. The framework integrates 13 components and 62 indicators covering climate and natural hazards, human–wildlife conflict, water resources issues, natural and land resources, agriculture, infrastructure, socioeconomic conditions, and livelihood strategies. The assessment combines hydroclimatic data from 1961–2024, field surveys, questionnaires, official statistics, spatial information, and saiga migration data from Naurzum and Auliekol Districts of Kostanay Region. Overall LVI values were 0.485 in Naurzum and 0.431 in Auliekol. Natural Resources availability indexes showed the highest component score (1.000 in both districts), followed by Human–Wildlife Conflict (0.862 and 0.770), next Climate Change and Natural Disasters (0.741 in both). Climate analysis revealed significant increase by warming (0.28 °C per decade) without a significant long-term precipitation trend. The project findings demonstrate that water resources availability stress is a cross-cutting dimension of rural vulnerability, while saiga recovery creates an additional pathway of socio-ecological complexities y through competition for water, pasture, and agricultural lands.
Keywords:
water security
; saiga antelope
; human–wildlife conflict
; farm holdings
; climate change
; rural sustainability
1. Introduction
Water resources availability is one of the main Kazakhstan’s constraints for sustainable development [1], a country whose inland location and predominance of arid and semi-arid landscapes leave its water resources highly sensitive to climate change, with regional warming outpacing the global average [2]. The United Nations Framework Convention on Climate Change (UNFCCC) reported that the mean annual air temperature has increased by 0.34 °C per decade [3]. This warming trend is accompanied by a measurable reduction in Kazakhstan’s water resource base. The area of Tien Shan glaciers has shrunk by 25–30% over the past 50 years, gradually reducing the availability of water resources [4]. More than 75% of Kazakhstan’s territory is currently subject to desertification and land degradation. Water resources availability for agricultural use are getting complicated for maintaining food sustainability, rural development, which intensifies confrontations for the wildlife needs [5].
Kazakhstan is a signatory to the UNFCCC [6] and the Paris Agreement [7], and in its 2023 NDCs [8], the country has encompassed measures to adapt to climate change. The key sectors include Agriculture and Water Resources. Water management is guided by the Concept for the Development of the Water Resources Management System for 2024–2030 [9], which emphasizes rising competition among agricultural, domestic, industrial and wildlife, flora and fauna requirements. These measures reveal a shift from simply monitoring problems to actively integrating water security issues into national and regional planning.
The Concept for the development of the agro-industrial complex until 2030 focuses on reducing climate risks in agriculture in order to ensure food security (SDG 2) and climate-adapted agriculture (SDG 13) [10,11]. Previous regional assessments, research work related to people and wildlife confrontations, which were investigated by Baytelieva group of researchers of nomadic pastoralists’ livelihoods in the Zhetysu Region of Kazakhstan [12], have looked at climate, social and economic aspects of rural issues, including water and wildlife connection complexities. However, the rural areas of Northern Kazakhstan, where agricultural water needs now coincide with the needs of the recovering saiga (Saiga tatarica) population, have been without proper assessment of the combined indicators, such climate, water, and ecological variables. Due to the effects of climate change, declining agricultural production may lead to a decline in Kazakhstan’s GDP by 0.5–0.7% annually by 2050 and 0.6-1.0% annually by 2100 [13]. In 2026, a UN-sponsored Regional Environment Summit stressed the immediacy of integrated water security planning in Central Asia, with climate and water security identified as the region’s main shared risk [14].
Kazakhstan has fulfilled its reporting duties under the UN Convention to Combat Desertification (UNCCD), but current ways of assessing rural water security often overlook the impact of wildlife on shared water infrastructure [15]. One important but less studied issue is competition between farms and recovering wildlife populations for limited surface water resources such as ponds, rivers, and livestock watering bodies, especially in arid climates.
Studies worldwide show that climate change is altering the migratory routes of large ungulates, impacting food and water availability, and increasing human–wildlife conflict (HWC) [16]. When livestock and wildlife use the same water sources and pastures, competition for resources intensifies, which can damage pastures, weaken the larger rangeland ecosystem, and increase the risk of emerging diseases in wildlife, livestock, and humans [17,18]. While GIS-based spatial analysis is now widely used in land and water studies [19], most studies in the arid regions of Central Asia focus on general climate elements and pay less attention to preparation tracking, moving monitoring and impact of wildlife on local water and agricultural systems.
The saiga, a keystone species of Eurasian steppe ecosystems, is protected under the Convention on the Conservation of Migratory Species of Wild Animals [15]. According to recent estimates, Kazakhstan supports about 90% species within the global population of this species [20,21]. As a result of consistent implementation of national conservation measures, the saiga population has recovered from critically low levels recorded in the early 2000s to a historical maximum estimated at approximately 3.9–4.1 million individuals by 2025 [15,20,21,22,23,24,25,26,27,28,29,30,31].
Along with the recovery of the saiga populations, interactions between migratory herds and farms also increase. In the Kostanay Region, over 24,000 hectares of farmland have been officially reported as damaged [28,29]. This problem is especially clear in Auliekol and Naurzum Districts, which are on the main migration routes of the Betpak-Dala saiga. The large numbers of animals in these areas increase competition for land, pastures, and limited surface water resources on which both livestock and rural families depend. This adds to water security risks already worsened by dry conditions and infrastructure issues [29,30].
Studies in Kazakhstan on the relationship between agriculture and saiga have addressed population management, damage assessment, and migration tracking [32,33,34,35,36,37]. However, few studies integrate climate, natural resources, including water, wildlife, social, infrastructural, and political aspects to better understand the water resource vulnerability in rural areas of Northern Kazakhstan. In particular, little attention has been paid to how recovering large animal populations affects competition for scarce water and farms’ potential to adapt. This gap indicates the need for water security assessment tools that measure competition level between humans and wildlife for water.
Water supply and sanitation have been key parts of the Livelihood Vulnerability Index (LVI) framework [38]. This demonstrates that access to water and water-related risks play a central role in the vulnerability of rural livelihoods. The LVI also includes socio-demographic, economic, climate, and other environmental aspects.
Following the LVI, the LVI-IPCC model was developed, which focused on three indicators: exposure, sensitivity, and adaptive capacity, the main components of vulnerability to climate change, according to the Intergovernmental Panel on Climate Change. These indicators make it possible to determine how each factor, including water issues, plays a role in the overall index. The LVI and its updates have been used to study rural vulnerability in many different environmental, climate, and social situations, including water shortages. Baytelieva et al. [12] used the framework to look at the water- and pasture-based livelihoods of nomadic herders in Kazakhstan, which guided later studies on climate vulnerability [39], links between climate change, vulnerability, and migration [40], standardizing LVI indicators [41], adaptation and sustainable development [42,43], and ecotourism under climate change [44]. Khamsin et al. [45] also studied Kazakhstan’s nomadic herding, and Bemanesh [46] used Kazakhstan as a case for climate adaptation and rural vulnerability.
Until now, the LVI has been used to study vulnerability in rural areas under different natural and climate conditions for many case worldwide, including Kazakhstan. Previous versions of the LVI application studies were without consideration how the recovery of large wildlife populations affects competition for shared water resources, or how this competition affects pasture quality, land use, and the overall sustainability of farms. The updated Extended LVI (ELVI) version, which applied for this project, includes 13 related components and 62 indicators that cover climate, water, natural resources, wildlife, social, and policy aspects of rural water security. It goes beyond measuring water supply and sanitation by also examining how water issues affect other areas, such as competition for watering points between livestock and wildlife, how pasture productivity depends on water, and the causes of drought and flood risk.
In addition to measuring water supply and sanitation, the study considers how water issues affect other areas, such as competition for water between livestock and wildlife, the dependence of pasture productivity on water, and the causes of drought and flood risk. This approach makes it possible to study water use, farming, and human–saiga interactions as a whole system. The indicators match the Paris Agreement, Kazakhstan’s Environmental Code, and the UN Sustainable Development Goals.
The reliability of the research methods is due to the use of long-term hydroclimatic data from four meteorological stations of the RSE “Kazhydromet” (1961–2024). The data were analyzed with the Mann-Kendall trend test and Sen’s slope estimator, along with official statistics, field surveys, questionnaires from farm leaders, spatial analysis, and information on Betpak-Dala saiga migration.
The objective of this study is to develop and validate an ELVI to assess water security and the adaptive capacity of farms in Northern Kazakhstan under the combined impacts of climate change and the recovery of a competing wild water user, the saiga antelope.
To achieve this goal, we have had: 1) analyzed recent hydroclimatic trends and key water vulnerability factors in the study area; 2) developed an ELVI, adapted to the ecological, socioeconomic, and institutional characteristics of Northern Kazakhstan; 3) integrated indicators demonstrating the impact of saiga recovery on water competition and rural water security; 4) conducted a comparative assessment of the adaptive capacity of farms in the Naurzum and Auliekol Districts of Northern Kazakhstan; and 5) identified key factors limiting the adaptive capacity of rural communities and propose priority areas.
The scientific novelty of this study is that it expanded the ELVI framework, adapted for the first time in Northern Kazakhstan, to analyze competition for water resources between agricultural production and a recovering wild ungulate population as an explicit driver of rural water insecurity, alongside the framework’s existing climatic, socio-economic, and institutional dimensions.
2. Materials and Methods
2.1. Study Area
For the study area, we selected the Kostanay Region as a significant region of the food and water security of the Republic of Kazakhstan, and due to its location within a zone of intensive interaction among agricultural water demand, land use, natural ecosystems, and wildlife. This study was approved by the Local Ethics Commission of the Institute of Zoology, Science Committee of the Ministry of Science and Higher Education of the Republic of Kazakhstan (Protocol No. 1, 01/02/2024). Informed consent was obtained from all respondents prior to their participation. We conducted the research in the Naurzum District and Auliekol District, which represent different types of socio-ecological conditions and varying levels of Human-Wildlife Conflict (Figure 1).
The Naurzum District (hereinafter referred to as ND) is characterized predominantly by arid steppe landscapes and includes the Naurzum State Nature Reserve, which is designated as a World Heritage Site of the United Nations Educational, Scientific and Cultural Organization (UNESCO) [47]. The district lies along one of the principal migration routes of the Betpak-Dala saiga population. Considering growing anthropogenic pressure, limited water resources, an arid climate, and a high density of migratory ungulates, human-wildlife conflict is increasing in pasture ecosystems and it requires mitigation measures [22,27,28,29,48,49,50,51,52].
The Auliekol District, hereinafter referred to as AD, in contrast, is characterized by a more developed agricultural infrastructure and a combination of steppe and forest-steppe landscapes. In recent years, shifts in the migration routes of Saiga tatarica caused by various factors, including anthropogenic pressure, have been accompanied by a substantial increase in the area of damage to cereal and forage crops, as well as growing pressure on these shared water resources. As a result, agricultural producers in the district have incurred considerable economic losses due to the absence of effective mechanisms for damage mitigation and compensation, and response to arising risks [26,27,28,29,48,49,50,51,52].
Long-term climate data collected in 1962–2024 show a gradual increase in average monthly air temperatures, with the most noticeable changes in spring and extreme temperatures in summer.
As seen in Figure 1, the Naurzum State Nature Reserve is located mostly in the ND, with the northern edge located in the southern area of AD.
The meteorological stations under the jurisdiction of the RSE “Kazhydromet” (Karamendy, Dokuchaevka, Dievskaya, and Kushmurun stations) are located in the ND and AD, Kostanay Region, Northern Kazakhstan; the data were sufficient to examine the climatic trends of the two districts.
2.1.1. Soil-Hydrological Conditions and Agroecological Risks
The soil and hydrological conditions of the study area reflect the zonal transition from the chernozem forest-steppe to the arid chestnut steppe, jointly determining differences in soil water availability, agricultural techniques, and local adaptation plans [50,51,52,53].
The AD is dominated by ordinary chernozems with a humus content of 4-6% and southern chernozems containing 2–4% humus. A more developed hydrographic network, including the Ubagan, Ashchy, and Shili rivers, as well as Lakes Kushmurun and Karasor, promotes the formation of alluvial meadow soils that are extensively used for hay production [50,52]. The ND is characterized predominantly by dark chestnut and light chestnut soils with low humus content (1.5–3%), which exhibit a high degree of solonetzicity and substantially limit the potential for rainfed agriculture [50,51]. Under conditions of increasing climate stress, soil degradation has been exacerbated by prolonged anthropogenic pressure. Natural aridization is compounded by intensive zoogenic pressure, including the mechanical trampling of soils by migratory herds of Saiga tatarica and localized livestock overgrazing, thereby substantially increasing the risk of a long-term decline in land biological productivity [29,32,33,34,35,36,37].
Thus, the soil-hydrological characteristics of the study area are key factors forming the water-related vulnerability of rural areas. Their detailed assessment provides a more complete understanding of the effects of natural and anthropogenic processes on local water availability and livelihood sustainability, and supports the selection of suitable indicators for calculating the ELVI.
2.1.2. Field Surveys and Data Verification
We conducted field studies in 2024–2025 within farm holdings, hereinafter referred as FH, in the Naurzum and Auliekol Districts of the Kostanay region using the “random sampling” methodology within the framework of the World Health Organization (WHO) Expanded Program on Immunization [54] with additions by M. Hahn et al. [38].
We conducted interviews at respondents’ places of residence in Russian and Kazakh. We obtained informed consent prior to the interview. All the participants were informed of the purpose and nature of the study; their participation was confidential.
The questionnaire comprised 62 indicators grouped into 13 thematic components. These components were classified according to the three classical dimensions of vulnerability defined in the procedure of the Intergovernmental Panel on Climate Change (IPCC, 2014): exposure, sensitivity, and adaptive capacity [38] (Table 1).
As shown in Table 1, water-related dimensions of vulnerability are represented through the Water Supply and Sanitation component within Sensitivity, and through water-dependent components within Adaptive Capacity (Natural Resources, Land Resources) and Exposure (Climate Change and Natural Disasters, Human–Wildlife Conflict), manifesting the pervasiveness of water availability as a cross-cutting determinant of rural vulnerability in this arid region.
2.1.3. Sampling and Representativeness
At the initial stage of the fieldwork in 2024, the response rate remained relatively low owing to the high seasonal workload of agricultural producers and reservations regarding the confidentiality of financial and economic information. Access to the target population was subsequently expanded through the official support of the Department of Agriculture and Land Relations of the Kostanay Region, the Institute of Zoology of the Ministry of Science and Higher Education of the Republic of Kazakhstan (MSHE RK), and the administration of the Naurzum State Nature Reserve, headed by D.G. Koilybayev. Scientific consultation during the verification of the field data was provided by Professor T.M. Bragina.
We analyzed 600 officially registered FHs. The final sample included 187 respondents, which is 31.2% of the total study population. We selected participants using a stratified random selection approach.
The representativeness of the final sample was confirmed by the correspondence between its territorial distribution and the settlement patterns of the rural population, as well as the diversity of environmental, hydrological, and agricultural conditions across the study districts. The resulting dataset presents a strong basis for calculating the ELVI and its water-related components, and for conducting a comparative study of water resource vulnerability between the study areas.
2.2. Data Collection and Primary Processing
We collected field data using the KoBoToolbox platform. We then processed the dataset according to the following steps: 1) converting qualitative responses into quantitative variables; 2) verifying the logical integrity of responses; 3) removing incomplete questionnaires and anomalous records. The final verified database was compiled in MS Excel and subsequently used to calculate the ELVI, including its water-related indicators and components.
2.2.1. Research Limitations
Despite the high level of detail incorporated into the ELVI, the present study has several limitations arising from regional specificities.
First, a substantial proportion of the data came from surveys of heads and members of FHs and therefore reflects respondents’ subjective perceptions of climate change, the condition of natural and water resources, and the extent of damage associated with Human–Wildlife Conflict, including reported conflicts regarding shared watering points. During 2023–2024, we found a data disparity in the Kostanay Region between farmers’ loss assessments and those documented in inspection reports [55]. This could mean response bias, which frequently occurs in surveys where respondents anticipate direct government compensation.
A second limitation was the scale of the study area and the difficulty of accessing survey sites. Since the Kostanay Region covers approximately 196,000 km², with the study districts encompassing up to 1.8 million ha [56], physical access to the most remote pasture areas and their associated water points was constrained, and the vulnerability of farm holdings in peripheral areas may therefore have been partially underestimated.
In future studies, in order to improve the objectivity of agricultural damage and water scarcity assessment, it may be beneficial to integrate verification of respondents’ responses and Remote Sensing (RS) data using satellite-derived vegetation and surface-water indices, particularly the Normalized Difference Vegetation Index (NDVI) and the Normalized Difference Water Index (NDWI).
2.3. Extended Livelihood Vulnerability Index (ELVI) Calculation
To assess the vulnerability of FHs in Northern Kazakhstan, we applied the ELVI, which contains 13 main components and 62 indicators. The methodological foundation was the basic approach developed by Sullivan [57], further developed by Hahn et al. [38]. The operationalization of the socio-ecological vulnerability structure in the surveyed rural areas was based on the mathematical principles for calculating the LVI proposed by Hahn et al. [38]. This approach has been successfully applied to assess the livelihood vulnerability of nomadic pastoralists to climate change at the regional level in Kazakhstan by Baytelieva et al. [12] and in Nepal by Kayastha et al. [58]. The subsequent application and development of the LVI in studies conducted in Kazakhstan and other regions have confirmed the possibility of adapting the index structure, the set of indicators, and the standardization procedure to the specific conditions of the study areas [41,46]. In the present study, the ELVI was expanded to account for the specific characteristics of agricultural areas in Northern Kazakhstan. Unlike the classical LVI structure, the proposed model includes, alongside climatic, natural-resource, socio-economic, and organizational factors, biotic pressures associated with the recovery of the Saiga tatarica population, which may affect the livelihood capacity of rural populations.
The calculation of the ELVI was performed in the following consecutive stages:
Stage 1. Processing and quantifying primary data. Empirical qualitative and quantitative variables were converted into comparable metrics, including ratios, percentages, and indices.
Stage 2. Standardizing indicators. Each indicator was transformed into a standardized index, showing minimum to maximum vulnerability – from 0 to 1 using Equation (1) [12,38]:
where St is the initial value of the indicator for district t, and Smin and Smax are the minimum and maximum values of that indicator within the overall sample.
Stage 3. Aggregating indicators. For each of the 13 major components, the mean value of the corresponding standardized indicators was calculated using Equation (2) [12]:
where Mt is one of the 13 major components for district t. Sti denotes the standardized indicator i within each major component, and n is the number of indicators comprising that component.
For example, the Human-Wildlife Conflict (HWC) component was calculated using the following indicators: saiga population density, the proportion of crop damage, the occurrence of nighttime field guarding, and the absence of compensation for crop damage. Similarly, the Water Supply and Sanitation component was calculated using these indicators: access to clean drinking water, the incidence of local conflicts over livestock watering points, and access to standard sanitation facilities.
Stage 4. Calculating the composite ELVI. The final index value was calculated as the weighted average of all major components and ranges from 0 to 1, using Equation (3) [12,38,58]:
where ELVIt is the composite vulnerability index for district t; Mti represents the values of the major components; and Wmi denotes the weights assigned to the corresponding components, determined by the number of indicators included in each component.
In calculations according to Equation (3), we performed a control calculation on Equation 4 according to the method of Sullivan et al. [57] and Rai et al. [59]
2.3.1. Calculation of the ELVIt Based on the IPCC Framework (ELVIt-IPCC)
To facilitate interpretation within the internationally recognized framework used for assessing climate vulnerability, the calculated ELVIt values were transformed into the ELVIt-IPCC format, based on the conceptual framework of the Intergovernmental Panel on Climate Change (IPCC). The thirteen major components were classified into the three principal dimensions of vulnerability: Exposure (E), Adaptive Capacity (A), and Sensitivity (S) [12,38,58].
Stage 1. For each vulnerability dimension, the weighted average was calculated using Equation (5):
where CFt is the contributing category (Exposure, Sensitivity, or Adaptive Capacity) for district t; Mti represents the major components for district t, indexed by і; WMі is the weight assigned to each major component; and n is the number of major components within each category.
Stage 2. Determination of the “Exposure” (E) category. Exposure is measured using Equation (4) based on the component criteria of Climate Change and Natural Disasters and Human–Wildlife Conflict (Table 1).
Stage 3. Determination of the “Adaptive Capacity” (AC) category. Adaptive Capacity is measured using Equation (4) based on the component criteria of the Socio-Demographic Profile, Livelihood Strategies, Social Capital and Mutual Support Networks, Natural Resources and Land Resources, Energy Resources and Infrastructure, and Finance and Income (Table 1).
Stage 4. Determination of the “Sensitivity” category. Sensitivity is measured using Equation 4 based on the component criteria of Health, Agriculture and Food Security, and Water Supply and Sanitation (Table 1).
Stage 5. Calculation of the overall Livelihood Vulnerability Index (LVI) for district t. The contributing factors (Adaptive Capacity, Sensitivity, and Exposure) are combined using Equation (6):
ELVIt − IPCCt = (et + at) * St ,
The ELVIt-IPCC interpretation scale ranges from -1 (lowest vulnerability, stable system) to +1 (highest vulnerability). Values from -1.0 to -0.4 indicate low vulnerability (stable system); values from -0.39 to 0.30 indicate moderate vulnerability; and values from 0.31 to 1.0 indicate high vulnerability. A detailed example of the calculation of a major component for AD and ND is provided in Supplementary Materials (Table S1).
2.4. Mapping Components of the ELVIt to the UN Sustainable Development Goals
To align the results of the local study with the international development agenda, a correspondence matrix was developed linking all components of the ELVIt to the relevant UN Sustainable Development Goals (SDGs). Each of the 13 components of the index was mapped to one or more SDGs based on the processes reflected and their contribution to rural resilience. This procedure allows the agroecological risks of Northern Kazakhstan to be considered within the wider framework of the 2030 Sustainable Development Agenda [10,11].
Out of 15 SDGs, the components were strongly linked to SDG 2 “Zero Hunger,” SDG 3 “Good Health and Well-Being,” SDG 6 “Clean Water and Sanitation,” SDG 8 “Decent Work and Economic Growth,” SDG 13 “Climate Action,” and SDG 15 “Life on Land.” In addition, several components address aspects of SDG 1, SDG 11, SDG 12, and SDG 16, related to poverty reduction, the development of sustainable rural communities, responsible use of natural resources, and the strengthening of institutional governance mechanisms. Among these, SDG 6 (“Clean Water and Sanitation”) shows the most granular linkage, mapping to four targets — 6.1 (safe drinking water access), 6.2 (sanitation), 6.4 (water-use efficiency), and 6.5 (integrated water resources management) — reflecting water security’s role as a cross-cutting dimension of the ELVIt framework, consistent with this component’s relevance both directly (Water Supply and Sanitation) and indirectly (Natural Resources, Land Resources, Human–Wildlife Conflict).
The consolidated mapping of the 13 key components is presented in Table 2.
Comparing the index components with the SDGs demonstrated that the developed methodology can be used not only for the quantitative assessment of vulnerability in rural areas but also as a tool for monitoring progress toward national and international sustainable development priorities. The mapping of the indicators comprising the ELVItstructure to the UN Sustainable Development Goals is presented in Supplementary Materials (Table S2–S14).
3. Results
The ELVIt showed a high level of vulnerability in both the ND (0.485) and AD (0.431) (Table 3, Figure 2). Although the Water Supply and Sanitation component itself contributed a comparatively moderate share (0.352 ND, 0.333 AD), water availability is embedded within the two highest-scoring components (Natural Resources and Land Resources). The calculated values support the hypothesis that the combined effects of climatic droughts and increasing biotic (zoogenic) pressures, along with rapid saiga population growth and competition for shared water resources, reduce the endurance of local economic actors.
The spider chart (Figure 2) shows similar vulnerability profiles in both districts, indicating agroecological risks in Northern Kazakhstan.
The shift of values toward the upper end of the scale for the environmental components indicates that natural, hydrological, and biotic factors currently exert a stronger influence than the available adaptive resources at the farm-holding level.
3.1. Analysis of Dominant Vulnerability Domains
The comparative multi-criteria analysis shows that Human-Wildlife Conflict (HWC), combined with severe infrastructure constraints, already exceeds the adaptive capacity of a substantial proportion of small and medium-sized farm holdings (Table 3). For a detailed interpretation of the 13 calculated components, they were integrated into four dominant domains representing the key dimensions of vulnerability.
3.1.1. Ecological and Biological Pressure: Climate and Faunal Factors
The components within this area have the highest absolute values and make a decisive contribution to the overall vulnerability index. The Natural Resources component reached the maximum critical value (1.000) in both districts, showing the complete dependence of farm holdings on the natural condition of pasture ecosystems. Vulnerability associated with climate variability and extreme natural hazards is also consistently high (ND = 0.741; AD = 0.714), while the severity of the destructive effects of conventional hazards (droughts, dry winds, and steppe fires) has become fully comparable to the increasing biological pressure exerted by wild ungulates.
The “Human–Wildlife Conflict” (HWC) component emerged as the main differentiating indicator between the study areas: 0.862 in ND compared with 0.770 in AD. This indicator may have increased because of the Betpak-Dala saiga population’s abundance. In AD, damage to agricultural land was recorded over an area of 300 ha, whereas in the buffer zones of ND, this figure reached 1,326 ha [28,29]. This spatial disparity reflects the direct overlap between ND’s agricultural land, its dense hydrological network, and the summer and winter ranges of the Betpak-Dala saiga population (Figure 3), which together concentrate both grazing and water-resource competition along the district’s linear infrastructure corridors. Direct losses of grain and forage crops in affected FHs amounted to 10–40% of total production, undermining the economic soundness of farm holdings. Excessive grazing pressure from ungulates also substantially reduces the available forage base for the private household livestock of the rural population, triggering localized degradation and depletion of vegetation cover.
The high HWC value is also reflected in the sharp increase in unproductive labor requirements: farmers are forced to devote 7–9 hours per day to constant nighttime field guarding (Table 3). The high indices for the “Land Resources” component (ND = 0.704; AD = 0.689) confirm that respondents directly associate the presence of saiga herds with soil trampling and declining pasture bioproductivity.
3.1.2. Socio-Demographic and Epidemiological Risks
Analysis of the distribution of demographic variables showed that AD is more vulnerable in this component (0.629) than ND (0.494). This trend is attributable to the unfavorable age structure of FH heads and their lower level of specialized agronomic and zootechnical training, which narrows the internal capacity for flexible adaptation to external challenges.
The “Health” component shows moderate indices (ND = 0.375; AD = 0.358). Nevertheless, farmers (100%) report psycho-emotional stress due to chronic stress caused by the need to guard crops. Furthermore, epidemiological threats associated with the spread of zoonotic infections, particularly brucellosis, are increasing sharply in areas where livestock comes into direct contact with wildlife. According to sanitary and epidemiological monitoring data, brucellosis was verified in 27 people in AD in 2024 [60]. The average incidence of brucellosis among cattle was 1.2% in AD and 1.0% in ND, providing the official legal basis for imposing strict quarantine restrictions in several settlements, including the villages of Dangerbay, Dievka, and Fedoseevka [60,61,62]. An additional epidemiological risk factor is human contact with animal carcasses during periods of natural saiga calving and mortality.
3.1.3. Infrastructural and Institutional Limitations
This domain reflects the external systematic factors under which the regional agricultural sector operates. The high levels of infrastructure vulnerability (ND = 0.695; AD = 0.680) indicate an extremely low level of production and household infrastructure provision. Personnel accommodation at remote field camps in temporary living trailers and containers (100% in ND), combined with substantial distances from service and medical centers (up to 150 minutes in ND), limits the ability to respond quickly to emergencies.
A significant limiting factor is inadequate energy provision. In the arid ND, vulnerability in the Energy component is almost twice as high as in AD (0.320 versus 0.175). All surveyed farm holdings in both districts rely on solid wood fuel as their only available source of thermal energy. Financial vulnerability (ND = 0.534; AD = 0.529) is exacerbated by the complete absence of agricultural insurance programs covering damage caused by wild animals, while accumulated FH debt further limits the possibility of rapid asset recovery. The “Water Supply and Sanitation” component (ND = 0.352; AD = 0.333) reflects latent fundamental tensions: 100% of surveyed farmers reported increasing local conflicts over access to watering sources between domestic livestock and migrating saiga herds.
3.1.4. Adaptive Capacity and Recovery Strategies
Despite strong external destabilizing pressures, the internal resources of local socio-ecological systems demonstrate a certain degree of damage resistance, recovery, and adaptation to new conditions. The most favorable (lowest) vulnerability values were recorded for the “Agriculture and Food Security” component (ND = 0.130; AD = 0.115), which can be credited to the continued use of a historically effective mixed (diversified) farming model, in which crop production and livestock farming effectively offset each other’s risks.
The low indices for the “Social Capital and Mutual Support Networks” component (ND = 0.229; AD = 0.224) support the viability of horizontal mutual-support ties within rural communities and the active adoption of digital communication networks for promptly sharing information about the migration fronts of saiga herds. The “Livelihood Strategies” component (ND = 0.241; AD = 0.202) also indicates diversification of income sources through seasonal off-farm employment, logistics services, and elements of ecotourism.
Overall, whereas ND is more vulnerable (ELVIt = 0.485) to climate and biotic conditions (i.e., competition for water and saiga recovery), AD is more vulnerable (ELVIt = 0.431) to anthropogenic pressure.
3.2. Vulnerability Assessment via IPCC Methodology
Aggregation of the main components according to the three-factor IPCC matrix revealed clear structural differences in the nature of vulnerability across the districts. According to the calculations, ND (0.4) falls within the high-vulnerability range, whereas AD (0.3) is at the lower boundary of moderate vulnerability (Table 4).
Analysis of the vulnerability triangle diagram (Figure 4) reveals multiple important patterns. First, both territories face extreme external exposure (0.7–0.8) driven by combined climatic and biological pressures. Second, the identical sensitivity level (0.3) confirms the similar underlying dependence of agricultural production in Northern Kazakhstan on the stability of ecosystem services. Third, AD’s lower adaptive capacity (0.4) is offset by its lower level of direct migratory contact with wild herds, keeping the district within the range of moderate and relatively stable vulnerability.
4. Discussion
The assessment of socio-ecological vulnerability based on the ELVIt, comprising 13 main components and 62 indicators, identified the key factors determining the resilience of farm holdings in Naurzum (ND) and Auliyekol Districts (AD) of Kostanay Region. The methodological foundation of the study was based on the LVI concept proposed by Hahn et al. [38], which has previously been adapted to the conditions of Kazakhstan and Central Asian countries [12,41,58]. Unlike previous studies, the present research considers not only the effects of climate change but also the recovery of the Saiga tatarica population as interconnected factors shaping the current structure of socio-ecological vulnerability in rural areas. The findings demonstrate that the recovery of the saiga population is accompanied by new challenges for the agricultural sector, particularly in areas crossed by traditional migration routes. Combined with intensifying climatic aridification, this leads to transformations in the natural resource and water resource base, increased pressure on forage and water availability, and changes in the nature of interactions between conservation, water use, and agricultural systems. The following subsections examine the climatic, hydrological, biotic, and socio-economic differences between ND and AD, and their implications for rural development. For each component, the rationale behind indicator selection and its alignment with the Sustainable Development Goals is detailed separately in Supplementary Materials (Tables S2–S14).
4.1. Natural Resources
The “Natural Resources” component demonstrated the highest vulnerability index value (ELVIt = 1.000) in both ND and AD (Table 2), indicating the leading role of the natural resource and water resource base in ensuring the resilience of agricultural systems in the study area. A similar pattern was identified in the study by Baytelieva et al. [12]. The results obtained, and the consistency of this finding across different regions of Kazakhstan, are in line with the current understanding that degradation of the natural resource base is one of the key factors contributing to declining resilience of agricultural systems in arid areas [17,32,33,34,35,36,37,63,64,65,66]. The availability and condition of natural forage resources are important factors influencing the sustainability of pastoral livestock production and the adaptive capacity of rural farm holdings [17]. In agricultural-steppe ecosystems, it is important to assess the availability of natural forage, including water sources, ungulate densities in the area, and levels of damage to the crops. The importance of a spatial approach to assessing pasture productivity, forage resources, and the potential carrying capacity of habitats for the Betpak-Dala population of Saiga tatarica in the Korgalzhyn Nature Reserve, Kazakhstan, was investigated by Islamgulova et al. [17]. Using field geobotanical surveys, remote sensing, and spatial modelling, the authors identified pronounced spatial heterogeneity in rangeland productivity and forage resources and estimated the potential carrying capacity of saiga habitats. The rationale for the selected indicators is presented in Supplementary Materials (Table S2).
4.2. Human–Wildlife Conflict
The “Human-Wildlife Conflict” component had a higher level of vulnerability in ND (ELVIt = 0.862) compared with AD (ELVIt = 0.770) (Table 3), reflecting pronounced spatial heterogeneity in the impact of Saiga tatarica on the agricultural systems of the study area. In the study by Baytelieva et al. [12], this component was likewise characterized by high vulnerability. The higher index value in ND is primarily attributable to the location of a substantial proportion of agricultural land within the buffer zone of the Naurzum State Nature Reserve and in proximity to traditional saiga migration routes [29,47]. The survey results are consistent with findings from studies on saiga migration ecology and conflicts between conservation and agriculture [37]. The most cases of HWC occur during the spring migration of saiga antelopes to calving grounds, when most farmers begin fieldwork and pasture preparation. The emergence of the current conflict is associated not only with the growth of the saiga population but also with land-use changes that occurred during the period of sharp population decline. Substantial areas of land were allocated for long-term agricultural use without sufficient consideration of historical migration corridors, thereby increasing the spatial overlap between the interests of the conservation and agricultural sectors [55]. The demographic transformation of the saiga population represents a significant conservation achievement; however, it has simultaneously increased cases of HWC on agricultural areas located within the species’ migration range [17,21,22,26,27,28,29,32,33,34,35,36,37,65,66].
According to the Department of Agriculture and Land Relations of Kostanay Region, the total area of damaged agricultural land in the study districts amounted to 8,976.4 ha, including 4,700 ha in AD and 4,276.4 ha in ND [49]. Despite the comparable areas of damage, the consequences of this impact differ due to differences in land-use patterns, farm specialization, and the location of agricultural land relative to Saiga migration routes. Direct losses of agricultural production represent only part of the overall damage. According to the survey results, substantial additional costs are associated with round-the-clock monitoring of crops, construction of temporary protective structures, hiring additional workers, disruption of the timing of agrotechnical activities, and reduced quality of harvested forage (Figure 5). Official reports rarely reflect these costs.
International studies show that the indirect consequences of human–wildlife conflicts may persist longer than direct production losses [17,41,42,67].
The measures adopted by the government to regulate saiga population numbers reflect a shift from an exclusively conservation-oriented model toward adaptive species management [26,68]. The rationale for the six indicators is presented in Supplementary Materials (Table S3).
4.3. Climate Change and Natural Disasters
Calculations for the “Climate Change and Natural Disasters” component revealed a critically high level of vulnerability in both study districts: 0.741 in ND and 0.714 in AD (Table 2). In the study by Baytelieva et al. [12], the climate vulnerability of nomadic communities was likewise characterized by high values for this component (0.522 and 0.521). Despite the lower absolute values, the findings of both studies confirm that extreme natural events are among the leading factors contributing to the vulnerability of FHs. Three interrelated subcomponents are distinguished within this component: drought, fire risk, and extreme hydrological events (Table 3). Although all three processes contribute to a high level of climate exposure, they differ substantially in their mechanisms of occurrence, spatial distribution, and socio-economic consequences.
4.3.1. Drought
Under the semi-arid climate conditions of Northern Kazakhstan, even a relatively small increase in air temperature in the absence of a substantial increase in atmospheric moisture leads to higher potential evapotranspiration, reduced soil-moisture reserves, and an increased frequency of droughts [50,51,69]. Previous studies have reported a statistically significant warming trend in Kazakhstan (Figure 6 and Figure 7), while no comparable long-term trend has been detected in annual precipitation totals [69]. This combination of persistent warming and high interannual variability in precipitation is characteristic of contemporary aridification in dry regions of Eurasia and increases climate-related vulnerability in agriculture [42,43,69]. National assessments indicate that air temperature in Kazakhstan has been increasing at approximately 0.36 °C per decade [2,3,69].
The change in the structure of temperature anomalies (Figure 6) indicates a qualitative transformation of the climatic regime of the study area. Whereas negative temperature anomalies prevailed during the 1961–1990 climatic reference period, since the 1990s, virtually all decades have been characterized by a persistent dominance of positive deviations. Similar changes have been documented across most steppe areas of Central Asia and are regarded by the IPCC as one of the most compelling manifestations of contemporary climate change. Consequently, rising air temperatures are becoming a determining factor in shaping the climate vulnerability of rural areas, even in the absence of a pronounced decline in atmospheric precipitation.
In contrast to the temperature regime, as seen in Figure 7, there is no statistically significant long-term trend in annual precipitation anomalies (p > 0.05), despite a weak positive tendency of approximately 3.96 mm per decade. These estimates are fully consistent with data from the RSE “Kazhydromet,” according to which most regions of Kazakhstan have experienced only a slight increase in annual precipitation totals of approximately 1.7 mm per decade over recent decades, with no statistically robust changes in their spatial distribution [2,3,69]. The analysis identified years with the most pronounced atmospheric moisture deficits (1984, 1991, 1998, 2010, and 2021) and periods of excessive moisture (1964, 1990, 2001, 2016, and 2023). Thus, the analysis of the temperature regime and atmospheric precipitation indicates that the contemporary climatic transformation of the study area is driven by a disruption in the balance between water-resource inputs and consumption [69].
4.3.2. Fires
According to the IPCC Sixth Assessment Report, climate change is leading to an increase in the frequency of extreme fire events in many regions of the world [2]. In Northern Kazakhstan, this trend is exacerbated by the high proportion of natural steppe ecosystems, extensive areas of agricultural land, and the close proximity of settlements to natural areas. Despite the similarity of the natural and climatic conditions of the ND and AD, an analysis of the spatial distribution of fires revealed fundamentally different mechanisms underlying fire vulnerability. This indicates that the magnitude of climate risk is determined not only by the frequency of fire occurrence, but also by their spatial pattern, extent, and socioeconomic consequences. The ND is characterized by the repeated occurrence of fires in the same areas of natural ecosystems (Figure 8). According to the results of a long-term spatial analysis conducted by T. Bragina and colleagues using remote sensing data, 1,474 thermal anomalies were recorded within the Naurzum State Nature Reserve during the period 2000–2025, while the total area of burned land amounted to approximately 236.3 thousand ha [70].
Notably, the density of recorded thermal anomalies in agricultural areas adjacent to the reserve was about 3.5 times higher than within the protected area [70]. This indicates that the buffer zone is an active area of interaction where natural and anthropogenic factors jointly shape fire risk. In the AD, however, we observe rare but extremely large-scale fires, such as the catastrophic forest fire of September 2022, which affected approximately 43,000 ha and caused direct economic losses [71]. The findings show two distinct models of fire vulnerability.
The first model is based on the impact of rare but extremely destructive catastrophic fires, resulting in the sudden loss of productive resources. The second model is characterized by the chronic accumulation of damage caused by recurrent fires of varying intensity. It is precisely the distinction between these mechanisms that determines the specific adaptation measures required to enhance the resilience of agricultural systems in the study districts.
4.3.3. Floods
For the ND, a notable example is the extreme flood of 2024, which was preceded by a prolonged period of hydrological drought in 2020–2023. As a result of the flood, sections of the Karamendy-Razdolnoye-Aralkol road were damaged, significantly disrupting the logistical connections of agricultural producers [72]. In this case, the damage manifested itself in infrastructure destruction and restricted access to markets, supplies of material and technical resources, and emergency services. Of particular scientific significance is the fact that the transition from a prolonged drought to a destructive flood occurred over a relatively short period. Such a sequence of extreme events is consistent with the contemporary concept of drought-to-flood transitions, according to which climate change is accompanied by an accelerated alternation between climatic and hydrological extremes. As a result, agricultural systems are forced to adapt simultaneously to both chronic water shortages and short-term hydrological disasters.
The findings obtained are fully consistent with the conclusions of the IPCC Sixth Assessment Report (AR6), which highlights increasing hydroclimatic instability and a growing frequency of so-called compound hydroclimatic extremes-complex extreme events arising from the sequential or simultaneous influence of multiple climatic processes [73]. The rationale for the six indicators is provided in Supplementary Materials (Table S4).
4.4. Land Resources
The calculation of the “Land Resources” component revealed a high level of vulnerability of the agrolandscapes in the study districts, with values of 0.704 for the ND and 0.689 for the AD, indicating pronounced destabilization of the land-use system and reduced resilience of farm holdings (FH). In the study by Baytelieva et al. [12], the land resources component was likewise characterized by a high level of vulnerability (0.632 and 0.620). The higher values obtained in the present study reflect the intensifying combined effects of climatic, anthropogenic, and biotic factors on the agrolandscapes of Northern Kazakhstan, resulting in reduced livestock productivity, deterioration of natural ecosystems and soil water-holding capacity, and a decline in the adaptive capacity of rural communities (Table 3). Recent studies indicate that climate change, land degradation, and increasing anthropogenic pressure negatively affect agricultural systems in arid regions [12,17,42,43,72]. According to state land monitoring data, the area of degraded pastures in Kostanay Region has reached 1,173,133.8 ha, of which 992,727.2 ha are classified as being in a low degree of degradation, 163,638.4 ha as moderately degraded, and 16,768.2 ha as severely degraded [49]. Spatial assessment of pasture productivity, forage-resource availability, and the ecological carrying capacity of the territory for Saiga tatarica is of particular importance in the steppe ecosystems of Kazakhstan, where natural pastures simultaneously serve an economic function as a forage base for livestock production and an ecological function as a resource base for the habitats of wild ungulates [17]. Competition for forage resources is intensifying, resulting in increased local pressure on vegetation cover and contributing to the acceleration of degradation processes [17,32,33,34,35,36,37,42,43,45,56,74,75].
An analysis of pasture-resource availability revealed substantial differences between the study districts. In the AD, a pasture deficit of 52,791 ha was identified, resulting from the high concentration of livestock farms, a high density of farm animals, and intensive land use in areas surrounding settlements. As a result, persistent overgrazing hotspots develop, soil conditions deteriorate, and pasture productivity declines [49,71,75]. In contrast, the ND was found to have a surplus of pastureland amounting to 506,573 ha, which is associated with its larger territorial area and relatively low density of farm animals [49]. However, the spatial concentration of grazing, seasonal use of particular areas, and overlap between pastures and saiga migration routes may result in substantial pressure on vegetation cover even when overall land-resource availability is sufficient [17]. To prevent land degradation, Kazakhstan is implementing a comprehensive set of measures aimed at returning unused agricultural land to state ownership, improving data on the actual number of farm animals, and reallocating pastureland among rural districts [55]. The results of a sociological survey of FH managers confirmed the identified trends and helped clarify the structure of local vulnerability of agrolandscapes. In the AD, shortages of arable land were reported significantly more frequently, whereas farmers in both districts attributed pasture degradation to both climatic factors and anthropogenic causes, primarily overgrazing. The rationale for the four indicators is provided in Supplementary Materials (Table S5).
4.5. Infrastructure
For the “Infrastructure” component, almost opposite values of infrastructure vulnerability of the rural areas are observed in ND (high index value of 0.695) and AD (low index value of 0.068). This substantial contrast indicates significant differences in the development of transport, production, and social infrastructure. The results are comparable with those of Baytelieva et al. [12], in which the infrastructure component was likewise characterized by a high level of vulnerability (0.674 and 0.433). At the same time, the present study proposes an expanded approach to assessing infrastructure vulnerability by integrating transport, production, housing, biogenic, and institutional factors into a unified system for evaluating the adaptive capacity of rural areas. This approach enables a more comprehensive assessment of the impact of infrastructure constraints on the resilience of FHs in the semi-arid zone. The study showed that the AD is characterized by well-developed transport and logistics infrastructure, including the M-36 highway, a railway branch line, and a network of paved access roads. In contrast, the ND is dominated by gravel and unpaved roads, which limits transport accessibility during periods of seasonal thaw and muddy conditions. The travel time required to transport workers, machinery, and material resources in the ND reaches 60-240 minutes, compared with 20–40 minutes in the AD [71]. The results of GPS monitoring confirmed a direct relationship between logistics efficiency and the condition of transport infrastructure [19]. Following precipitation, travel time along field roads in the ND increases several-fold due to severe deformation of the road surface, resulting in higher expenditures on fuel and lubricants, accelerated machinery wear, and increased agricultural production costs [72,76,77]. An important element of infrastructure vulnerability is the living conditions of FH workers. In ND, many workers permanently reside in field containers, and in AD, houses are dominant. The absence of permanent residential facilities increases exposure to extreme temperatures, intensifies the psychophysiological burden on workers, and deteriorates working conditions. An additional factor contributing to infrastructure vulnerability is the impact of saiga. In the ND, the passage of large herds is associated with damage to fences, hydraulic structures, and individual elements of transport infrastructure, resulting in additional economic losses and increasing the risk of road traffic accidents. The need for regular restoration of damaged infrastructure forces FHs to reallocate financial resources from productive development to emergency repair and restoration works. In addition, a substantial part of the ND is located within the buffer zone of the Naurzum State Nature Reserve. The existing environmental protection regime restricts the construction of certain infrastructure facilities and the possibilities for spatial expansion of economic activities [47]. At the same time, ongoing government subsidy programs supporting the construction of protective fencing and the restoration of pastures contribute to reducing infrastructure vulnerability and enhancing the resilience of FHs [76,77]. The rationale for the four indicators is provided in Supplementary Materials (Table S6).
4.6. Socio-Demographic Component
The calculations for the “Socio-Demographic Component” revealed a high level of vulnerability, with index values of 0.494 for the ND and 0.619 for the AD, indicating a substantial influence of demographic processes and the quality of human capital on the resilience of rural areas. In the study by Baytelieva et al. [12], this component was likewise characterized by a high level of vulnerability (0.545 and 0.602).
Analysis of demographic processes over the period 2015–2025 revealed persistent depopulation trends that exceeded the regional average. The study was based on data from the Bureau of National Statistics of the Republic of Kazakhstan and information from local executive authorities of the Kostanay Region [78,79]. In the AD, the population decreased from 43.9 thousand to 40.6 thousand people, while population density stands at 3.69 persons/km². The negative demographic dynamics are attributable to a combination of declining birth rates and sustained net out-migration, which reached 400 people by the end of 2025 [78]. In the ND, the demographic situation is more vulnerable: over the period under consideration, the population decreased by 17%, reaching 10.1 thousand people, while population density declined to only 0.66 persons/km². At the same time, declining birth rates and the continued out-migration of the economically active population are intensifying population ageing and reducing the availability of labour resources for agriculture [78,79].
The results of the sociological survey of managers of farm holdings (FHs) confirmed that the shortage of qualified specialists is one of the main constraints on the adoption of resource-saving technologies, including No-Till, digital land monitoring, and modern approaches to climate-risk management. In addition, low rural population density limits the capacity for continuous monitoring of remote agricultural land, creating conditions for the unimpeded movement of migrating saiga herds onto pastures and cropland, thereby increasing the risk of biogenic damage and complicating the timely protection of agricultural land [78,79,80]. The rationale for the seven indicators is provided in Supplementary Materials (Table S7).
4.7. Finance and Income
The calculations for the “Finance and Income” component revealed a high level of financial vulnerability among the rural areas under study, with index values of 0.534 for the ND and 0.529 for the AD, indicating the limited ability of FHs to accumulate the financial resources required [12,56]. The results are comparable with those of Baytelieva et al. [12], in which the financial component was likewise characterized by a high level of vulnerability (0.738 and 0.677). In West Kazakhstan, Aiesheva et al. [74] suggested that urgent measures are needed to regulate the saiga population, restore degraded land, and introduce rotational grazing. Our assessment suggests that similar saiga-related impacts in Northern Kazakhstan warrant further investigation and mitigation measures.
At the same time, the present study considers financial resilience a key element of Adaptive Capacity, determining the ability of FHs to invest in preventive measures, adopt innovative technologies, and ensure the long-term sustainability of production [12,77,78]. Recent studies suggest that financial resilience directly affects the effectiveness of agricultural adaptation to climate change [81,82]. The results of the sociological survey of FH heads showed that, in 2023–2025, enterprises incurred substantial additional costs associated with the consequences of droughts, pasture degradation, and the impact of migrating saiga populations. The most significant expenditures were associated with restoring livestock numbers, rehabilitating damaged pastures and cropland, and mitigating related production losses. In 2025, expenditures on herd recovery reached 5 million tenge per farm, reflecting a rapid increase in financial pressure and a decline in the capacity of FHs to recover independently following extreme natural events [70]. Many farmers struggle to obtain subsidies and insurance, which results in outdated equipment, limited use of digital technologies, and protection systems. Thus, even moderate climate or wildlife-related factors can seriously threaten their long-term survival. International studies indicate that improving financial inclusion and introducing index-based agricultural insurance mechanisms are effective instruments for enhancing the resilience of FHs to climate risks [83,84,85]. At the same time, programs implemented in the Kostanay Region for concessional lending, interest-rate subsidies, agricultural machinery renewal, digitalization of subsidy-disbursement mechanisms, and support for the agro-industrial sector create additional opportunities to enhance the financial resilience of FHs. However, the effectiveness of these measures depends on the accessibility of financial instruments for small and medium-sized FHs, as well as their level of participation in government support programs [86]. The rationale for the four indicators is provided in Supplementary Materials (Table S8).
4.8. Health
The calculations for the “Health” component indicated a moderately high level of vulnerability in the study areas, with index values of 0.375 for the ND and 0.358 for the AD. The values obtained exceed those reported by Baytelieva et al. [12], where this component was characterized by a lower level of vulnerability (0.262 and 0.195). In this study, we consider the “Health” component as the physical and mental well-being of the agricultural workforce, reflecting how promptly FHs respond to external challenges and stay sustainable. Access to healthcare, sanitary and epidemiological safety, and the psychological resilience of workers directly affect the long-term resilience of rural communities in Northern Kazakhstan. Access to medical care is limited due to the distance to central district hospitals, shortages of medical personnel, and a lack of regular bus service. This problem is particularly pronounced in the ND, where the remoteness of production sites increases patient transportation times in emergency situations. Climate change has a direct impact on the health of FH workers and is associated with increasing rates of cardiovascular diseases, respiratory diseases, and other chronic conditions. The climatic factors, in particular, water scarcity caused by climate change, may be becoming one of the leading determinants of rural population health in arid regions [87,88]. The risk of zoonotic disease transmission is of particular importance in the study areas. Increasing contact between farm animals and wild ungulates, particularly saiga populations, increases the likelihood of pathogen transmission, including brucellosis and other infectious diseases. Recorded outbreaks have resulted in the introduction of quarantine measures, restrictions on the sale of livestock products, and additional economic losses for FHs. This highlights the need to integrate veterinary and sanitary-epidemiological safety into the assessment framework for the resilience of rural areas [60,61,62]. An additional vulnerability factor is the psycho-emotional well-being of FH managers. John et al. [88] show that rising temperatures, altered rainfall, declining groundwater, and recurrent droughts lead to water deficiency, consequently increasing public health issues, including psychological stress and anxiety [88]. The rationale for the seven indicators is provided in Supplementary Materials (Table S9).
4.9. Water Supply and Sanitation
The calculations for the “Water Supply and Sanitation” component revealed a high level of vulnerability in the rural areas under study, with index values of 0.352 for the ND and 0.333 for the AD. The values obtained are comparable with those reported by Baytelieva et al. [12], where this component was also characterized by a high level of vulnerability (0.400 and 0.400). At the same time, the present study takes a broader approach to this component, considering it as an integrated measure of water security that encompasses access to drinking water, the resilience of water-supply systems, workplace sanitation conditions, and the capacity of FHs to withstand climatic, environmental, and biotic stresses.
Although the Water Supply and Sanitation component itself is not the highest-scoring dimension of the Extended LVI, its formal index value understates the pervasiveness of water as a constraint: water availability is embedded within the two dominant components of the index: Natural Resources (see Section 4.1) and Land Resources (see Section 4.4), both of which are fundamentally shaped by surface-water and groundwater conditions in this arid steppe environment. Water security should therefore be understood as a cross-cutting determinant of rural vulnerability rather than one confined to a single component.
The hydrological conditions of the study districts are characterized by high natural variability and limited availability of surface-water resources. In the ND, most watercourses are predominantly snow-fed and exhibit pronounced seasonal variability in runoff, whereas in the AD, increased groundwater mineralization represents an additional limiting factor on usable water supply. Increasing climate aridification, rising evaporative demand, and longer periods of drought contribute to a further reduction in available water resources, increasing the sensitivity of FHs to climate change [69,89,90]. A distinctive feature of the study area is competition for limited water resources among humans, farm animals, and wildlife. During the summer, the concentration of large saiga herds near natural watering points is associated with localized depletion of water sources, degradation of riparian zones, siltation, and organic contamination of water bodies. As a result, conflicts among different resource users intensify, further reducing the resilience of FHs to climate-related stresses [32,33,34,35,36,37]. This water-competition side of the human–wildlife conflict, distinct from direct crop damage, is a less recognized issue for rural water security (Section 4.2).
The analysis revealed that, despite the high level of centralized water supply in settlements, a substantial proportion of FHs continue to rely on private wells and local water-supply systems. This is particularly characteristic of remote FHs in the ND, where the construction, maintenance, and repair of water-intake infrastructure require substantial financial resources and limit opportunities to invest in other adaptation measures. If veterinary and sanitary stations are absent, it increases the risk of infectious disease transmission and deteriorates working conditions. Therefore, water security and sanitation infrastructure should be regarded as important factors in preserving human capital and ensuring the sustainable functioning of agricultural enterprises [42,57,88]. This approach is consistent with current understanding of the role of water security in promoting sustainable development of rural communities and supporting the adaptation of agriculture to climate change [12,38,57,89,90,91,92,93]. The rationale for the three indicators is provided in Supplementary Materials (Table S10).
4.10. Energy Resources
For the “Energy Resources” component, ND showed a moderate level of energy vulnerability (index value 0.320), and AD showed a comparably low level of vulnerability (index value 0.175). The values obtained are comparable to those reported by Baytelieva et al. [12], where the energy component was also characterized by a high level of vulnerability (0.571 and 0.545). At the same time, the present study considers energy resources more broadly, as an integral element of agricultural production resilience that ensures continuity of production activities, technological independence, and the ability of FHs to operate effectively under semi-arid climatic conditions. The most substantial differences between the study districts are associated with the level of development of energy infrastructure. In the ND, the absence of centralized gas supply remains one of the main factors contributing to energy vulnerability. Under the sharply continental climate, FHs are forced to rely on coal and wood fuel, which increases operating costs, raises the labour intensity of agricultural activities, and contributes to additional air pollution. In contrast, the implementation of the regional gasification program in the AD contributes to reducing energy dependence [94]. An important component of energy resilience is the technological autonomy of FHs. The absence of autonomous photovoltaic systems and the limited use of alternative energy sources maintain the dependence of remote field stations and pastures on centralized infrastructure and supplies of conventional energy carriers. Developing small-scale distributed generation (i.e., solar panels, small wind turbines, small generators) improves energy supply, may reduce operating costs, and support FHs during power outages [95]. The availability of mobile energy carriers also plays a significant role in maintaining adaptive capacity. Liquefied petroleum gas (LPG) is used at the remote facilities in the fields where workers stay during the growing season, and diesel fuel is essential for implementation of farm machinery. Under conditions of climate instability and periodic mass migrations of saiga, the ability to deploy agricultural machinery to fields promptly largely determines the prevention of production losses and the preservation of crop yields [94,95]. The rationale for the five indicators is provided in Supplementary Materials (Table S11).
4.11. Livelihood Strategy Component
The calculations for the “Livelihood Strategy” component revealed a relatively low level of vulnerability in the study areas, with index values of 0.241 for the ND and 0.202 for the AD. In the study by Baytelieva et al. [12], this component was characterized by high and moderate levels of vulnerability (0.405 and 0.277, respectively). One of the mechanisms for enhancing the resilience of rural FHs is the diversification of income sources (Table 3). International studies confirm that diversifying livelihood sources substantially reduces the sensitivity of rural households to climate risks and enhances their capacity for long-term adaptation [12,38,67,81]. Additional economic activities, including transport services, freight transportation, agricultural processing, and the development of ecotourism, can substantially expand the adaptive capacity of rural households. The development of ecotourism and rural tourism in buffer zones of protected areas represents a particularly promising avenue [24,44]. The use of natural landscapes and migrating populations of saiga as attractions for ecological tourism can contribute to the development of alternative income sources and create economic incentives for biodiversity conservation. Thus, human-wildlife conflict can potentially be transformed into a model of sustainable livelihoods in which conservation activities become an additional driver of the socio-economic development of rural areas [12,24,38,44,46,67,81]. The rationale for the five indicators is provided in Supplementary Materials (Table S12).
4.12. Social Capital and Mutual Support Networks
For the “Social Capital and Mutual Support Networks” component, the ND shows a relatively low level of vulnerability (0.229), and the AD shows a stable level (0.224). The values obtained are substantially lower than those reported by Baytelieva et al. [12] (0.680 and 0.673), indicating a higher level of social connectedness in the study areas. In the present study, the “Social Capital and Mutual Support Networks” component is considered a characteristic of social capital that reflects agricultural producers’ access to information, government support mechanisms, professional networks, and collective decision-making processes. Well-developed information networks enable FHs to respond more rapidly to natural hazards, use modern risk-management technologies, and interact more effectively with government and research organizations [48]. One of the most important network elements is access to up-to-date data from the Republican State Enterprise Kazhydromet, digital agrometeorological monitoring platforms, and early warning systems. Such access enables FHs to adjust the timing of field operations, reduce the impacts of droughts, and make more informed management decisions. At the same time, the analysis showed that a substantial proportion of FHs continue to rely on traditional approaches to agricultural planning, with insufficient use of modern digital services and forecasting models [48,50,51]. Information on saiga migration is of particular importance for the study areas. The lack of timely information on migration routes and animal concentration areas limits the ability of FHs to organize crop protection measures, reallocate machinery, and implement preventive measures in a timely manner. Therefore, information exchange between conservation organizations and FHs should be regarded as an independent element of the adaptation system for addressing biotic risks [32,33,34,35]. Another limiting factor is the digital divide affecting rural areas. Inadequate mobile and Internet coverage in remote FHs hinders the use of digital platforms, electronic government services, remote advisory services, and digital farming technologies. As a result, FHs lose the ability to obtain timely information for decision-making under rapidly changing climatic and production conditions [42,57,91,95]. Participation of FHs in professional associations, cooperatives, and other forms of collective interaction is another important element of enhancing adaptive capacity. Well-developed horizontal networks facilitate knowledge sharing, the joint use of machinery, coordination of measures to protect agricultural land, dissemination of innovative agricultural technologies, and more effective interaction with government institutions. Thus, social networks constitute an important resource for collective adaptation to climatic, environmental, and biological challenges [38,48,81]. The rationale for the five indicators is provided in Supplementary Materials (Table S13).
4.13. Agriculture and Food Security
The calculations for the “Agriculture and Food Security” component revealed a low level of vulnerability in the study areas, with values of 0.130 for the ND and 0.115 for the AD. The values obtained differ substantially from those reported by Baytelieva et al. [12], where this component was characterized by considerably higher vulnerability (0.756 and 0.694). In the present study, the component is considered as an integrated measure of the ability of FHs to maintain food security under semi-arid climatic conditions. Agriculture is a key element of the regional food system in the study districts. Food security should be understood not only in terms of the volume of agricultural production but also in terms of the ability of FHs to maintain their productive capacity under external stressors [88]. One of the most significant factors affecting the resilience of FHs is the increasing impact of migrating Saiga tatarica populations. Extensive trampling and grazing damage to crops, particularly during the crop emergence stage, result in substantial economic losses and force some FHs to modify their land-use structure. The study shows that in recent years, some FHs have deliberately reduced the areas allocated to the most vulnerable crops, restructured their cropping patterns, and ceased cultivating certain fields as a means of reducing expected production risks. Such changes should be regarded as an adaptation strategy aimed at minimizing losses under intensifying biotic pressures [30,43,81]. Diversification of agricultural production also plays an important role. FHs combining crop production with livestock farming, household-based production, and additional economic activities demonstrate greater resilience to climatic and market fluctuations. By contrast, single-specialization farming increases dependence on the yields of individual crops and heightens the sensitivity of FHs to droughts, biotic impacts, and price instability. Another factor contributing to resilience is the integration of producers into local and regional markets, which provides more stable channels for product sales and access to production resources [30,50,51]. The rationale for the 5 indicators is provided in Supplementary Materials (Table S13).
5. Conclusions
The present study further develops the methodological approach previously applied to assess the climate vulnerability of pastoral communities in Kazakhstan based on the Livelihood Vulnerability Index (LVI) and adapts it to the more complex socio-ecological system of farm holdings in Northern Kazakhstan. An analysis of subsequent citations of Baytelieva et al. [12] indicates that the proposed approach has been further developed in studies addressing climate vulnerability, rural community adaptation, the selection and standardization of indicators, and modifications to the LVI structure. However, existing modifications have predominantly focused on climatic, natural-resource, and socio-economic factors, whereas the effects of the recovery of large wild ungulate populations on agricultural land use, pasture and water resources, and the resilience of farm holdings remain insufficiently integrated into livelihood vulnerability assessments.To address this methodological gap, the present study proposes an expanded LVI (ELVIt) framework comprising 13 interrelated components and 62 indicators, grouped into three key dimensions of vulnerability: Exposure, Sensitivity, and Adaptive Capacity. Unlike traditional versions of the LVI, the proposed framework incorporates indicators of human-wildlife conflict (HWC), thereby enabling the recovery of the saiga population to be considered as a specific regional factor contributing to the socio-ecological vulnerability of agricultural areas.
A comparative assessment of the Naurzum and Auliekol districts of Northern Kazakhstan revealed a more pronounced level of climate exposure in Naurzum District (0.8 compared with 0.7). The sensitivity of the rural areas was comparable, indicating moderate vulnerability (0.3 in both districts), whereas adaptive capacity, associated with a relatively high level of vulnerability, was somewhat higher in Naurzum District (0.6) than in Auliekol District (0.5). The results demonstrate that a relatively high adaptive capacity, in itself, does not eliminate territorial vulnerability when adverse climatic conditions, constraints on the natural resource base, and additional biotic factors act simultaneously. In agricultural steppe landscapes, the recovery of the S. tatarica population may acquire socio-economic significance due to the spatial overlap between animal habitats and migration routes and the croplands, pastures, hayfields, and water resources used by agricultural producers. Therefore, HWC indicators should not be considered in isolation but rather in conjunction with climatic conditions, the state of natural resources, and the adaptive capacity of farm holdings. The study results indicate a high level of vulnerability of rural areas in the semi-arid zone in Naurzum District across the following components: “Natural Resources,” “Human–Wildlife Conflict,” “Climate Change and Natural Disasters,” “Land Resources,” “Socio-Demographic,” “Finance and Income,” “Health,” “Water Supply and Sanitation,” and “Infrastructure.” In this context, the interaction between agricultural production and the recovering S. tatarica population represents an additional regionally specific pathway of vulnerability that should be considered when developing climate adaptation measures and sustainable management approaches for agricultural steppe ecosystems. The proposed ELVIt framework thus shifts vulnerability assessment from a predominantly climate-centred approach towards an integrated assessment of the socio-ecological resilience of rural communities. Its practical value lies in its ability to identify the most vulnerable components of the system and determine adaptation priorities while accounting for territorial differences. For Northern Kazakhstan, this implies the need to coordinate climate adaptation measures in agriculture with the sustainable management of land, pasture, and water resources and scientifically informed management of the recovery of the S. tatarica population. Thus, the present study not only confirms the applicability of the ELVIt for assessing the climate vulnerability of rural areas in Kazakhstan but also expands its analytical capabilities by integrating HWC and factors associated with the recovery of large wild ungulate populations. This approach provides a basis for further developing spatially differentiated adaptation strategies capable of simultaneously supporting the resilience of agricultural production, the livelihoods of rural populations, and the long-term conservation of Saiga tatarica under continuing climate change.
Supplementary Materials
The following supporting information can be downloaded at: Preprints.org, Table S1: Calculation of the Major LVI Components for Naurzum (ND) and Auliyekol (AD) Districts, Kostanay Region; Table S2: “Natural Resources” Component; Table S3: “Human–Wildlife Conflict” Component; Table S4: “Climate Change and Natural Disasters” Component; Table S5: “Land Resources” Component; Table S6: “Infrastructure” Component; Table S7: “Socio-Demographic Profile” Component; Table S8: “Finance and Income” Component; Table S9: “Health” Component; Table S10: “Water Supply and Sanitation” Component; Table S11: “Energy Resources” Component; Table S12: “Livelihood Strategies” Component; Table S13: “Social Networks” Component; Table S14: “Agriculture and Food Security” Component.
Author Contributions
Conceptualization, A.B.; methodology, A.B., A.G. and Z.M.; software, A.B., Z.M., A.G. and N.R.; validation, A.B., Y.T. and A.G.; formal analysis, A.B., T.B., A.G. and A.I.; investigation, A.B., T.B., A.G., A.K., Z.K. and A.I.; resources, Y.T.; data curation, A.B., A.I., and T.B.; writing-original draft, A.B., A.G., A.I., Z.M., T.B., Z.K. and G.Z.; writing-review and editing, A.B., N.B., J.S., A.G., A.I. and Z.M.; visualization, A.B., A.I., A.G., N.B., J.S. and Z.M.; supervision, A.B. and A.G.; project administration, Y.T. and A.B.; funding acquisition, Y.T. and A.G. All authors have read and agreed to the published version of the manuscript.
Funding
This research was funded by the Science Committee of the Ministry of Science and Higher Education of the Republic of Kazakhstan (Grant No. BR23591114). Title of the program-targeted funding: “Development of a System for Sustainable Use of the Betpak-Dala and Ustyurt Saiga Populations”.
Institutional Review Board Statement
This study was approved by the Local Ethics Commission of the Institute of Zoology, Science Committee of the Ministry of Science and Higher Education of the Republic of Kazakhstan (Protocol No. 1, 01/02/2024). Informed consent was obtained from all respondents prior to their participation.
Data Availability Statement
The original contributions presented in this study are included in the article/supplementary material. Further inquiries can be directed to the corresponding authors.
Acknowledgments
The authors would like to express their gratitude to the administration of the Department of Agriculture and Land Relations of Kostanay Region and the administration of the Naurzum State Nature Reserve. We are also grateful to the Archive Department of the Joint Stock Company “National Company “Kazakhstan Temir Zholy” for providing additional information on some of the railway stations and lines, which was missing from other historical and modern sources. During the preparation of this manuscript, the authors used AI tools such as Grammarly and Claude Sonnet 5 for the purposes of language editing, text refinement, and identifying inconsistencies in the manuscript. The authors have reviewed and edited the output and take full responsibility for the content of this publication.
Conflicts of Interest
The authors declare no conflicts of interest.
Abbreviations
The following abbreviations are used in this manuscript:
| AD | Auliyekol District |
| FAO | Food and Agriculture Organization of the United Nations |
| FH | Farm holdings |
| HWC | Human–Wildlife Conflict |
| IPCC | Intergovernmental Panel on Climate Change |
| KoBoToolbox | KoBoToolbox data collection platform |
| LVI | Livelihood Vulnerability Index |
| LVI-IPCC | Livelihood Vulnerability Index based on the IPCC framework |
| MODIS | Moderate Resolution Imaging Spectroradiometer |
| MSHE RK | Ministry of Science and Higher Education of the Republic of Kazakhstan |
| NASA | National Aeronautics and Space Administration |
| ND | Naurzum District |
| RS | Remote Sensing |
| RSE | Republican State Enterprise |
| SDGs | Sustainable Development Goals |
| UN | United Nations |
References
- Orynbaev, Z.B., Mumibov, N.A. Water Security Policy of Kazakhstan. World economy and international relations 2024, 68, 117–124. (In Russian). [CrossRef]
- IPCC. Climate Change 2021: The Physical Science Basis. Contribution of Working Group I to the Sixth Assessment Report of the Intergovernmental Panel on Climate Change; Masson-Delmotte, V., Zhai, P., Pirani, A., Connors, S.L., Péan, C., Berger, S., Caud, N., Chen, Y., Goldfarb, L., Gomis, M.L., et al., Eds.; Cambridge University Press: Cambridge, UK; New York, NY, USA, 2023. [CrossRef]
- Ministry of Ecology and Natural Resources of the Republic of Kazakhstan; RSE “Kazhydromet”; Research Center. Annual Bulletin of Monitoring the State and Climate Change of Kazakhstan: 2023; Kazhydromet: Almaty, Kazakhstan, 2024. Available online: https://kazhydromet.kz (accessed on 23 August 2026). (In Russian).
- Sorg, A.; Bolch, T.; Stoffel, M.; Solomina, O.; Beniston, M. Climate change impacts on glaciers and runoff in Tien Shan (Central Asia). Nat. Clim. Chang. 2012, 2, 725–731. [CrossRef]
- Wichelns, D. Achieving Water and Food Security in 2050: Outlook, Policies, and Investments. Agriculture 2015, 5, 188-220. [CrossRef]
- United Nations. United Nations Framework Convention on Climate Change; UN: New York, NY, USA, 1992.
- United Nations. Paris Agreement; UN: Paris, France, 2015.
- Republic of Kazakhstan. Updated Nationally Determined Contribution of the Republic of Kazakhstan to the global response to climate change. Kazakhstan, 2023. Available online: https://unfccc.int/sites/default/files/NDC/2023-06/12updated NDC KAZ_Gov Decree313_19042023_en_cover page.pdf (accessed on 6 September 2026).
- Government of the Republic of Kazakhstan. Concept for the Development of the Water Resources Management System of the Republic of Kazakhstan for 2024–2030; Resolution No. 66; Government of Kazakhstan: Astana, Kazakhstan, 2024. (In Russian).
- Ministry of National Economy of the Republic of Kazakhstan and Economic Research Institute JSC. Voluntary National Review 2022: In Kazakhstan on the Implementation of the 2030 Agenda for Sustainable Development; Ministry of National Economy of the Republic of Kazakhstan: Astana, Kazakhstan, 2022, 13–188. Available online: https://hlpf.un.org/countries/kazakhstan/voluntary-national-review-2022 (accessed on 23 August 2026).
- Medeu, A.; Askarova, M.; Zhakupova, A.; Bauyrzhan, U.; Klug, H. Sustainable regional development: A challenge between socio-economic development and sustainable environmental management. Sustainability 2025, 17, 6020. [CrossRef]
- Baytelieva, A.; Lee, W.-K.; Wang, S.W.; Iskakova, A.; Ziyayeva, G.; Shilibek, K.; Azatov, N.; Zholamanov, N.; Minarbekov, Z. Assessing the vulnerability of nomadic pastoralists’ livelihoods to climate change in the Zhetysu Region of Kazakhstan. Land 2023, 12, 2038. [CrossRef]
- World Bank Group. Kazakhstan Country Climate and Development Report; World Bank: Washington, DC, USA, 2022.
- Heads of State of Central Asia. Joint Declaration of the Heads of State of Central Asia “Environmental Solidarity of Central Asia”; Regional Ecological Summit: Astana, Kazakhstan, 2026.
- Convention on Migratory Species. The Sustainable Use of Saiga Antelopes: Perspectives and Prospects; UNEP/CMS/Saiga/MOS4/Outcome 2; Secretariat of the Convention on the Conservation of Migratory Species of Wild Animals: Bonn, Germany, 2021.
- Nyhus, P.J. Human-wildlife conflict and coexistence. Annu. Rev. Environ. Resour. 2016, 41, 143–171. [CrossRef]
- Islamgulova, A.; Malakhov, D.; Dimeyeva, L.; Baibulov, A.; Salmukhanbetova, Z.; Osmonali, B.; Permitina, V.; Yerubayeva, G.; Cherednichenko, A.; Iskakov, R. Spatial assessment of rangeland productivity, forage resources, and carrying capacity for Saiga tatarica (L., 1766) in the Korgalzhyn Nature Reserve, Kazakhstan. Land 2026, 15, 1433. [CrossRef]
- Jori, F.; Hernandez-Jover, M.; Magouras, I.; Dürr, S.; Brookes, V.J. Wildlife–livestock interactions in animal production systems: What are the biosecurity and health implications? Animal Frontiers 2021, 11, 8–19. [CrossRef]
- Denwood, T.; Huck, J.J.; Lindley, S. Participatory mapping: A systematic review and open science framework for future research. Ann. Am. Assoc. Geogr. 2022, 112, 2324–2343. [CrossRef]
- CMS. Overview report on saiga conservation status and Saiga Memorandum of Understanding implementation. In Proceedings of the Fifth Meeting of the Signatories to the Memorandum of Understanding Concerning Conservation, Restoration and Sustainable Use of the Saiga Antelope, Astana, Kazakhstan, 12-14 March 2025.
- Milner-Gulland, E.J. An expert mission to Kazakhstan. Saiga News 2023, 29, 34–36.
- Record Saiga Numbers in Kazakhstan and the Need to Regulate the Population. Saiga News 2025, 31, 10.
- Milner-Gulland, E.J.; Hughes, P.; Bykova, E.; Buuveibaatar, B.; Chimeddorj, B.; Karimova, T.; Lushchekina, A.; Salem-gareev, A.; von Meibom, S.; Zuther, S. Sustainable Use of the Saiga Antelope: Review and Perspectives; Preliminary Report for the Convention on the Conservation of Migratory Species of Wild Animals; Convention on Migratory Species: Bonn, Germany, 2020; p. 125.
- Bekenov, A.B.; Grachev, Y.A.; Milner-Gulland, E.J. The ecology and management of the saiga antelope in Kazakhstan. Mammal Rev. 1998, 28, 1–52. [CrossRef]
- Milner-Gulland, E.J.; Kholodova, M.V.; Bekenov, A.; Bukreeva, O.M.; Grachev, Y.A.; Amgalan, L.; Lushchekina, A.A. Dramatic declines in saiga antelope populations. Oryx 2001, 35, 340–345. [CrossRef]
- Ministry of Agriculture of the Republic of Kazakhstan. On the Establishment of a Ban on the Removal of Saiga Antelopes, Except for Scientific Purposes, in the Territory of the Republic of Kazakhstan until 31 December 2020; Order of the Acting Minister of Agriculture of the Republic of Kazakhstan No. 704; Adilet Legal Information System: Astana, Kazakhstan, 10 November 2010. (In Russian).
- Institute of Zoology, Committee of Science, Ministry of Science and Higher Education of the Republic of Kazakhstan. Biological Justification for the Management of Saiga Populations in the Republic of Kazakhstan; Unpublished Scientific and Technical Report; Institute of Zoology: Almaty, Kazakhstan, 2022. (In Russian).
- Association for the Conservation of Biodiversity of Kazakhstan (ACBK). Results of Aerial Survey of Saiga Populations in Kazakhstan in 2024-2025. ACBK Inf. Bull. 2025, 30–31, 12–18. Available online: https://acbk.kz (accessed on 23 August 2026). (In Russian).
- Department of Agriculture and Land Relations of Kostanay Region. Records of Agricultural Land Damage Caused by Saiga Antelopes in the Naurzum and Auliekol Districts; Unpublished Administrative Records; Department of Agriculture and Land Relations of Kostanay Region: Kostanay, Kazakhstan, 2025. (In Russian).
- Bureau of National Statistics of the Agency for Strategic Planning and Reforms of the Republic of Kazakhstan. Availability of Grain and Leguminous Crops in the Republic of Kazakhstan as of 1 August 2026; Bureau of National Statistics: Astana, Kazakhstan, 2026. Available online: https://stat.gov.kz (accessed on 23 August 2026). (In Russian).
- Frolov, I.G.; Grachev, A.A.; Khamchukova, A.; Toishibekov, Y. Reconstructing rapid Saiga population recovery with diagnostic Bayesian integrated population models. Ecologies 2026, 7, 82. [CrossRef]
- Smelyansky, I.E.; Koshkina, A.I.; Tabelinova, A.S. Some aspects of the conflict between humans and saiga in Western Kazakhstan. In Proceedings of the Regional Scientific and Practical Conference “Conflict Between Humans and Wild Animals in Central Asia,” Almaty, Kazakhstan, 5-6 March 2025; p. 25. (In Russian).
- Kazambaeva, A.M. Current problems and approaches to managing saiga populations in Kazakhstan. In Proceedings of the Regional Scientific and Practical Conference “Conflict Between Humans and Wild Animals in Central Asia,” Almaty, Kazakhstan, 5-6 March 2025; p. 39. (In Russian).
- Esengalieva, S.M. Estimation of costs for restoring agricultural production after the negative impact of saiga populations in regions. In Proceedings of the Regional Scientific and Practical Conference “Conflict Between Humans and Wild Animals in Central Asia”; Almaty, Kazakhstan, 5-6 March, 2025; p. 48. (In Russian).
- Muzbay, A.; Dieterich, T.; Michel, S.; Kairanova, A. Balancing biodiversity and livelihoods: Studying human-wildlife conflict in the West Kazakhstan Region with a focus on the Ural saiga population. In Proceedings of the Regional Scientific and Practical Conference “Conflict Between Humans and Wild Animals in Central Asia,” Almaty, Kazakhstan, 5-6 March 2025; p. 68. (In Russian).
- Abaturov, B.D.; Gorbunov, S.S.; Koshkina, A.L. Suitability of steppe pastures for saigas. In Biological Diversity of Asian Steppes: Proceedings of the IV International Scientific Conference; Almaty, Kazakhstan, 2022, 92–97. (In Russian).
- Akhmetov, A.B.; Smagulov, K.M. Spatiotemporal dynamics and current state of the Betpak-Dala saiga (Saiga tatarica L.) population under climate change conditions. Izv. NAN RK Ser. Biol. Med. 2024, 4, 45–58. (In Russian).
- Hahn, M.B.; Riederer, A.M.; Foster, S.O. The livelihood vulnerability index: A pragmatic approach to assessing risks from climate variability and change – A case study in Mozambique. Glob. Environ. Chang. 2009, 19, 74–88. [CrossRef]
- Li, L.; Fu, M.; Zhu, Y.; Kang, H.; Wen, H. The Current Situation and Trend of Land Ecological Security Evaluation from the Perspective of Global Change. Ecol. Indic. 2024, 167, 112608. [CrossRef]
- Islam, M.; Parlak, F. Climate-Migration Policy Landscape in Central Asia: Cases of Kazakhstan and Turkmenistan. In Handbook of Migration, International Relations and Security in Asia; Ullah, A.A., Ed.; Springer: Singapore, 2026; pp. 1–20.
- Sarsekova, D.; Utepov, A.; Perzadayeva, A.; Sagin, J.; Ospangaliyev, A.; Satybaldiyeva, G.; Kyrgyzbay, K. Integrating Shelterbelts with Conservation Tillage (Potapenko-Lukin) to Reduce Household Vulnerability: Project Results from Akmola, Kazakhstan. Sustainability 2025, 17, 11040. [CrossRef]
- Mahdavi, S.K.; Shojapour, D.; Tafazouli, M.; Shahraki, M.; Hosseinimanesh, S.A. Perception of Climate Change and Its Connection to Livestock and Rangeland Conditions: A Study in Semnan Province, Iran. Hum. Ecol. 2025, 53, 1039–1052. [CrossRef]
- Mohamed, A.A.; Chauke, P.K.; Palanisamy, K. Pastoral Communities and Drought: A Scoping Review of Drought Hazards and Management Practices. Hydrol. Sci. J. 2026, 71, 344–355. [CrossRef]
- Safarov, B.; Hu, Y.; Zou, T.; Mahmoud, H.M.E.; Salem, A.E. Bibliometric Analysis of the Research Landscape and Evolutionary Trends of Climate Change Impacts on Ecotourism Destinations: Using VOSviewer & CiteSpace. GeoJournal Tour. Geosites 2026, 65, 1212–1224. [CrossRef]
- Khamzin, K.; Omarova, K.; Smagulov, D.; Orkara, S.; Beken, A.; Kozhayeva, A.; Khamzina, A.; Yesengaliyev, K.; Sharapatov, T. Kazakh Sheep Review: History, Breeds, Genetic Characteristics, Important Hereditary Diseases and Disorders. Pak. Vet. J. 2026, 46, 493–502. [CrossRef]
- Behmanesh, B.; Sharaftmandrad, M.; Shahraki, M.; Badripour, H. Climate Change Adaptation Strategies Adopted by Pastoralists in Rangelands in Golestan Province, Iran. Sci. Rep. 2025, 15, 2496. [CrossRef]
- Government of the Republic of Kazakhstan. On Approval of the List of Specially Protected Natural Areas of Republican Significance; Resolution of the Government of the Republic of Kazakhstan No. 593, 26 September 2017. Available online: https://adilet.zan.kz/rus/docs/ P1700000593 (accessed on 23 August 2026). (In Russian).
- Kazakhstanskaya Pravda. Saigas: Conflict of Interests and Ways to Resolve Them. Kazakhstanskaya Pravda, 2022-2026. Available online: https://kazpravda.kz (accessed on 20 August 2026). (In Russian).
- Bureau of National Statistics of the Agency for Strategic Planning and Reforms of the Republic of Kazakhstan. 18.1.b Distribution of the Land Fund by Land-Use Composition. 18.2 Protected Lands. Available online: https://stat.gov.kz (accessed on 23 August 2026). (In Russian).
- Baisholanov, S.S., Ed. Agro-Climatic Resources of Kostanay Region: Scientific and Applied Reference; RSE Kazhydromet: Astana, Kazakhstan, 2017; pp. 1-139. (In Russian).
- Baisholanov, S.S. Guidelines for Adaptive Management of Agro-Climatic Risks in the Grain Belt of Kazakhstan; KazRI-IAEAC: Almaty, Kazakhstan, 2024; pp. 1-85. (In Russian).
- Bureau of National Statistics of the Agency for Strategic Planning and Reforms of the Republic of Kazakhstan. National Summary Data Page: Economic and Financial Data for Kazakhstan. Available online: https://stat.gov.kz/en/standard/national/ (accessed on 23 August 2026).
- Yskak, A.; Yermoldina, G.T.; Nugmanov, A.B.; Rakhimbayev, B.S.; Suimenbayeva, Z.B.; Fominov, V.D.; Irzhanov, Z.B.; Paramonova, T.A.; Mamikhin, S.V.; Bulaev, A.G. Digital Soil Mapping of the Steppe Zone in Northern Kazakhstan: Predicting Agrochemical Properties of Soils Using Multimodal Satellite Data and Machine and Deep Learning Techniques. Agriculture 2026, 16, 1239. [CrossRef]
- Immunization Coverage Cluster Survey—Reference Manual. World Health Organization Department of Immunization, Vaccines and Biologicals, CH-1211 Geneva 27, Switzerland, WHO Document Production Services, Geneva, Switzerland. 2005. Available online: https://iris.who.int/bitstream/handle/10665/69087/WHO_IVB_04.23.pdf?sequence=1&isAllowed=y (accessed on 30 August 2026).
- Committee for Land Resources Management of the Ministry of Agriculture of the Republic of Kazakhstan; General Prosecutor’s Office of the Republic of Kazakhstan. Information Bulletin; Committee for Land Resources Management: Astana, Kazakhstan, 2026. (In Russian).
- Akimat of Kostanay Region. Official Statistics on Agricultural Development and Land Use; Akimat of Kostanay Region: Kostanay, Kazakhstan, 2026. Available online: https://www.gov.kz/ (accessed on 20 August 2026).
- Sullivan, C.; Meigh, J.R.; Fediw, T.S. Derivation and Testing of the Water Poverty Index Phase 1, Final Report; Department for International Development: London, UK, 2002; pp. 2-39. Available online: https://nora.nerc.ac.uk/id/eprint/503246/.
- Kayastha, R.B.; Lee, W.-K.; Shrestha, N.; Wang, S.W. Assessing the Livelihood Vulnerability of Nomads to Changing Climate in the Third Pole Region of Nepal. Land 2023, 12, 1105. [CrossRef]
- Rai, P.; Bajgai, Y.; Rabgyal, J.; Katwal, T.B.; Delmond, A.R. Empirical Evidence of the Livelihood Vulnerability to Climate Change Impacts: A Case of Potato-Based Mountain Farming Systems in Bhutan. Sustainability 2022, 14, 2339. [CrossRef]
- Committee for Veterinary Control and Supervision of the Ministry of Agriculture of the Republic of Kazakhstan. Information Bulletin of Veterinary Safety of the Kostanay Region; Kostanay, Kazakhstan, 2025. (In Russian).
- World Health Organization. Immunization Coverage Cluster Survey—Reference Manual; World Health Organization, Department of Immunization, Vaccines and Biologicals: Geneva, Switzerland, 2005. Available online: https://iris.who.int/bitstream/handle/10665/69087/WHO_IVB_04.23.pdf?sequence=1&isAllowed=y (accessed on 23 August 2026).
- Department of Sanitary and Epidemiological Control of the Kostanay Region. On the Introduction of Quarantine Restrictions in the Settlements of Dangerbay, Dievka, and Fedoseevka; Official Gazette: Kostanay, Kazakhstan, 2025. (In Russian).
- Aipeisova, S.; Utarbayeva, N.; Kazkeyev, Y.; Bazarbaeva, S.; Darbayeva, T.; Sarsenova, A.; Baubekova, A.; Baytelieva, A. Species Diversity of the Chenopodiaceae Vent. Family in the Flora of the Aktobe Floristic District (Kazakhstan). Pak. J. Bot. 2025, 57, 661–665. [CrossRef]
- Zulfahmi; Rosmaina; Damayanti, R.; Gulnara, A.; Baytelieva, A.; Jaxybayeva, S.; Nazgul, K. Mutagenesis through Gamma Irradiation in Chili (Capsicum annuum L. and Capsicum frutescens L.). SABRAO J. Breed. Genet. 2025, 57, 1938–1949. [CrossRef]
- Ministry of Ecology and Natural Resources of the Republic of Kazakhstan. National Report on the State of the Environment and the Use of Natural Resources of the Republic of Kazakhstan for 2023; Ministry of Ecology and Natural Resources of the Republic of Kazakhstan: Astana, Kazakhstan, 2024; pp. 1–320. (In Russian).
- Koshkina, A.; Smelansky, I.; Tabelinova, A.; Stephens, G.; Jones, S.; Salemgareev, A.; Bowe, M.; Devenish, A. Drivers of human-saiga antelope conflict in semi-arid rangelands of West Kazakhstan. Biol. Conserv. 2026, 313, 111631. [CrossRef]
- Pooley, S.; Bhatia, S.; Vasudevan, A. Rethinking Human-Wildlife Coexistence. Conserv. Biol. 2021, 35, 784–793. [CrossRef]
- Ministry of Ecology and Natural Resources of the Republic of Kazakhstan. Decision on the Regulation of the Saiga Population Dated June 28, 2025; Ministry of Ecology and Natural Resources of the Republic of Kazakhstan: Astana, Kazakhstan, 2025. Available online: https://www.gov.kz/memleket/entities/ecogeo (accessed on 23 August 2026). (In Russian).
- Salnikov, V.; Talanov, Y.; Polyakova, S.; Assylbekova, A.; Kauazov, A.; Bultekov, N.; Musralinova, G.; Kissebayev, D.; Beldeubayev, Y. An Assessment of the Present Trends in Temperature and Precipitation Extremes in Kazakhstan. Climate 2023, 11, 33. [CrossRef]
- Bragina, T.; Kabdulova, G.; Chepashev, D.; Zhusupova, G.; Shinguzhinov, A.; Zhilkibaev, R.; Maximkina, Ye. Analysis of Fire Dynamics in the Naurzum Nature Reserve and Adjacent Areas Using Satellite Data. Bull. L.N. Gumilyov Eurasian Natl. Univ. Chemistry. Geography Ser. 2025, 153 (4): 74–90. (In Russian). [CrossRef]
- Maslikhat of Kostanay Region. Plan for Pasture Management and Use in Auliekol and Naurzum Districts for 2025–2029; Kostanay, Kazakhstan, 2025. (In Russian).
- Akimat of Naurzum District. Comprehensive Report of the Department of Housing and Communal Services, Passenger Transport and Roads; Akimat of Naurzum District: Karamendy, Kazakhstan, 2025. Available online: https://www.gov.kz/ (accessed on 20 August 2026). (In Russian).
- Intergovernmental Panel on Climate Change (IPCC). Climate Change 2022: Impacts, Adaptation and Vulnerability. Contribution of Working Group II to the Sixth Assessment Report of the Intergovernmental Panel on Climate Change; Pörtner, H.-O., Roberts, D.C., Tignor, M., Poloczanska, E.S., Mintenbeck, K., Alegría, A., Craig, M., Langsdorf, S., Löschke, S., Möller, V., et al., Eds.; Cambridge University Press: Cambridge, UK; New York, NY, USA, 2023. [CrossRef]
- Aiesheva, G.; Kazambayeva, A.; Yessengaliyeva, S.; Nursapina, K. Assessment of the Economic Impact of the Saiga Population on Pasture Ecosystems and Agriculture. Earth 2025, 6, 155. [CrossRef]
- Department of Statistics of the Kostanay Region. Acreage of Agricultural Crops in the Kostanay Region for 2025: Statistical Collection; Bureau of National Statistics of the Agency for Strategic Planning and Reforms of the Republic of Kazakhstan (BNS ASPR RK): Kostanay, Kazakhstan, 2025. (In Russian).
- Bizhanova, N.; Grachev, A.; Rametov, N.; Baidavletov, Y.; Saparbayev, S.; Bespalov, M.; Bespalov, S.; Kumayeva, I.; Toishibekov, Y.; Khamchukova, A.; et al. Railway and Road Infrastructure in Saiga Antelope Range in Kazakhstan. Diversity 2025, 17, 431. [CrossRef]
- Khamchukova, A.; Duysebayeva, T.; Gillani, Q.F.; Jamali, M.A.; Kumayeva, I.; Zhazitova, M.; Saparbayev, S.; Bespalov, S.; Bespalov, M.; Grachev, A.; et al. Current States of Bridge Construction Materials for Wildlife Crossings in Linear Infrastructure for Saiga Conservation: A Review. ES Energy Environ. 2025, 30, 1974. [CrossRef]
- Bureau of National Statistics of the Agency for Strategic Planning and Reforms of the Republic of Kazakhstan. Regions of Kazakhstan: Demographic Yearbook 2024–2025; BNS ASPRK: Astana, Kazakhstan, 2025. Available online: https://stat.gov.kz/ (accessed on 28 August 2026).
- Bureau of National Statistics of the Agency for Strategic Planning and Reforms of the Republic of Kazakhstan. Socio-Economic Development of Kostanay Region (2015–2025); Department of Statistics of Kostanay Region: Kostanay, Kazakhstan, 2025.
- Nursapina, K.; Kazambaeva, A.; Aiesheva, G.; Yessengaliyeva, S. Economic Assessment of Wild Animal Impacts on Agriculture and Damage Reduction Measures. Eurasian Research Journal 2025, 7, 409–422.
- Deressa, T.T.; Hassan, R.M.; Ringler, C.; Alemu, T.; Yesuf, M. Determinants of Farmers’ Choice of Adaptation Methods to Climate Change in the Nile Basin of Ethiopia. Glob. Environ. Chang. 2009, 19, 248–255. [CrossRef]
- Şengül Abedı, Z. Coping or adapting? The counterintuitive role of financial access in agricultural resilience under climate stress: Evidence from Türkiye. Front. Sustain. Food Syst. 2026, 10, 1787061. [CrossRef]
- Greatrex, H.; Hansen, J.W.; Garvin, S.; Diro, R.; Blakeley, S.; Le Guen, M.; Rao, K.N.; Osgood, D.E. Scaling Up Index Insurance for Smallholder Farmers: Recent Progress and Future Prospects; CCAFS Report No. 14; CGIAR Research Program on Climate Change, Agriculture and Food Security (CCAFS): Copenhagen, Denmark, 2015.
- Daron, J.D.; Stainforth, D.A. Assessing Pricing Assumptions for Weather Index Insurance in a Changing Climate. Clim. Risk Manag. 2014, 1, 76–91. [CrossRef]
- Han, X.; Liu, J.; Liao, Z.; Guan, S. How inclusive agricultural insurance sustain rural livelihood resilience under climate risk in China? Front. Sustain. Food Syst. 2026, 10, 1749797. [CrossRef]
- Ministry of Agriculture of the Republic of Kazakhstan (MinAgri RK). On Approval of the Rules for Subsidizing the Reimbursement of Part of Expenses Incurred by Subjects of the Agro-Industrial Complex during Investment Investments; Order No. 317, 23 July 2018, with amendments for 2024–2025. Adilet Legal Information System. Available online: https://adilet.zan.kz/ (accessed on 20 August 2026). (In Russian).
- Bureau of National Statistics of the Agency for Strategic Planning and Reforms of the Republic of Kazakhstan (BNS ASPR RK). Statistical Bulletins on Public Health Status and Morbidity Rates in the Kostanay Region (2020–2025); BNS ASPR RK: Astana, Kazakhstan, 2025. Available online: https://stat.gov.kz (accessed on 20 August 2026). (In Russian).
- John, C.K.; Pu, J.H. Climate-Driven Water Scarcity and Its Public Health Implications: A Multi-Regional Assessment Across Vulnerable Socio-Ecological Systems. Water 2026, 18, 699. [CrossRef]
- Government of the Republic of Kazakhstan. Concept for the Development of the Water Resources Management System of the Republic of Kazakhstan for 2024–2030; Resolution No. 66; Government of Kazakhstan: Astana, Kazakhstan, 2024. (In Russian).
- Adamov, A.; Kusainov, K.; Yesbergen, R. Water Supply in Agricultural Sector of Kazakhstan: Focus on Optimization. Probl. AgriMarket 2024, 3, 130–141. [CrossRef]
- Kalmakhanova, M.S.; Kutebayeva, A.A.; Tleuova, Z.T.; Satybaldiev, B.; Orynbayev, S.A.; Malakar, A.; Gomes, H.T.; Snow, D.D. Environmental Impact of Wastewater on Surface and Groundwater in Central Asia. Sustainability 2025, 17, 5370. [CrossRef]
- Nhemachena, C.; Nhamo, L.; Matchaya, G.; Nhemachena, C.R.; Muchara, B.; Karuaihe, S.T.; Mpandeli, S. Climate Change Impacts on Water and Agriculture Sectors in Southern Africa: Threats and Opportunities for Sustainable Development. Water 2020, 12, 2673. [CrossRef]
- Yin, W.; Yang, X.; Liu, W. Sustainable Management and Regulation of Agricultural Water Resources in the Context of Global Climate Change. Sustainability 2025, 17, 2760. [CrossRef]
- Bureau of National Statistics of the Agency for Strategic Planning and Reforms of the Republic of Kazakhstan (BNS ASPR RK). Prices for Fuel and Energy Resources in the Republic of Kazakhstan: Statistical Bulletin; BNS ASPR RK: Astana, Kazakhstan, 2024. Available online: https://stat.gov.kz (accessed on 20 August 2026). (In Russian).
- Uteulina, G.A.; Karatayev, M. Energy Security and Renewable Energy Potential in the Agricultural Sector of Kazakhstan. Energy Transit. Reg. Dev. 2022, 14, 112–128. (In Russian).
Figure 1.
The Naurzum State Nature Reserve is located within the Naurzum and Auliekol districts of the Kostanay Region, Northern Kazakhstan.
Figure 1.
The Naurzum State Nature Reserve is located within the Naurzum and Auliekol districts of the Kostanay Region, Northern Kazakhstan.
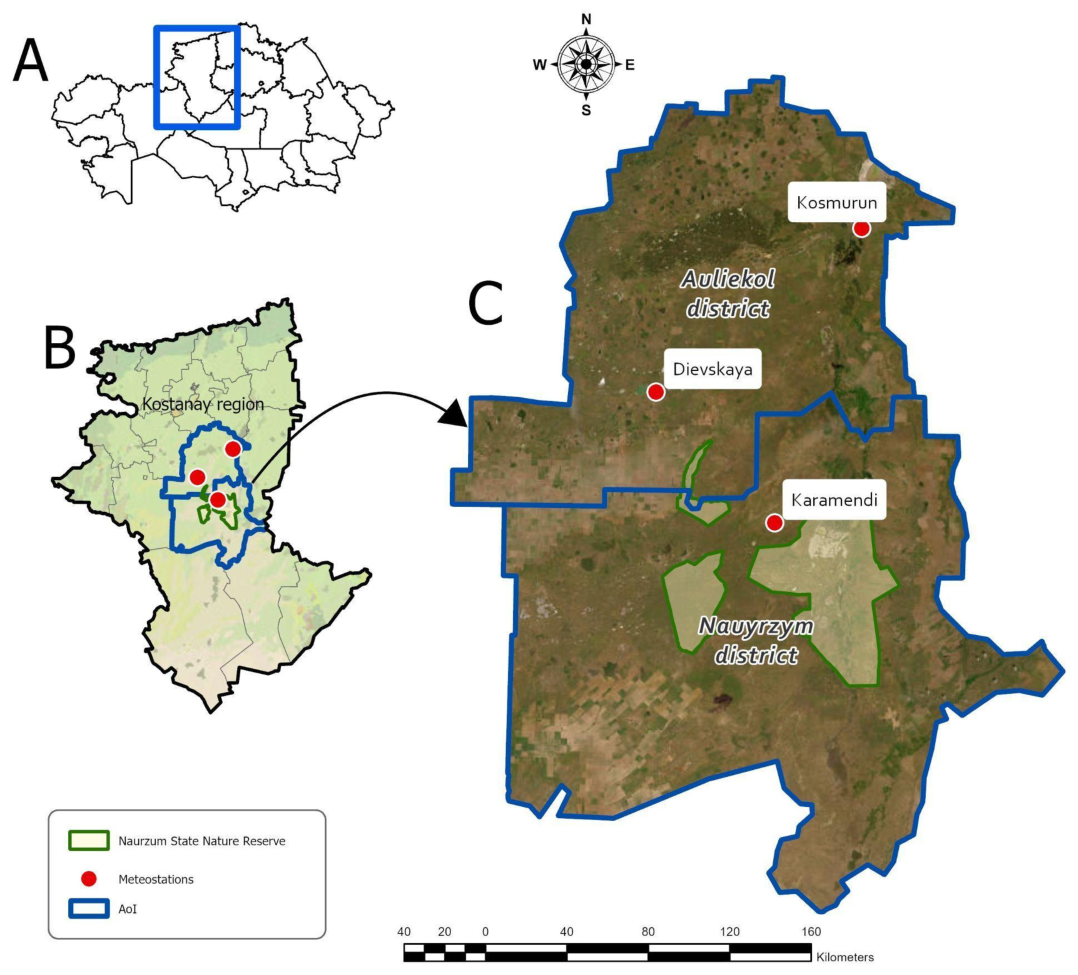
Figure 2.
Spider chart showing the comparative significance of the 13 ELVIt components for the Naurzum and Auliyekol districts of Kostanay Region (scale from 0 to 1).
Figure 2.
Spider chart showing the comparative significance of the 13 ELVIt components for the Naurzum and Auliyekol districts of Kostanay Region (scale from 0 to 1).
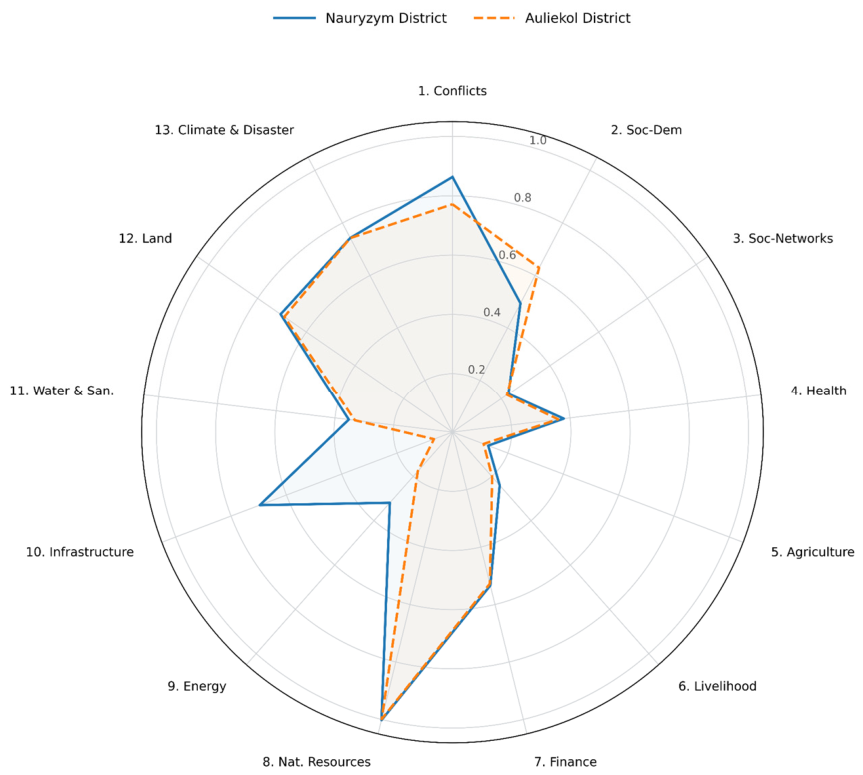
Figure 3.
Spatial distribution of hydrology, saiga seasonal ranges, linear infrastructure, and farm holdings in the Naurzum and Auliyekol districts, Kostanay Region, Kazakhstan.
Figure 3.
Spatial distribution of hydrology, saiga seasonal ranges, linear infrastructure, and farm holdings in the Naurzum and Auliyekol districts, Kostanay Region, Kazakhstan.
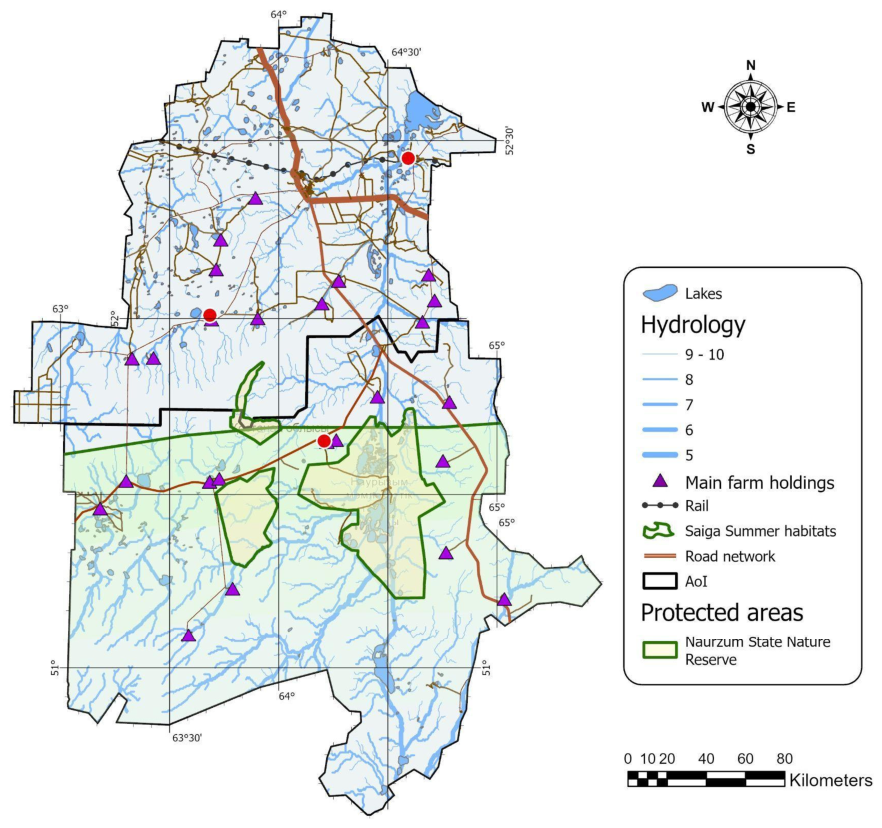
Figure 4.
Vulnerability triangle, illustrating the relationship among the factors of “Exposure,” “Adaptive Capacity” and “Sensitivity” for Naurzum and Auliyekol Districts of Kostanay Region.
Figure 4.
Vulnerability triangle, illustrating the relationship among the factors of “Exposure,” “Adaptive Capacity” and “Sensitivity” for Naurzum and Auliyekol Districts of Kostanay Region.
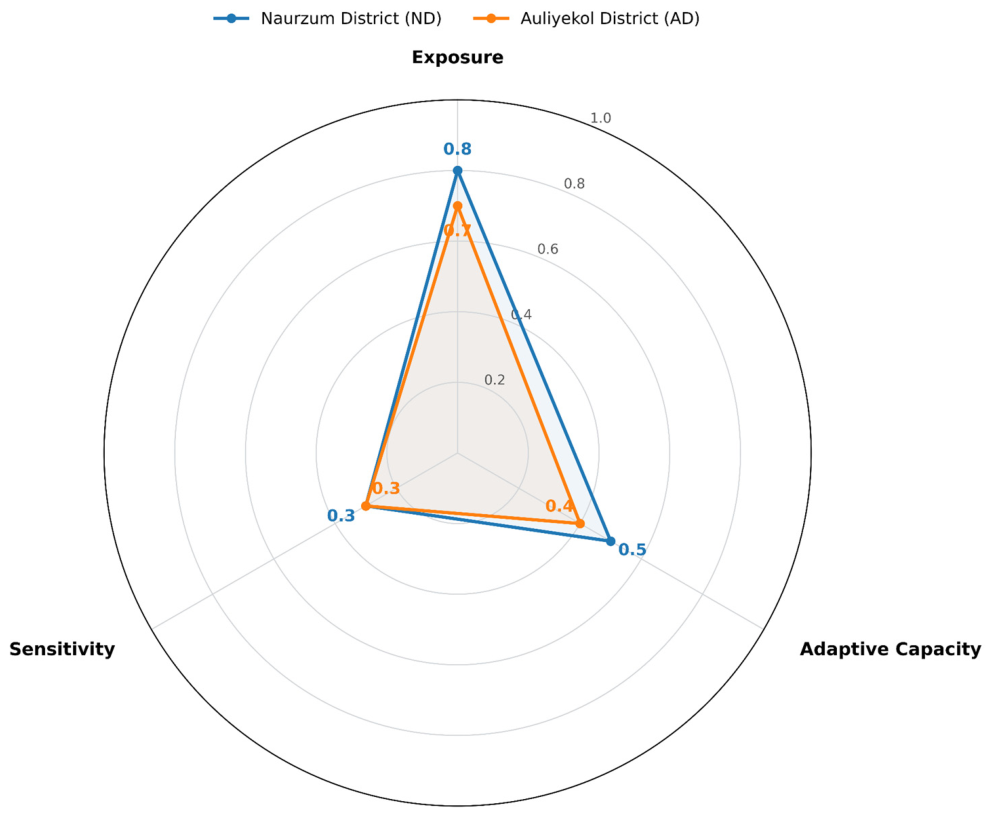
Figure 5.
Saiga Population Dynamics in Kazakhstan, 1974-2025: (a) Total saiga population in the Republic of Kazakhstan; (b) The size of the Betpak-Dala population.
Figure 5.
Saiga Population Dynamics in Kazakhstan, 1974-2025: (a) Total saiga population in the Republic of Kazakhstan; (b) The size of the Betpak-Dala population.
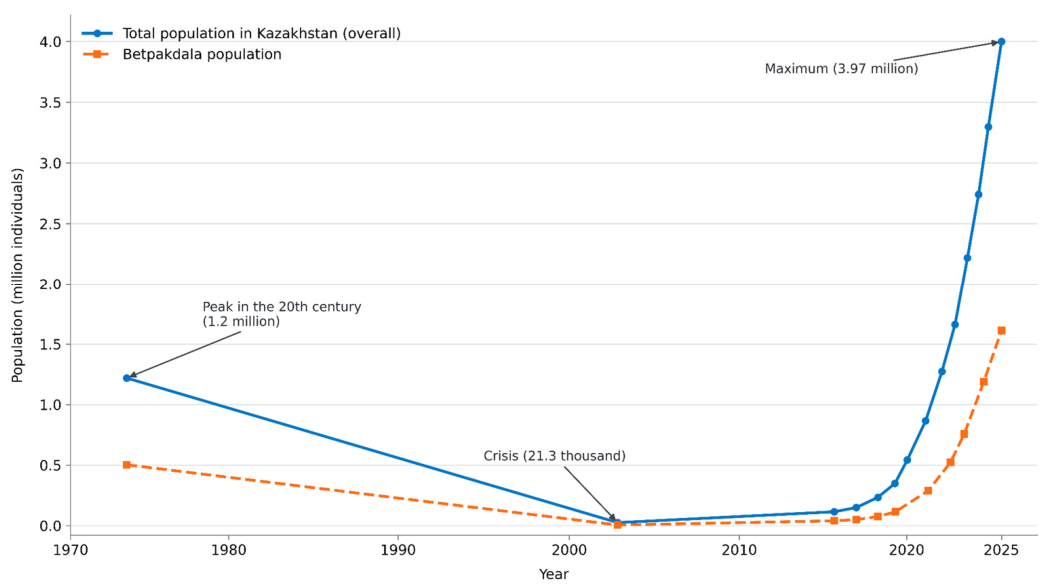
Figure 6.
Time series of annual air temperature anomalies (°C) averaged over the Naurzum and Auliekol districts (Kostanay region) relative to the 1961–1990 baseline period. Bars represent annual anomalies, with positive values shown in red and negative values in blue. The black line indicates the linear trend (y = 0.0296x − 0.4583), while the blue line represents the smoothed curve calculated using a 10-year moving average. The coefficient of determination is R² = 0.2378.
Figure 6.
Time series of annual air temperature anomalies (°C) averaged over the Naurzum and Auliekol districts (Kostanay region) relative to the 1961–1990 baseline period. Bars represent annual anomalies, with positive values shown in red and negative values in blue. The black line indicates the linear trend (y = 0.0296x − 0.4583), while the blue line represents the smoothed curve calculated using a 10-year moving average. The coefficient of determination is R² = 0.2378.
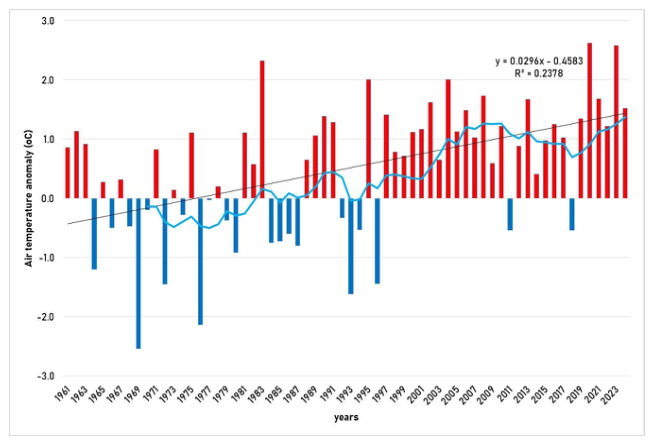
Figure 7.
Time series of annual precipitation anomalies (%) averaged over the Naurzum and Auliekol districts (Kostanay region) relative to the 1961–1990 baseline period. Bars represent annual anomaly values, with positive anomalies shown in green and negative anomalies in yellow. The black line indicates the linear trend (y = 0.1646x − 3.8639), while the red smoothed curve is calculated using a 10-year moving average. The coefficient of determination is R² = 0.0218.
Figure 7.
Time series of annual precipitation anomalies (%) averaged over the Naurzum and Auliekol districts (Kostanay region) relative to the 1961–1990 baseline period. Bars represent annual anomaly values, with positive anomalies shown in green and negative anomalies in yellow. The black line indicates the linear trend (y = 0.1646x − 3.8639), while the red smoothed curve is calculated using a 10-year moving average. The coefficient of determination is R² = 0.0218.
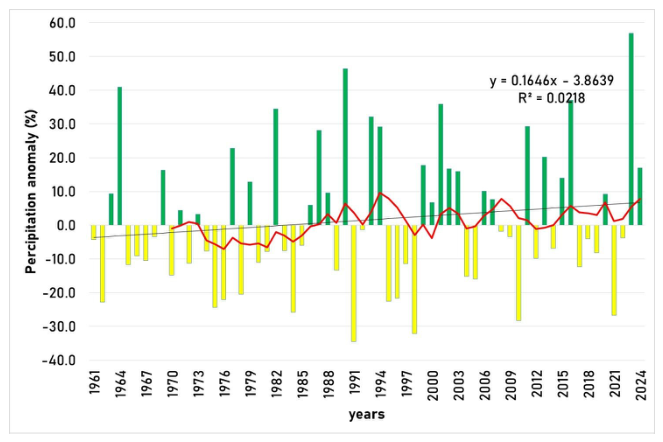
Figure 8.
Spatial distribution of burned areas and recurring fire hotspots within the Naurzum State Nature Reserve and adjacent areas during the period 2000–2025 .
Figure 8.
Spatial distribution of burned areas and recurring fire hotspots within the Naurzum State Nature Reserve and adjacent areas during the period 2000–2025 .
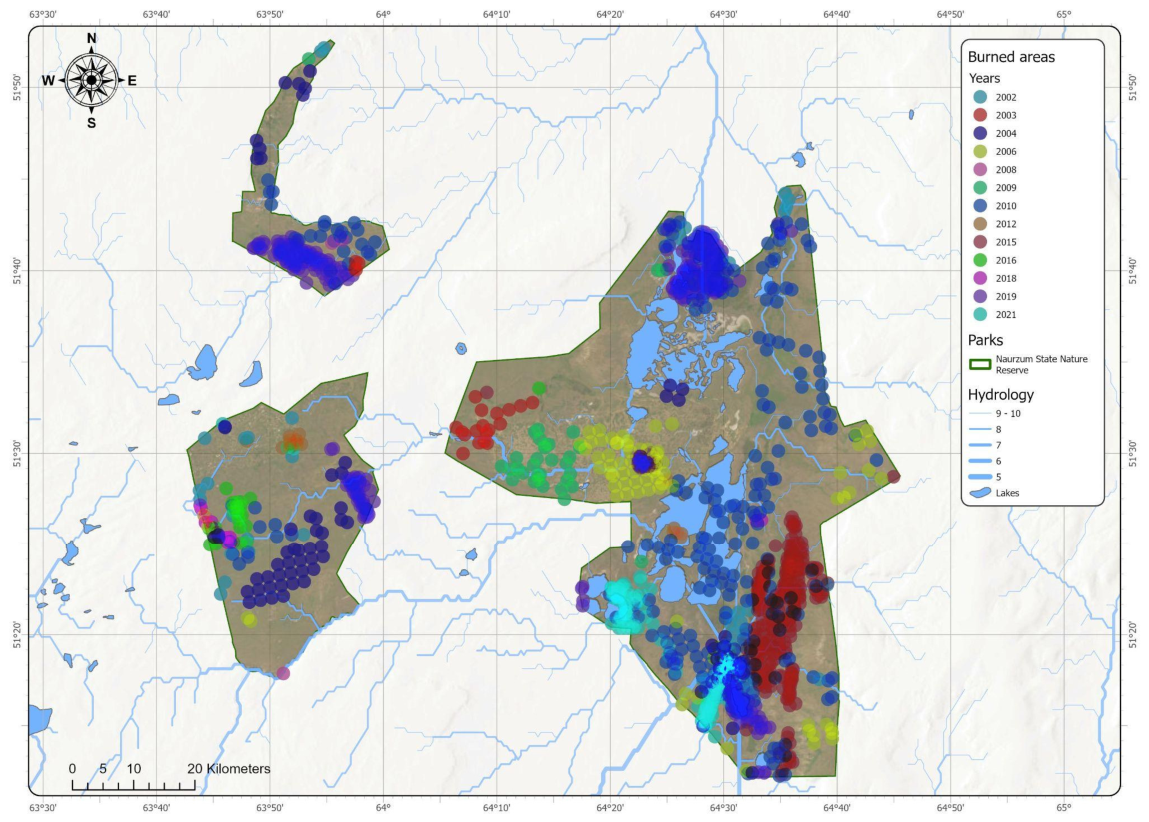

Table 1.
Structure of the Extended LVI: Distribution of Components and Indicators According to the IPCC Methodology.
Table 1.
Structure of the Extended LVI: Distribution of Components and Indicators According to the IPCC Methodology.
| Vulnerability Dimension (IPCC) | Thematic Components (13) |
| Exposure | Climate Change and Natural Disasters Human-Wildlife Conflict (HWC) |
| Sensitivity | Agriculture and Food Security Health Water Supply and Sanitation |
| Adaptive Capacity | Natural Resources Land Resources Finance and Income Socio-demographic Profile Social Capital and Mutual Support Networks Livelihood Strategies Energy Resources Infrastructure |
Table 2.
Mapping of the Key Components of the ELVIt to the UN Sustainable Development Goals.
| No. | Major ELVIt Component | No. of Indicators | UN SDG Targets (SDG Mapping) | Rationale for Inclusion in the Index |
| 1 | Human-Wildlife Conflict (HWC) | 6 | 15.5, 15.7, 2.4 | Assessment of direct damage to agrocenoses caused by Saiga tatarica and measures for biodiversity conservation |
| 2 | Socio-Demographic Profile | 7 | 4.3, 4.4, 5.5 | Education and gender balance as factors of adaptive capacity |
| 3 | Social Capital and Mutual Support Networks | 5 | 16.6, 16.7, 17.17 | Participation in mutual support networks and access to institutional support |
| 4 | Health | 7 | 3.4, 3.8, 3.9 | Assessment of psychological burden and physical health risks |
| 5 | Agriculture and Food Security | 5 | 2.1, 2.3, 2.4 | Production diversification and resilience to crop losses |
| 6 | Livelihood Strategies | 5 | 8.2, 8.9, 1.5 | Availability of non-farm income and alternative forms of employment |
| 7 | Finance and Income | 4 | 1.1, 1.4, 9.3 | Economic resilience and access to support measures |
| 8 | Energy | 5 | 7.1, 7.2, 9.1 | Energy provision and technological capacity of farm holdings |
| 9 | Infrastructure | 4 | 9.1, 11.a | Logistics and access to agricultural product markets |
| 10 | Water Supply and Sanitation | 3 | 6.1, 6.2, 6.4, 6.5 | Access to safe water and the level of competition for water resources |
| 11 | Natural Resources | 1 | 12.2, 15.3, 15.1, 15.5 | Assessment of the intensity of soil and pasture ecosystem degradation |
| 12 | Land Resources | 4 | 2.4, 12.2, 2.3, 15.3 | Identification of shortages and availability of high-quality land resources |
| 13 | Climate Change and Natural Disasters | 6 | 1.5, 11.5, 13.1, 13.2 | Frequency of droughts and temperature anomalies, and vulnerability to wildfires |
| Total (n = 13) | 62 | 15 SDGs | Comprehensive socio-ecological screening of the study areas | |
Table 3.
Indexed Major ELVIt Components, Subcomponents (Indicators), and Composite ELVIt for the Naurzum and Auliyekol Districts of Kostanay Region, Kazakhstan.
Table 3.
Indexed Major ELVIt Components, Subcomponents (Indicators), and Composite ELVIt for the Naurzum and Auliyekol Districts of Kostanay Region, Kazakhstan.
| No | Major ELVIt Component | Profile Subcomponents (Indicators) | Unit of Measurement | Naurzum District (ND) | Auliyekol District (AD) |
| 1 | Human-Wildlife Conflict (HWC) | 1.FHs reporting a high density of saiga | Number | 17 | 11 |
| 2. FHs reporting crop damage caused by saiga | % | 62.29 | 39.54 | ||
| 3. FHs reporting cases of saiga removal by government agencies | % | 100 | 100 | ||
| 4. FHs that have not received government compensation for crop damage | % | 100 | 100 | ||
| 5. FHs that have received subsidies for the installation of mesh fencing | % | 100 | 100 | ||
| 6. FHs reporting reduced sleep quality due to the need for nighttime field guarding | % | 100 | 100 | ||
| Total for the HWC component: | index | 0.862 | 0.770 | ||
| 2 | Socio-Demographic Profile | 1. Demographic dependency ratio (DDR) | % | 0.724 | 0.693 |
| 2. FH heads without basic secondary education | % | 0 | 0 | ||
| 3. FH heads without specialized secondary education | % | 56.21 | 62.37 | ||
| 4. FH heads without higher education | % | 64.29 | 59.18 | ||
| 5. Share of FHs headed by women | % | 12.43 | 18.51 | ||
| 6. Mean age of FH heads | years | 57.34 | 51.29 | ||
| 7. Mean age of female FH heads | years | 49.15 | 45.73 | ||
| Total for the demographic component: | index | 0.494 | 0.629 | ||
| 3 | Social Capital and Mutual Support Networks | 1. FHs without access to information on climate and natural disasters | % | 0 | 0 |
| 2. FHs not receiving timely information on saiga | % | 100 | 100 | ||
| 3. FHs not using mobile internet | % | 0 | 0 | ||
| 4. FHs not receiving government support | % | 14.59 | 11.83 | ||
| 5. FHs not belonging to social groups | % | 0 | 0 | ||
| Total for the social networks component: | index | 0.229 | 0.224 | ||
| 4 | Health | 1. Mean travel time to the nearest medical center | Min | 32.67 | 29.72 |
| 2. FHs reporting respiratory diseases | % | 45.02 | 43.76 | ||
| 3. FHs reporting cardiovascular diseases | % | 24.63 | 29.76 | ||
| 4. FHs reporting genitourinary diseases | % | 12.23 | 11.03 | ||
| 5. FHs reporting occupational injuries | % | 8.65 | 6.03 | ||
| 6. FHs reporting pronounced psycho-emotional stress | % | 100 | 100 | ||
| 7. Share of FHs perceiving saiga as a carrier of zoonotic diseases | % | 1.0 | 1.2 | ||
| Total for the “Health” component: | index | 0.375 | 0.358 | ||
| 5 | Agriculture and Food Security | 1. FHs not dependent on strict crop sowing schedules | % | 0 | 0 |
| 2. FHs not engaged in horticulture and vegetable gardening | % | 65.03 | 57.35 | ||
| 3. FHs showing signs of food insufficiency | % | 0 | 0 | ||
| 4. FHs oriented exclusively toward exports | % | 0 | 0 | ||
| 5. FHs without diversification (crop production + livestock) | % |
0 | 0 | ||
| Total for the agricultural component: | index | 0.130 | 0.115 | ||
| 6 | Livelihood Strategies | 1. FHs that practice employment outside the local community | % | 57.45 | 64.35 |
| 2. FHs with pronounced monocultural specialization | % | 0 | 0 | ||
| 3. FHs with family members permanently employed in government service | % | 0 | 0 | ||
| 4. FH members employed in transport and logistics | % | 45.12 | 36.71 | ||
| 5. FHs participating in ecotourism programs | % | 17.83 | 0 | ||
| Total for “Livelihood Strategies”: | index | 0.241 | 0.202 | ||
| 7 | Finance and Income | 1. FHs with debts to financial institutions/individuals | % | 100 | 100 |
| 2. FHs with stable access to subsidies/loans | % | 13.41 | 11.54 | ||
| 3. FHs with incomes below the subsistence minimum (2020– 2025) | % | 0 | 0 | ||
| 4. The level of accessibility of comprehensive agricultural insurance | % | 100 | 100 | ||
| Total for the “Finance” component: | index | 0.534 | 0.529 | ||
| 8 | Natural Resources | 1. FH dependence on local natural resources | % | 100 | 100 |
| Total for the “Natural Resources” component: | index | 1.000 | 1.000 | ||
| 9 | Energy Resources | 1. FHs not using solid fuel | % | 0 | 0 |
| 2. FHs not using alternative solar panels | % | 60.00 | 82.00 | ||
| 3. FHs not using liquefied petroleum gas | % | 0 | 0 | ||
| 4. FHs without access to centralized gas supply | % | 100 | 5.47 | ||
| 5. FHs experiencing shortages in diesel fuel availability | % | 0 | 0 | ||
| Total for the “Energy” component: | index | 0.320 | 0.175 | ||
| 10 | Infrastructure | 1. Mean travel time between field camps and the village | Min | 150.62 | 40.76 |
| 2. FHs not residing in permanent field camp housing | % | 91.46 | 9.73 | ||
| 3. FHs with documented infrastructure damage | % | 7.62 | 5.37 | ||
| 4. FHs residing in temporary trailers and containers | % | 100 | 11.64 | ||
| Total for the “Infrastructure” component: | index | 0.695 | 0.068 | ||
| 11 | Water Supply and Sanitation | 1. FHs without access to clean drinking water | % | 5.65 | 0 |
| 2. FHs reporting local conflicts over livestock watering | % | 100 | 100 | ||
| 3. FHs without access to standard sanitation facilities | % | 0 | 0 | ||
| Total for the “Water” component: | index | 0.352 | 0.333 | ||
| 12 | Land Resources | 1. FHs reporting insufficient arable land | % | 0 | 0 |
| 2. FHs reporting pasture degradation due to climatic factors | % | 100 | 100 | ||
| 3. FHs reporting pasture degradation due to anthropogenic pressure | % | 81.62 | 75.43 | ||
| 4. FHs reporting pasture degradation caused by saiga | % | 100 | 100 | ||
| Total for the “Land” component: | index | 0.704 | 0.689 | ||
| 13 | Climate Change and Natural Disasters | 1. FHs affected by drought (over the past 5 years) | % | 100 | 100 |
| 2. FHs affected by wildfires (over the past 5 years) | % | 100 | 100 | ||
| 3. FHs affected by flooding events (over the past 5 years) | % | 100 | 100 | ||
| 4. FHs receiving compensation for climate-induced damage | % | 100 | 100 | ||
| 5. Standard deviation of maximum temperature (monthly) | °C | 14.7 | 14.7 | ||
| 6. Standard deviation of precipitation (monthly) | mm | 7.87 | 7.87 | ||
| Total for the “Climate Risk” component: | index | 0.741 | 0.741 | ||
| LVI | Composite Vulnerability Index ELVIt | Weighted mean (13 components) | index | 0.485 | 0.431 |
Table 4.
Values of the Aggregated Contributing Factors of ELVIt-IPCC Vulnerability for Naurzum and Auliyekol Districts of Kostanay Region.
Table 4.
Values of the Aggregated Contributing Factors of ELVIt-IPCC Vulnerability for Naurzum and Auliyekol Districts of Kostanay Region.
| Contributing Vulnerability Factors (IPCC) | Naurzum District (ND) | Auliyekol District (AD) |
| Exposure | 0.8 | 0.7 |
| Adaptive Capacity | 0.5 | 0.4 |
| Sensitivity | 0.3 | 0.3 |
| Final Composite LVI-IPCC | 0.4 | 0.3 |
Disclaimer/Publisher’s Note: The statements, opinions and data contained in all publications are solely those of the individual author(s) and contributor(s) and not of MDPI and/or the editor(s). MDPI and/or the editor(s) disclaim responsibility for any injury to people or property resulting from any ideas, methods, instructions or products referred to in the content. |
© 2026 by the authors. Licensee MDPI, Basel, Switzerland. This article is an open access article distributed under the terms and conditions of the Creative Commons Attribution (CC BY) license (http://creativecommons.org/licenses/by/4.0/).
Copyright: This open access article is published under a Creative Commons CC BY 4.0 license, which permit the free download, distribution, and reuse, provided that the author and preprint are cited in any reuse.