

Submitted:
29 September 2026
Posted:
30 September 2026
You are already at the latest version
Abstract
Running events can contribute to destination development, but participation in a running event does not by itself establish tourism status. This study examines the relationships among motivation, destination image, satisfaction, and loyalty toward running tourism in Bali and then links the behavioral results to strategic development priorities. The quantitative analysis used 280 adult running-event participants. The survey documented participants' reported region of origin but, as currently reported, did not establish usual environment, overnight stay, or primary trip purpose; the empirical findings are therefore interpreted at the participant level rather than as estimates for a strictly defined tourist population. Partial least squares structural equation modelling (PLS-SEM) showed that destination image strongly influenced satisfaction (β = 0.745, p < 0.001), satisfaction influenced loyalty (β = 0.600, p < 0.001), and motivation directly influenced loyalty (β = 0.301, p < 0.001) but did not significantly influence satisfaction (β = 0.113, p = 0.095). Satisfaction mediated the destination image-loyalty relationship but not the motivation-loyalty relationship. Importance-performance map analysis (IPMA), the analytic hierarchy process (AHP), and focus group discussion (FGD) were used as a strategic translation layer to identify development priorities. Because the Fornell-Larcker assessment indicates potential overlap among several constructs, the structural and mediation results should be interpreted cautiously until HTMT, item-loading, and collinearity diagnostics are confirmed. Sustainability and collaborative governance are treated as strategic interpretation and recommendation domains rather than as latent outcomes tested in the PLS-SEM model.
Keywords:
running events
; sport tourism
; destination image
; motivation
; satisfaction
; loyalty
; Bali
; PLS-SEM
; IPMA
; AHP
; focus group discussion
1. Introduction
Sport tourism encompasses travel associated with active participation in sport, attendance at sport events, and related tourism experiences, and the field has increasingly expanded beyond mega-events toward participation and small-scale events (Gibson & Fairley, 2022; Higham, 2021). Sport events can generate economic and social effects for destinations and host communities, although the scale and distribution of these effects depend on event type and local conditions (González-García et al., 2022; Pedauga et al., 2022). Running events are a prominent form of active sport tourism because they combine physical participation with destination consumption and can be staged through existing urban or natural environments (Gkarane et al., 2025; Zheng et al., 2023). Research on small-scale sport events further shows that destination image, satisfaction, and future behavioural intentions are closely connected, making running events relevant both as tourism products and as destination-management instruments (Vegara-Ferri et al., 2020).
Bali provides a distinctive setting for this analysis because tourism development is closely intertwined with cultural heritage, local communities, destination governance, and sustainability challenges (Mananda, Negara, et al., 2025). Bali-based event-tourism evidence also shows that social-media engagement, perceived destination image, visitor satisfaction, and behavioural intention can interact in sustainable event development (Mananda, Ariwangsa, & Antara, 2025). In the specific context of running tourism, the present study therefore treats route safety, traffic management, event coordination, public facilities, information, community participation, and environmental management as destination-level issues rather than as operational concerns of a single race. Comparable research on small-scale running events emphasizes organizer coordination, sustainability practices, and local value creation (Gkarane et al., 2025). The claims in this contextual description are supported by Bali-specific tourism and event-tourism studies cited sentence by sentence; the subsequent list of route safety, traffic, facilities, information, participation, and environmental issues identifies the present study’s analytical context rather than facts attributed to those sources.
Research on active sport tourism identifies motivation as multidimensional, combining sport-related drivers such as competition, skill mastery, fitness, and social interaction with tourism-related motives such as travel exploration and destination attributes (Hungenberg et al., 2016). In running-event settings, destination image and satisfaction are especially important because participants evaluate both the event and the place in which it occurs. Evidence from a half-marathon study showed that destination image positively influenced satisfaction and that satisfaction predicted future intentions (Vegara-Ferri et al., 2020). Marathon research similarly reports that destination image, event image, and satisfaction are associated with intention to revisit the destination (Zouni et al., 2021). These findings support examining motivation, destination image, satisfaction, and loyalty together while keeping their conceptual roles distinct.
Although these relationships are established, three gaps remain relevant to running tourism. First, sport-tourism studies often examine event impacts, destination image, or behavioural intentions separately, whereas running tourists experience the event and destination simultaneously through routes, services, local landscapes, and host-community interactions (Gkarane et al., 2025; Vegara-Ferri et al., 2020). Second, motivation can shape active sport-tourist behaviour and conative loyalty, but it should not be assumed to produce satisfaction automatically; satisfaction is an evaluation of the experienced event and destination (Hungenberg et al., 2016; Vegara-Ferri et al., 2020). Third, sustainable sport-tourism research increasingly emphasizes translating behavioural evidence into actionable priorities, stakeholder coordination, and destination-level planning (Morfoulaki et al., 2023; Yang et al., 2020). To address these gaps, this study combines PLS-SEM and IPMA with AHP and FGD so that behavioural relationships can be interpreted alongside strategic priorities identified by stakeholders.
The empirical scope of this article is deliberately defined around four latent constructs: motivation, destination image, satisfaction, and loyalty toward running tourism in Bali. Experience quality is not estimated as a separate latent construct; experience-related evaluations are represented within the destination-image and satisfaction measures. Likewise, sustainability and collaborative governance are not modeled as endogenous PLS-SEM outcomes. Instead, they form a downstream strategic interpretation layer informed by IPMA, AHP, and FGD results. Accordingly, the study has five objectives: (1) test the effects of motivation and destination image on satisfaction; (2) test the direct effects of motivation, destination image, and satisfaction on loyalty; (3) assess the mediating role of satisfaction; (4) identify managerial improvement priorities through IPMA; and (5) translate the behavioral findings into strategic development priorities through AHP and FGD. This narrower specification aligns the title, objectives, empirical model, and claimed contribution with the variables that were actually examined. The article reports research developed within I Gede Adiratma’s doctoral research in the Doctoral Program in Tourism, Faculty of Tourism, Udayana University. The attached dissertation document is titled “Model Pengembangan Pariwisata Olahraga Lari di Provinsi Bali” and is dated 2025; its front matter identifies it as a dissertation/research proposal document. The article is presented as a stand-alone manuscript and does not represent the dissertation as a separately published work.
Methodologically, the study follows a sequential analytical logic: PLS-SEM evaluates the behavioral relationships, IPMA identifies constructs with high importance but comparatively lower performance, AHP ranks strategic development priorities, and FGD is used to interpret and contextualize those priorities. The final governance framework is therefore a conceptual synthesis derived from the empirical and stakeholder phases; it should not be read as a separate causal model that was statistically tested. This applied orientation is consistent with sport-tourism research that emphasizes integrated planning, sustainability assessment, and stakeholder coordination (Chersulich Tomino et al., 2020; Morfoulaki et al., 2023; Yang et al., 2020).
2. Literature Review and Hypotheses Development
2.1. Running Tourism Within Sport Tourism
Sport tourism includes travel in which sport is a primary or meaningful component of the tourism experience (Gibson & Fairley, 2022; Higham, 2021). Running tourism falls within active sport tourism because participants travel in order to run or compete while also consuming destination services and experiences. Sport events can produce economic and social effects through visitor spending, participation, and interactions with host communities (González-García et al., 2022; Pedauga et al., 2022). Small-scale running events also create destination-management demands involving organizer coordination, sustainability, and local value creation (Gkarane et al., 2025).
For a destination such as Bali, the strategic value of running tourism lies in linking physical activity with landscapes, culture, hospitality, and local enterprise. However, sustainable sport tourism requires attention to environmental, social, economic, and institutional conditions rather than growth alone (Morfoulaki et al., 2023; Yang et al., 2020). Research on sport-event impacts further shows that host-community perceptions and support are important components of sustainable development (González-García et al., 2022; Parra-Camacho et al., 2023). Accordingly, route planning, safety, stakeholder coordination, community participation, and environmental management are treated in this study as core destination-development considerations. In this manuscript, well-being is used when referring broadly to individual or collective quality of life; the narrower term wellness is avoided unless a source or empirical item explicitly concerns wellness-oriented products or services.
2.2. Tourist Motivation and Satisfaction
Motivation explains why active sport tourists choose to travel and participate. Hungenberg et al. (2016) identify sport-related motives such as competitive desire, skill mastery, physical fitness, social needs, and self-enrichment alongside tourism-related motives such as travel exploration and destination attributes. This multidimensional view is appropriate for running tourism because participation may simultaneously reflect personal challenge, health and fitness, social interaction, competition, and interest in the destination. Motivation is therefore conceptualized here as a driver of participation rather than as an outcome of the destination experience.
Motivation may contribute to post-event evaluations, but the relationship with satisfaction should be tested rather than assumed. In active sport tourism, motivational profiles are linked to behavioural intentions (Hungenberg et al., 2016), whereas satisfaction is more directly associated with evaluations of event and destination experiences. In a half-marathon context, Vegara-Ferri et al. (2020) found that destination image was positively related to satisfaction and that satisfaction predicted future intentions. On this basis, the study tests whether motivation is positively associated with satisfaction in Bali running tourism.
H1. Participant motivation positively influences satisfaction with the running-event/destination experience.
2.3. Destination Image, Satisfaction and Loyalty
Destination image refers to tourists’ cognitive and affective perceptions of a place and, in sport-tourism contexts, can incorporate scenery, amenities, accessibility, sustainability, local community, and the broader destination experience. Research on alpine sport destinations links scenery, amenities, local community, and sustainability to destination attractiveness and attachment (Hofmann et al., 2025). In sport-event tourism, destination image is also empirically connected to satisfaction and future behavioural intentions (Vegara-Ferri et al., 2020; Zouni et al., 2021). These studies support treating destination image as a distinct antecedent of participants’ evaluations of the running-tourism experience.
Destination image is therefore expected to influence satisfaction because participants evaluate whether the destination experience confirms or exceeds their prior perceptions. Vegara-Ferri et al. (2020) found a positive relationship between destination image and satisfaction among half-marathon sport tourists, while Zouni et al. (2021) reported that destination and event evaluations were associated with satisfaction and revisit intention in marathon tourism. Satisfaction, in turn, is expected to influence loyalty because satisfied sport tourists show stronger future intentions to return and recommend the event or destination (Vegara-Ferri et al., 2020). These findings provide the basis for H2 and H3.
H2. Destination image positively influences satisfaction in running sport tourism.
H3. Satisfaction positively influences loyalty intentions toward running tourism in Bali.
2.4. Mediating Role of Satisfaction
Satisfaction captures participants’ post-consumption evaluation of the event and destination experience. In sport-event research, it can function as a mechanism through which destination-related perceptions are translated into future intentions. Vegara-Ferri et al. (2020) found that satisfaction mediated the relationship between destination image and future intentions in a half-marathon setting, while Zouni et al. (2021) showed that satisfaction was associated with intention to revisit in marathon tourism. Motivation is conceptually different: it precedes participation and can influence behavioural intentions directly, as shown in active sport-tourism research (Hungenberg et al., 2016). The present study therefore tests two distinct mediation propositions rather than assuming that both antecedents operate through satisfaction in the same way.
H4. Satisfaction mediates the relationship between participant motivation and loyalty intentions.
H5. Satisfaction mediates the relationship between destination image and loyalty.
2.5. Direct Effects on Loyalty and Conceptual Scope
The estimated structural model also includes direct paths from motivation and destination image to loyalty. These paths require explicit theoretical justification because they are interpreted in the results. Active sport-tourism research indicates that motivational profiles can be associated with conative loyalty and future participation (Hungenberg et al., 2016), while sport-event studies show that destination image is related to revisit and recommendation intentions (Vegara-Ferri et al., 2020; Zouni et al., 2021). In this study, loyalty refers to future intentions toward running tourism in Bali generally - including revisit/participation, recommendation, and positive word of mouth - rather than loyalty to one named race event.
H6. Motivation positively influences loyalty toward running tourism in Bali.
H7. Destination image positively influences loyalty toward running tourism in Bali.
Evidence on active sport tourists supports a multidimensional motivation structure rather than treating motivation as a single generic construct. Hungenberg et al. (2016) show that competitive desire, fitness, social needs, self-enrichment, travel exploration, and destination attributes can distinguish active sport-tourist segments and help explain conative loyalty. This distinction is important for running tourism because runners may travel for the sport itself, the destination, or a combination of both. Table 1 consolidates the seven hypotheses derived from the preceding literature and provides a concise map from the theoretical arguments to the tested structural paths.
Evidence is stronger and more direct for the destination image-satisfaction-behaviour pathway. Among half-marathon tourists, destination image was positively related to satisfaction, and satisfaction predicted future intentions (Vegara-Ferri et al., 2020). In marathon tourism, destination and event evaluations were also related to satisfaction and revisit intention (Zouni et al., 2021). Wang and Butkouskaya (2023) further show in a sports-tourism setting that event image and perceived value can mediate the effects of sustainable marketing activities on behavioural intentions. Bali-specific event-tourism research likewise links social-media engagement with perceived destination image, visitor satisfaction, and behavioural intention (Mananda, Ariwangsa, & Antara, 2025).
Taken together, these studies justify treating satisfaction as a proximal antecedent of loyalty rather than describing it as an unqualified universal ‘most important’ factor. In the present study, loyalty is reflected in intentions to revisit, recommend, communicate positively about Bali running tourism, and support future participation. This operationalization is consistent with sport-event studies that use revisit, recommendation, and related future-intention measures as behavioural outcomes (Vegara-Ferri et al., 2020; Wang & Butkouskaya, 2023; Zouni et al., 2021).
The motivation-satisfaction pathway is less straightforward. Motivation describes why the participant travels and competes, whereas satisfaction evaluates what the participant actually experiences. Hungenberg et al. (2016) show that motivation can explain conative loyalty in active sport tourism without establishing that satisfaction must mediate this effect. By contrast, event and destination evaluations have a clearer empirical connection to satisfaction and future intentions (Vegara-Ferri et al., 2020; Zouni et al., 2021). This distinction provides a theoretical reason to test, rather than assume, H1 and the motivation-satisfaction-loyalty mediation proposed in H4.
Bali also requires a destination-governance perspective because running events intersect with transport, public space, visitor services, local businesses, communities, and sustainability objectives. Research on small-scale running events emphasizes organizer responsibilities for advancing sustainable sport tourism (Gkarane et al., 2025), while marathon research demonstrates that event development can be connected with city image, tourism resources, infrastructure, and urban growth strategies (Zheng et al., 2023). More broadly, sustainable sport-tourism frameworks emphasize institutional support, stakeholder coordination, and balanced economic, environmental, and socio-cultural criteria (Morfoulaki et al., 2023; Yang et al., 2020). These considerations motivate the AHP and FGD components used to translate the behavioural model into destination-development priorities.
3. Materials and Methods
3.1. Research Design and Study Context
This study used a mixed-method design. The quantitative component tested the structural relationships among motivation, destination image, satisfaction and loyalty using PLS-SEM. IPMA was then used to identify constructs and indicators that are important for loyalty but require managerial improvement. The strategic component used AHP to rank development priorities, while FGD was used to interpret the quantitative results and refine the running tourism development model. The design therefore combines behavioural explanation, managerial prioritization, expert judgement, and stakeholder interpretation within one analytical sequence. PLS-SEM reporting follows Hair et al. (2019), IPMA follows Ringle and Sarstedt (2016), and AHP consistency assessment follows Saaty (2008); these methodological sources are used here rather than substantive running-tourism studies.
The research context was running sport tourism in Bali, Indonesia. The study focuses on the interaction between event participation and destination conditions, including route safety, traffic management, cleanliness, public facilities, information systems, community involvement, and integration with tourism services. These destination conditions were subsequently examined through participant responses, expert assessment, and stakeholder discussion.
3.2. Sample, Recruitment and Data Collection
A purposive sampling technique was employed to recruit adults with direct experience participating in organized running events in Bali. The empirical unit of analysis is therefore the individual running-event participant. Participants were selected because they could evaluate their motivation, perceptions of Bali as a destination, satisfaction with the running-event/destination experience, and loyalty intentions toward running tourism in Bali. The term participant is used for the empirical sample because event participation alone does not establish that an individual meets a formal tourism definition.
The inclusion criteria required respondents to (1) be at least 18 years of age, (2) have participated in at least one organized running event in Bali, and (3) complete the questionnaire independently. The exclusion criteria included spectators who did not participate in the running event, organizing committee members, volunteers involved in event management, and questionnaires with incomplete or inconsistent responses. Reported region of origin was collected, but the manuscript as currently documented does not record usual environment, overnight stay, travel distance, or whether the event was the primary purpose of the trip. Consequently, Bali origin cannot automatically be equated with non-tourist status, and origin outside Bali cannot automatically be equated with tourist status. The study therefore avoids using tourism status as an inclusion criterion and interprets its estimates as participant-level relationships.
The available research files record respondents’ region of origin (Bali 45.0%, Java 35.36%, Sumatra 8.93%, Sulawesi 6.07%, Kalimantan 3.21%, and NTB 1.43%) but do not document usual residence, travel distance, overnight stay, or primary trip purpose. A tourist/non-tourist sensitivity analysis therefore cannot be conducted from the supplied data. Consistent with this limitation, all inferential results are interpreted at the running-event participant level rather than as estimates for a strictly defined tourist population.
Respondent recruitment was conducted on site during selected organized running events in Bali. Prior to field data collection, surveyors received training regarding the research objectives, participant screening, ethical considerations, and questionnaire administration. Eligible participants were approached after completing the event, informed about the study, and invited to participate voluntarily. The questionnaire required approximately 15 minutes to complete, and respondents received a small souvenir after completion as a token of appreciation.
Fieldwork was conducted in Bali during the 2024-2025 research period. The dissertation materials identify Bali Marathon/Maybank Bali Marathon and Sanur KulineRun among the running-event context considered in the study, but the supplied research files do not provide an auditable event-by-event list of survey venues and exact fieldwork dates. To avoid unsupported reconstruction, the manuscript therefore reports the verified geographic and temporal scope only; the final submission should add exact event names, venues, and dates from the original fieldwork log if available.
A total of 320 questionnaires were distributed to eligible participants during selected running tourism events in Bali. Of these, 280 valid questionnaires were retained after data screening, yielding an effective response rate of 87.5%. The excluded questionnaires consisted of incomplete responses or those that did not satisfy the inclusion criteria. The final dataset of 280 valid responses was subsequently analysed using Partial Least Squares Structural Equation Modelling (PLS-SEM), Importance-Performance Map Analysis (IPMA), Analytic Hierarchy Process (AHP), and Focus Group Discussion (FGD).
The survey involved 280 adult running-event participants in Bali. Respondents reported origins including Bali, Java, Sumatra, Sulawesi, Kalimantan, and West Nusa Tenggara; 45.0% reported Bali as their origin. The sample was dominated by male respondents (79.6%) and participants aged 36-45 years (44.3%). Social media was the main reported source of event information (73.6%). Because the survey did not, as currently documented, distinguish usual environment, overnight stay, or primary trip purpose, these origin categories are descriptive and should not be interpreted as a definitive tourist/non-tourist classification. Table 2 reports the respondent profile and should be read as a descriptive account of the participant sample rather than as a tourist/non-tourist classification.
3.3. Measures
The questionnaire measured four latent constructs: motivation, destination image, satisfaction, and loyalty. Motivation captured personal interest, enjoyment, self-development, challenge, recognition, and sport-related travel motives. Destination image captured perceptions of natural scenery, cleanliness, accessibility, transport availability, cultural uniqueness, facility quality, safety, and overall destination attractiveness. Satisfaction captured evaluations of facilities, services, cleanliness, sport activities, and the overall running-event/destination experience. Loyalty referred specifically to running tourism in Bali and captured revisit or future-participation intention, recommendation intention, positive word of mouth, and willingness to support future running-tourism activities. Experience quality was not estimated as a separate latent construct; experience-related evaluations were represented within the destination-image and satisfaction measures. The construct definitions are consistent with active sport-tourism motivation research (Hungenberg et al., 2016) and sport-event studies examining destination image, satisfaction, and future intentions (Vegara-Ferri et al., 2020; Zouni et al., 2021).
The survey instrument used a five-category agreement response format, reported in the dataset as Strongly Disagree, Disagree, Neutral, Agree, and Strongly Agree. The dissertation provides the item wording and source/adaptation framework for the four constructs. Motivation comprised 22 items covering intrinsic and extrinsic motives; destination image comprised 12 items covering scenery/environment, accessibility, attractions/activities, facilities/infrastructure, safety/comfort, and local culture; satisfaction comprised 11 items covering facilities, services, activities, value for money, accessibility, information, safety/security, and cleanliness; and loyalty comprised 11 items covering revisit/participation intention, recommendation and positive word of mouth, social-media advocacy, emotional attachment, preference, confidence in experience quality, and interaction with local residents. The instrument was pretested: the dissertation reports an item-validity assessment using Pearson product-moment correlation with r-table = 0.361 at alpha = 0.05 and a reliability assessment on a 30-person pilot sample. All reported item correlations exceeded the stated criterion and construct Cronbach’s alpha values were above 0.70. The supplied files do not document a translation/back-translation procedure, so no such procedure is claimed here. The complete wording and instrument-source mapping should be supplied as Supplementary Table S1 from the dissertation questionnaire/materials.
3.4. Data Analysis
The quantitative data were analysed using PLS-SEM in SmartPLS (Ringle et al., 2022). PLS-SEM was selected because the study combines explanation of multiple latent-variable relationships with prediction-oriented and managerial-priority analysis through IPMA; reporting follows established PLS-SEM recommendations (Hair et al., 2019). The reflective measurement model was evaluated using indicator loadings, Cronbach’s alpha, composite reliability, average variance extracted (AVE), the Fornell-Larcker criterion, and the heterotrait-monotrait ratio (HTMT) of correlations (Fornell & Larcker, 1981; Henseler et al., 2015). Collinearity should be assessed using variance inflation factors (VIF). The structural model was evaluated using path coefficients, bootstrapped confidence intervals, t statistics, p values, effect sizes (f2), R2, and collinearity diagnostics. Blindfolding Q2 is interpreted only as in-sample predictive relevance; claims of out-of-sample predictive performance require a procedure such as PLSpredict (Shmueli et al., 2019). Because all focal constructs were measured using the same questionnaire at the same time, potential common method bias must also be considered and reported using appropriate procedural and/or statistical diagnostics (Podsakoff et al., 2003). IPMA was used to identify constructs with high importance but comparatively lower performance (Ringle & Sarstedt, 2016).
The supplied analysis files document variance-based SEM-PLS estimation in SmartPLS, hypothesis testing at alpha = 0.05 using bootstrapped t statistics/p values, and the reported outer-loading, reliability, AVE, Fornell-Larcker, R2, Q2, path, mediation, and IPMA outputs. The available outer-loading output ranges from 0.361 to 0.951: destination-image indicators = 0.747-0.909; satisfaction = 0.863-0.951; loyalty = 0.792-0.932; and motivation = 0.361-0.897. All reported loading p values are < 0.001. The source dissertation refers to SmartPLS 3.0, whereas the manuscript draft cited SmartPLS 4; the software version should therefore be reconciled against the original project file before submission. The supplied materials do not report the bootstrap subsample count, one-/two-tailed setting, confidence-interval method, missing-data treatment, standardization settings, HTMT ratios/confidence intervals, VIF values, or f2 values; these settings and diagnostics cannot be reconstructed reliably and should not be invented. The dissertation also explicitly notes that common-method bias cannot be fully eliminated, but it does not provide a separate statistical common-method-bias diagnostic. No statistical common-method-bias diagnostic can be calculated from the supplied summary outputs alone. The revision therefore does not invent Harman, marker-variable, or full-collinearity results. A final re-analysis should report a justified diagnostic from the respondent-level data and describe procedural remedies actually used during questionnaire administration.
3.5. AHP, Focus Group Procedures and Method Integration
The AHP phase involved 12 purposively selected experts representing the Bali Provincial Tourism Office, the Bali Provincial Youth and Sports Office, PASI Bali, KONI Bali, running-event organizers, tourism academics, and leaders of local running communities. The experts had between 8 and 20 years of professional experience in tourism planning, sport-event management, destination development, or community leadership. The AHP hierarchy consisted of an overall goal - prioritizing development actions for Bali running tourism - and the ten development-priority criteria reported in Table 11. Experts made pairwise comparisons using the standard AHP procedure, and consistency was evaluated using the consistency ratio; the aggregated judgment produced a consistency ratio of 0.04, below the conventional 0.10 threshold (Saaty, 2008).
The AHP output yields ten normalized priority weights that sum to approximately 1.00 and an inconsistency/consistency ratio of 0.04, below the 0.10 threshold. The attached spreadsheet independently reproduces the same ten weights used in Table 11: safety assurance (0.209), destination/event security (0.180), accessibility (0.118), information and communication (0.117), public facilities (0.091), cleanliness (0.075), competitive packages (0.066), value for money (0.064), supporting transport (0.045), and recreational activities (0.036). However, the supplied dissertation, AHP report, and spreadsheet contain the final weights rather than the individual expert pairwise-comparison matrices. They also do not state whether individual judgments were aggregated by geometric mean or another rule, or how missing/inconsistent individual judgments were handled. Accordingly, these procedural details and the underlying matrices cannot be reported without the original AHP response file and should be added as Supplementary Table S2 only when that source file is available.
The FGD phase was used to interpret the quantitative and AHP results, assess the practical meaning of the identified priorities, and refine the final strategic framework. The manuscript should report enough procedural detail to make this qualitative phase auditable.
The supplied FGD record contains nine named contributors representing a running community (Indorunners Bali), media (Nusa Bali), the Bali Provincial Youth and Sports Office, PASI Bali (including its daily chair), a doctoral tourism academic, an event/industry representative (Medi Group), the banking/event sector (Maybank), and the Bali Provincial Tourism Office. The qualitative material was synthesized using thematic coding, producing seven themes: safety/regulation/monitoring; infrastructure/route/mobility; event calendar/information; local culture/Balinese experience; MSMEs/local economy; environment/carrying capacity; and youth segmentation. The source notes show stakeholder statements were consolidated into core inputs and development implications. The supplied files do not record the FGD date, venue, duration, moderator protocol, audio-recording status, transcription procedure, number of coders, or member-checking/validation procedure. These details therefore remain unreported rather than being inferred.
Method integration was sequential. PLS-SEM first tested the behavioral relationships among motivation, destination image, satisfaction, and loyalty. IPMA then used the PLS-SEM results to identify the constructs requiring managerial attention. AHP ranked concrete development actions, and the FGD interpreted and contextualized those priorities in relation to implementation, stakeholder roles, and governance. The final framework synthesizes these phases; sustainability and collaborative governance are therefore strategic interpretation domains rather than statistically estimated latent outcomes. The analytical sequence is therefore methodologically anchored in the PLS-SEM/IPMA and AHP procedures cited above, whereas the substantive sport-tourism literature is used to interpret, rather than justify, the mechanics of those methods.
4. Results
4.1. Descriptive Findings
The descriptive results show that respondents generally had high motivation, positive destination image perceptions, high satisfaction and strong loyalty. Motivation items related to liking physical activity, personal enjoyment, self-achievement and self-improvement had high mean scores. Destination image was also evaluated positively, especially natural scenery, cultural uniqueness and destination attractiveness. However, transport availability, cleanliness and public facilities received relatively lower evaluations, suggesting areas that require improvement. Loyalty was high in terms of revisit intention, positive word of mouth and willingness to share positive experiences through social media.
4.2. Measurement Model
The reported measurement model shows high internal-consistency coefficients and AVE values above 0.50, but these statistics are not sufficient to establish measurement validity. Cronbach’s alpha ranges from 0.946 to 0.980, composite reliability from 0.952 to 0.982, and AVE from 0.512 to 0.831. The satisfaction and loyalty coefficients approaching 0.98 raise a plausible redundancy concern, while the motivation block contains heterogeneous content and several weak indicators. Accordingly, the present manuscript retains the original estimates for transparency but does not treat the measurement model as fully validated. Table 3 summarizes reliability and convergent-validity statistics; Table 4 identifies the loading problem; and Table 5 shows that discriminant validity remains unresolved.
The Fornell-Larcker criterion is not fully satisfied and should not be presented as confirming discriminant validity. Specifically, the square root of AVE for loyalty (0.879) is lower than the satisfaction-loyalty correlation (0.906). The square root of AVE for motivation (0.716) is also lower than the motivation-destination image correlation (0.738) and the motivation-loyalty correlation (0.793). These results indicate potentially important construct overlap, particularly among motivation, satisfaction, and loyalty. Consequently, discriminant validity cannot be considered established on the basis of Table 5 alone (Fornell & Larcker, 1981; Henseler et al., 2015).
The complete loading output confirms that destination-image indicators load from 0.747 to 0.909, satisfaction from 0.863 to 0.951, loyalty from 0.792 to 0.932, and motivation from 0.361 to 0.897. For motivation, M13-M18 and M21-M22 are below 0.50; M15 is especially weak (0.361), while M20 is only 0.607. These values are not ‘fixed’ by deleting items in the manuscript because doing so would require re-estimation of the full model from the original respondent-level dataset. Instead, they are treated as evidence that the 22-item reflective motivation specification requires theory-led re-specification. A defensible re-analysis should examine the original item wording and test whether motivation is better represented by distinct first-order dimensions for example, intrinsic/sport-related and extrinsic/destination-related motives or a theoretically justified higher-order construct, followed by HTMT with bootstrap confidence intervals, cross-loadings, and indicator/construct VIF. Until that re-analysis is completed, the original structural and mediation estimates are retained as provisional rather than presented as corrected estimates.
4.3. Structural Model and Hypothesis Testing
The structural model produced R2 values of 0.692 for satisfaction and 0.891 for loyalty. The loyalty value is unusually high for a behavioral-intention model and is therefore reported descriptively rather than as evidence of superior model performance, particularly because satisfaction and loyalty correlate at 0.906 and discriminant validity is unresolved. Blindfolding Q2 values for satisfaction (0.549) and loyalty (0.658) are positive and indicate in-sample predictive relevance under that procedure; they do not establish out-of-sample predictive performance (Shmueli et al., 2019). Table 6 reports explanatory power and Table 7 reports blindfolding-based predictive relevance.
The path analysis showed that destination image had a strong positive effect on satisfaction (β = 0.745, t = 12.693, p < 0.001), supporting H2. Satisfaction had a positive effect on loyalty (β = 0.600, t = 11.532, p < 0.001), supporting H3. Motivation did not significantly influence satisfaction (β = 0.113, t = 1.672, p = 0.095), so H1 was not supported. Motivation had a significant direct positive effect on loyalty (β = 0.301, t = 7.818, p < 0.001), supporting H6, while destination image had a smaller but significant direct effect on loyalty (β = 0.129, t = 2.205, p = 0.028), supporting H7. These coefficients should be interpreted cautiously until the additional discriminant-validity and collinearity diagnostics are reported. The direct path estimates and hypothesis interpretations are reported in Table 8 and visualized in Figure 1.
The mediation analysis showed a significant indirect effect of destination image on loyalty through satisfaction (β = 0.447, t = 8.888, p < 0.001), supporting H5. Because the direct destination image-loyalty path was also positive and significant (β = 0.129, p = 0.028), the pattern is consistent with partial mediation; the approximate total effect is 0.576 (0.129 + 0.447). By contrast, the indirect motivation-satisfaction-loyalty effect was not significant (β = 0.068, t = 1.653, p = 0.099), so H4 was not supported, while the direct motivation-loyalty path remained significant (β = 0.301, p < 0.001). Thus, motivation shows a primarily direct association with loyalty in this model, with an approximate total effect of 0.369 after adding the non-significant indirect component. These mediation interpretations remain conditional on satisfactory measurement-model diagnostics. Table 9 reports the two indirect effects used to evaluate the mediation hypotheses.
4.4. Importance-Performance Map Analysis
IPMA was used as a managerial translation of the provisional PLS-SEM estimates. Satisfaction had the highest reported importance for loyalty (0.600) and performance below the construct mean (72.751 versus 76.085), making experience-related satisfaction the clearest area for managerial attention within the reported model. Destination image combined relatively high importance with above-mean performance, whereas motivation showed high performance but lower importance. Because IPMA inherits the specification and validity of the underlying PLS-SEM model, these priorities should be read as conditional managerial signals rather than definitive rankings until the measurement model is re-estimated. Table 10 reports the construct-level values.
4.5. AHP and FGD Results
AHP produced ten normalized strategic weights for Bali running-tourism development. The aggregated consistency ratio was 0.04, below the conventional 0.10 threshold. Safety assurance (0.209) and destination/event security (0.180) received the largest weights, followed by accessibility (0.118) and information/communication (0.117). These values describe the supplied aggregate expert output; they do not by themselves document how individual judgments were combined. Because the available files do not contain the individual pairwise matrices, individual consistency ratios, aggregation rule, or handling of missing/inconsistent judgments, the manuscript does not infer those procedures. They should be added from the original AHP response file as supplementary material before submission. Table 11 reports the verified aggregate weights.
The supplied FGD record was synthesized into seven themes: safety/regulation/monitoring; infrastructure/route/mobility; event calendar/information; local culture/Balinese experience; MSMEs/local economy; environment/carrying capacity; and youth segmentation. These themes contextualize the AHP priorities and suggest implementation domains, but the qualitative evidence should not be described as independent validation because the supplied record does not document the meeting date, venue, duration, moderator protocol, recording/transcription procedure, number of coders, or member-checking procedure. Those details should be recovered from the original fieldwork record where available. Table 12 links each documented theme to its development implication.
Figure 2 is a conceptual synthesis rather than an additional statistically tested model. It shows how evidence moves from the behavioral PLS-SEM model to IPMA-based managerial diagnosis, AHP ranking of development actions, and FGD interpretation before being translated into strategic recommendations for destination management and collaborative governance. In this framework, sustainability and governance are proposed implementation domains informed by the integrated evidence; they are not latent dependent variables estimated in the PLS-SEM model.
At the highest level, the framework is guided by the vision of developing Bali as a sustainable, resilient, high-quality, and internationally competitive running tourism destination. This vision serves as the strategic objective that aligns all participating stakeholders toward a common long-term goal rather than fragmented organizational interests.
The government occupies a strategic enabling role by providing policy direction, regulatory frameworks, financial support, infrastructure investment, strategic planning, and monitoring mechanisms. Rather than acting as the sole decision-maker, government functions as a facilitator that establishes institutional conditions conducive to collaboration among public, private, academic, and community actors. This role is consistent with collaborative-governance models in which public agencies convene stakeholders, establish institutional arrangements, and support joint action rather than making all decisions unilaterally (Ansell & Gash, 2008; Emerson et al., 2012).
The central component of the framework is the Collaborative Governance Platform, representing the institutional arena where stakeholders jointly formulate, implement, and evaluate tourism development initiatives. The platform operationalizes collaborative governance through five interrelated processes.
First, shared information enables stakeholders to exchange tourism data, market intelligence, research findings, operational experiences, and best practices, thereby reducing information asymmetry and improving evidence-based decision-making. Second, co-planning and co-design facilitate collective strategy formulation, destination planning, and priority setting, ensuring that development decisions reflect multiple stakeholder perspectives rather than unilateral interests. Third, co-implementation emphasizes joint execution of tourism programs, event management, marketing activities, infrastructure utilization, and sustainability initiatives through shared responsibilities. Fourth, monitoring, evaluation, and learning establish adaptive governance by continuously assessing performance, identifying lessons learned, and refining future strategies. Finally, resource mobilization integrates financial, human, technical, and institutional resources across organizations, thereby enhancing implementation capacity and reducing duplication of efforts. Collectively, these processes represent the collaborative dynamics that transform stakeholder interactions into coordinated governance actions.
Surrounding the governance platform are the principal stakeholder groups whose complementary roles support sustainable running tourism. Sports associations provide technical standards, athlete development, and event sanctioning to ensure competition quality. Event organizers manage operational planning, logistics, safety, and sustainability practices during event delivery. Tourism businesses, including accommodation providers, transport operators, and attractions, deliver tourism services that shape visitor experiences. Universities and research institutions contribute scientific evidence, innovation, impact assessment, and capacity development to strengthen evidence-based governance. Running communities participate through advocacy, volunteerism, and destination promotion, while local communities preserve cultural identity and strengthen social acceptance of tourism development. Micro, Small, and Medium Enterprises (MSMEs) generate local economic value through products and services, whereas tourism villages diversify visitor experiences by offering community-based tourism, cultural attractions, and rural development opportunities. These diverse actors collectively form an integrated governance network in which each stakeholder contributes specialized resources while remaining interconnected through the collaborative platform.
The framework further incorporates participant and visitor experience as an evaluation component. Perceptions regarding event quality, destination services, perceived value, and overall satisfaction can generate feedback through surveys, online reviews, social media, and tourism data. Rather than treating running-event participants and visitors solely as consumers, the framework positions them as sources of performance information that can inform future governance decisions. This strategic layer should be interpreted as a conceptual extension of the empirical findings, not as an additional latent construct tested in the PLS-SEM model.
This feedback is subsequently analysed through the destination management component, where tourism authorities and collaborative stakeholders identify operational issues, evaluate performance indicators, generate strategic insights, and implement corrective actions through policy adjustments, program improvements, and service enhancements. Consequently, destination management functions as an adaptive management mechanism linking visitor experiences with governance responses.
The successful implementation of these collaborative processes is expected to produce four major destination outcomes: improved tourist experiences, increased visitor loyalty and repeat visitation, enhanced local economic growth, and strengthened environmental and social sustainability. These outcomes collectively reflect the multidimensional objectives of sustainable tourism by simultaneously generating economic competitiveness, community benefits, and long-term destination resilience.
Finally, the framework recognizes that collaborative governance is not a one-time intervention but an ongoing institutional process. Therefore, it incorporates continuous governance mechanisms, including regular multi-stakeholder meetings, transparent information sharing, capacity building and training, conflict resolution, innovation and knowledge management, and performance monitoring and reporting. These mechanisms are intended to institutionalize collaboration, maintain stakeholder commitment, strengthen mutual trust, and promote organizational learning over time. The continuous feedback loops shown in the framework indicate that governance is adaptive, allowing stakeholders to modify strategies based on accumulated experience and changing conditions, consistent with integrative collaborative-governance theory (Emerson et al., 2012).
The framework proposes, as a strategic interpretation rather than a directly tested structural relationship, that sustainable running-tourism development in Bali may be supported by an adaptive collaborative-governance system in which government provides institutional support, multiple stakeholders jointly undertake planning and implementation, running-event participants and visitors contribute evaluative feedback, destination managers translate this feedback into policy and operational improvements, and continuous governance mechanisms sustain long-term collaboration. Accordingly, sustainability and collaborative governance are treated as destination-development implications derived from the combined PLS-SEM, IPMA, AHP, and FGD evidence rather than as empirical outcomes measured in the participant survey.

Table 13.
Sequential integration bridge from behavioral evidence to destination action.
| Behavioral finding | IPMA implication | AHP priority | FGD interpretation | Proposed destination action |
| Destination image → satisfaction (β = 0.745; provisional) | Protect destination strengths while improving the experienced service encounter | Accessibility; information/communication; public facilities; cleanliness | Infrastructure/route/mobility; local culture/Balinese experience | Route audits, clearer visitor information, facility standards, culturally distinctive route design |
| Satisfaction → loyalty (β = 0.600; provisional) | Satisfaction has highest reported importance and below-mean performance | Safety assurance; destination/event security | Safety/regulation/monitoring | Minimum event standards, medical and traffic protocols, cross-agency coordination |
| Motivation → loyalty (β = 0.301); motivation → satisfaction not significant | Promotion alone is less actionable than improving the delivered experience | Competitive packages; value for money; recreational activities | Youth segmentation; local culture/Balinese experience | Segmented packages, youth access, sport-culture-well-being experiences |
| Destination image → satisfaction → loyalty indirect effect (β = 0.447; provisional) | Convert destination appeal into reliable experience quality | Safety, accessibility, communication, facilities, cleanliness | MSMEs/local economy; environment/carrying capacity | Integrate local enterprises and green-event practices into the participant journey |
Note: PLS-SEM and IPMA entries remain conditional on re-estimation of the measurement model. AHP entries are verified aggregate weights; FGD entries are documented thematic interpretations, not statistically tested outcomes.
5. Discussion
The discussion is organized around the empirical pattern and its strategic translation rather than around a sequence of supported and unsupported hypotheses. Three evidence layers must be kept distinct. First, PLS-SEM and IPMA provide participant-level quantitative associations, but these remain provisional because the motivation specification and discriminant validity require re-analysis. Second, AHP provides stakeholder-derived aggregate priority weights. Third, FGD provides qualitative interpretation of implementation issues. Sustainability and collaborative governance are author-level synthesis domains informed by these layers; they were not estimated as latent outcomes.
The finding that destination image strongly predicts satisfaction is consistent with sport-event evidence in which destination image is positively associated with satisfaction and future behavioural intentions (Vegara-Ferri et al., 2020; Zouni et al., 2021). In the Bali sample, however, the IPMA result indicates that image alone is insufficient: satisfaction has the highest total importance for loyalty but lower performance. Thus, the practical implication is to convert Bali’s destination appeal into reliable event and destination experiences through safety, cleanliness, facilities, route management and value for money.
The non-significant effect of motivation on satisfaction suggests that motivation should be distinguished from post-event evaluation. Active sport-tourism research identifies competitive desire, fitness, social needs, self-enrichment, travel exploration, and destination attributes as distinct motivational dimensions that can shape participation and conative loyalty (Hungenberg et al., 2016). By contrast, satisfaction reflects evaluation of the experienced event and destination and is more directly associated with future intentions in sport-event studies (Vegara-Ferri et al., 2020; Zouni et al., 2021). This distinction offers a plausible interpretation of why motivation had a direct effect on loyalty in this study but did not significantly predict satisfaction.
The mediation results show that satisfaction is a meaningful bridge between destination image and loyalty. This pattern is consistent with the half-marathon study of Vegara-Ferri et al. (2020), in which satisfaction mediated the relationship between destination image and future intentions. Marathon research also shows that destination and event evaluations are related to satisfaction and revisit intention (Zouni et al., 2021). For Bali, the result implies that cultural attractiveness and natural beauty must be translated into high-quality running experiences through safe routes, clear information, community engagement, appropriate facilities, and clean event environments.
Considering direct and indirect effects jointly clarifies the mediation pattern. Destination image has both a significant direct effect on loyalty (β = 0.129) and a significant indirect effect through satisfaction (β = 0.447), which is consistent with partial mediation. Motivation, in contrast, has a significant direct effect on loyalty (β = 0.301) but a non-significant indirect effect through satisfaction (β = 0.068), so the data do not support satisfaction as a mediator of the motivation-loyalty relationship. This distinction should be retained in the theoretical interpretation rather than presenting motivation’s direct effect as an unanticipated post hoc result.
The IPMA and AHP results make the managerial interpretation clearer. Satisfaction is the highest priority because it has the strongest importance but lower performance. AHP shows that safety and security must be treated as foundational requirements, not optional event features. Without medical support, route control, crowd management, traffic coordination and risk management, destination image may not translate into loyalty. Accessibility and communication are also crucial because runners need reliable information about routes, schedules, transportation, parking, start-finish zones, hydration points and supporting tourism packages.
FGD findings further suggest that running tourism should be developed as an ecosystem. A single event can attract participants, but sustainable running tourism requires a coordinated network of organizers, government, sport associations, tourism businesses, running communities, villages and MSMEs. This interpretation is consistent with research emphasizing host-community involvement in sport tourism (Herbold et al., 2020), strategic planning of wider sport-event impacts (Chersulich Tomino et al., 2020), and organizer responsibilities for sustainability in small-scale running events (Gkarane et al., 2025). In Bali, the ecosystem model should connect race events with cultural routes, local cuisine, village tourism, well-being experiences, eco-run principles and digital communication. Here, a destination ecosystem is used operationally to mean the interdependent network of public agencies, event organizers, sport associations, tourism businesses, communities, villages, and MSMEs whose coordinated resources and actions jointly shape the running-tourism experience; it is not treated as an additional latent construct or as a separately tested causal theory. This network interpretation is linked to the collaborative-governance perspective adopted below (Ansell & Gash, 2008; Emerson et al., 2012).
The proposed integrated collaborative governance framework extends the behavioural model by positioning collaboration as the institutional mechanism through which visitor evidence can inform destination-level action. Collaborative-governance theory emphasizes structured interaction among public agencies and non-state stakeholders, including trust building, shared understanding, joint capacity, and coordinated action (Ansell & Gash, 2008; Emerson et al., 2012). In sport tourism, sustainability frameworks likewise emphasize institutional support and stakeholder coordination alongside economic, environmental, and socio-cultural criteria (Morfoulaki et al., 2023; Yang et al., 2020). The Bali context further supports a multi-actor governance perspective in which government, industry, communities, academia, and other stakeholders contribute complementary resources (Mananda, Negara, et al., 2025).
From a theoretical perspective, the framework is anchored in collaborative governance. Ansell and Gash (2008) conceptualize collaborative governance as consensus-oriented decision-making that brings public agencies and non-state stakeholders together in collective forums. Emerson et al. (2012) extend this perspective by emphasizing system context, collaborative dynamics, joint action, impacts, and adaptation. The proposed running-tourism framework operationalizes these principles through five practical processes: information sharing, co-planning and co-design, co-implementation, monitoring and learning, and resource mobilization.
One contribution of the framework is its specification of government as an enabling institution rather than a centralized controller. Collaborative-governance theory highlights facilitative leadership, institutional design, stakeholder participation, and joint capacity as conditions that support collective action (Ansell & Gash, 2008; Emerson et al., 2012). In the proposed Bali framework, this enabling role is expressed through regulation, strategic planning, infrastructure investment, resource support, coordination, and monitoring while implementation responsibilities are shared across stakeholders.
The empirical findings also clarify the behavioural component of the governance framework. Destination image had the strongest effect on satisfaction (β = 0.745), satisfaction influenced loyalty (β = 0.600), and motivation affected loyalty directly without significantly affecting satisfaction. This pattern is broadly consistent with sport-event evidence linking destination image and satisfaction to future intentions (Vegara-Ferri et al., 2020; Zouni et al., 2021), while Wang and Butkouskaya (2023) demonstrate that event image and perceived value can also shape behavioural intentions in sports tourism. The present study extends that evidence by showing how these behavioural results can be translated into strategic destination priorities.
The framework further proposes that collaborative governance can improve visitor experience indirectly by coordinating the services and conditions that shape the destination encounter. Shared planning and implementation allow stakeholders to address route design, event logistics, transport management, public facilities, cultural attractions, local participation, and environmental protection as interdependent issues. This interpretation is consistent with collaborative-governance theory, which emphasizes joint capacity and coordinated action (Emerson et al., 2012), and with Bali-specific research highlighting multi-stakeholder governance for sustainable tourism development (Mananda, Negara, et al., 2025).
The IPMA findings add a managerial layer to this interpretation. Satisfaction emerged as the construct with the highest importance for loyalty but comparatively lower performance, indicating that improving visitor experience should receive more attention than simply increasing motivational promotion. This interpretation is consistent with sport-event studies in which satisfaction predicts future intentions to revisit or recommend an event or destination (Vegara-Ferri et al., 2020; Zouni et al., 2021). The contribution of the present analysis is to identify where improvement efforts should be concentrated in the Bali running-tourism context.
The AHP and FGD findings further explain why collaborative governance is required. Safety assurance and event security were identified as the highest development priorities, followed by accessibility, communication, public facilities, and cleanliness. These priorities require coordination across agencies, organizers, communities, and service providers. Research on sport-tourism sustainability similarly emphasizes strategic planning across a wide set of event impacts (Chersulich Tomino et al., 2020), the role of host communities (Herbold et al., 2020), and organizer responsibility in small-scale running events (Gkarane et al., 2025).
The framework also broadens the role of local communities and MSMEs beyond passive beneficiaries of tourism. Host-community research emphasizes that local participation and perceptions are important for sustainable sport-tourism development (González-García et al., 2022; Herbold et al., 2020; Parra-Camacho et al., 2023). In the Bali framework, local communities contribute cultural knowledge, social acceptance, and destination hospitality, while MSMEs connect event demand with local products and services. This multi-actor logic is also consistent with Bali-specific penta-helix governance research that emphasizes collaboration among government, business, communities, academia, and other stakeholders (Mananda, Negara, et al., 2025).
Another contribution of the framework is the inclusion of universities and research institutions as active governance actors. In the proposed model, universities contribute research evidence, innovation, impact assessment, monitoring, and capacity building, thereby supporting evidence-informed policymaking and organizational learning. This role fits the broader collaborative-governance emphasis on shared knowledge, joint capacity, and learning across participating actors (Emerson et al., 2012).
The feedback mechanism incorporated into the framework further distinguishes it from a linear planning model. Participant experiences are continuously evaluated through surveys, online reviews, social media, and operational data, allowing destination managers to identify weaknesses and adjust future policies and management strategies. This iterative logic reflects the adaptation component of integrative collaborative governance, in which collaborative actions generate impacts that feed back into subsequent learning and adjustment (Emerson et al., 2012). For running tourism, such feedback is especially relevant because participant expectations, environmental conditions, and event technologies can change between event cycles.
Finally, the proposed framework demonstrates how behavioural evidence generated through PLS-SEM, managerial priorities identified by IPMA, strategic priorities established through AHP, and stakeholder consensus obtained from FGD can be integrated into a single destination-governance model. Rather than treating these analytical methods as independent outputs, the framework connects them through collaborative processes of information sharing, joint planning, implementation, monitoring, learning, and resource mobilization. In this way, the study bridges behavioural sport-tourism research with collaborative-governance theory (Ansell & Gash, 2008; Emerson et al., 2012) and provides a framework that can be tested in other emerging running-tourism destinations.
6. Conclusions
This study links a four-construct participant-level behavioral model with IPMA, AHP, and FGD-based strategic translation. In the reported model, destination image is positively associated with satisfaction, satisfaction is positively associated with loyalty intentions, and motivation is directly associated with loyalty but not significantly with satisfaction. The reported indirect-effect pattern is consistent with satisfaction carrying part of the destination image-loyalty association but not the motivation-loyalty association. These findings distinguish pre-participation drivers from post-experience evaluation, but they remain provisional because the reflective motivation specification and discriminant validity require re-analysis. They apply to the sampled adult running-event participants and should not be generalized automatically to a strictly defined tourist population.
The practical implication is that Bali should not rely only on promotion or the existing attractiveness of the destination. The priority should be to improve satisfaction through safety assurance, event security, accessible routes, clear communication, public facilities, cleanliness, value for money, community participation and sustainable event practices. The proposed model positions running tourism as a sport-culture-well-being ecosystem that can strengthen Bali’s tourism diversification while supporting local communities and sustainable destination management.
6.1. Theoretical Implications
The contribution is threefold and should be interpreted within the empirical boundaries of the study. Theoretically, the reported pattern separates pre-participation motivation from post-experience evaluation: destination image is associated with satisfaction and then loyalty, whereas motivation is associated primarily with loyalty directly. Methodologically, the study demonstrates a sequential evidence chain from behavioral association (PLS-SEM) to managerial diagnosis (IPMA), expert prioritization (AHP), and stakeholder contextualization (FGD). Contextually, it translates participant-level evidence into Bali-specific destination actions while explicitly avoiding an unsupported tourist/non-tourist classification. Experience quality is not a separate latent construct, and sustainability and collaborative governance are downstream interpretation domains rather than outcomes statistically tested in the PLS-SEM model.
6.2. Managerial Implications
For destination managers and policymakers, the findings suggest several priorities. Bali should establish minimum standards for running events, including participant safety, medical support, route security, traffic management and environmental control. Organizers should provide clear digital information about routes, schedules, facilities and transport. Running events should be integrated with cultural routes, well-being packages, local food, MSME participation and tourism village experiences. Cleanliness and waste management should be improved through green-event guidelines and reduced single-use plastic. Finally, youth and student segments can be expanded through affordable categories, campus running programs and community-based well-being campaigns.
6.3. Limitations and Future Research
This study has several important limitations. First, the unit of analysis is the adult running-event participant, and the survey as currently documented does not establish usual environment, overnight stay, travel distance, or primary trip purpose. Therefore, the 45% of respondents reporting Bali as their origin cannot automatically be classified as non-tourists, and respondents from outside Bali cannot automatically be classified as tourists; future studies should operationalize tourism status directly and conduct sensitivity analyses by traveler type. Second, all focal constructs were measured by the same questionnaire at one point in time, creating potential common method bias and limiting causal interpretation. Third, the Fornell-Larcker results indicate unresolved discriminant-validity problems, and the very high reliability values for satisfaction and loyalty may indicate item redundancy. HTMT confidence intervals, loadings, VIF values, effect sizes, and common-method diagnostics should be reported before drawing strong conclusions from the structural and mediation results. Fourth, the high R2 for loyalty may partly reflect construct overlap, and positive blindfolding Q2 values should not be treated as evidence of out-of-sample predictive performance without PLSpredict or another holdout-based assessment. Fifth, the AHP and FGD phases require fuller procedural reporting, including pairwise-comparison aggregation, matrices, focus-group composition, duration, transcription, and coding. Finally, the study is context-specific to Bali running events, so replication across different event types, destinations, and traveler segments is needed. A priority re-analysis sequence is therefore: (1) verify the SmartPLS project version and bootstrap settings; (2) inspect motivation item wording and theory-led dimensionality; (3) re-estimate the measurement model; (4) report HTMT with bootstrap confidence intervals, cross-loadings, outer/inner VIF and f2; (5) assess common-method bias with a justified diagnostic; and only then (6) update structural paths, mediation, IPMA, and any claims based on them.
Supplementary Materials
The following supporting information can be downloaded at the website of this paper posted on Preprints.org.
Author Contributions
Conceptualization, I.G.A., I.N.S., I.N.A. and I.G.P.B.S.M.; methodology, I.G.A. and I.G.P.B.S.M.; validation, I.N.S., I.N.A. and I.G.P.B.S.M.; formal analysis, I.G.A.; investigation, I.G.A.; resources, I.G.A., I.N.S. and I.N.A.; data curation, I.G.A.; writing—original draft preparation, I.G.A.; writing—review and editing, I.N.S., I.N.A. and I.G.P.B.S.M.; visualization, I.G.A.; supervision, I.N.S., I.N.A. and I.G.P.B.S.M.; project administration, I.G.A. and I.G.P.B.S.M. All authors have read and agreed to the published version of the manuscript.
Funding
This research received no external funding.
Institutional Review Board Statement
The supplied dissertation and analysis files do not contain the official LPPM Udayana University ethics approval/exemption letter, committee/unit name, protocol/reference number, or approval date. These details cannot be reconstructed from the available materials. Before resubmission, replace this statement with the exact wording from the official approval or formal exemption letter and confirm that approval/exemption preceded data collection.
Informed Consent Statement
Informed consent was obtained from all participants involved in the study.
Data Availability Statement
The data supporting the findings of this study are available from the corresponding author upon reasonable request.
Conflicts of Interest
The authors declare no conflicts of interest.
References
- Ansell, C.; Gash, A. Collaborative governance in theory and practice. J. Public Adm. Res. Theory 2008, 18(4), 543–571. [Google Scholar] [CrossRef]
- Chersulich Tomino, A.; Perić, M.; Wise, N. Assessing and considering the wider impacts of sport-tourism events: A research agenda review of sustainability and strategic planning elements. Sustainability 2020, 12(11), 4473. [Google Scholar] [CrossRef]
- Emerson, K.; Nabatchi, T.; Balogh, S. An integrative framework for collaborative governance. J. Public Adm. Res. Theory 2012, 22(1), 1–29. [Google Scholar] [CrossRef]
- Fornell, C.; Larcker, D.F. Evaluating structural equation models with unobservable variables and measurement error. J. Mark. Res. 1981, 18(1), 39–50. [Google Scholar] [CrossRef]
- Gibson, H.J.; Fairley, S. Sport, tourism, and social impacts. In The Oxford Handbook of Sport and Society; Oxford University Press, 2022; pp. 357–376. [Google Scholar] [CrossRef]
- Gkarane, S.; Kavoura, A.; Vassiliadis, C.; Kotzaivazoglou, I.; Fragidis, G.; Vrana, V. The role of organizers in advancing sustainable sport tourism: Insights from small-scale running events in Greece. Sustainability 2025, 17(14), 6399. [Google Scholar] [CrossRef]
- González-García, R.J.; Martínez-Rico, G.; Bañuls-Lapuerta, F.; Calabuig, F. Residents’ perception of the impact of sports tourism on sustainable social development. Sustainability 2022, 14(3), 1232. [Google Scholar] [CrossRef]
- Hair, J.F.; Risher, J.J.; Sarstedt, M.; Ringle, C.M. When to use and how to report the results of PLS-SEM. Eur. Bus. Rev. 2019, 31(1), 2–24. [Google Scholar] [CrossRef]
- Henseler, J.; Ringle, C.M.; Sarstedt, M. A new criterion for assessing discriminant validity in variance-based structural equation modeling. J. Acad. Mark. Sci. 2015, 43, 115–135. [Google Scholar] [CrossRef]
- Herbold, V.; Thees, H.; Philipp, J. The host community and its role in sports tourism—Exploring an emerging research field. Sustainability 2020, 12(24), 10488. [Google Scholar] [CrossRef]
- Higham, J. Sport tourism: A perspective article. Tour. Rev. 2021, 76(1), 64–68. [Google Scholar] [CrossRef]
- Hofmann, V.; Happ, E.; Scholl-Grissemann, U. Sport destination development—Insights from alpine hikers. Ger. J. Exerc. Sport Res. 2025, 55, 14–24. [Google Scholar] [CrossRef]
- Hungenberg, E.; Gray, D.; Gould, J.; Stotlar, D. An examination of motives underlying active sport tourist behavior: A market segmentation approach. J. Sport Tour. 2016, 20(2), 81–101. [Google Scholar] [CrossRef]
- Mananda, I.G.P.B.S.; Ariwangsa, I.B.; Antara, I.K. Bridging cultural heritage and digital creativity: Social media engagement for sustainable event tourism in Denpasar Bali. J. Cult. Anal. Soc. Change 2025, 10(2), 2756–2778. [Google Scholar] [CrossRef]
- Mananda, I.G.P.B.S.; Negara, I.M.K.; Kristianto, Y.; Angligan, I.G.K.H.; Deuchar, C. From overtourism to regeneration: A penta-helix governance model for sustainable tourism in Bali. Tour. Hosp. 2025, 6(5), 240. [Google Scholar] [CrossRef]
- Morfoulaki, M.; Myrovali, G.; Kotoula, K.-M.; Karagiorgos, T.; Alexandris, K. Sport tourism as driving force for destinations’ sustainability. Sustainability 2023, 15(3), 2445. [Google Scholar] [CrossRef]
- Parra-Camacho, D.; González-Serrano, M.H.; Alguacil-Jiménez, M.; Jiménez-Jiménez, P. Analysis of the contribution of sport events to sustainable development: Impacts, support and residents’ perception. Heliyon 2023, 9(11), e22033. [Google Scholar] [CrossRef]
- Pedauga, L.E.; Pardo-Fanjul, A.; Redondo, J.C.; Izquierdo, J.M. Assessing the economic contribution of sports tourism events: A regional social accounting matrix analysis approach. Tour. Econ. 2022, 28(3), 599–620. [Google Scholar] [CrossRef]
- Podsakoff, P.M.; MacKenzie, S.B.; Lee, J.-Y.; Podsakoff, N.P. Common method biases in behavioral research: A critical review of the literature and recommended remedies. J. Appl. Psychol. 2003, 88(5), 879–903. [Google Scholar] [CrossRef]
- Ringle, C.M.; Sarstedt, M. Gain more insight from your PLS-SEM results: The importance-performance map analysis. Ind. Manag. Data Syst. 2016, 116(9), 1865–1886. [Google Scholar] [CrossRef]
- Ringle, C.M.; Wende, S.; Becker, J.-M. SmartPLS 4; SmartPLS GmbH, 2022. [Google Scholar]
- Saaty, T.L. Decision making with the analytic hierarchy process. Int. J. Serv. Sci. 2008, 1(1), 83–98. [Google Scholar] [CrossRef]
- Shmueli, G.; Sarstedt, M.; Hair, J.F.; Cheah, J.-H.; Ting, H.; Vaithilingam, S.; Ringle, C.M. Predictive model assessment in PLS-SEM: Guidelines for using PLSpredict. Eur. J. Mark. 2019, 53(11), 2322–2347. [Google Scholar] [CrossRef]
- Vegara-Ferri, J.M.; López-Gullón, J.M.; Valantine, I.; Díaz Suárez, A.; Angosto, S. Factors influencing the tourist’s future intentions in small-scale sports events. Sustainability 2020, 12(19), 8103. [Google Scholar] [CrossRef]
- Wang, J.; Butkouskaya, V. Sustainable marketing activities, event image, perceived value and tourists’ behavioral intentions in the sports tourism. J. Econ. Financ. Adm. Sci. 2023, 28(55), 60–78. [Google Scholar] [CrossRef]
- Yang, J.-J.; Lo, H.-W.; Chao, C.-S.; Shen, C.-C.; Yang, C.-C. Establishing a sustainable sports tourism evaluation framework with a hybrid multi-criteria decision-making model to explore potential sports tourism attractions in Taiwan. Sustainability 2020, 12(4), 1673. [Google Scholar] [CrossRef]
- Zheng, E.; Xue, C.; Chen, G.; Zhang, Y.; Zou, J. Unveiling urban marathon development characteristics and urban growth strategies in China: Insights from time series analysis of Baidu Search Index. PLoS ONE 2023, 18(6), e0287760. [Google Scholar] [CrossRef]
- Zouni, G.; Markogiannaki, P.; Georgaki, I. A strategic tourism marketing framework for sports mega events: The case of Athens Classic (Authentic) Marathon. Tour. Econ. 2021, 27(3), 466–481. [Google Scholar] [CrossRef]
Figure 1.
Estimated PLS-SEM relationships among motivation, destination image, satisfaction, and loyalty toward running tourism in Bali. Notes: *** p < 0.001; * p < 0.05; ns = not significant. Source: Authors’ calculations from survey data using SmartPLS.
Figure 1.
Estimated PLS-SEM relationships among motivation, destination image, satisfaction, and loyalty toward running tourism in Bali. Notes: *** p < 0.001; * p < 0.05; ns = not significant. Source: Authors’ calculations from survey data using SmartPLS.
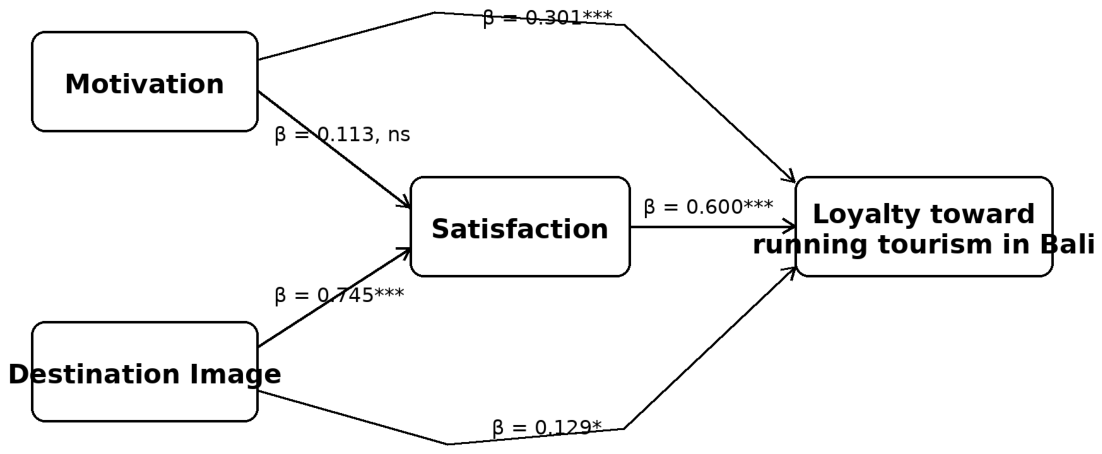
Figure 2.
Sequential integration of PLS-SEM, IPMA, AHP, and FGD into the strategic running-tourism development framework for Bali. Source: Authors’ elaboration based on the sequential PLS-SEM, IPMA, AHP, and FGD results.
Figure 2.
Sequential integration of PLS-SEM, IPMA, AHP, and FGD into the strategic running-tourism development framework for Bali. Source: Authors’ elaboration based on the sequential PLS-SEM, IPMA, AHP, and FGD results.
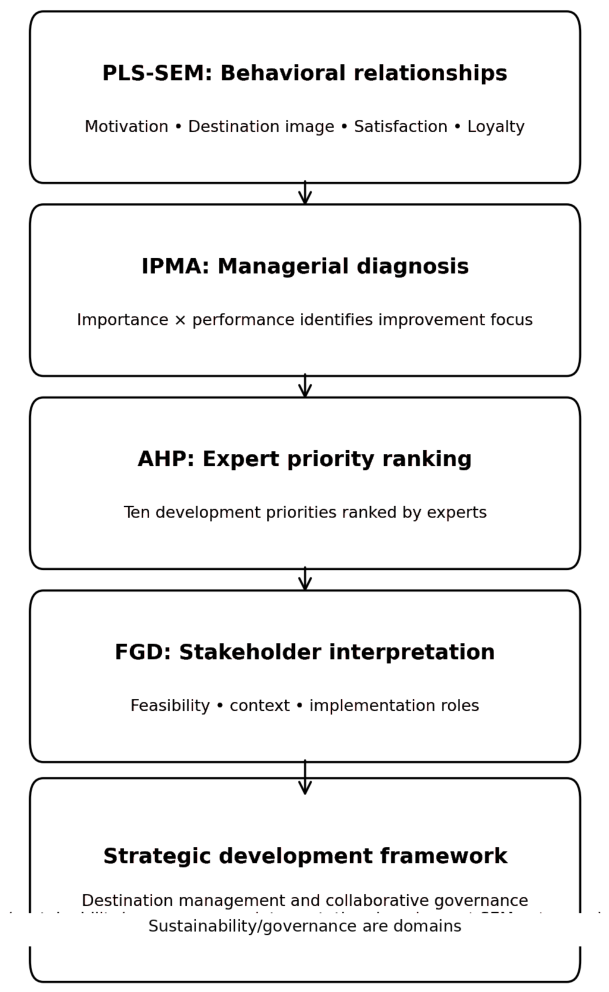
Table 1.
Research hypotheses.
| Hypothesis | Statement |
| H1 | Motivation positively influences satisfaction. |
| H2 | Destination image positively influences satisfaction. |
| H3 | Satisfaction positively influences loyalty. |
| H4 | Satisfaction mediates the motivation-loyalty relationship. |
| H5 | Satisfaction mediates the destination image-loyalty relationship. |
| H6 | Motivation positively influences loyalty toward running tourism in Bali. |
| H7 | Destination image positively influences loyalty toward running tourism in Bali. |
Source: Developed by the authors based on the literature review.
Table 2.
Respondent profile.
| Characteristic | Category | Frequency | Percentage |
| Origin | Bali | 126 | 45.00 |
| Java | 99 | 35.36 | |
| Sumatra | 25 | 8.93 | |
| Sulawesi | 17 | 6.07 | |
| Kalimantan | 9 | 3.21 | |
| West Nusa Tenggara | 4 | 1.43 | |
| Gender | Male | 223 | 79.6 |
| Female | 57 | 20.4 | |
| Age | 18-25 years | 26 | 9.3 |
| 26-35 years | 75 | 26.8 | |
| 36-45 years | 124 | 44.3 | |
| 46-55 years | 43 | 15.4 | |
| Above 55 years | 12 | 4.3 | |
| Information source | Social media | 206 | 73.6 |
| Friends | 35 | 12.5 | |
| Previous participation | 33 | 11.8 | |
| Official event website | 6 | 2.1 |
Source: Authors’ survey data.
Table 3.
Measurement model results.
| Construct | Cronbach’s Alpha | Composite Reliability | AVE |
| Destination image | 0.960 | 0.965 | 0.698 |
| Satisfaction | 0.980 | 0.982 | 0.831 |
| Loyalty | 0.970 | 0.974 | 0.773 |
| Motivation | 0.946 | 0.952 | 0.512 |
Source: Authors’ calculations from survey data using SmartPLS.
Table 4.
Indicator outer loadings by construct.
| Construct | Indicator | Outer loading |
| Destination image | C1 | 0.815 |
| Destination image | C2 | 0.819 |
| Destination image | C3 | 0.844 |
| Destination image | C4 | 0.747 |
| Destination image | C5 | 0.777 |
| Destination image | C6 | 0.856 |
| Destination image | C7 | 0.881 |
| Destination image | C8 | 0.860 |
| Destination image | C9 | 0.861 |
| Destination image | C10 | 0.909 |
| Destination image | C11 | 0.833 |
| Destination image | C12 | 0.813 |
| Satisfaction | P1 | 0.863 |
| Satisfaction | P2 | 0.911 |
| Satisfaction | P3 | 0.946 |
| Satisfaction | P4 | 0.951 |
| Satisfaction | P5 | 0.902 |
| Satisfaction | P6 | 0.906 |
| Satisfaction | P7 | 0.922 |
| Satisfaction | P8 | 0.865 |
| Satisfaction | P9 | 0.937 |
| Satisfaction | P10 | 0.878 |
| Satisfaction | P11 | 0.941 |
| Loyalty | L1 | 0.875 |
| Loyalty | L2 | 0.890 |
| Loyalty | L3 | 0.909 |
| Loyalty | L4 | 0.792 |
| Loyalty | L5 | 0.817 |
| Loyalty | L6 | 0.803 |
| Loyalty | L7 | 0.908 |
| Loyalty | L8 | 0.916 |
| Loyalty | L9 | 0.931 |
| Loyalty | L10 | 0.932 |
| Loyalty | L11 | 0.883 |
| Motivation | M1 | 0.831 |
| Motivation | M2 | 0.878 |
| Motivation | M3 | 0.854 |
| Motivation | M4 | 0.894 |
| Motivation | M5 | 0.894 |
| Motivation | M6 | 0.897 |
| Motivation | M7 | 0.875 |
| Motivation | M8 | 0.871 |
| Motivation | M9 | 0.879 |
| Motivation | M10 | 0.853 |
| Motivation | M11 | 0.886 |
| Motivation | M12 | 0.894 |
| Motivation | M13 | 0.449 |
| Motivation | M14 | 0.499 |
| Motivation | M15 | 0.361 |
| Motivation | M16 | 0.437 |
| Motivation | M17 | 0.418 |
| Motivation | M18 | 0.475 |
| Motivation | M19 | 0.722 |
| Motivation | M20 | 0.607 |
| Motivation | M21 | 0.451 |
| Motivation | M22 | 0.418 |
Source: Authors’ calculations, 2026.
Table 5.
Fornell-Larcker discriminant validity matrix.
| Construct | Destination image | Satisfaction | Loyalty | Motivation |
| Destination image | 0.836 | |||
| Satisfaction | 0.829 | 0.912 | ||
| Loyalty | 0.828 | 0.906 | 0.879 | |
| Motivation | 0.738 | 0.663 | 0.793 | 0.716 |
Source: Authors’ calculations from survey data using SmartPLS.
Table 6.
Explanatory power of the model.
| Endogenous construct | R2 | Adjusted R2 |
| Satisfaction | 0.692 | 0.690 |
| Loyalty | 0.891 | 0.890 |
Source: Authors’ calculations from survey data using SmartPLS.
Table 7.
Predictive relevance.
| Construct | SSO | SSE | Q2 |
| Destination image | 336< 0.001 | 336< 0.001 | - |
| Satisfaction | 308< 0.001 | 1390.143 | 0.549 |
| Loyalty | 308< 0.001 | 1054.660 | 0.658 |
| Motivation | 616< 0.001 | 616< 0.001 | - |
Source: Authors’ calculations from survey data using SmartPLS.
Table 8.
Direct effects.
| Path | Coefficient | t statistic | p value | Interpretation |
| Destination image -> Satisfaction | 0.745 | 12.693 | < 0.001 | Significant |
| Destination image -> Loyalty | 0.129 | 2.205 | 0.028 | Significant |
| Satisfaction -> Loyalty | 0.600 | 11.532 | < 0.001 | Significant |
| Motivation -> Satisfaction | 0.113 | 1.672 | 0.095 | Not significant |
| Motivation -> Loyalty | 0.301 | 7.818 | < 0.001 | Significant |
Source: Authors’ calculations from survey data using SmartPLS.
Table 9.
Indirect effects.
| Indirect path | Coefficient | t statistic | p value | Decision |
| Destination image -> Satisfaction -> Loyalty | 0.447 | 8.888 | < 0.001 | Supported |
| Motivation -> Satisfaction -> Loyalty | 0.068 | 1.653 | 0.099 | Not supported |
Source: Authors’ calculations from survey data using SmartPLS.
Table 10.
Construct-level IPMA results.
| Construct | Importance | Performance | Category |
| Destination image | 0.576 | 77.104 | Q1 - maintain |
| Satisfaction | 0.600 | 72.751 | Q2 - main priority |
| Motivation | 0.368 | 78.401 | Q3 - possible overinvestment |
| Mean | 0.515 | 76.085 |
Source: Authors’ calculations from survey data using importance–performance map analysis.
Table 11.
AHP priorities for strategic running-tourism development in Bali.
| Rank | Development priority | AHP weight | Category |
| 1 | Strengthening participant safety assurance | 0.209 | Very high priority |
| 2 | Strengthening destination and running-event security | 0.180 | Very high priority |
| 3 | Improving accessibility of running tourism destinations | 0.118 | High priority |
| 4 | Strengthening running tourism information and communication | 0.117 | High priority |
| 5 | Improving public facilities for runners | 0.091 | Medium priority |
| 6 | Improving cleanliness in running tourism areas | 0.075 | Medium priority |
| 7 | Developing competitive running tourism packages | 0.066 | Supporting priority |
| 8 | Improving value for money | 0.064 | Supporting priority |
| 9 | Improving supporting transport | 0.045 | Supporting priority |
| 10 | Developing recreational running tourism activities | 0.036 | Supporting priority |
Source: Authors’ calculations based on expert judgments using the analytic hierarchy process.
Table 12.
FGD themes and development implications.
| FGD theme | Core input | Development implication |
| Safety, regulation and monitoring | Race organizers should coordinate with permitting agencies, sport authorities, government and security stakeholders. | Minimum event standards and a cross-actor technical recommendation system. |
| Infrastructure, route and mobility | Roads, lighting and supporting facilities need improvement; routes should be safe and should not disrupt community mobility. | Route audits, traffic management plans and thematic routes. |
| Event calendar and information | A clearer Bali running event calendar is needed. | Integrated Bali Running Tourism Calendar. |
| Local culture and Balinese experience | Running events should include local refreshments, cultural routes and distinctive Balinese experiences. | Sport-culture-well-being packages. |
| MSMEs and local economy | Events should involve local MSMEs, tourism villages and local businesses. | Local MSME curation and pre/post-event packages. |
| Environment and carrying capacity | Eco-run concepts, waste management and participant limits are needed. | Green-event guidelines and route carrying-capacity management. |
| Youth segmentation | Students and young participants require more inclusive access and pricing. | Campus running and youth well-being campaigns. |
Source: Authors’ analysis of focus group discussion data.
Disclaimer/Publisher’s Note: The statements, opinions and data contained in all publications are solely those of the individual author(s) and contributor(s) and not of MDPI and/or the editor(s). MDPI and/or the editor(s) disclaim responsibility for any injury to people or property resulting from any ideas, methods, instructions or products referred to in the content. |
© 2026 by the authors. Licensee MDPI, Basel, Switzerland. This article is an open access article distributed under the terms and conditions of the Creative Commons Attribution (CC BY) license.
Copyright: This open access article is published under a Creative Commons CC BY 4.0 license, which permit the free download, distribution, and reuse, provided that the author and preprint are cited in any reuse.