
Submitted:
29 September 2026
Posted:
30 September 2026
You are already at the latest version
Abstract
Flexible flatfeet may affect foot alignment and ankle muscle function, which may be particularly relevant in children and adolescent surfers who require continuous postural control and weight shifting. This study investigated the effects of a 12-week rhythm step training (RST) program on radiographic foot alignment and isometric ankle muscle strength in children and adolescent surfers with flexible flatfeet. A total of 169 participants were allocated to either the general flat feet training (GFFT) group (n = 86) or the RST group (n = 83). Both groups completed one 50-min exercise session per week for 12 weeks. Radiographic foot alignment was assessed using the calcaneal pitch angle (CPA), calcaneal–first metatarsal angle (CFMA), and navicular–cuboid overlap ratio (OR), while isometric ankle dorsiflexion (DF) and plantarflexion (PF) strength were assessed. Two-way mixed analyses of variance revealed significant time × group interactions for bilateral CPA, CFMA, and navicular–cuboid OR (p < 0.05). The RST demonstrated greater improvements in radiographic foot alignment than the GFFT. Significant time × group interactions were also observed for bilateral PF and DF strength (p < 0.001), with greater improvements in the RST. These findings suggest that RST may be an effective exercise approach for improving radiographic foot alignment and isometric ankle muscle strength in children and adolescent surfers with flexible flatfeet.
Keywords:
flexible flatfeet
; rhythm step training
; youth surfers
; radiographic foot alignment
; ankle muscle strength
; calcaneal pitch angle
1. Introduction
Surfing is a balance-reliant sport performed in a dynamic and continuously changing environment, requiring the integration of visual, vestibular, and somatosensory information to maintain postural stability [1]. Surfing experience and competitive level have been associated with differences in postural control, particularly under unstable conditions, indicating that balance and sensorimotor control are important components of surfing performance [1,2]. During surfing, repeated postural adjustments and weight shifting are required to maintain stability on the board [1,2]. These demands may be particularly relevant when evaluating foot alignment and muscular function in youth surfers.
Flexible flat feet is characterized by a reduction in the medial longitudinal arch during weight-bearing and may be accompanied by altered foot posture and alignment [3,4]. Changes in medial longitudinal arch characteristics may influence foot mechanics and plantar loading during weight-bearing activities [3]. In addition to skeletal alignment, the plantar fascia and intrinsic and extrinsic foot muscles contribute to the maintenance and control of foot posture [4]. Previous research has demonstrated associations between foot posture and the morphology of the plantar fascia and foot muscles, supporting the importance of evaluating muscular characteristics in individuals with pes planus [4].
Weight-bearing radiography provides an objective method for evaluating structural foot alignment under loading conditions [5]. Radiographic parameters including the calcaneal pitch angle (CPA), calcaneal–first metatarsal angle (CFMA), and navicular–cuboid overlap ratio (OR) have been used to quantify medial longitudinal arch and midfoot alignment in children and adolescents with flat feet [5]. These measures may therefore be useful for objectively evaluating structural changes in foot alignment following exercise interventions [5].
Exercise-based interventions are commonly used as conservative approaches to improve foot posture and function in individuals with flexible flat feet [3,6]. Short-foot exercises targeting the intrinsic foot muscles have been reported to reduce navicular drop and foot pronation and to improve foot posture and plantar pressure distribution in individuals with pes planus [6]. Intrinsic foot muscle exercises have also been investigated as a strategy for improving foot posture and medial longitudinal arch control [6]. However, conventional foot-strengthening exercises are generally performed under relatively controlled conditions and may not fully represent the dynamic balance and weight-shifting demands encountered during surfing [1,2].
Rhythm step training (RST) is a dynamic exercise intervention incorporating repetitive stepping, weight shifting, balance, coordination, and lower-extremity movement [5]. A previous randomized controlled trial involving children and adolescents with flat feet demonstrated that 12 weeks of RST significantly improved radiographic foot alignment, including the CPA, CFMA, and navicular–cuboid OR [5]. These findings suggest that RST may be an appropriate exercise strategy for young individuals with flat feet [5]. Nevertheless, previous RST research has focused on children and adolescents with flat feet rather than youth athletes participating in balance-demanding sports such as surfing [5].
Although surfing requires substantial postural control and repeated weight shifting [1,2], evidence regarding exercise interventions specifically targeting flexible flat feet in youth surfers remains limited. Furthermore, previous flat feet intervention studies have primarily evaluated clinical foot posture, plantar pressure, or radiographic alignment [5,6,7], while relatively little is known about the simultaneous adaptations of structural foot alignment and foot muscle strength. Evaluating both radiographic alignment and muscle strength may therefore provide a more comprehensive assessment of structural and functional adaptations following RST [4,5].
Therefore, the purpose of this study was to investigate the effects of a 12-week rhythm step training program on radiographic foot alignment and isometric foot muscle strength in youth surfers with flexible flat feet. Weight-bearing radiographic measurements, including the CPA, CFMA, and navicular–cuboid OR, were used to evaluate structural changes in foot alignment [5], whereas isometric foot muscle strength was assessed to examine functional adaptations of the musculature involved in foot stabilization [4]. It was hypothesized that 12 weeks of RST would improve radiographic foot alignment and increase isometric foot muscle strength compared with a control training condition.
2. Materials and Methods
2.1. Participants
A total of 180 youth surfers were recruited for this randomized controlled trial. Participants were screened according to the predefined eligibility criteria, including the presence of flexible flat feet. Eligible participants were randomly allocated to either the general flat feet exercise (GFFE) group or the RST.
During the study period, 11 participants withdrew or were excluded from the final analysis because of withdrawal of consent, personal reasons, or insufficient participation in the intervention. Consequently, 169 participants completed the study and were included in the final analysis, comprising 86 participants in the GFFE and 83 participants in the RST. The overall dropout rate was 6.1% (11/180), which was below the predefined acceptable dropout rate of 20%.
Participants in both groups completed a 12-week intervention program. The GFFE performed a conventional exercise program for flexible flat feet, whereas the RST participated in a surfing-based rhythm training program designed to incorporate rhythmic stepping, weight shifting, balance control, and lower-extremity coordination. Assessments were performed before and after the 12-week intervention to evaluate changes in radiographic foot alignment and isometric foot muscle strength. The physical characteristics of the study participants are presented in Table 1.
The experimental procedures of this study are shown in Figure 1.
2.2. Experimental Design and Measurements
This study aimed to compare the effects of GFFT and RST on bilateral foot alignment and ankle muscle strength. The severity of flat foot deformity was assessed using the CPA, CFMA, and navicular–cuboid OR, which were measured on lateral radiographs of both feet. To ensure measurement accuracy and consistency and to minimize inter-rater variability, all radiographic measurements were performed by the same pediatric orthopedic specialist throughout the study. Ankle dorsiflexion (DF) and plantarflexion (PF) muscle strength were assessed using isometric strength tests.
2.2.1. CPA Measurement
The calcaneal pitch angle (CPA) is a clinically significant measure in diagnosing flat feet, as it helps assess the alignment and structure of the foot’s arch. A lower CPA typically indicates a flattened arch, which is characteristic of a flat feet. In this study, the CPA was measured by assessing the angle formed by the lines connecting the most prominent lower part of the calcaneus to the rounded end of the calcaneus and the big toe [7] (Figure 2a).
2.2.2. CFMA Measurement
2.2.3. Navicular–Cuboid OR Measurement
The navicular–cuboid OR is important for assessing the alignment and structural relationships between the navicular and cuboid bones, which are critical in maintaining the medial longitudinal arch of the foot. In the context of flat feet, an abnormal OR can indicate a collapse of the arch, leading to biomechanical imbalances in the lower limb. In this study, the navicular–cuboid OR was measured as the ratio of the length of the navicular bone to the length of the overlap between the navicular and cuboid bones [9] (Figure 2c).
2.2.4. Isometric Ankle Muscle Functions
Isometric ankle muscle strength was assessed by measuring DF and PF using a dynamometer. Participants were seated with the lower extremity stabilized to minimize compensatory movements, and the ankle was maintained in a neutral position during testing. Prior to the measurement, participants were familiarized with the testing procedure. For both DF and PF, participants performed three maximal voluntary isometric contractions, with each contraction maintained for 5 s. A 60-s rest period was provided between trials to minimize muscle fatigue. Strong verbal encouragement was provided throughout each trial to elicit maximal effort. The mean peak force obtained from the three trials was used for statistical analysis [10].
2.3. GFFT and RST Exercise Programs
Based on the exercise prescription guidelines of the American College of Sports Medicine [10], we conducted GFFT and RST once a week for 50 min over a 12-week period. The exercise program consisted of a 5 min warm-up, a 40 min main exercise, and a 5 min cool-down.
GFFT was developed by building on the research of [11], with specific modifications to better address the needs of children with flat feet. These modifications included in-corporation balance exercises that focused on improving proprioception and lower limb alignment, which are crucial for managing flat feet. Additionally, exercises were adjusted to be age-appropriate and to progressively challenge the participants’ stability and co-ordination (Table 2).
RST was structured by modifying and refining the program outlined by [5,12]. These modifications were designed to ensure the exercises were safe and effective for pediatric participants, with an emphasis on rhythm and timing to improve motor coordination and balance. The exercise intensity was gradually increased over the course of the intervention period to ensure the stability of the pediatric participants, reaching a level of “somewhat hard” on the Rating of Perceived Exertion (RPE) scale (Table 2).
In the RST program, participants were required to perform jump steps in synchro-nidation with a predetermined beat and rhythm, set at 120 beats per minute (BPM). To maintain exercise intensity, participants were instructed to avoid stepping on the lines and to continue jumping without stopping, even if they could not follow the movements accurately. This ensured that the exercise remained challenging and effective, promoting endurance and rhythm consistency. Table 2 presents the details regarding the exercise programs.
2.4. Statistical Analysis
Data was analyzed using IBM SPSS Statistics version 22.0 (SPSS Corp., Chicago, CA, USA). Means and standard deviations were calculated for all measurement variables in both groups. A two-way mixed analysis of variance (ANOVA) was performed to analyze the effects of time (pre-intervention and post-intervention) and group (RST and GFFT) on CPA, CFMA, navicular–cuboid OR, and isometric ankle muscle strength (DF and PF), as well as the interaction between time and group. Post hoc tests for significant interaction effects included paired-sample t-tests for pre- and post-intervention differences within groups and independent-sample t-tests for differences between groups. The statistical significance level for all analyses was set at p < 0.05.
3. Results
3.1. CPA Changes
For the left CPA, there was a significant main effect of time (F = 49.946, p < 0.001) and a significant time × group interaction (F = 14.371, p < 0.001), whereas the main effect of group was not significant (F = 1.623, p = 0.205). For the right CPA, significant effects of time (F = 13.418, p < 0.001) and time × group interaction (F = 47.659, p < 0.001) were also observed, while the main effect of group was not significant (F = 0.735, p = 0.393). Overall, the interaction effects indicated that changes in CPA over the 12-week intervention differed between the GFFT and RST, with greater increases observed in the RST (Table 3).
3.2. CFMA Changes
For the left CFMA, there was a significant main effect of time (F = 126.532, p < 0.001) and a significant time × group interaction (F = 46.587, p < 0.001). The main effect of group was not significant (F = 3.522, p = 0.062). For the right CFMA, significant main effects of group (F = 11.899, p = 0.001) and time (F = 126.500, p < 0.001), as well as a significant time × group interaction (F = 42.122, p < 0.001), were observed. The interaction effects indicated greater reductions in CFMA in the RST than in the GFFT (Table 3).
3.3. Navicular–Cuboid OR Changes
For the left navicular–cuboid OR, significant main effects of group (F = 7.294, p = 0.008) and time (F = 26.908, p < 0.001), as well as a significant time × group interaction (F = 5.949, p = 0.016), were observed. For the right OR, significant main effects of group (F = 5.476, p = 0.021) and time (F = 35.226, p < 0.001), together with a significant time × group interaction (F = 7.725, p = 0.006), were observed. These interaction effects indicated that the reduction in the navicular–cuboid OR differed between groups, with greater reductions observed in the RST (Table 3).
3.4. Isometric Ankle PF Changes
For left ankle PF strength, significant main effects of group (F = 32.251, p < 0.001) and time (F = 32123.382, p < 0.001), as well as a significant time × group interaction (F = 1703.817, p < 0.001), were observed. For right ankle PF strength, significant main effects of group (F = 18.307, p < 0.001) and time (F = 1854.152, p < 0.001), together with a significant time × group interaction (F = 90.362, p < 0.001), were observed. PF strength increased following the intervention in both groups, with greater improvements observed in the RST (Table 4).
3.5. Isometric Ankle DF Changes
For left ankle DF strength, significant main effects of group (F = 45.982, p < 0.001) and time (F = 11924.261, p < 0.001), as well as a significant time × group interaction (F = 2246.287, p < 0.001), were observed. Similarly, for right ankle DF strength, significant main effects of group (F = 54.780, p < 0.001) and time (F = 10438.471, p < 0.001), together with a significant time × group interaction (F = 2034.577, p < 0.001), were observed. DF strength increased following the intervention in both groups, with greater improvements observed in the RST (Table 4).
4. Discussion
The present study investigated the effects of a 12-week rhythm step training (RST) program on radiographic foot alignment and isometric ankle muscle strength in children and adolescent surfers with flexible flatfeet. The principal findings were that RST resulted in greater improvements in radiographic foot alignment and ankle muscle strength than general flat feet training (GFFT). Significant time × group interactions were observed for the calcaneal pitch angle (CPA), calcaneal–first metatarsal angle (CFMA), and navicular–cuboid overlap ratio (OR) in both feet, indicating that changes in radiographic foot alignment differed between the two groups over the 12-week intervention. Significant time × group interactions were also observed for bilateral isometric plantarflexion (PF) and dorsiflexion (DF) strength, with greater improvements observed in the RST group. Collectively, these findings suggest that RST may provide a useful exercise approach for simultaneously addressing radiographic foot alignment and ankle muscle function in children and adolescent surfers with flexible flatfeet.
4.1. Changes in Radiographic Foot Alignment
The present study demonstrated significant time × group interactions for CPA in both feet, indicating that the pattern of change over time differed between the GFFT and RST groups. Although the overall group effect for CPA was not significant, greater increases in CPA were observed in the RST group over the intervention period. An increased CPA is generally associated with a higher medial longitudinal arch, whereas a reduced CPA is commonly observed in individuals with flatfeet [5,7]. Similar findings were reported in our previous randomized controlled trial, in which 12 weeks of RST improved CPA in children and adolescents with flatfeet [5]. The present findings therefore extend previous observations by demonstrating comparable changes in children and adolescent surfers with flexible flatfeet.
Significant time × group interactions were also observed for CFMA and navicular–cuboid OR in both feet. Overall, the RST group demonstrated greater reductions in CFMA and navicular–cuboid OR than the GFFT group. CFMA and navicular–cuboid OR are radiographic parameters used to characterize foot alignment and the severity of flatfeet [5,8,9]. Therefore, the greater increase in CPA together with greater reductions in CFMA and navicular–cuboid OR in the RST group represents a consistent pattern of improvement across multiple radiographic measures of foot alignment.
These findings are consistent with previous studies demonstrating that exercise-based interventions may improve medial longitudinal arch function and foot posture in individuals with flexible flatfeet [3,6]. Short-foot exercises have been reported to improve foot posture, plantar pressure, and symptoms in individuals with pes planus [3]. Intrinsic foot muscle exercises have also been shown to reduce foot pronation and improve foot alignment [6]. Furthermore, systematic reviews have reported beneficial effects of short-foot and intrinsic foot muscle exercises on medial longitudinal arch characteristics, foot function, and dynamic postural balance in individuals with flatfeet [13,14].
The greater radiographic changes observed following RST may be related to the dynamic characteristics of the training program. RST incorporates repetitive stepping, jumping, multidirectional movements, weight shifting, balance control, and lower-extremity coordination [5,12]. These movements require repeated control of the foot and ankle during weight-bearing and may provide a dynamic stimulus to the medial longitudinal arch that differs from conventional exercises performed under relatively controlled conditions [5,12]. Previous research has also indicated that combining foot-specific exercises with lower-extremity training may improve dynamic foot function in individuals with flexible flatfeet [15]. Therefore, repeated dynamic loading and neuromuscular control during RST may have contributed to the observed changes in radiographic foot alignment [5,15]. However, because muscle activation and dynamic foot kinematics were not directly measured in the present study, the mechanisms underlying these radiographic changes cannot be determined from the present findings and should be interpreted cautiously.
4.2. Changes in Isometric Ankle Muscle Strength
Significant time × group interactions were observed for bilateral isometric PF and DF strength, indicating that changes in ankle muscle strength differed between the GFFT and RST groups over the 12-week intervention. Both groups showed improvements in PF and DF strength, with greater increases observed in the RST. These findings suggest that RST may provide additional benefits for ankle muscle strength compared with general flat feet training.
Both interventions included exercises involving the foot, ankle, and lower extremities, which may explain the improvements in ankle muscle strength observed in both groups. Exercises targeting the intrinsic and extrinsic muscles of the foot have been reported to improve foot function and muscular control in individuals with flatfeet [4,6,14]. The intrinsic and extrinsic foot muscles contribute to active support and stabilization of the medial longitudinal arch during weight-bearing activities [4]. Accordingly, exercises involving the foot and ankle may contribute to improved muscular control and function in individuals with flexible flatfeet [4,14].
The greater improvements in PF and DF strength following RST may be associated with the repetitive jumping, landing, stepping, and weight-shifting movements incorporated into the training program [5,12]. Rhythm-based training requires continuous lower-extremity movement synchronized with an external rhythm and involves repeated muscular activation, balance, and coordination [12]. Park and Jee reported that rhythm step training improved physical and cognitive functions in adolescents, supporting the potential role of rhythmic exercise in neuromotor development [12]. In the present study, the repeated jump-step and weight-shifting movements performed during RST may have provided a greater stimulus to the ankle musculature than conventional flatfeet exercises. However, because muscle activation was not directly measured, this explanation remains a potential mechanism rather than a demonstrated physiological pathway.
The concurrent improvements in radiographic foot alignment and ankle muscle strength are also noteworthy. Previous studies have demonstrated that the foot musculature and plantar fascia contribute to foot posture and support of the medial longitudinal arch [4]. However, the present study assessed isometric ankle DF and PF strength rather than directly measuring intrinsic foot muscle strength. Therefore, although improvements in ankle strength occurred concurrently with changes in CPA, CFMA, and navicular–cuboid OR, the present findings do not establish a causal relationship between increased ankle muscle strength and improved radiographic foot alignment.
4.3. Implications for Children and Adolescent Surfers
The present findings may be particularly relevant to children and adolescent surfers because surfing requires continuous postural control, weight shifting, and sensorimotor integration on a dynamically changing support surface [1,2]. Previous studies have demonstrated that surfing experience and performance level are associated with differences in postural control and balance ability [1,2]. Therefore, dynamic exercises incorporating balance, multidirectional stepping, jumping, and weight shifting may have functional relevance for young surfers.
RST incorporates several movement characteristics that are also relevant to surfing, including dynamic balance, repeated weight transfer, lower-extremity coordination, and postural adjustment [1,2,5]. Consequently, RST may provide a training stimulus that addresses both radiographic foot alignment associated with flexible flatfeet and some of the neuromuscular demands encountered during surfing [1,2,5]. This may be particularly relevant during childhood and adolescence, when appropriate exercise interventions may contribute to the development of lower-extremity function and neuromuscular control.
Nevertheless, surfing-specific performance was not directly assessed in the present study. Therefore, improvements in radiographic foot alignment and isometric ankle muscle strength should not be interpreted as direct evidence of improved surfing performance or reduced surfing-related injury risk. Further research incorporating surfing-specific functional assessments is required to determine whether the observed changes translate into meaningful improvements during actual surfing activities.
4.4. Limitations
Several limitations should be considered when interpreting the present findings. First, the participants were children and adolescent surfers with flexible flatfeet; therefore, the findings may not be directly generalizable to adults, non-athletic children and adolescents, individuals with rigid flatfeet, or athletes participating in other sports. Second, the intervention was performed once per week for 12 weeks, and different training frequencies, intensities, or intervention durations may produce different adaptations.
Third, although isometric DF and PF strength was assessed, intrinsic foot muscle strength, muscle activation, and muscle morphology were not directly measured. Previous research has emphasized the contribution of intrinsic foot muscles and the plantar fascia to foot posture and medial longitudinal arch support [4,14]. Direct assessment of these structures may therefore provide additional information regarding the mechanisms underlying changes in foot alignment.
Fourth, the present study evaluated static weight-bearing radiographic alignment but did not assess dynamic foot kinematics, plantar pressure, or muscle activation during surfing-specific movements. Radiographic measurements provide objective information regarding foot alignment but do not fully represent dynamic foot function during athletic activity [5,7,8,9]. Fifth, surfing performance, injury incidence, and sport-specific functional outcomes were not evaluated. Therefore, the clinical and sport-specific significance of the observed improvements remains to be established.
Finally, no long-term follow-up was conducted; therefore, it remains unknown whether the improvements observed after the 12-week RST program are maintained after completion of the intervention. Future studies should incorporate dynamic plantar-pressure analysis, three-dimensional motion analysis, electromyography, and direct assessment of intrinsic foot muscle function to further clarify the mechanisms underlying RST-induced adaptations [4,15]. Long-term follow-up and surfing-specific performance assessments are also warranted to determine whether improvements in foot alignment and ankle muscle strength are maintained and translate into sustained functional benefits for children and adolescent surfers.
5. Conclusions
A 12-week RST program was associated with improvements in radiographic foot alignment and isometric ankle muscle strength in children and adolescent surfers with flexible flatfeet. Compared with GFFT, RST produced greater improvements in CPA, CFMA, navicular–cuboid OR, and isometric PF and DF strength. These findings suggest that RST may be a useful exercise approach for simultaneously addressing foot alignment and ankle muscle function in children and adolescent surfers with flexible flatfeet. Further studies incorporating long-term follow-up and surfing-specific functional outcomes are needed to determine whether these improvements are maintained over time and translate into enhanced surfing-specific performance.
Author Contributions
Conceptualization, J.-M.P.; methodology, J.-M.P. and B.-K.J.; validation, B.-K.J. and S.-J.L.; formal analysis, J.-M.P.; investigation, J.-M.P.; and B.-K.J.; data curation, J.-M.P.; and S.-J.L.; writ-ing—original draft preparation, J.-M.P.; writing—review and editing, J.-M.P., B.-K.J. and S.-J.L.; visualization, J.-M.P.; supervision, S.-J.L.; project administration, J.-M.P. and S.-J.L.; funding acquisition, S.-J.L. All authors have read and agreed to the published version of the manuscript.
Funding
This research was supported by the Regional Specialized University (Glocal University) 30 ANCHOR PROGRAM through the Jeollanamdo Anchor Center, funded by the Ministry of Education (MOE) and the Jeonnam-Gwangju Special Metropolitan City, Republic of Korea. (2026-ANCHOR-14-001).
Institutional Review Board Statement
The study was conducted in accordance with the Declaration of Helsinki and approved by the Re-search Ethics Committee of Gim Cheon University (GU-202303-HRa-08-P; July 18, 2023).
Informed Consent Statement
Written informed consent was obtained from the parents or legal guardians of all participants involved in the study.
Conflicts of Interest
The authors declare no conflicts of interest.
References
- Chapman, D.W.; Needham, K.J.; Allison, G.T.; Lay, B.; Edwards, D.J. Effects of experience in a dynamic environment on postural control. Br. J. Sports Med. 2008, 42, 16–21. [Google Scholar] [CrossRef]
- Paillard, T.; Margnes, E.; Portet, M.; Breucq, A. Postural ability reflects the athletic skill level of surfers. Eur. J. Appl. Physiol. 2011, 111, 1619–1623. [Google Scholar] [CrossRef]
- Unver, B.; Erdem, E.U.; Akbas, E. Effects of short-foot exercises on foot posture, pain, disability, and plantar pressure in pes planus. J. Sport Rehabil. 2020, 29, 436–440. [Google Scholar] [CrossRef]
- Angin, S.; Mickle, K.J.; Nester, C.J. Contributions of foot muscles and plantar fascia morphology to foot posture. Gait Posture 2018, 61, 238–242. [Google Scholar] [CrossRef]
- Park, J.M.; Min, B.C.; Cho, B.C.; et al. Effects of rhythm step training on foot and lower limb balance in children and adolescents with flat feet: A radiographic analysis. Medicina 2024, 60, 1420. [Google Scholar] [CrossRef]
- Pabon-Carrasco, M.; Castro-Mendez, A.; Vilar-Palomo, S.; et al. Randomized clinical trial: The effect of exercise of the intrinsic muscle on foot pronation. Int. J. Environ. Res. Public Health 2020, 17, 4882. [Google Scholar] [CrossRef]
- Lee, K.M.; Chung, C.Y.; Park, M.S.; Lee, S.H.; Cho, J.H.; Choi, I.H. Reliability and validity of radiographic measurements in hind foot varus and valgus. J. Bone Jt. Surg. Am. 2010, 92, 2319–2327. [Google Scholar] [CrossRef]
- Abd-Elmonem, A.M.; El-Negamy, E.H.; Mahran, M.A.; Ramadan, A.T. Clinical and radiological outcomes of corrective exercises and neuromuscular electrical stimulation in children with flexible flat feet: A randomized controlled trial. Gait Posture 2021, 88, 297–303. [Google Scholar] [CrossRef]
- Koo, S.B.; Chun, S.H.; Lee, K.M.; Cho, B.C.; Koo, Y.J.; Kang, D.W.; Park, M.S. Sex differences in pedobarographic findings and relationship between radiographic and pedobarographic measurements in young healthy adults. Clin. Orthop. Surg. 2018, 10, 216–224. [Google Scholar] [CrossRef]
- Kosik, K.B.; Johnson, N.F.; Terada, M.; Thomas, A.C.; Mattacola, C.G.; Gribble, P.A. Decreased ankle and hip isometric peak torque in young and middle-aged adults with chronic ankle instability. Phys. Ther. Sport 2020, 43, 127–133. [Google Scholar] [CrossRef]
- Sivachandiran, S.; Kumar, G.V. Effect of corrective exercises programme among athletes with flat feet on foot alignment factors. Int. J. Sports Health Phys. Educ. 2016, 3, 193–196. [Google Scholar]
- Park, S.K.; Jee, Y.S. Effects of rhythm step training on physical and cognitive functions in adolescents: A prospective randomized controlled trial. Healthcare 2022, 10, 712. [Google Scholar] [CrossRef]
- Hara, S.; Kitano, M.; Kudo, S. The effects of short foot exercises to treat flat foot deformity: A systematic review. J. Back. Musculoskelet. Rehabil. 2023, 36, 21–33. [Google Scholar] [CrossRef]
- Wei, Z.; Zeng, Z.; Liu, M.; Wang, L. Effect of intrinsic foot muscles training on foot function and dynamic postural balance: A systematic review and meta-analysis. PLoS ONE 2022, 17, e0266525. [Google Scholar] [CrossRef]
- Utsahachant, N.; Sakulsriprasert, P.; Sinsurin, K.; Jensen, M.P.; Sungkue, S. Effects of short foot exercise combined with lower extremity training on dynamic foot function in individuals with flexible flatfoot: A randomized controlled trial. Gait Posture 2023, 104, 109–115. [Google Scholar] [CrossRef]
Figure 1.
Allocation of participants (flow diagram of the unified criteria for trial reporting. GFFT: general flat foot training; RST: rhythm step training; CPA: calcaneal pitch angle; CFMA: calcaneal–first metatarsal angle; OR: overlap ratio; DF: dorsiflexion; PF: plantarflexion.
Figure 1.
Allocation of participants (flow diagram of the unified criteria for trial reporting. GFFT: general flat foot training; RST: rhythm step training; CPA: calcaneal pitch angle; CFMA: calcaneal–first metatarsal angle; OR: overlap ratio; DF: dorsiflexion; PF: plantarflexion.
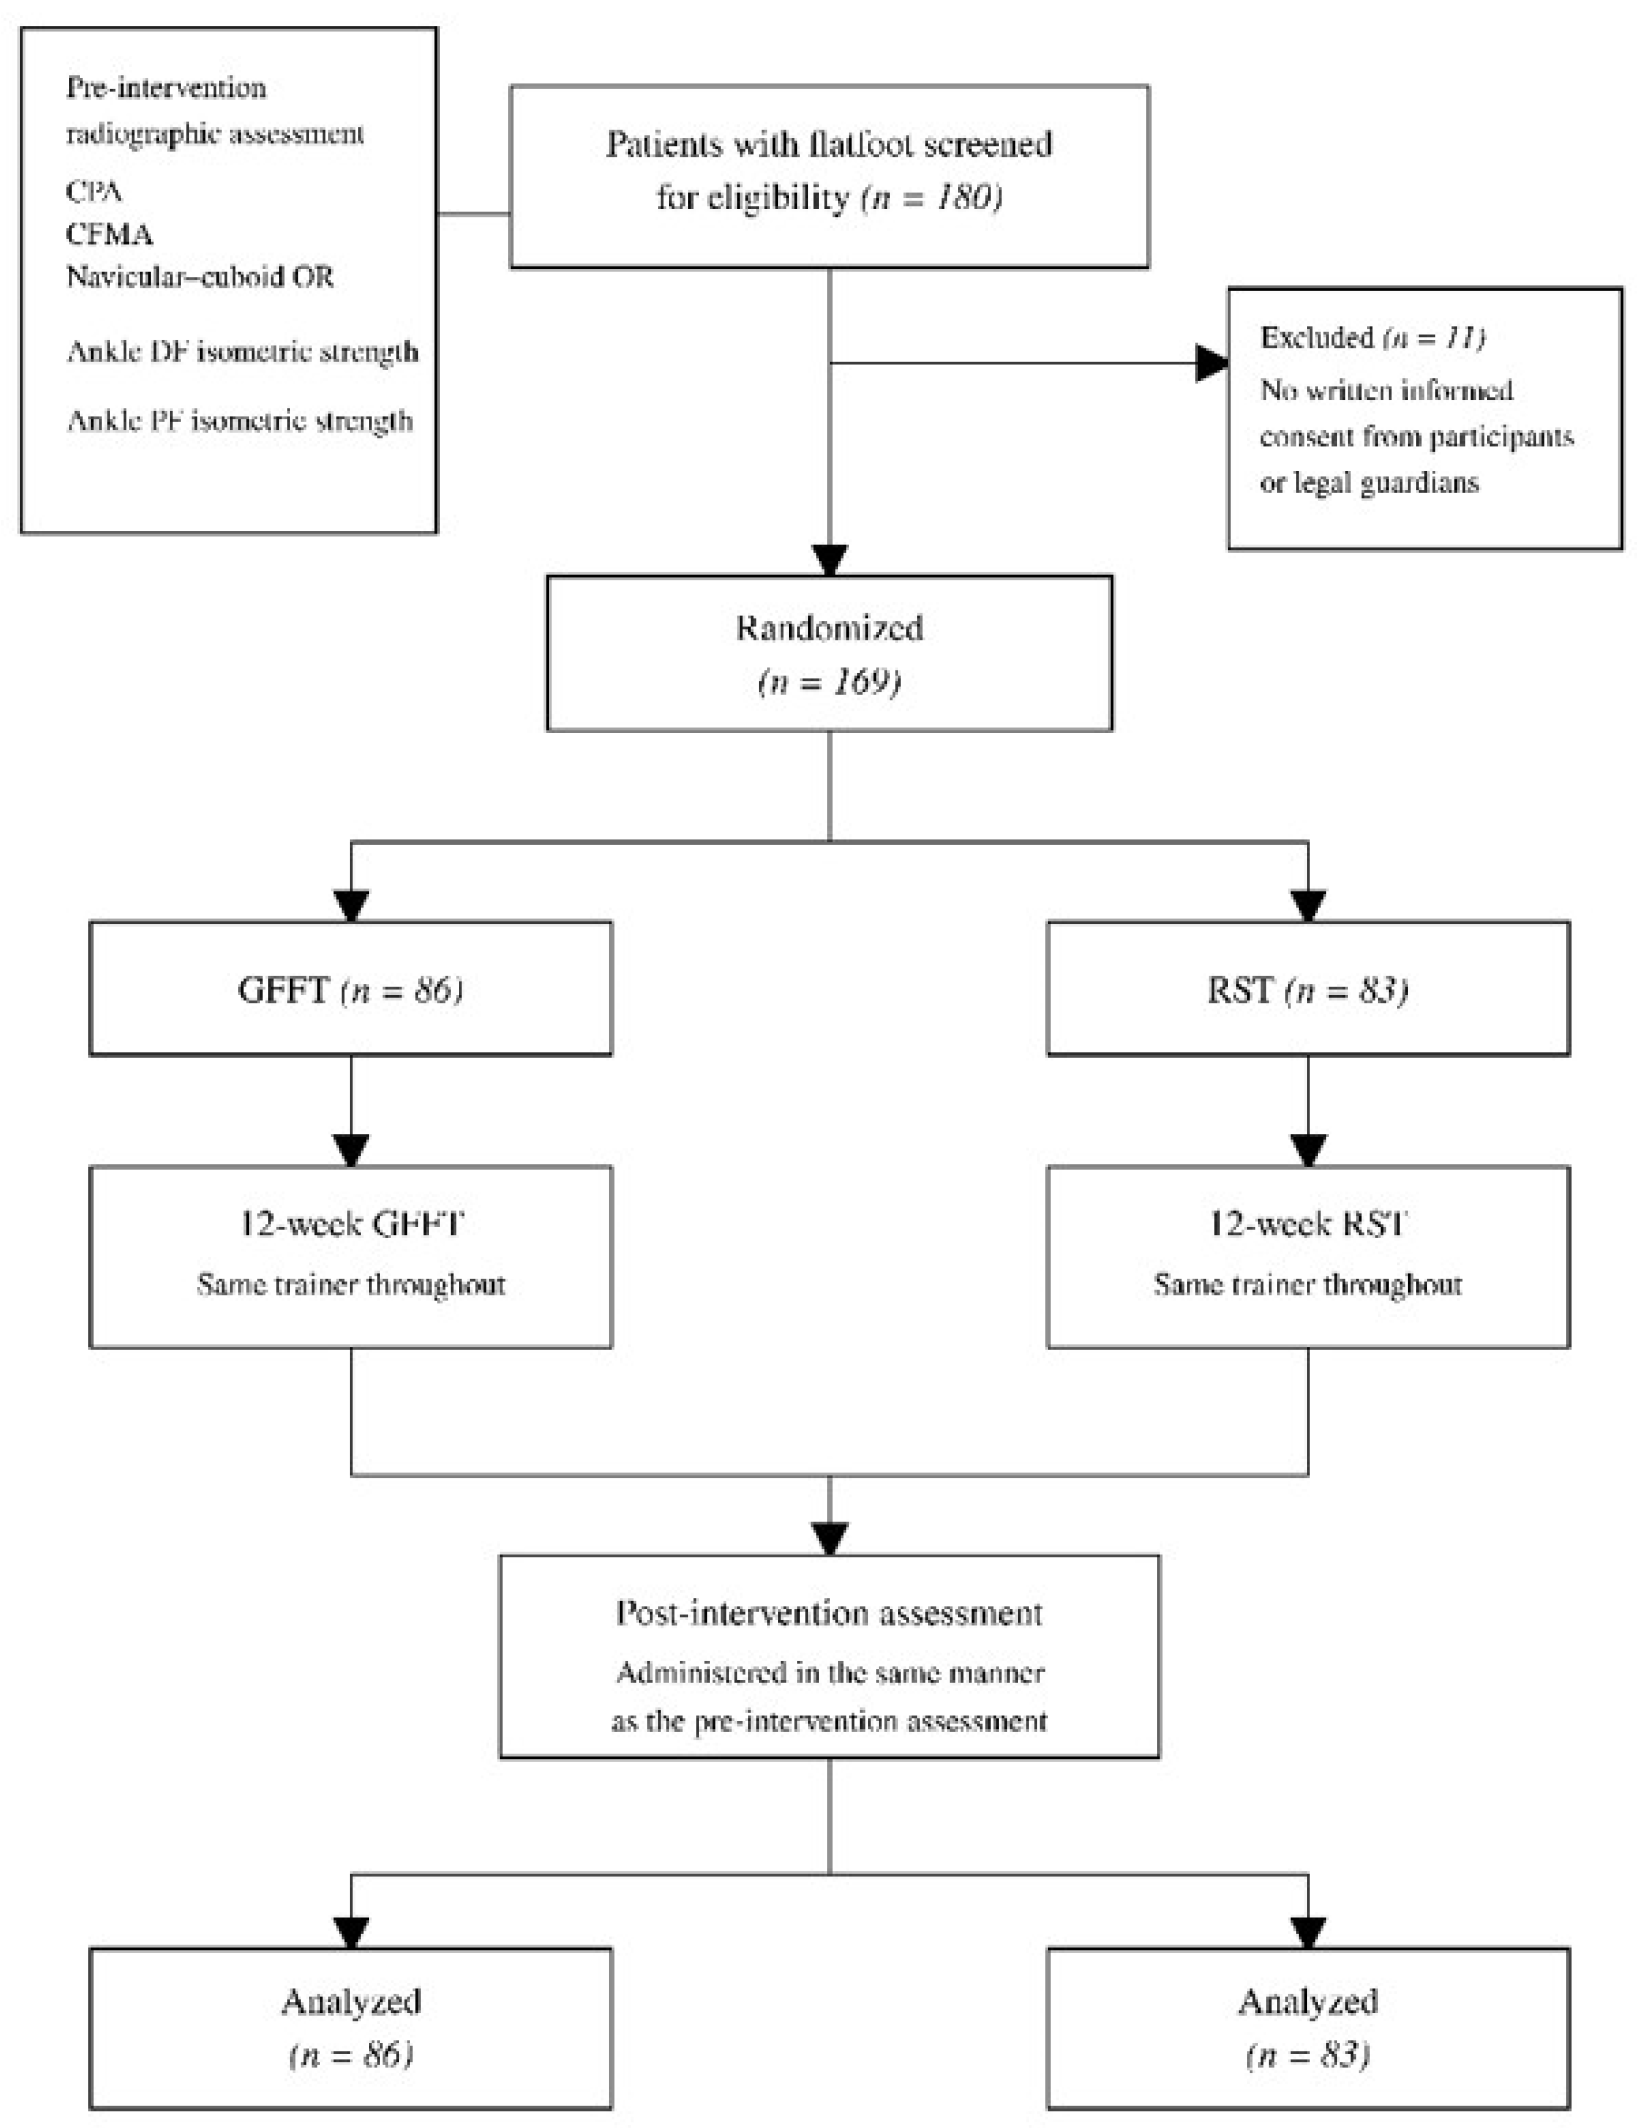
Figure 2.
(a) CPA: the black line measures the angle from the rounded end of the calcaneus to the big toe, and the black dotted line measures the angle from the lower protruding lower part of the calcaneus. (b) CFMA: the CFMA is the angle formed at the in-tersection of the straight line along the first metatarsal and the upper line of the CPA. To measure the CFMA, calculate the angle between the white line, which starts at the first metatarsal and ex-tends toward the tibial direction, and the black dotted line of the CPA, which starts at the calcaneus. (c) The navicular–cuboid OR is the ratio of the length of the navicular bone (NB, red) to the length of the overlap between the NB and the cuboid bone (CB, blue). CFMA: calcaneal–first metatarsal angle; CPA: calcaneal pitch angle; OR: overlap ratio.
Figure 2.
(a) CPA: the black line measures the angle from the rounded end of the calcaneus to the big toe, and the black dotted line measures the angle from the lower protruding lower part of the calcaneus. (b) CFMA: the CFMA is the angle formed at the in-tersection of the straight line along the first metatarsal and the upper line of the CPA. To measure the CFMA, calculate the angle between the white line, which starts at the first metatarsal and ex-tends toward the tibial direction, and the black dotted line of the CPA, which starts at the calcaneus. (c) The navicular–cuboid OR is the ratio of the length of the navicular bone (NB, red) to the length of the overlap between the NB and the cuboid bone (CB, blue). CFMA: calcaneal–first metatarsal angle; CPA: calcaneal pitch angle; OR: overlap ratio.
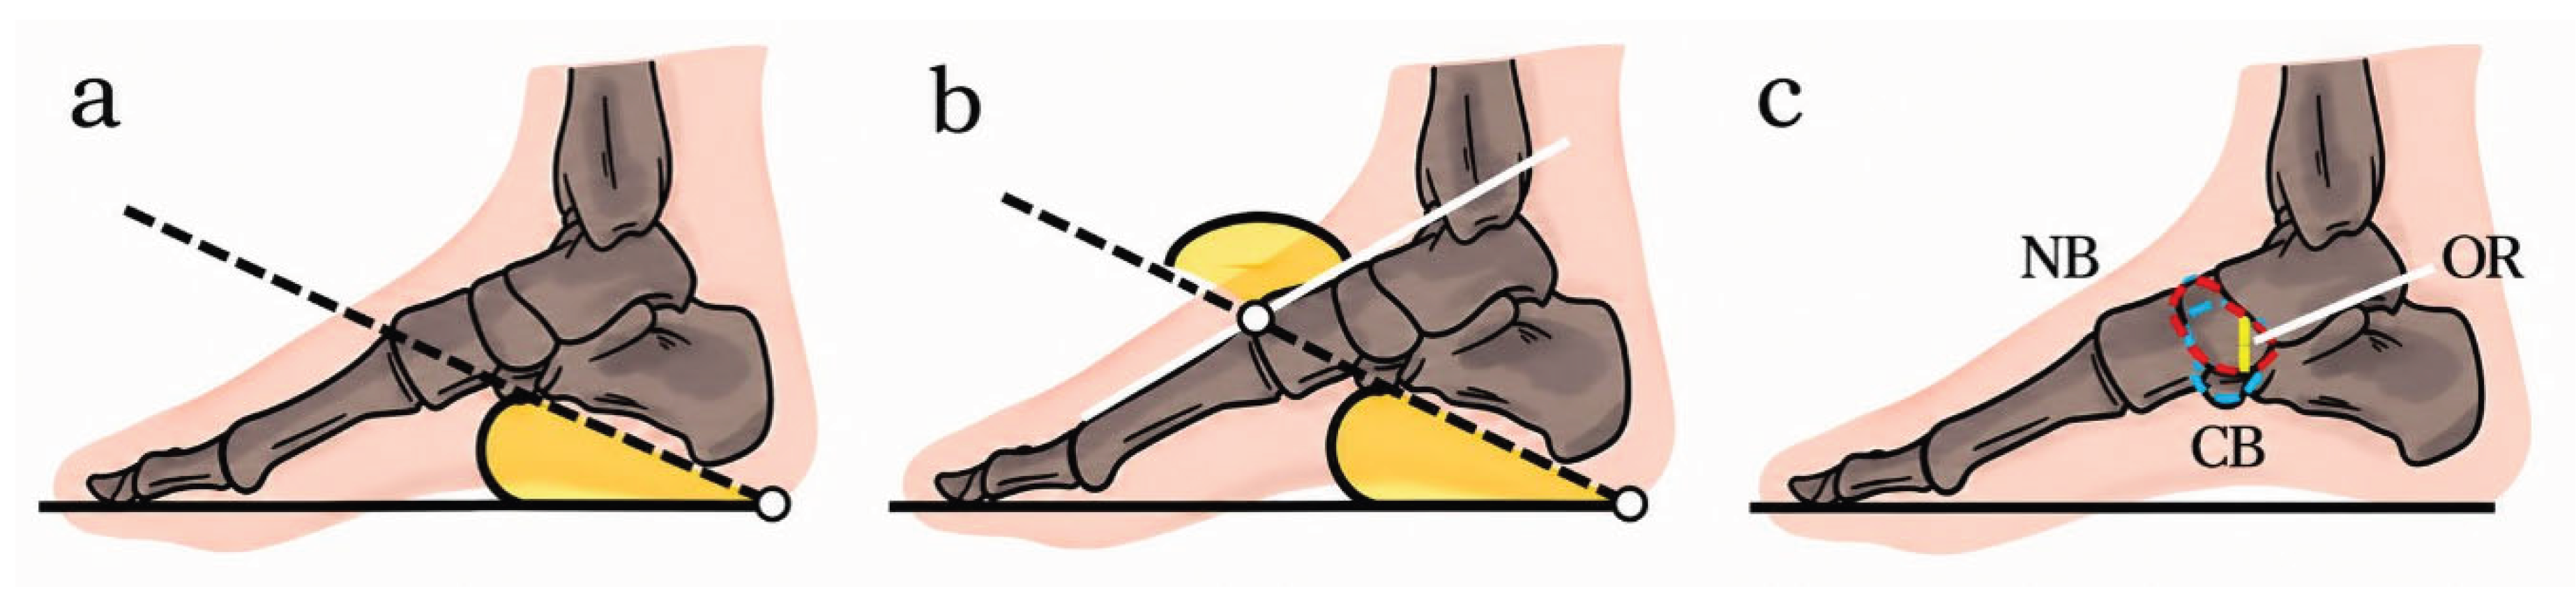

Table 1.
Participant characteristics.
| Sex | GFFT (n = 86) | RST (n = 83) | ||||
|---|---|---|---|---|---|---|
| M | F | M | F | |||
| Variables | ||||||
| 45 | 41 | 42 | 41 | |||
| Age (year) | 10.40 ± 1.74 | 10.66 ± 1.52 | 10.14 ± 1.85 | 10.62 ± 1.16 | ||
| Height (cm) | 152.82 ± 9.21 | 142.48 ± 9.83 | 153.52 ± 9.94 | 141.43 ± 9.11 | ||
| Weight (kg) | 52.30 ± 9.47 | 48.32 ± 7.07 | 51.85 ± 9.42 | 47.56 ± 7.34 | ||
| BMI (kg/m2) | 22.39 ± 4.87 | 23.80 ± 4.79 | 22.00 ± 4.91 | 23.78 ± 4.78 | ||
Data are presented as the mean ± standard deviation. BMI: body mass index; M: male; F: female; GFFT: general flat feet training; RST: rhythm step training.
Table 2.
GFFT and RST exercise programs.
| Intensity | RPE | Exercise | ||
| GFFT | RST | |||
| Warm-up | 1–12 weeks 30 reps × 3 sets |
6–9 | Foam rolling exercise | |
| Main Exercise |
1–2 weeks (5 s × 10 reps) × 3 sets |
10–12 | Toe exercise Calf raise Hip cell Hip bridge |
Toe exercise Full squat Calf raise Cat and dog core Jump |
| 3–7 weeks 30 reps × 3 sets |
Squat Lunge Balance |
Forward and backward Jump step (mat and trek) Side jump step (mat and trek) Cross step (mat and trek) Total jump step (mat and trek) |
||
| 8–12 weeks 30 reps × 3 sets |
Step box up and down Step box side up and down Step box jumping |
One leg forward step Back jump step Turn 180 jump steps |
||
| Cool-down | 1–12 weeks 30 reps × 3 sets |
6–9 | Achilles tendon stretching and foam rolling exercise | |
RPE: rating of perceived exertion; GFFT: general flat feet training; RST: rhythm step training; Reps: repetitions.
Table 3.
Changes in CPA, CFMA, and navicular–cuboid OR.
| Units: | Degree | |||||||
| Category | Variables | Side | Group |
Pre Intervention |
Post Intervention |
Effect | F | p |
| Arch | CPA | Lt | GFFT | 19.23 ± 3.43 | 20.05 ± 3.45† | G | 2.152 | 0.144 |
| RST | 18.93 ± 3.54 | 21.63 ± 2.54†# | T | 49.946 | 0.001*** | |||
| G × T | 14.371 | 0.001*** | ||||||
| Rt | GFFT | 19.50 ± 3.54 | 18.65 ± 3.26† | G | 3.418 | 0.066 | ||
| RST | 18.52 ± 3.12 | 21.28 ± 3.50†# | T | 13.418 | 0.001*** | |||
| G × T | 47.659 | 0.001*** | ||||||
| CFMA | Lt | GFFT | 135.50 ± 11.78 | 136.56 ± 5.50 | G | 3.522 | 0.062 | |
| RST | 136.67 ± 6.31 | 131.89 ± 5.83†# | T | 6.008 | 0.015* | |||
| G × T | 14.802 | 0.001*** | ||||||
| Rt | GFFT | 136.99 ± 5.84 | 136.73 ± 5.59 | G | 11.899 | 0.001*** | ||
| RST | 135.81 ± 5.73 | 132.92 ± 4.86†# | T | 12.462 | 0.001*** | |||
| G × T | 8.751 | 0.004** | ||||||
| Navicular–cuboid OR |
Lt | GFFT | 68.24 ± 14.09 | 65.87 ± 12.19 | G | 8.554 | 0.004** | |
| RST | 69.54 ± 13.52 | 54.69 ± 13.73†# | T | 52.952 | 0.001*** | |||
| G × T | 27.837 | 0.001*** | ||||||
| Rt | GFFT | 68.15 ± 13.48 | 65.06 ± 10.75† | G | 10.567 | 0.001** | ||
| RST | 68.23 ± 14.70 | 53.99 ± 12.57†# | T | 67.562 | 0.001*** | |||
| G × T | 27.992 | 0.001*** | ||||||
Data are presented as the mean ± standard deviation. CPA: calcaneal pitch angle; CFMA: calcaneal–first metatarsal angle; OR: overlap ratio; GFFT: general flat feet training; RST: rhythm step training; G: group; T: time; G × T: group × time; Lt: left foot; Rt: right foot; * p < 0.05, ** p < 0.01, *** p < 0.001. † significant pre–post change within group; # significant between-group difference at post (p < 0.05).
Table 4.
Changes in Isometric Ankle Muscle Functions.
| Units: | N·m | |||||||
| Category | Variables | Side | Group |
Pre Intervention |
Post Intervention |
Effect | F | p |
| Isometric Ankle Muscle Functions | Ankle PF | Lt | GFFT | 48.01 ± 8.46 | 60.49 ± 8.85† | G | 8.048 | 0.005** |
| RST | 48.08 ± 8.61 | 68.03 ± 9.05†# | T | 32123.382 | 0.001*** | |||
| G × T | 1703.817 | 0.001*** | ||||||
| Rt | GFFT | 47.38 ± 8.72 | 60.08 ± 9.14† | G | 6.063 | 0.015* | ||
| RST | 47.15 ± 9.43 | 67.04 ± 9.62†# | T | 1854.152 | 0.001*** | |||
| G × T | 90.362 | 0.001*** | ||||||
| Ankle DF | Lt | GFFT | 11.38 ± 4.93 | 18.50 ± 6.16† | G | 45.982 | 0.001*** | |
| RST | 11.41 ± 4.93 | 29.45 ± 5.13†# | T | 11924.261 | 0.001*** | |||
| G × T | 2246.287 | 0.001*** | ||||||
| Rt | GFFT | 11.68 ± 4.64 | 18.65 ± 5.66† | G | 54.780 | 0.001*** | ||
| RST | 11.71 ± 4.53 | 29.70 ± 4.78†# | T | 10438.471 | 0.001*** | |||
| G × T | 2034.577 | 0.001*** | ||||||
Data are presented as the mean ± standard deviation. GFFT: general flat feet training; RST: rhythm step training; G: group; T: time; G × T: group × time; Lt: left foot; Rt: right foot; * p < 0.05, ** p < 0.01, *** p < 0.001. † significant pre–post change within group; # significant between-group difference at post (p < 0.05).
Disclaimer/Publisher’s Note: The statements, opinions and data contained in all publications are solely those of the individual author(s) and contributor(s) and not of MDPI and/or the editor(s). MDPI and/or the editor(s) disclaim responsibility for any injury to people or property resulting from any ideas, methods, instructions or products referred to in the content. |
© 2026 by the authors. Licensee MDPI, Basel, Switzerland. This article is an open access article distributed under the terms and conditions of the Creative Commons Attribution (CC BY) license (http://creativecommons.org/licenses/by/4.0/).
Copyright: This open access article is published under a Creative Commons CC BY 4.0 license, which permit the free download, distribution, and reuse, provided that the author and preprint are cited in any reuse.