

Submitted:
29 September 2026
Posted:
29 September 2026
You are already at the latest version
Abstract
Thermotropic polymorphism of catanionic surfactants and its dependance on molecular structure was studied in seven catanionic surfactants with varying cationic and anionic chain lengths that were synthesized using isomerically pure para-alkylbenzene sulfonates as the anionic moiety and quaternary ammonium as its cationic counterpart. Thermal and structural properties of these materials were studied using TGA, DSC, POM, and VTXRD. A comparison of the thermotropic properties of these compounds with that of ortho/para mixture compounds derived from commercial alkylbenzene sulfonates is presented. Catanionic surfactants of corresponding alkylbenzene sulfonates exhibited similar thermal stabilities that did not show a dependance on the chain-length or the structural isomerism of the anionic moiety. All the isomerically pure compounds, except one, formed hexagonal crystalline phases at high temperatures. Their polymorphism depended on the number of alkyl chains, while the crystal formation was controlled by headgroup interactions. This behavior is different than that of surfactants synthesized from ortho/para mixtures. The temperature range over which polymorphs were formed in these materials showed a complex dependance on the isomeric purity, chain length, and number of alkyl chains.
Keywords:
catanionic surfactant
; hexagonal columnar phases
; surfactant liquid crystal
; surfactant crystal structure
; hexagonal phase
1. Introduction
Catanionic surfactants combine a cationic surfactant with an anionic surfactant with the inorganic counter ions removed [1]. They exhibit anisotropic phases over a wide temperature range, and some even exist as a liquid at room temperature. Surfactant ionic liquid crystals are a subclass of catanionic surfactants consisting of tight ion-pairs without a well-defined mesogenic group that exhibit liquid crystalline properties [2], commonly smectic and hexagonal columnar LC phases [3], and have a clearing temperature below 100 oC [4,5]. These compounds can display both lyotropic and thermotropic liquid crystalline behavior. Studies of the thermal properties of catanionic surfactants have provided insight into their mesomorphic and crystalline phases and elucidated structure-property relationships. The thermal phase behavior is principally dictated by several factors such as the polar head groups, chain lengths, the number of chains, and chain symmetry [6,7,8,9,10,11,12,13,14,15]. It is generally accepted that in catanionic surfactants, phase transitions are controlled by the ionic interaction between the headgroups and hydrophobic interactions between the hydrocarbon chains [16]. However, the dominant controlling factor largely depends on the molecular structures.
Catanionic surfactants and their phase behavior have been studied to better understand amphiphilic systems and their self-assembly in solid as well as aqueous phases [17,18]. These surfactants have a myriad of applications in everyday life and are integral in fuel cells, battery systems, chemical purification, and targeted drug delivery [19]. With the increasing diversity of the applications of liquid crystal surfactants, there is an increasing demand for a deeper understanding of this topic. Studies like those presented here will aid in tailor-designing and selecting the optimal surfactants for specific applications [20].
Small changes in the chemical structure of the cationic and its anionic counterpart can play a significant role in the observed thermal phase behavior like the existence and number of liquid crystalline and/or crystalline phases and their associated temperature ranges. In our previous study of catanionic surfactants derived from commercially available sodium dodecylbenzene sulfonate (DBS) and quaternary ammonium salts [12], we showed that some double chain N(Cn) DBS compounds, where the quaternary ammonium N is attached to one alkyl chain and some triple chain N(Cn)2 DBS compounds, where the quaternary ammonium N is attached to two alkyl chains, displayed room temperature hexagonal columnar liquid crystalline phases [12]. Although none of them existed as an ionic liquid, we believe the room temperature liquid crystal formation is due to the presence of “regioisomeric impurities” in the DBS counter ion in the commercially obtained DBS used in the synthesis. 1H NMR analysis of the commercially obtained DBS shows that it is a mixture of 1,4 and 1,2 substituted alkylbenzene sulfonates. The presence of such impurities may result in loose molecular packing and thus the formation of mesophases close to room temperature. It is even possible to have room temperature ionic liquids by varying the 1,4/1,2 ratio of the DBS counter ion. The study we published [12] did not consider these points, and the thermotropic properties and mesomorphism reported cannot be directly linked to structure-property relationships in the proper sense. Since it is difficult to find isomerically pure 1,4-alkylbenzene sulfonates from commercial sources, we synthesized them in our lab.
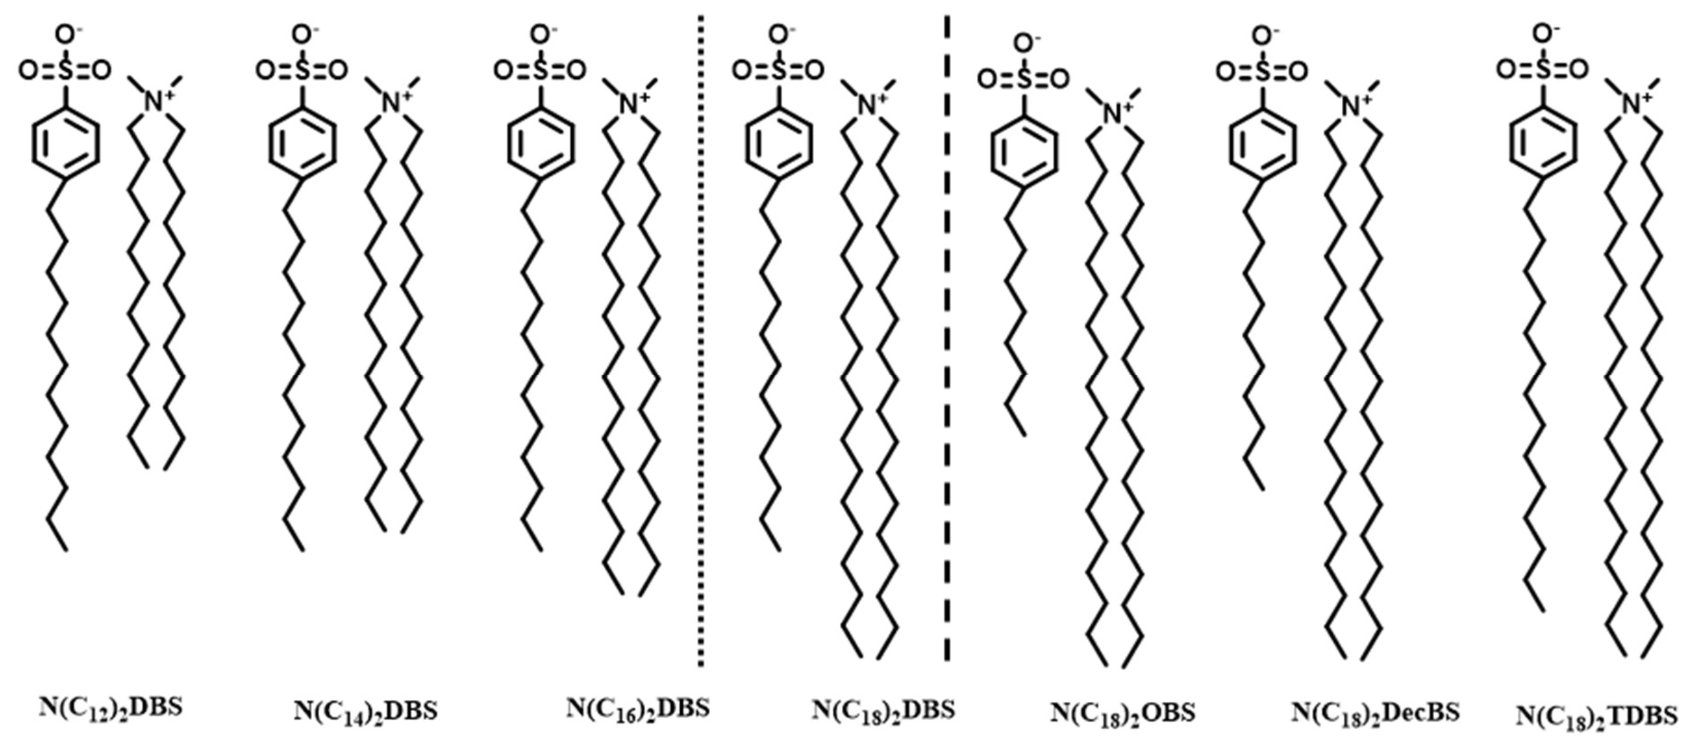
In this study, we aimed to explore the potential thermotropic mesomorphism of catanionic surfactants derived from isomerically pure (only 1,4 substituted alkylbenzene sulfonates) components using TGA, DSC, VTXRD, and POM to draw a comparison to the results we published using commercial alkylbenzene sulfonates. Rather surprisingly we discovered that using isomerically pure alkylbenzene sulfonates prevents the formation of mesophases and enhances the formation of crystalline phases. Figure 1 shows the structures of the synthesized surfactants analyzed in this study. In our previous study we looked at the effect of chain length variation of the cationic counterpart by varying its chain length from 12→14→16→18 while maintaining a constant anionic chain length of 12. In this study, in addition to varying cationic chain length with constant anionic chains, we also varied the anionic chain length while keeping the cationic chain length constant. Here, we compare the thermotropic properties of isomerically pure systems with that of the isomerically impure systems we previously published. Further, Marques et al. had published a study on the thermotropic properties of N(C18)2OBS [14]. We are unsure if the octylbenzene sulfonate (OBS) used in that study was isomerically pure. So, we prepared N(C18)2OBS from isomerically pure OBS and analyzed it for comparison. This will enhance the understanding of molecular packing and structure-property relationship in such systems.
Figure 1 represents the molecular structures of the catanionic surfactants studied in this paper. N(Cn)2 represents the cationic counterpart of a given catanionic surfactant.
2. Materials and Methods
2.1. Chemicals
Reagent grade octylbenzene, decylbenzene, dodecylbenzene and tetradecylbenzene were purchased from TCI America and used as received. Quaternary ammonium surfactants of different chain lengths were also purchased from TCI American and recrystallized once from acetone. ACS-grade concentrated sulfuric acid and sodium chloride were purchased from Fisher Scientific. Furthermore, sodium bicarbonate was obtained from Sigma Aldrich Corporation. Dichloromethane for the ion exchange was obtained from VWR.
3. Experimental
3.1. Synthesis of Alkylbenzene Sulfonates
Sulfonation of alkylbenzene was carried out using a modified literature procedure as shown in Scheme I [21]. The general experimental steps described below were used for the synthesis of all alkylbenzene sulfonates used in this study. N-alkylbenzene was first reacted with conc. sulfuric acid in a 1 to 1.3 molar ratio under reflux for one hour at approximately 80 oC. After cooling to room temperature, the reaction mixture was neutralized with a saturated aqueous solution of sodium bicarbonate, resulting in excessive foaming, which once subsided, resulted in a milky liquid. Saturated aqueous sodium chloride was slowly added to this reaction mixture to salt out the product, sodium p-alkylbenzene sulfonate. The product was collected through gravity filtration, and more sodium chloride solution was added to the filtrate to ensure all products were salted out. This additional precipitate was collected by filtration and combined with the product from the first filtration and airdried. The crude product was then recrystallized from acetone and dried. The average yield for the sodium para-alkylbenzene sulfonates was 23.8%.
Scheme 1 Illustrates the synthesis of a generic alkylbenzene sulfonate.
The room temperature 1H, and 13C nuclear magnetic resonance (NMR) spectra of the surfactants in CDCl3 were recorded in a VNMR 400 spectrometer at 400 and 100 MHz, respectively. Tetramethylsilane (TMS) was used as a reference for 1H and 13C nuclei. Figure 2 shows the 1H NMR spectra of the commercial DBS, which was used in our previous study and lab-synthesized isomerically pure para-DBS, which was used in the current study.
Signals in the aromatic region (roughly chemical shifts of 6 to 8 ppm) in the lab-synthesized sample show two distinct doublets which indicate 1,4 substituted benzene rings while the commercial sample show a multiplet in the aromatic region, indicating a mixture of 1,2 and 1,4 substituted benzene ring.
1H NMR and 13C NMR of a representative alkylbenzene sulfonate, sodium octylbenzene sulfonate, are shown in Figure 3. The presence of two doublets in the aromatic region in the 1H NMR spectrum confirms para-substitution of the benzene ring. This is further confirmed by the presence of only four distinct signals in the aromatic region of the 13C NMR spectra. Similar signal patterns were observed in the 1H and 13C NMR spectra of sodium DecBS, sodium DBS, and sodium TDBS.
3.2. Synthesis of Catanionic Surfactants
Scheme 2 illustrates the synthesis scheme of the catanionic surfactants using ion exchange metathesis.
The catanionic surfactants were prepared by dissolving the quaternary ammonium surfactants and sodium alkylbenzene sulfonates separately in dichloromethane, in a 1:1 molar ratio. These solutions were combined in a separatory funnel and washed with deionized water to remove the sodium halide. Aqueous AgNO3 was used to test for the presence of sodium halide after each washing. After 15-20 washes, the organic layer was separated and dried using anhydrous sodium sulfate and then filtered to remove the sodium sulfate. The filtrate was evaporated and the crude product was recrystallized from acetone and dried to obtain the products, which resulted in solid white powders, except for the N(C12)2 DBS, which was found to be a waxy substance at room temperature. These compounds were analyzed by elemental analyses by Atlantic Microlab, Norcross, GA and found to be pure.
4. Results and Discussions
4.1. IR Analysis
IR spectra of the sodium alkylbenzene sulfonates were obtained using a Thermo Fisher Scientific Nicolet iS5 FTIR spectrometer and analyzed using OMNIC software and are shown in supplementary materials (Figure S1-S4). All of them show consistent vibrational frequencies. The frequencies associated with these peaks and their assignments are as follows. The peak at ~3387 cm-1 corresponds to the O-H stretch from the residual sulfonic acid group which may result from interaction with moisture present in this sample. Aromatic ring H stretching frequencies are at 3060 cm-1. Aliphatic C-H stretching frequencies are observed from 2850 cm-1-2956 cm-1. Peaks at 1180 cm-1 and 1046 cm-1 correspond to the presence of sulfonate salt [22]. Aromatic ring skeletal vibrations are observed in the range of 1466 cm-1 – 1660 cm-1. IR spectra of catanionic surfactants are shown in Figure S5-S11. The observed frequencies are consistent across all samples. Sulfonate group signals are at 1190 cm-1 and 1037 cm-1 [22]. Ion pair interactions between the quaternary ammonium headgroup and the sulfonate group may be responsible for this shift in the frequency observed from that of the sodium alkylbenzene sulfonate.
4.2. NMR Analysis
1H NMR and 13C NMR spectra of all catanionic surfactants can be found in Figure S12 through Figure S25, in the supplementary materials. Two doublets in the aromatic region at 7.11 ppm and 7.76 ppm in the 1H NMR confirm the 1,4-substitution pattern of the benzene ring. Interestingly, the doublet at 7.76 ppm appears to be deshielded compared to that of the corresponding sodium alkylbenzene sulfonate indicating a tight ionic pairing between the quaternary ammonium headgroup and the sulfonate group. The CH2 group directly connected to the quaternary N, otherwise known as the α-CH2, is at 3.37 ppm. The two CH3 groups on the quaternary N are at 3.30 ppm. The chemical shift of the α -CH2 to the benzene ring is at 2.57 ppm and the other aliphatic CH2’s are at 1.25 ppm.
13C NMR of these catanionic surfactants show only three signals in the aromatic region. C1 and C4 of the benzene ring combined to give one signal at 144 ppm. However, in the sodium alkylbenzene sulfonate used, C1 and C4 gave two separate signals at 143 ppm and 146 ppm, respectively. C2 and C3 are at 125 ppm and 127 ppm respectively. The Alpha-C to the quaternary N is at 63.5 ppm and the methyl groups on the quaternary N are at 51 ppm. The remaining carbons of the aliphatic chains can be seen between 40-14 ppm.
4.3. Thermal Analysis
Thermogravimetric analysis was used to assess the thermal stability of the surfactants using a TA Instruments TA Q50, under an inert (nitrogen) atmosphere, at heating ramps of 10 °C·min⁻¹ between room temperature and 500 oC. Once the higher temperature limit was determined, differential scanning calorimetry (DSC) was carried out to determine the phase transition temperatures of the surfactants, using a TA Instruments DSC Q200, once more under a nitrogen atmosphere, at heating and cooling rates of 10 °C·min-1. The DSC thermograms were calibrated using high purity indium and tin reference standards. DSC data was analyzed using TA Instruments Universal Analysis 2000.
4.3.1. TGA Analysis
Figure 4 shows the TGA thermograms for the series with constant anionic and constant cationic counterparts.
When the anionic counterpart was constant and the cationic chain length varied, the lowest thermal stability was observed for the C12 chain. This material obtained 5% weight loss at 231 oC. The compounds with carbon chains lengths C14, C16, and C18 showed higher thermal stability compared to the C12 compound. The 5% weight loss temperatures were at 269 oC, 280 oC, and 275 oC, respectively for those compounds. Except for the C12 chain length the change in the cationic chain length does not have a significant impact on their thermal stabilities. A comparison of these isomerically pure samples with that of isomerically impure samples [12] shows that overall thermal stability did not significantly vary between the two systems. However, C12 isomerically pure samples have a lower thermal stability compared to its isomerically impure counterpart, while the C14 isomerically pure samples have higher thermal stability compared to its isomerically impure counterpart.
In the constant cationic series, the lowest thermal stability was observed for the N(C18)2DBS compound which showed 5% weight loss at 275 oC. While the other compounds N(C18)2OBS, N(C18)2DecBS, and N(C18)2TDBS showed 5% weight loss at 278 oC, 278 oC, and 281 oC, respectively. In the constant cationic series, thermal stability did not vary significantly with respect to the change in the anionic chain length. Moreover, this constant cationic series has slightly higher thermal stability compared to the constant anionic series discussed above. All samples showed a similar rate of decomposition except N(C12)2DBS, which decomposed at a faster rate. Alkyl sulfonate-based catanionic surfactants are reported to show slightly lower thermal stability than that of the alkylbenzene sulfonate based catanionic surfactants [14]. However, double chain alkyl sulfonates are found to have similar thermal stability to that of triple chain alkylbenzene sulfonates in this study [12]. There appears to be a dependence on the number of alkyl chains in alkylbenzene-based catanionics and their thermal stabilities. Double-chain alkylbenzene sulfonates are found to have higher thermal stability compared to triple or tetra-chain alkylbenzene sulfonates [12,16].
4.3.2. DSC
Figure 5 and Figure 6 show the DSC thermograms of the heating and cooling cycles obtained for the constant anionic series and constant cationic series, respectively. The thermograms are for the 3rd heating and cooling cycles at a rate of 10 oC/min under N2 atmosphere. Once the thermal history was established after the first heating, the remaining cycles show the same transitions, indicating the compounds in the observed temperature range are thermally stable. The reported transition temperatures, enthalpies, and entropies are shown in Table 1 and Table 2 for the constant anionic and constant cationic series, respectively and are the average values of multiple runs.
DSC analyses of these thermograms were conducted in the temperature range of –25 oC to 200 oC. These compounds exhibited several phase transitions within this temperature range. Above room temperature, the constant cationic series exhibited more phases and had higher transition temperatures than the constant anionic series. Moreover, all the transitions observed in the heating cycle are above room temperature for the constant cationic series, whereas three samples in the constant anionic series showed at least one transition below room temperature. In the constant anionic series, the number of transitions observed within this temperature range was three, four, four, and three, respectively for N(C12)2DBS, N(C14)2DBS, N(C16)2DBS, and N(C18)2DBS. To have better comparisons with the isomerically impure compounds in the previous study, only transitions above room temperature were considered for analysis. For this series, the transition before the isotropization had the highest ΔH value. The transitions are broader in C12 and C14 then became sharper in C16 and reverted to a broader transition in C18. The peak transitions temperatures for this series are shown in Figure 7. As the cationic chain length increased, the isotropization temperature, Ti, increased from 82.0 oC in N(C12)2DBS to 131.4 oC in N(C14)2DBS to 161.6 oC in N(C16)2DBS and decreased to 99.8 oC in N(C18)2DBS. The isomerically impure samples also showed an increasing trend first and then decreasing trend as the chain length increased for Ti [12]. It is noteworthy that the isotropization temperatures for the isomerically impure samples were higher than that for the isomerically pure samples. This is counterintuitive since one may think that a mixture of ortho and para substituted benzene moieties will cause loose molecular packing thus decreasing the isotropization temperature. However, it appears like a mixture of ortho, and para isomers is helping to “fill in the gap” in molecular packing. Thus, “filling in” primarily contributes to increased Van der Waals forces and significantly increases the melting point.
In the isomerically impure samples, there were only isotropization transitions observed from room temperature until the samples liquified; all those samples existed as room temperature liquid crystals. In the isomerically pure samples at room temperature, all samples exist as crystals.
The total enthalpy in the observed temperature range, ΔHovr, for transitions above room temperature in constant anionic series are 22.5 kJ/mol, 35.5 kJ/mol, 32.8 kJ/mol, and 30.9 kJ/mol for N(C12)2DBS, N(C14)2DBS, N(C16)2DBS, and N(C18)2DBS, respectively. As shown in Figure 8, ΔHovr and ΔSovr first increases from (C12)2 to (C14)2 and then decreases as the chain length increases. This is the same trend observed for isomerically impure samples and could be due to increased Van der Waals interactions as the chain extends from (C12)2 to (C14)2. However, conformational stability may dictate hydrophobic chain interactions as the chain gets longer and diminishes the effect of Van der Waals interactions between chains [12].
We observed higher ΔHovr and ΔSovr for the isomerically pure samples compared to the isomerically impure samples because isomerically pure samples exhibit multiple transitions with higher ΔH values.
As seen from Figure 7, the first transition temperatures in constant anionic series increase as the chain length increases but the isotropization temperatures increase and then decrease as the chain length increases. ΔHi and ΔSi, on the other hand, decreases and then increases as the chain length increased as observed in Table 1.
The first transition observed for N(C18)2DBS in its heating cycle at 62.35 oC is exothermic in nature with a ΔH value of –7.96 kJ/mol. However, the corresponding endothermic transition is absent in the cooling cycle. In our previous study [12], we have observed such exothermic transition on catanionics derived from single chain quaternary ammonium surfactants and DBS. Differential heating rate studies conducted in those samples verified the non-equilibrium nature of such transitions. This is referred to as cold crystallization and is generally observed in polymers [23,24]. We have included these exotherms in our calculations of ΔHovr because the net heat absorbed during heating can be matched with the net heat released during the cooling for the corresponding transition when we include this exothermic peak in our calculation.
The constant cationic series showed more complex polymorphism compared to the constant anionic series. Lower members displayed more phases than higher members. As in case of constant anionic series, constant cationic series also exhibit low hysteresis with some supercooling. In the case of the constant anionic series, as seen in Figure 7, the first transition temperatures show an increasing trend with respect to increasing chain length. Enthalpy change per CH2 group, calculated from Figure 8 and Figure 10 across the seven compounds studied, with variation in chain length is not constant nor does it show any trend in these series. However, an increase in enthalpy change per CH2 with increase in chain length has been reported previously in different catanionic surfactants [14].
X-ray studies (see below) show that liquid crystalline phases were not observed after the largest transition in these samples, suggesting the largest transition is a crystal-crystal transition. These larger endotherms indicate the stronger Van der Waals interactions in the solid state before that transition. After that transition, the ion-ion headgroup interaction is maintaining the crystalline order as the sample approaches isotropization.
Ti for this series shows a decreasing trend as the chain length increased. This same trend was reported for anionic chain length variation for sulfate-based catanionic surfactants [14]. ΔHovr for this series are 39.90 kJ/mol, 33.15 kJ/mol, 30.91 kJ/mol and 40.73 kJ/mol, respectively for N(C18)2OBS, N(C18)2DecBS, N(C18)2DBS, and N(C18)2TDBS. This is an inverted trend compared to that of the constant anionic series. ΔHovr and ΔSovr are larger in both isomerically pure constant cationic and constant anionic series and have comparable magnitudes. However, the isomerically impure samples had significantly lower magnitudes for ΔHovr. This could be indicating less ordered alkyl chains in isomerically impure samples, this suggests the liquid crystalline phase is maintained from room temperature to Ti primarily through headgroup interactions in those samples.
N(C18)2OBS was previously studied by Marques et al. [14]. It is not clear if the octylbenzene sulfonate used in that study was isomerically pure [14]. A comparison of the DSC results of the isomerically pure sample we prepared with that of Marques et al. shows mostly comparable thermal transitions with some distinctions. As in our study, Marques et al.’s article reported four transitions in the heating cycle of that compound [14]. Also, the transition temperature reported also falls within the range we observed. However, the enthalpy of transition varies significantly. For our study, the first transition at 59.6 oC had the lowest transition enthalpy (0.51 kJ/mol) and the second transition at 69.5 oC had the highest transition enthalpy (23.69 kJ/mol). In their study, on the other hand, the first transition at 57.9 oC had the highest enthalpy (50.4 kJ/mol) and the second transition at 75.0 oC had the second highest enthalpy (26.9 kJ/mol). The last transition in our study was at 145.1 oC and in their study it was at 139.1 oC. The transition enthalpies were 1.8 kJ/mol and 2.4 kJ/mol, respectively.
It can’t be deduced by comparing the DSC data with that of our sample if the N(C18)2OBS sample studied by Marques et al. was isomerically pure or not, but it should be noted that ΔHovr for our N(C18)2OBS sample is significantly lower than theirs. It is uncertain the cause of such variation.
It is reported that lower asymmetry, chain length, and higher headgroup charge density generally induce higher transition temperatures, entropy values, and higher number of phase transitions [14]. This was partly true for the constant anionic series in this study, where the highest transition temperature was observed for N(C16)2DBS, which was considered to have the highest chain symmetry. The benzene ring in the alkybenzene sulfonate can be considered contributing to the alkyl chain length by 4-5 carbons [25,26]. However, in the constant cationic series, the highest transition temperature and enthalpy were observed for N(C18)2OBS, which has the highest asymmetry. Further, sharper transitions were observed for the most symmetric compounds N(C16)2DBS and N(C18)2TDBS in their respective series.
Notice that N(C18)2DBS is part of both series. DSC thermograms show an exothermic transition in the heating cycle of N(C18)2DecBS at 53.4 oC, similar to N(C18)2DBS, which was discussed in the constant anionic series. Again, a corresponding endothermic transition is absent in the cooling cycle of this sample. In both these samples, this exothermic transition appears right before the largest endothermic transition. The exotherms of these transitions were -7.1 kJ/mol and -7.96 kJ/mol for N(C18)2DecBS and N(C18)2DBS, respectively. Again, this phenomenon is commonly observed in polymers, where a glass transition is followed by crystallization. A closer look at these transitions shows a small endothermic transition before the exothermic transition in N(C18)2DecBS whereas in N(C18)2DBS the endothermic transition can be seen as a broad transition ranging from 11 oC to 53 oC (See Supplementary Material). The enthalpies of these transitions are 1.7 kJ/mol and 3.2 kJ/mol for N(C18)2DecBS and N(C18)2DBS, respectively. We have not conducted any variable heating rate studies on these samples. However, it is reasonable to assume the non-equilibrium nature of these transitions based on our previous report [12].
Figure 9.
Peak transition temperature chart for the constant cationic surfactants.
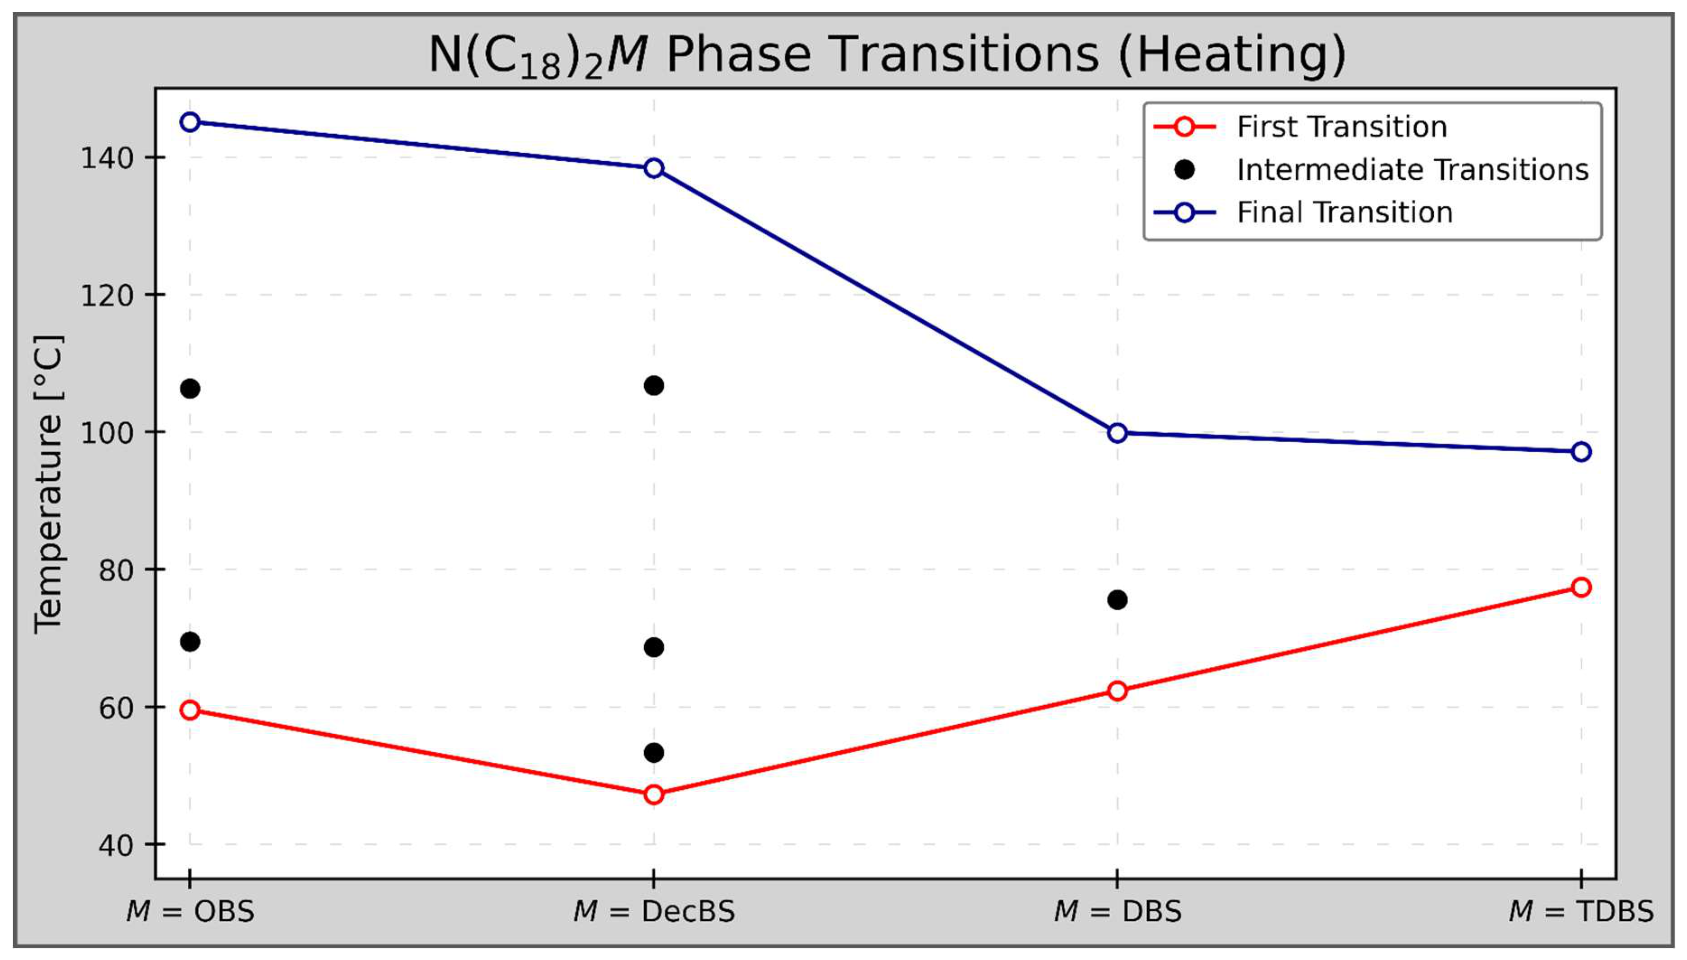
Figure 10.
Overall ΔHovr (blue, right) and ΔSovr (green, left) for the constant cationic surfactants as a function of number of CH2 groups in the hydrophobic chain.
Figure 10.
Overall ΔHovr (blue, right) and ΔSovr (green, left) for the constant cationic surfactants as a function of number of CH2 groups in the hydrophobic chain.
4.5. Polarized Optical Microscopy (POM)
All materials were studied using polarized optical microscopy. Surfactants were heated on a Linkam Scientific LTS420E hot stage with an optical window through a Linkam T96-HS temperature controller with temperatures controlled to ±0.1 °C. Surfactants in the isotropic phase were loaded via capillary action into Instec glass cells with a ~7.7μm gap and antiparallel photo alignment layer. Photomicrographs were captured using a 2MP SPOT Insight Camera mounted onto a Nikon OPTIPHOT2-POL microscope between crossed polarizers. For all images, the alignment layer is at a 15° clockwise rotation from the vertical polarizer. The backlight calibration at this small angle is optimal when trying to observe LC phases as those optical features, when aligned with one polarization axis, are still visible and distinctly different from those of the isotropic phase. The cells were heated/cooled during imaging at a fast rate of 10 °C/min. While not optimal for greater transition details, this rate was chosen in response to the polymorphic transitions that were very subtle at lower heating/cooling rates.
While photomicrographs of all the materials were taken as a function of temperature and studied, no characteristic LC patterns were observed. In fact, the only unique photomicrographic sequences were those that showed a transition between crystalline phases. Characteristic photo micrographs captured during a cooling cycle are shown in Figure 11, Figure 12 and Figure 13 below.
The optical qualities of each surfactant appeared to indicate a crystalline structure that were similar for all materials. Each crystal structure appeared out of the isotropic with many nucleation sites (not a fast “wavefront” transition characteristic of LC phases), with later polymorphic transitions from hexagonal to lamellar presenting with the appearance of a “crystalline film” coating the initial backbone crystal structure with significantly fewer nucleation sites. Furthermore, these surfactants displayed remarkable thermal stability through consistent crystalline features and transition temperatures across multiple heating/cooling cycles.
4.6. Variable-Temperature X-Ray Diffraction (VTXRD)
Variable-temperature X-ray diffraction (VTXRD) was measured using a Rigaku Screen Machine. The surfactants, in epoxy sealed 1 mm quartz capillaries, were placed inside a Linkam HFS350X-Cap capillary hot stage ~62 mm away from the 2D detector, with the temperature controlled to ± 0.1 °C with a Linkam T96-HS temperature controller. A magnetic field of ~2.5 kG was applied to the samples using a pair of samarium cobalt permanent magnets. The scattering patterns were collected using a Mercury 3 CCD detector with a resolution of 1024×1024 pixels (size: 73.2 µm×73.2 µm) and copper Kα radiation generated by a microfocus sealed X-ray tube with a copper anode (λ = 1.542 Å). The data were analyzed using publicly available fit2D software to correct for background scattering and generate intensity vs scattering vector, I-q curves. Spectra were taken in 5 oC steps from the isotropic phase to 50 oC. A typical recorded x-ray phase profile is shown in Figure 14.
The corresponding I-q curve is fit using a nonlinear fit algorithm through Mathematica. The high-intensity peaks in q-space correspond to intermolecular distances in real space or “d-spacings” via the conversion . The ratio of these d-spacings allows for the determination of the structure of the diffracting object [27]. A lamellar structure is indicated when the d-spacings have values in the ratio of 1, ½:⅓, ¼,… Generally, two to three such d-spacings were observed here. For a hexagonal structure, the lines appear in the ratio 1,,½, … The graphs of d-spacings vs temperature for all the materials are similar except for N(C12)2DBS that exhibited no hexagonal phase. Therefore, they are not all shown here but are in supplemental materials (Figure S47-S64). The d-spacings vs temperature for N(C18)2DecBS are shown in Figure 15. There are further lines at smaller d-spacings that are due in part to the hydrocarbon chains and are not shown for clarity.
In the hexagonal phase the measured ratio of the d-spacings is 1, , ½ to three decimal points. In the lamellar phase the measured ratios are 1, ½,⅓, ⅕ once more to three decimal points. The d-spacing corresponding to ¼ does not appear due to the molecular scattering factor [28]. This confirms the structure assignment given in Figure 15.
Because all the d-spacing vs. temperature graphs are so similar these data are summarized in Table 3.
Note that due to differences in equipment these temperatures are not the same as those obtained in DSC. An interesting feature of these data is that despite the different chain lengths, the d-spacing in the isotropic phase, which for many rod-like objects is generally a good measure of the length of the molecules, exhibits no systematic trends. This result is summarized in Table 4. Another feature is that the d-spacing of the lamellar phase is always larger than the d-spacing of the isotropic phase. The average ratio when both phases are present is also in Table 4. Finally, the theoretical prediction for a 2D hexagonal phase is that the largest d-spacing is of the molecular length [28]. While there is some material and temperature variation when the isotropic and hexagonal phase are in equilibrium, the ratio of dhex/diso is within a few percent of the predicted value. The range and average value of this quantity are also shown in Table 4.
These data strongly suggest that the d-spacing in the isotropic phase is close to the aggregate length and that in the lamellar phase two aggregates overlap with approximately 50% overlap except as stated earlier, N(C12)2DBS is an outlier.
The d-spacing observed in these compounds increases with chain length. This same trend was reported for other compounds [29]. Further, d-spacing is longer for the isomerically pure compounds. This could be due to ortho/para mix of dodecylbenzene sulfonate allowing close chain packing thus lowering d-spacing. Another indication this might be the case is the high isotropization temperature observed for the isomerically impure compounds probably due to increased Van der Waals interactions.
N(C18)2OBS was reported by Marques et al. as having SmA phase between temperature ranges 116 °C- 135 °C solely based on POM results [14]. Our VTXRD analysis of this compound in the same temperature range shows the hexagonal phase. It is possible that Marques et al.’s compound was isomerically impure thus formed liquid crystalline phase as in our isomerically impure compound which we previously published. However, in those samples we observed columnar hexagonal liquid crystalline phase not the SmA phase.
5. Conclusion
A total of seven catanionic surfactants with quaternary ammonium and benzene sulfonates headgroups were studied with the aim of understanding the effect of chain length and structural isomerism on their thermal properties. The thermal stability of the samples did not show dependance on anionic or cationic chain length variations or isomeric purity. But as the number of alkyl chains increased, thermal stability decreased slightly. Isotropization transitions showed a similar trend in both isomerically pure and impure compounds, indicating as the chain length increases, conformational disorder increases and affects molecular packing. Generally, the type of phase formed is governed primarily by the nature of headgroup interaction. In alkylsulfonate or alkylbenzene sulfonate quaternary ammonium paired headgroups, columnar hexagonal (Colh) meso phase is what is commonly observed [12,14,30,31]. It is also reported that such headgroups with double-chain p-alkylbenzene sulfonates form columnar hexagonal phases on heating [16]. These observations strongly suggest that Colh formation is primarily driven by the headgroup interactions, and the chains have less impact on their formation. These headgroups also are reported showing Colh LC phase in aqueous gels [32]. However, in alkylbenzene sulfonate-quaternary ammonium paired headgroups, when isomerically pure alkylbenzene sulfonate is used, a hexagonal crystalline phase is observed not a liquid crystalline phase.
Variation in the chain length of the cationic or anionic counterpart in the compounds we studied did not have observable effects on the type of phases formed. The polymorphism in these compounds, on the other hand, are controlled by the number and nature of the alkyl chains. Chain length symmetry seems to have a reverse effect in the series studied on polymorphism. In the constant anionic series, the number of phase transitions increases with increasing chain symmetry where N(C16)2DBS has the highest symmetry and highest number of transitions. In the constant cationic series, on the other hand, most number of transitions were observed for the compound with the least symmetry, N(C18)2OBS.
The isomeric purity of alkylbenzene sulfonate has a pronounced effect on polymorphism, enthalpy, and entropy of transitions in these compounds. Isomerically impure samples showed no polymorphism in the triple chain series and caused the compound to exist as a room temperature liquid crystal [12]. Isomeric impurity also caused the isotropization temperature to be higher. VTXRD data suggests structural isomerism of the counterions in catanionic surfactants have significant impact on packing parameters like d-spacing, but the chain length variations in counterions do not have much impact on such parameters. POM data supports VTXRD data and confirms the formation of crystalline phases at high temperatures.
Cold crystallization was observed for two samples N(C18)2DBS and N(C18)2DecBS in this study. A similar phenomenon was observed for the double chain series (CH3)3N(C12)DBS and (CH3)3N(C14)DBS previously reported. All these samples except N(C12)2DBS showed hexagona crystalline phase at high temperatures. The fact that isomerically impure N(C12)2DBS showed Colh liquid crystalline phase at room temperature indicates that structural isomerism of the surfactant counterparts has a major influence on the molecular packing and can facilitate liquid crystal formation or crystal formation in such compounds. Further, we established that isomerically pure N(C18)2OBS exhibits a hexagonal crystal phase at high temperatures suggesting that SmA phase formation previously reported for this compound by Marques et al. may be due to isomeric impurities in that compound.
Supplementary Materials
The following supporting information can be downloaded at the website of this paper posted on Preprints.org
Author Contributions
R. Jose. designed the overall research scheme, oversaw syntheses, structure characterization and drafted the manuscript. R. Rawal and A. Sanchez synthesized the compounds, A.S collected IR data and analyzed DSC, TGA data and expanded the manuscript. S. Lee Cox, H. Han, and P. K. Bhowmik obtained TGA, DSC, and NMR data. PKB helped with manuscript writing and review. VTXRD and POM data collection, analysis, and discussion were done by C. Schmiedl and M. Fisch. C. S and M. F also helped manuscript writing and revisions. All authors have read and agreed to the published version of the manuscript.
Data Availability Statement
Data is contained within the article and Supplementary materials.
Acknowledgments
We thank Robert A. Welch Foundation for the Departmental Grant (BJ-0027) to the University of Houston-Downtown Natural Sciences Department for the financial support for this study and for supporting undergraduate student participants A. M. Sanchez Medina and R. Rawal through undergraduate research scholarship. Chris Schmiedl, Michael Fisch are supported by NSF. The work in Kent was funded by The National Science Foundation, (USA) under grant DMR-2211347(M.R.F.).
Conflicts of Interest
The authors declare no conflict of interest.
Abbreviations
Dodecylbenzene sulfonate (DBS)
Decylbenzene sulfonate (DecBS)
Octylbenzene sulfonate (OBS)
Tetradecylbenzene sulfonate (TDBS)
Differential Scanning Calorimetry (DSC)
Thermal Gravimetric Analysis (TGA)
Polarizing Optical Microscopy (POM)
Columnar Hexagonal (Colh)
Smectic-A (SmA)
Variable-Temperature X-ray Diffraction (VTXRD)
Liquid Crystalline (LC)
Enthalpy of isotropiztion (∆Hi)
Total enthalpy change in the observed temperature range (∆Hovr)
Entropy of isotropization (∆Si)
Total entropy change in the observed temperature range (∆Sovr)
Temperature of isotropization (Ti)
Room temperature (RT)
References
- Khan, A.; Marques, E. Catanionic surfactants. In Specialist Surfactants [Internet]; Robb, I.D., Ed.; Springer Netherlands: Dordrecht, 1997; pp. 37–80. Available online: http://link.springer.com/10.1007/978-94-009-1557-2_3.
- Binnemans, K. Ionic Liquid Crystals. Chem. Rev. 2005, 105(11), 4148–4204. [Google Scholar] [CrossRef] [PubMed]
- Huang, Z.; Li, X.; Chen, M.; et al. Guanosine-based thermotropic liquid crystals with tunable phase structures and ion-responsive properties. J. Colloid Interface Sci. 2019, 553, 269–279. [Google Scholar] [CrossRef] [PubMed]
- El Seoud, O.A.; Keppeler, N.; Malek, N.I.; et al. Ionic Liquid-Based Surfactants: Recent Advances in Their Syntheses, Solution Properties, and Applications. Polymers 2021, 13(7), 1100. [Google Scholar] [CrossRef] [PubMed]
- Chiappisi, L.; Yalcinkaya, H.; Gopalakrishnan, V.K.; et al. Catanionic surfactant systems—thermodynamic and structural conditions revisited. Colloid Polym. Sci. 2015, 293(11), 3131–3143. [Google Scholar] [CrossRef]
- Li, H.; Wieczorek, S.A.; Xin, X.; et al. Phase Transition in Salt-Free Catanionic Surfactant Mixtures Induced by Temperature. Langmuir 2010, 26(1), 34–40. [Google Scholar] [CrossRef] [PubMed]
- Svenson, S. Controlling surfactant self-assembly. Curr. Opin. Colloid Interface Sci. 2004, 9(3–4), 201–212. [Google Scholar] [CrossRef]
- Li, Y.; Li, H.; Chai, J.; et al. Self-Assembly and Rheological Properties of a Pseudogemini Surfactant Formed in a Salt-Free Catanionic Surfactant Mixture in Water. Langmuir 2015, 31(41), 11209–11219. [Google Scholar] [CrossRef] [PubMed]
- Tomašić, V.; Popović, S.; Filipović-Vinceković, N. Solid State Transitions of Asymmetric Catanionic Surfactants. J. Colloid Interface Sci. 1999, 215(2), 280–289. [Google Scholar] [CrossRef] [PubMed]
- Silva, B.F.B.; Marques, E.F. Thermotropic behavior of asymmetric chain length catanionic surfactants: The influence of the polar head group. J. Colloid Interface Sci. 2005, 290(1), 267–274. [Google Scholar] [CrossRef] [PubMed]
- Brito, R.O.; Marques, E.F.; Gomes, P.; et al. Structure/Property Relationships for the Thermotropic Behavior of Lysine-Based Amphiphiles: from Hexagonal to Smectic Phases. J. Phys. Chem. B 2008, 112(47), 14877–14887. [Google Scholar] [CrossRef] [PubMed]
- Jose, R.; Patel, T.J.; Cather, T.A.; et al. Thermotropic mesomorphism in catanionic surfactants synthesized from quaternary ammonium surfactants and sodium dodecylbenzenesulfonate: Effect of chain length and symmetry. Colloids Surf. A Physicochem. Eng. Asp. 2014, 461, 40–49. [Google Scholar] [CrossRef]
- Marques, E.F.; Burrows, H.D.; Da Graca Miguel, M. The structure and thermal behaviour of some long chain cerium(III) carboxylates. Faraday Trans. 1998, 94(12), 1729–1736. [Google Scholar] [CrossRef]
- Marques, E.F.; Brito, R.O.; Wang, Y.; et al. Thermotropic phase behavior of triple-chained catanionic surfactants with varying headgroup chemistry. J. Colloid Interface Sci. 2006, 294(1), 240–247. [Google Scholar] [CrossRef] [PubMed]
- Abdallah, D.J.; Robertson, A.; Hsu, H.-F.; et al. Smectic Liquid-Crystalline Phases of Quaternary Group VA (Especially Phosphonium) Salts with Three Equivalent Long n -Alkyl Chains. How Do Layered Assemblies Form in Liquid-Crystalline and Crystalline Phases? J. Am. Chem. Soc. 2000, 122(13), 3053–3062. [Google Scholar] [CrossRef]
- Tomašić, V.; Mihelj, T.; Zhang, R.; et al. Mesomorphism of a new series of catanionic 4-(1-pentylheptyl)benzenesulfonates. Soft Matter 2014, 10(39), 7887–7896. [Google Scholar] [CrossRef] [PubMed]
- Sunnapu, O.; Ravipati, P.; Srinath, P.; et al. Design of cationic amphiphiles for generating self-assembled soft nanostructures, micelles and hydrogels. Bull. Mater. Sci. 2020, 43(1), 172. [Google Scholar] [CrossRef]
- Ghosh, S.; Ray, A.; Pramanik, N. Self-assembly of surfactants: An overview on general aspects of amphiphiles. Biophys. Chem. 2020, 265, 106429. [Google Scholar] [CrossRef] [PubMed]
- Shaban, S.M.; Kang, J.; Kim, D.-H. Surfactants: Recent advances and their applications. Compos. Commun. 2020, 22, 100537. [Google Scholar] [CrossRef]
- Sachin, K.M.; Karpe, S.A.; Singh, M.; et al. An Interaction of Anionic- and Cationic-Rich Mixed Surfactants in Aqueous Medium through Physicochemical Properties at Three Different Temperatures. J. Chem. 2018, 2018, 1–17. [Google Scholar] [CrossRef]
- Vogel, A.I.; Furniss, B.S. Vogel’s textbook of practical organic chemistry, 5th ed. rev.; Longman scientific & technical J. Wiley & sons: Harlow (GB) New York, 1991. [Google Scholar]
- Silverstein, R.M.; Bassler, G.C.; Morrill, T.C. Spectrometric identification of organic compounds, 5th ed.; Wiley: New York, 1991. [Google Scholar]
- Acree, W.E.; Chickos, J.S. Phase Change Enthalpies and Entropies of Liquid Crystals. J. Phys. Chem. Ref. Data 2006, 35(3), 1051–1330. [Google Scholar] [CrossRef]
- Cheng, X.; Bai, X.; Jing, S.; et al. Self-Assembly of Imidazolium-Based Rodlike Ionic Liquid Crystals: Transition from Lamellar to Micellar Organization. Chem. A Eur. J. 2010, 16(15), 4588–4601. [Google Scholar] [CrossRef] [PubMed]
- Demus, D. (Ed.) Handbook of liquid crystals. In Fundamentals; Wiley-VCH: Weinheim New York Chichester, 1998; Vol. 1. [Google Scholar]
- Wingert, L.M.; Jeffrey, G.A.; Jahangir; et al. Liquid crystal properties of 4- n -alkylphenyl D-glucopyranosides. Liq. Cryst. 1993, 13(3), 467–470. [Google Scholar] [CrossRef]
- Ohta, K. Physics and chemistry of molecular assemblies; World Scientific: New Jersey, 2020. [Google Scholar]
- Acharya, B.R.; Kang, S.-W.; Prasad, V.; et al. Role of Molecular Structure on X-ray Diffraction in Uniaxial and Biaxial Phases of Thermotropic Liquid Crystals. J. Phys. Chem. B 2009, 113(12), 3845–3852. [Google Scholar] [CrossRef] [PubMed]
- Oliveira, I.S.; Loureiro, E.C.; Garcia-Rio, L.; et al. Tuning the formation of thermotropic ionic liquid crystals through the spacer length in 14-s-14 gemini surfactants. J. Mol. Liq. 2025, 437, 128334. [Google Scholar] [CrossRef]
- Caria, A.; Khan, A. Phase Behavior of Catanionic Surfactant Mixtures: Sodium Bis(2-ethylhexyl)sulfosuccinate−Didodecyldimethylammonium bromide−Water System. Langmuir 1996, 12(26), 6282–6290. [Google Scholar] [CrossRef]
- Ungar, G.; Tomašić, V.; Xie, F.; et al. Structure of Liquid Crystalline Aerosol-OT and Its Alkylammonium Salts. Langmuir 2009, 25(18), 11067–11072. [Google Scholar] [CrossRef] [PubMed]
- Jurašin, D.; Vinceković, M.; Pustak, A.; et al. Lamellar to hexagonal columnar liquid crystalline phase transition in a catanionic surfactant mixture: dodecylammonium chloride–sodium bis(2-ethylhexyl) sulfosuccinate. Soft Matter 2013, 9(12), 3349. [Google Scholar] [CrossRef]
Figure 1.
Molecular structures of the catanionic surfactants studied. The constant chain length anionic component is paired with different cationic moieties for the four surfactants to the left of the dashed line. Those that have the same cationic moiety are paired with different anionic moieties to the right of the dotted line.
Figure 1.
Molecular structures of the catanionic surfactants studied. The constant chain length anionic component is paired with different cationic moieties for the four surfactants to the left of the dashed line. Those that have the same cationic moiety are paired with different anionic moieties to the right of the dotted line.
Scheme 1.
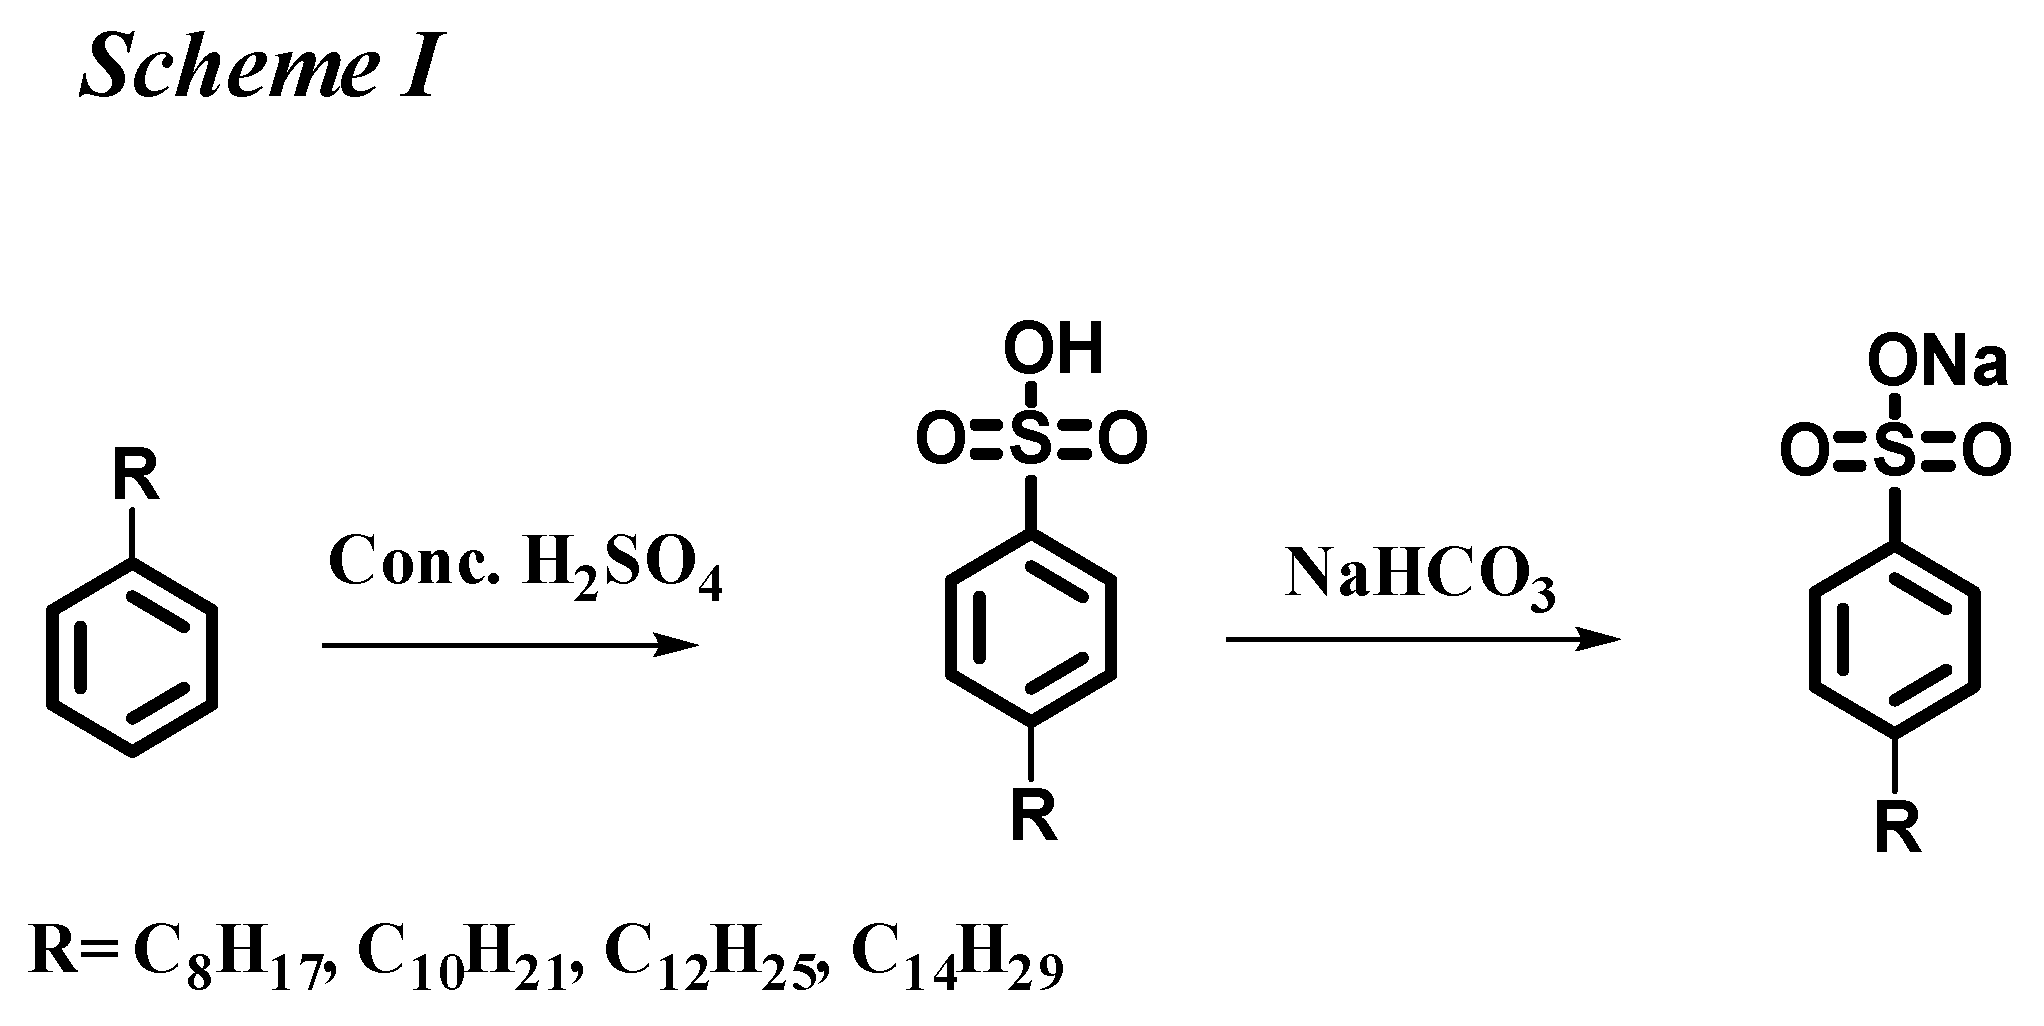
Figure 2.
1H NMR spectra of isomeric DBS (left) and lab-synthesized isomerically pure para-DBS (right).
Figure 2.
1H NMR spectra of isomeric DBS (left) and lab-synthesized isomerically pure para-DBS (right).
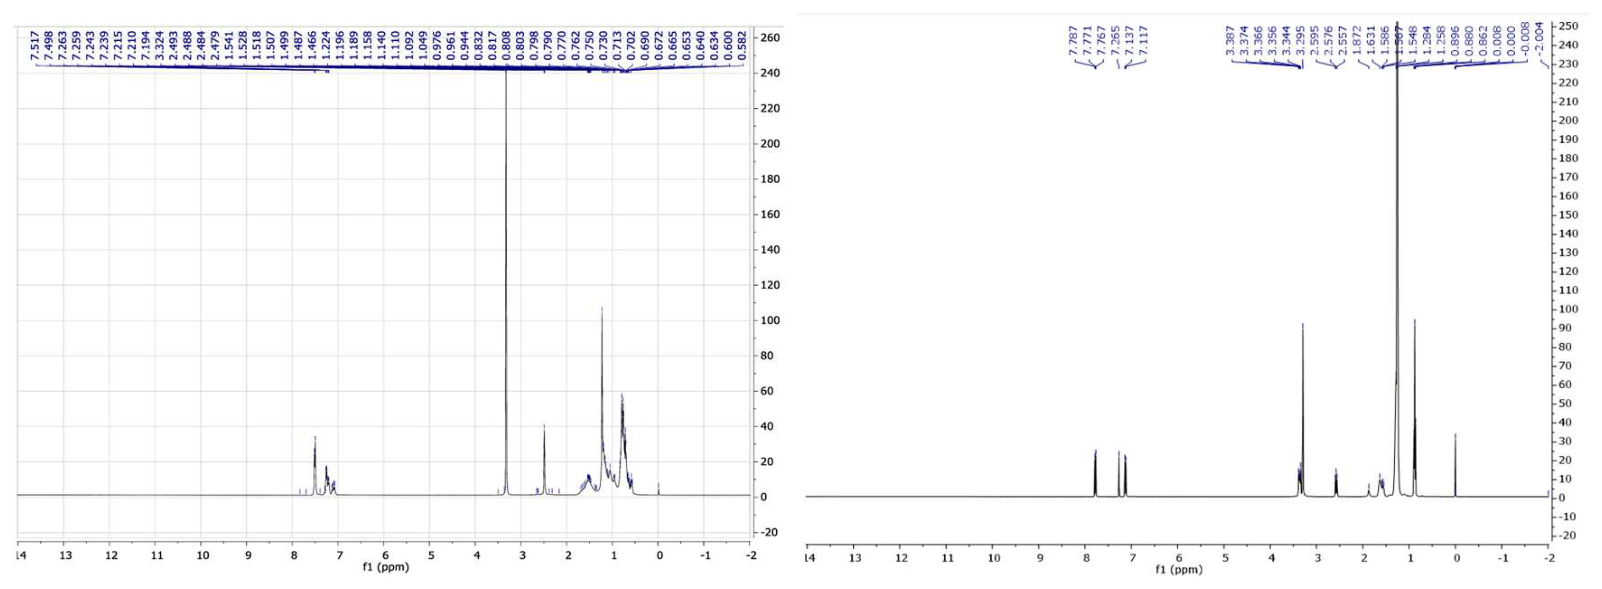
Figure 3.
1H NMR spectrum (left) and 13C NMR spectrum (right) of the lab synthesized sodium n-octylbenzene sulfonate.
Figure 3.
1H NMR spectrum (left) and 13C NMR spectrum (right) of the lab synthesized sodium n-octylbenzene sulfonate.
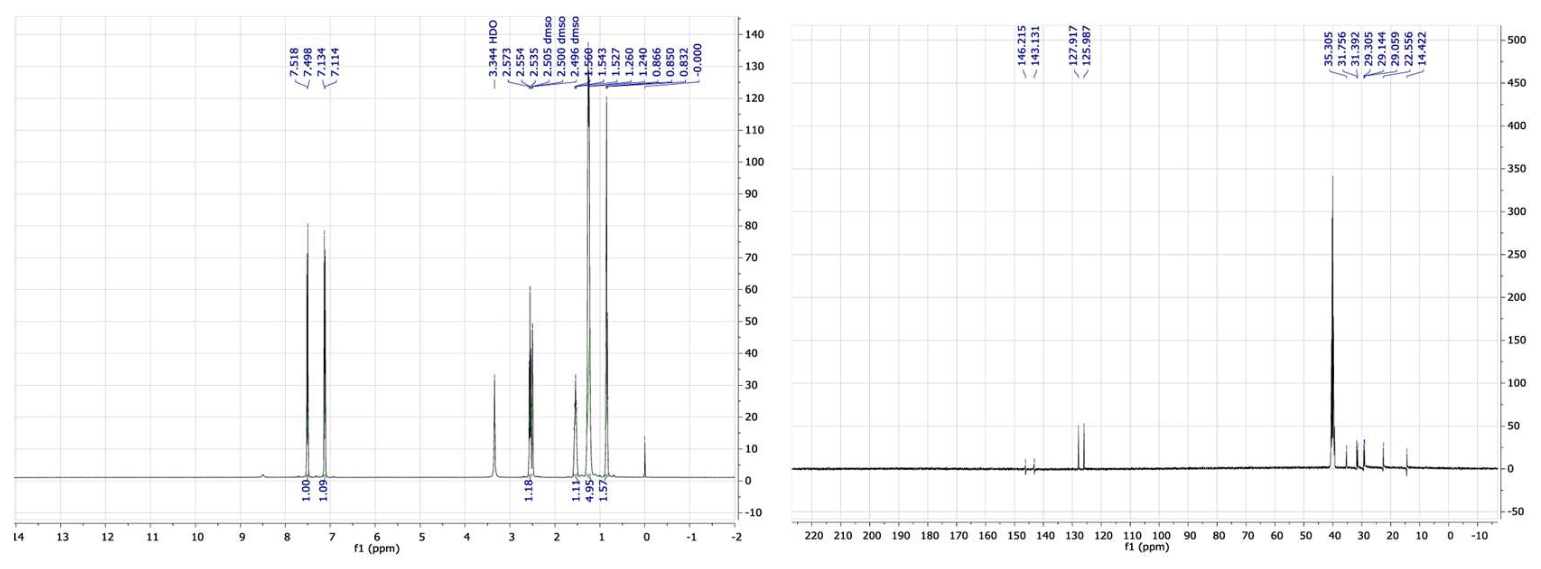
Scheme 2.
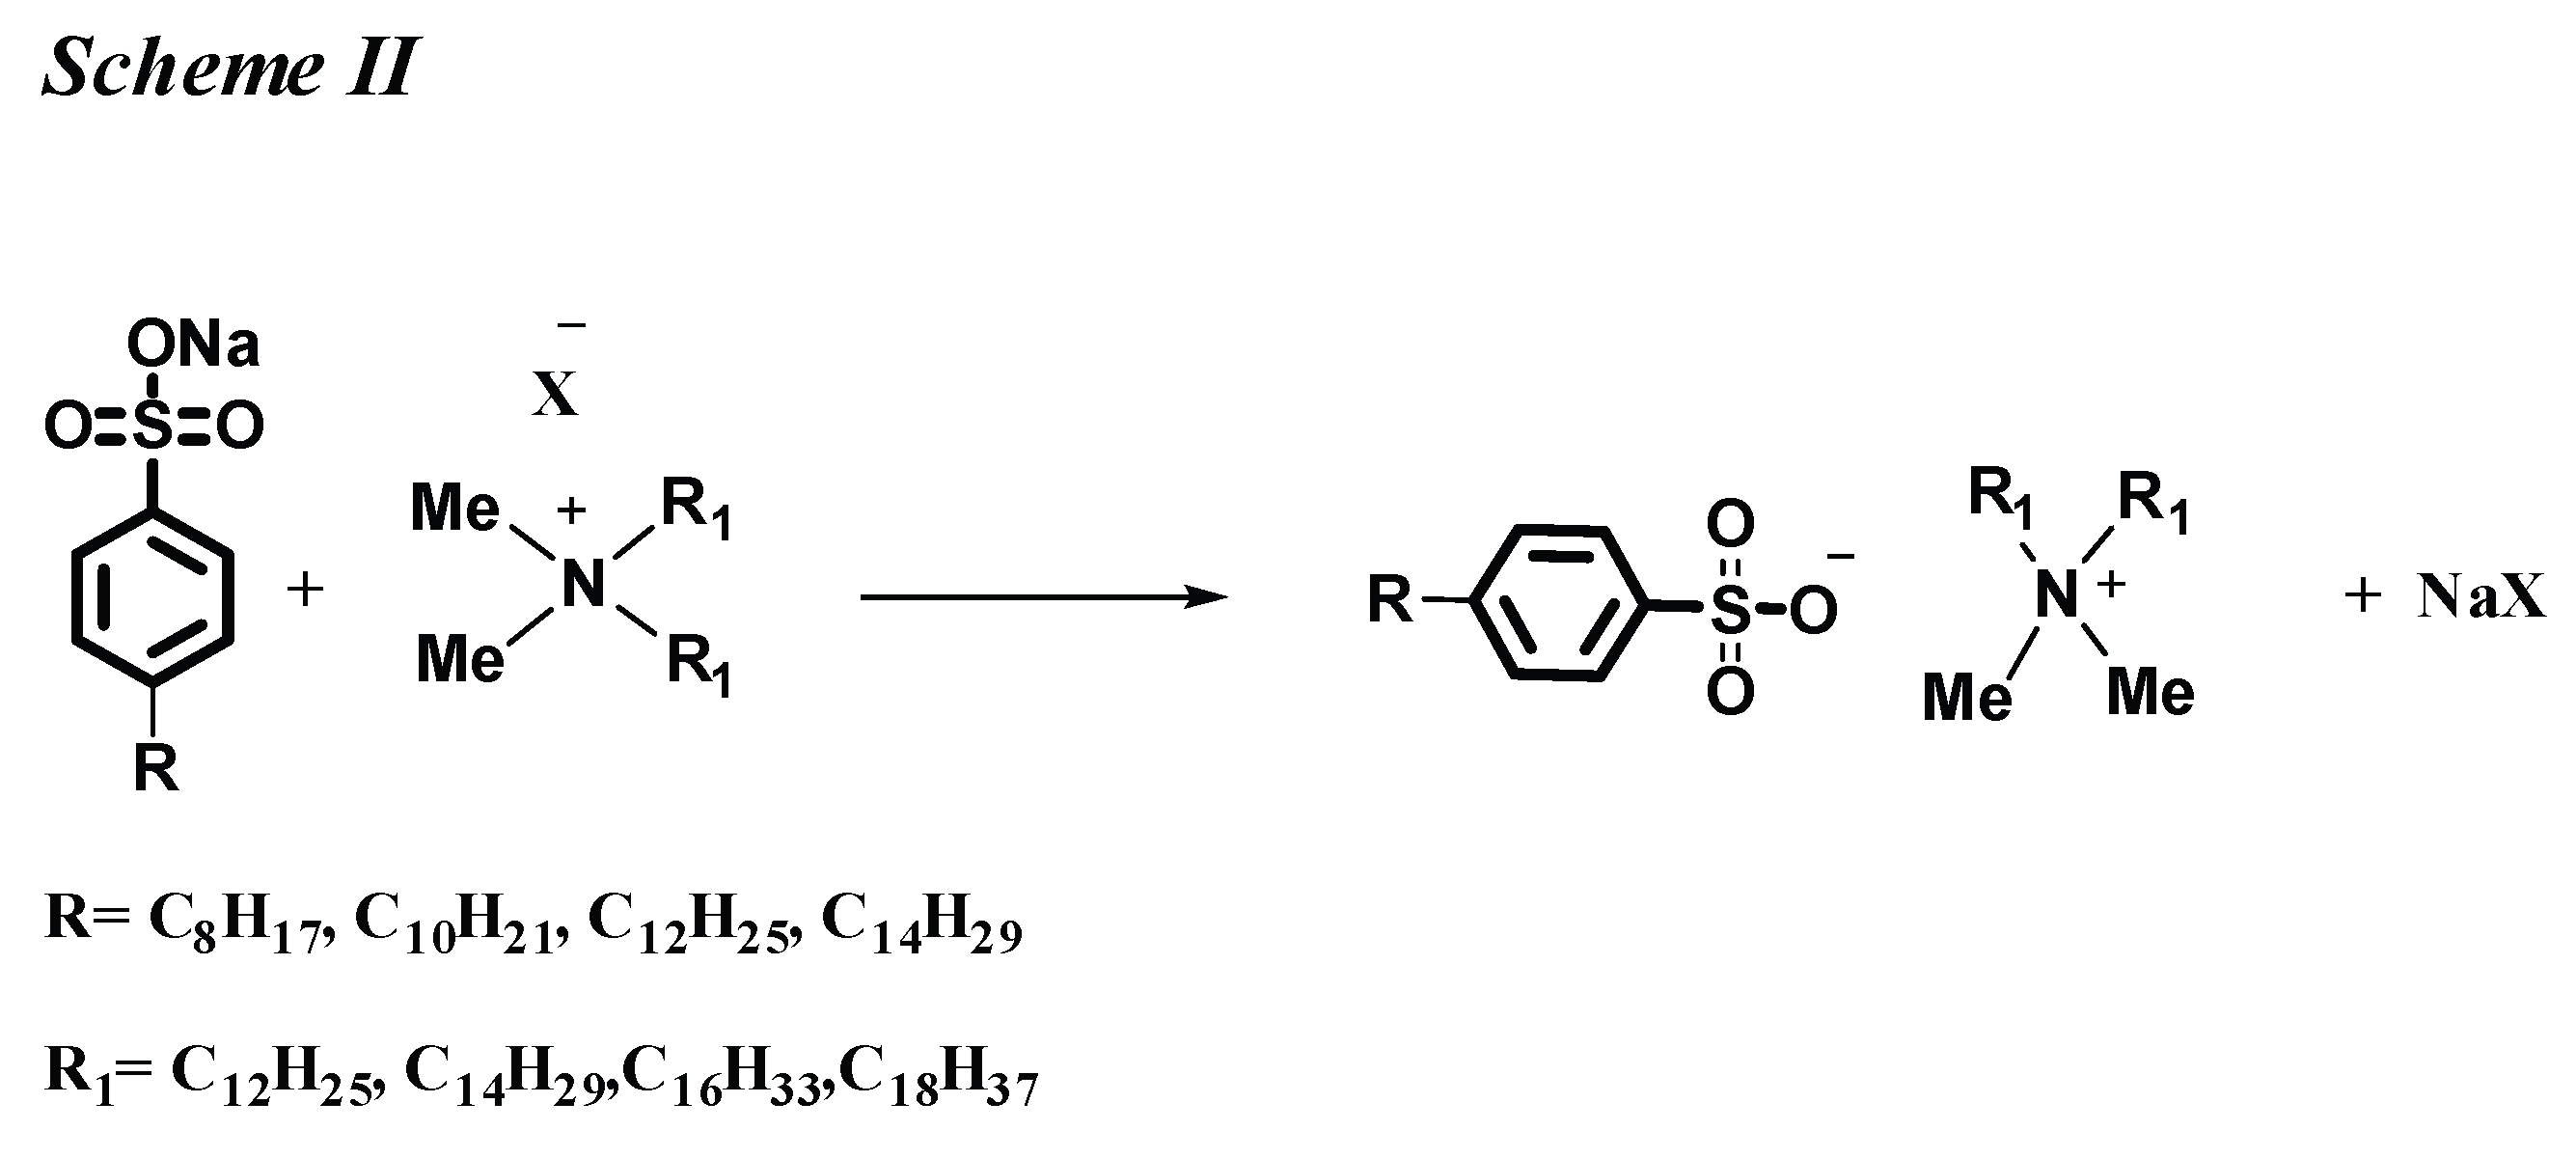
Figure 4.
TGA overlay plots for both constant anionic (left) and cationic (right) chain series with temperature at 5% weight loss marked by a +.
Figure 4.
TGA overlay plots for both constant anionic (left) and cationic (right) chain series with temperature at 5% weight loss marked by a +.
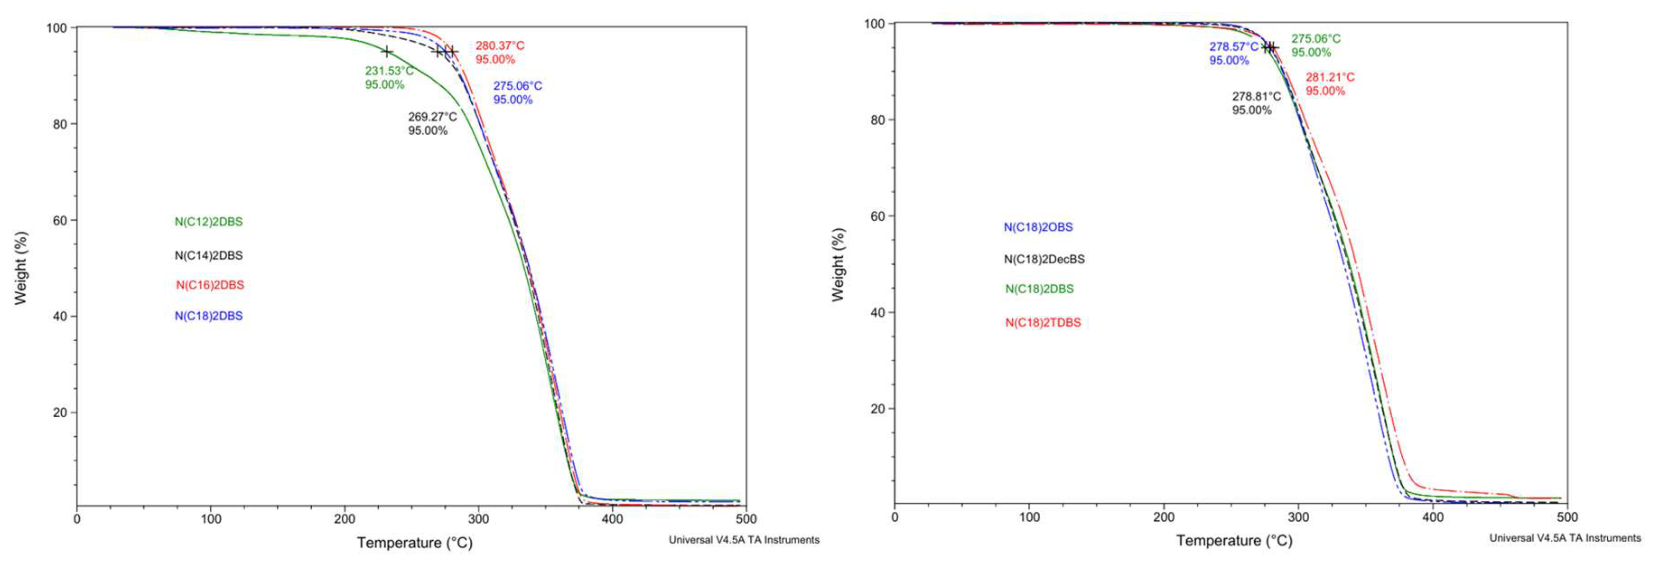
Figure 5.
DSC thermograms of the constant anionic chain series (3rd (final) cycle).
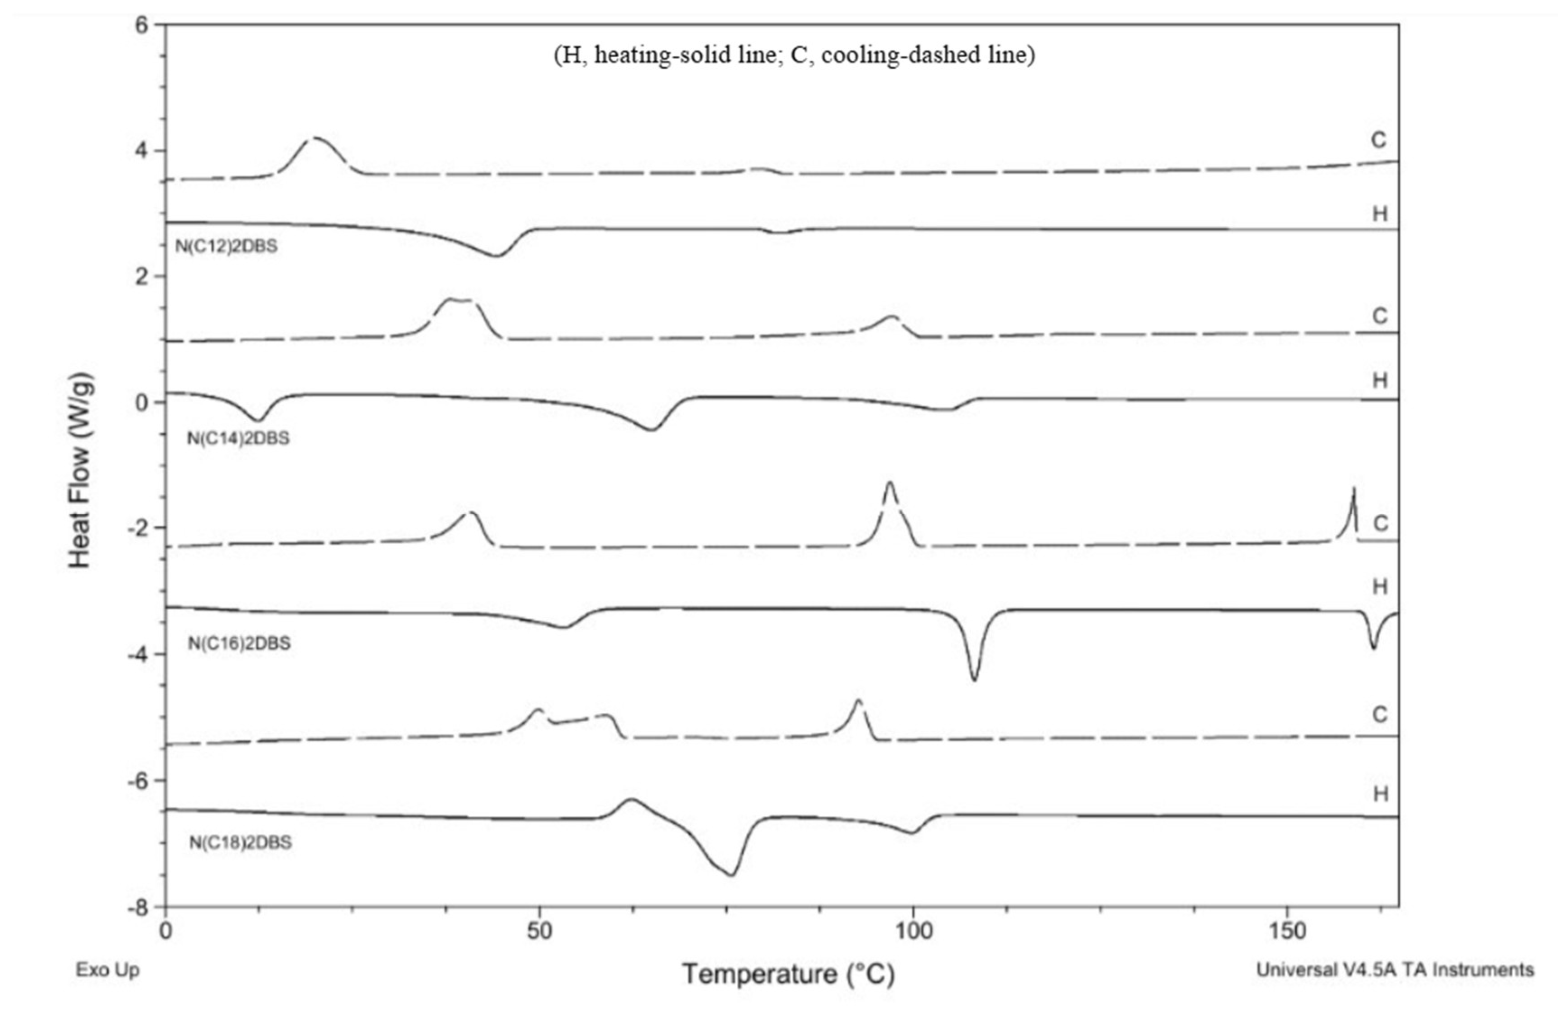
Figure 6.
DSC thermograms of the constant cationic chain series (3rd (final) cycle).
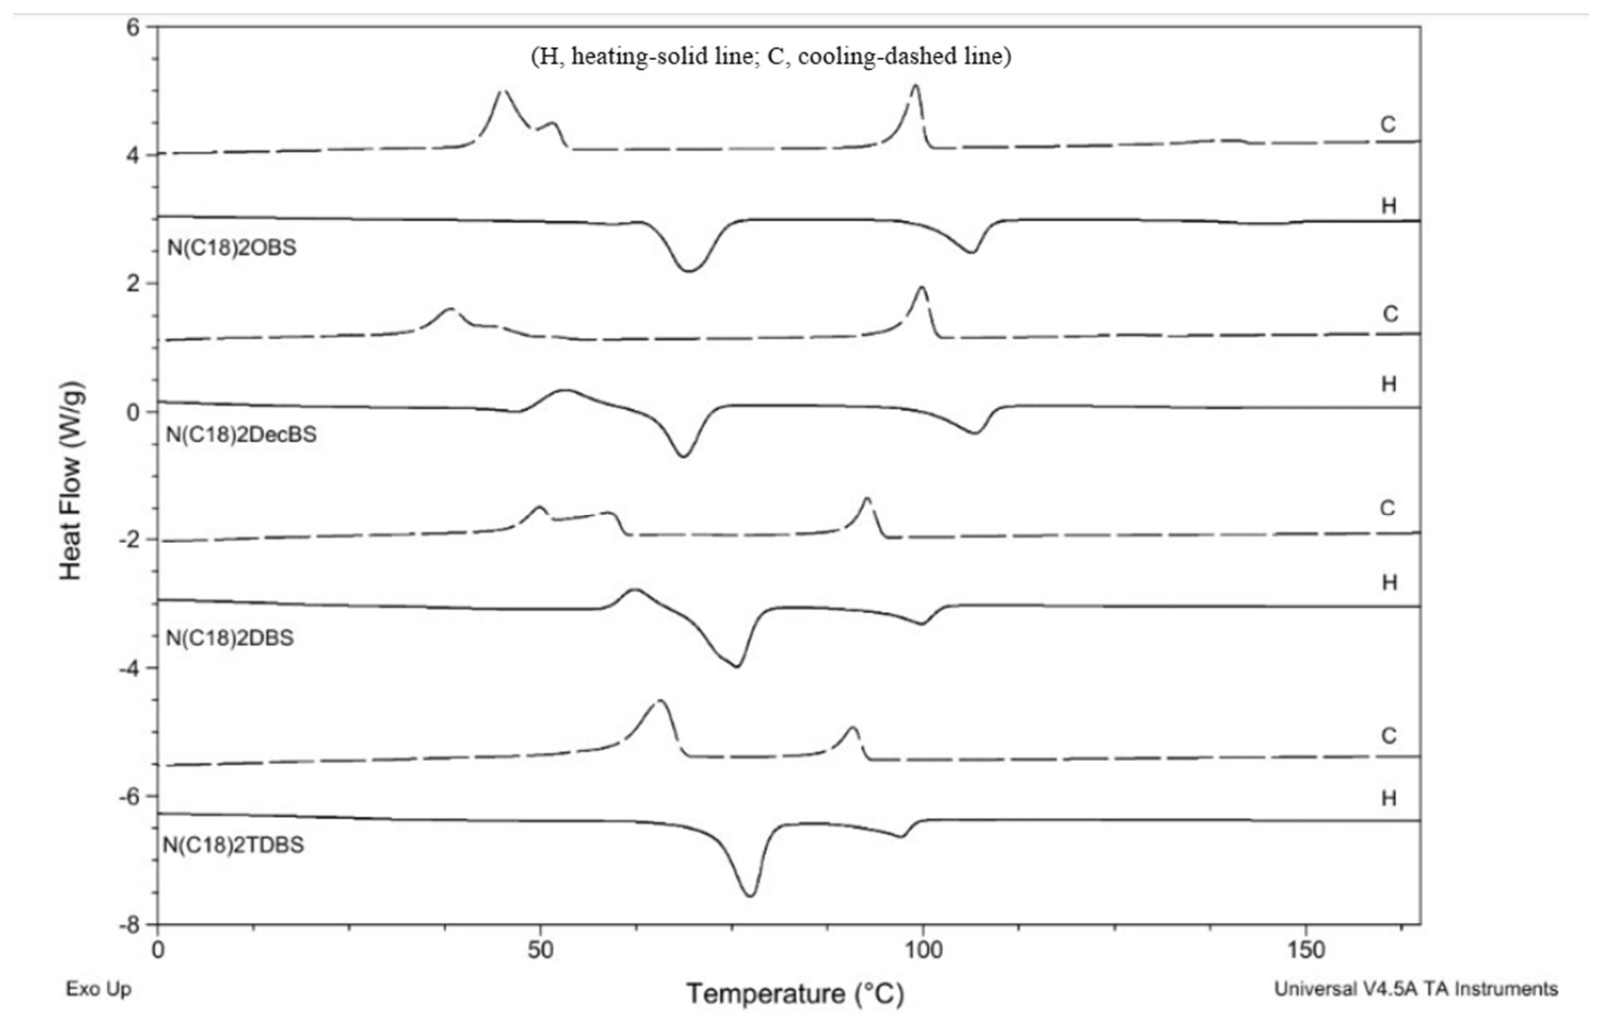
Figure 7.
Peak transition temperature chart for the constant anionic surfactants.
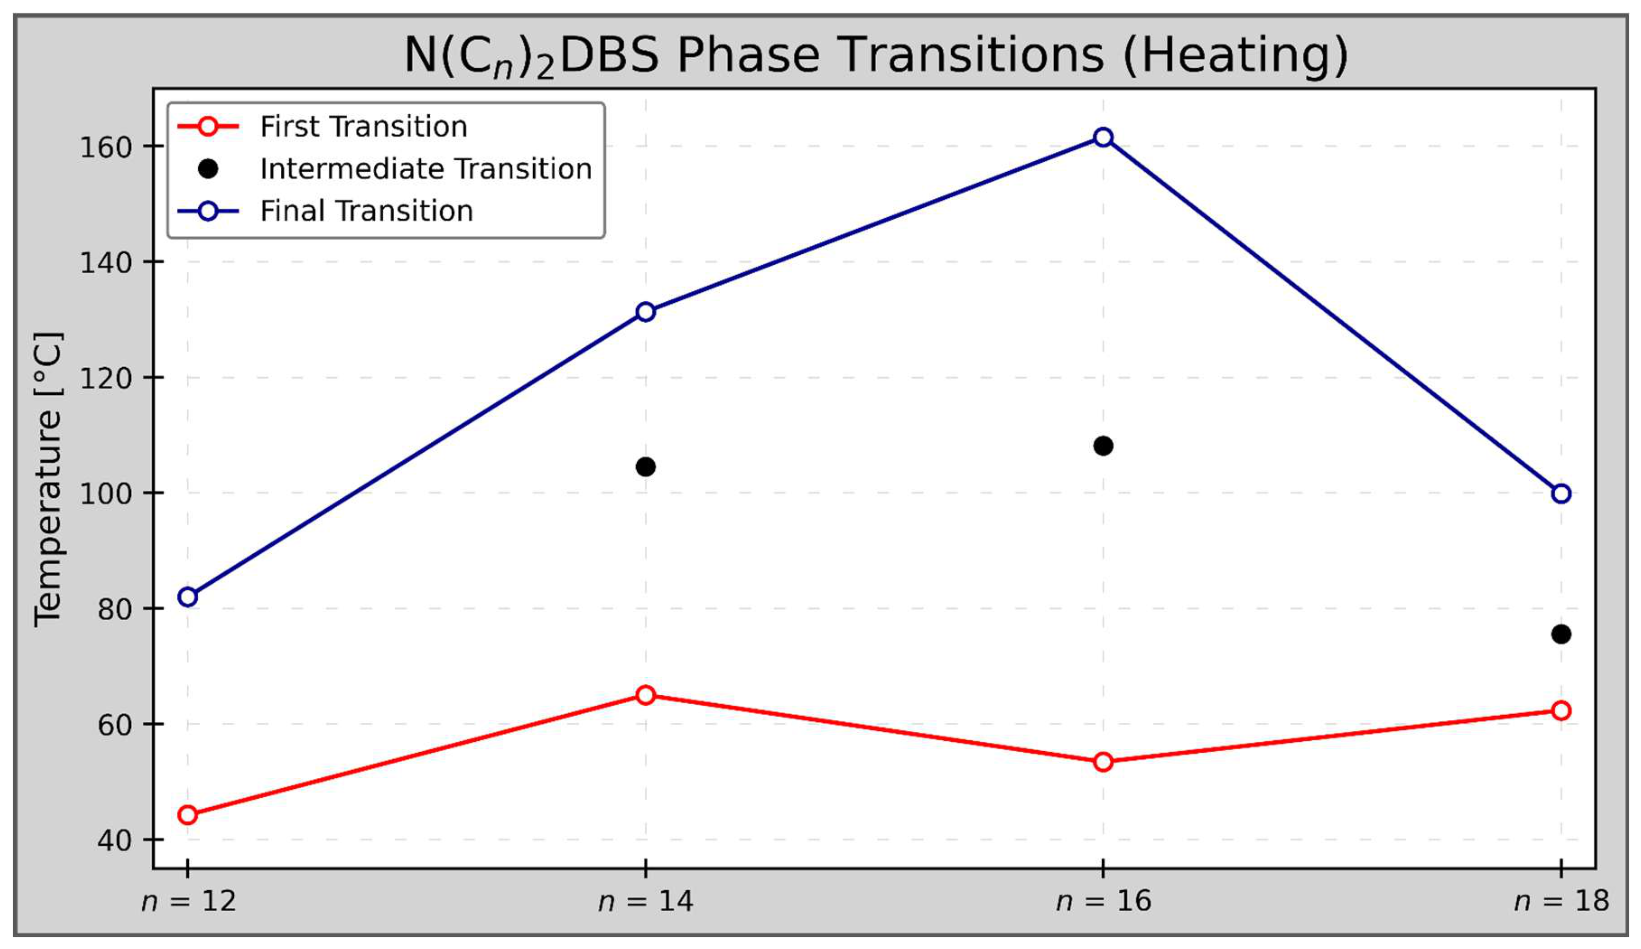
Figure 8.
Overall ΔHovr (blue, right) and ΔSovr (green, left) for the constant anionic surfactants as a function of number of CH2 groups in the hydrophobic chain.
Figure 8.
Overall ΔHovr (blue, right) and ΔSovr (green, left) for the constant anionic surfactants as a function of number of CH2 groups in the hydrophobic chain.
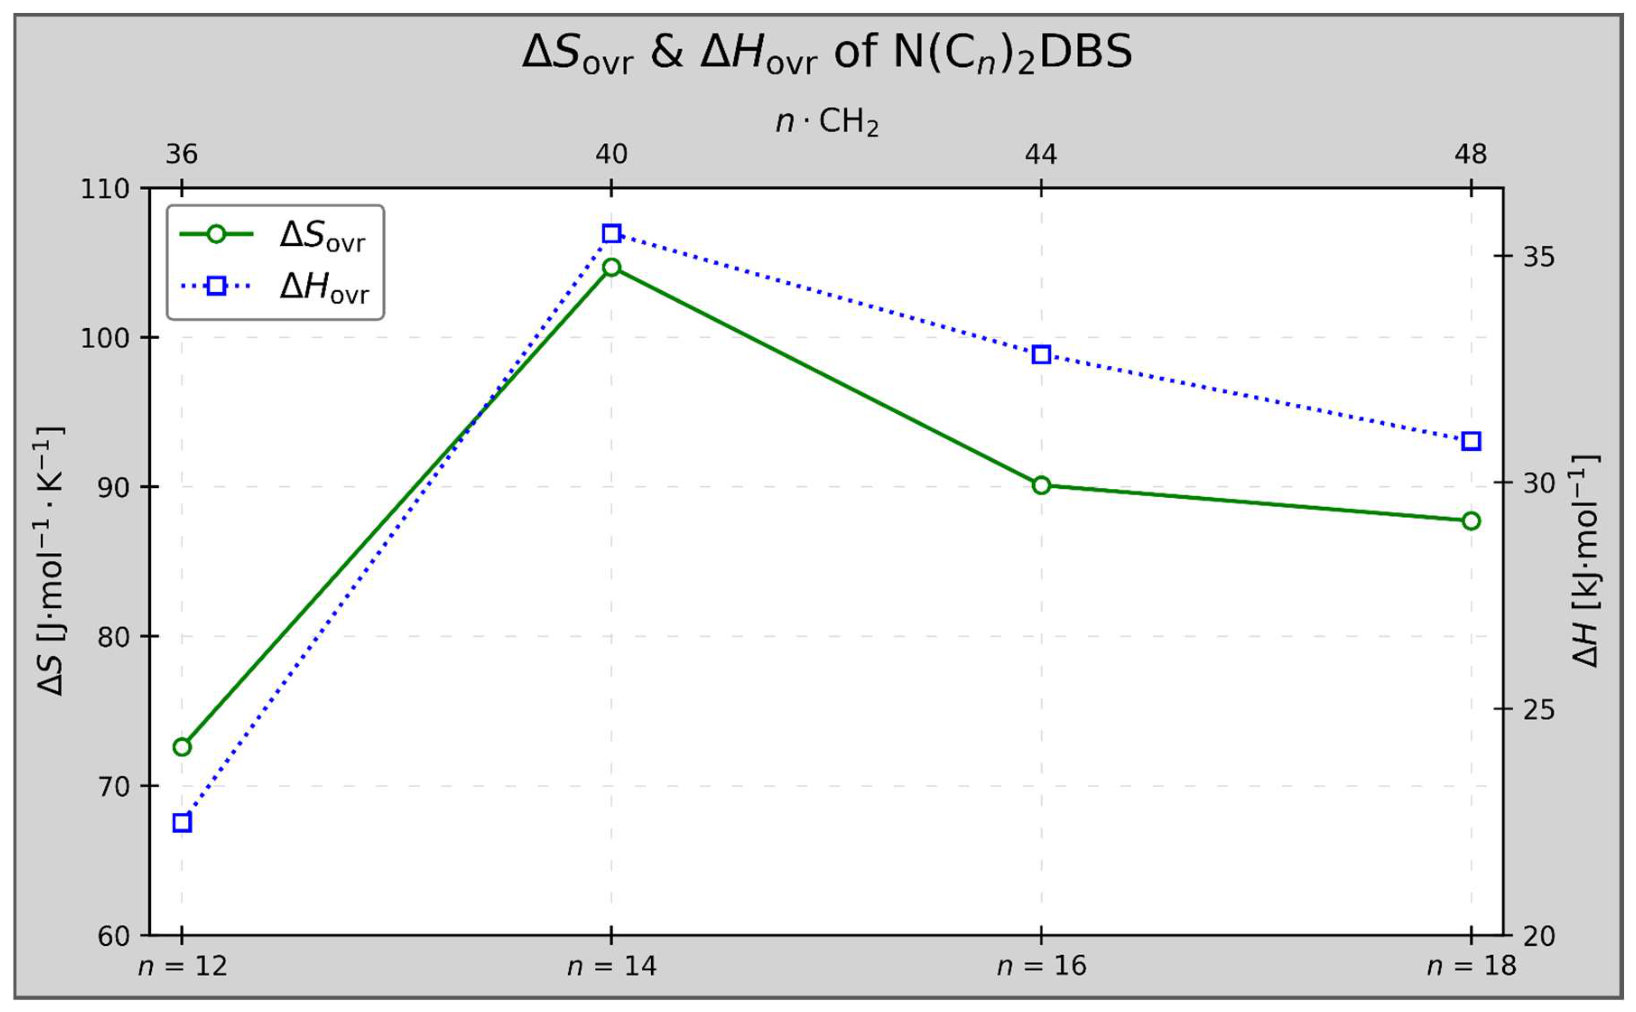
Figure 11.
Photomicrographs showing the change from the isotropic (left) to the lamellar phase (right) in N(C12)2DBS.
Figure 11.
Photomicrographs showing the change from the isotropic (left) to the lamellar phase (right) in N(C12)2DBS.
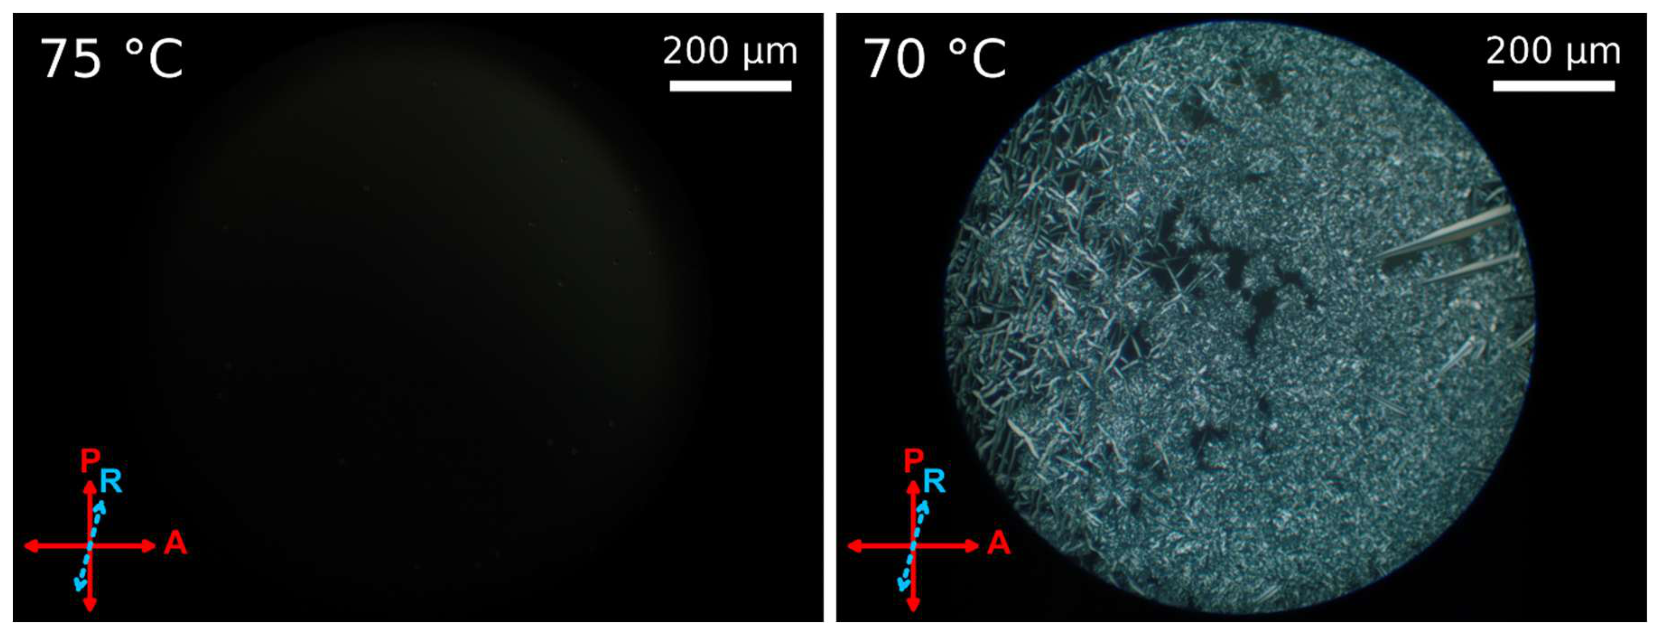
Figure 12.
Photomicrographs showing the change from the isotropic (left) to the hexagonal phase (right) in N(C14)2DBS.
Figure 12.
Photomicrographs showing the change from the isotropic (left) to the hexagonal phase (right) in N(C14)2DBS.
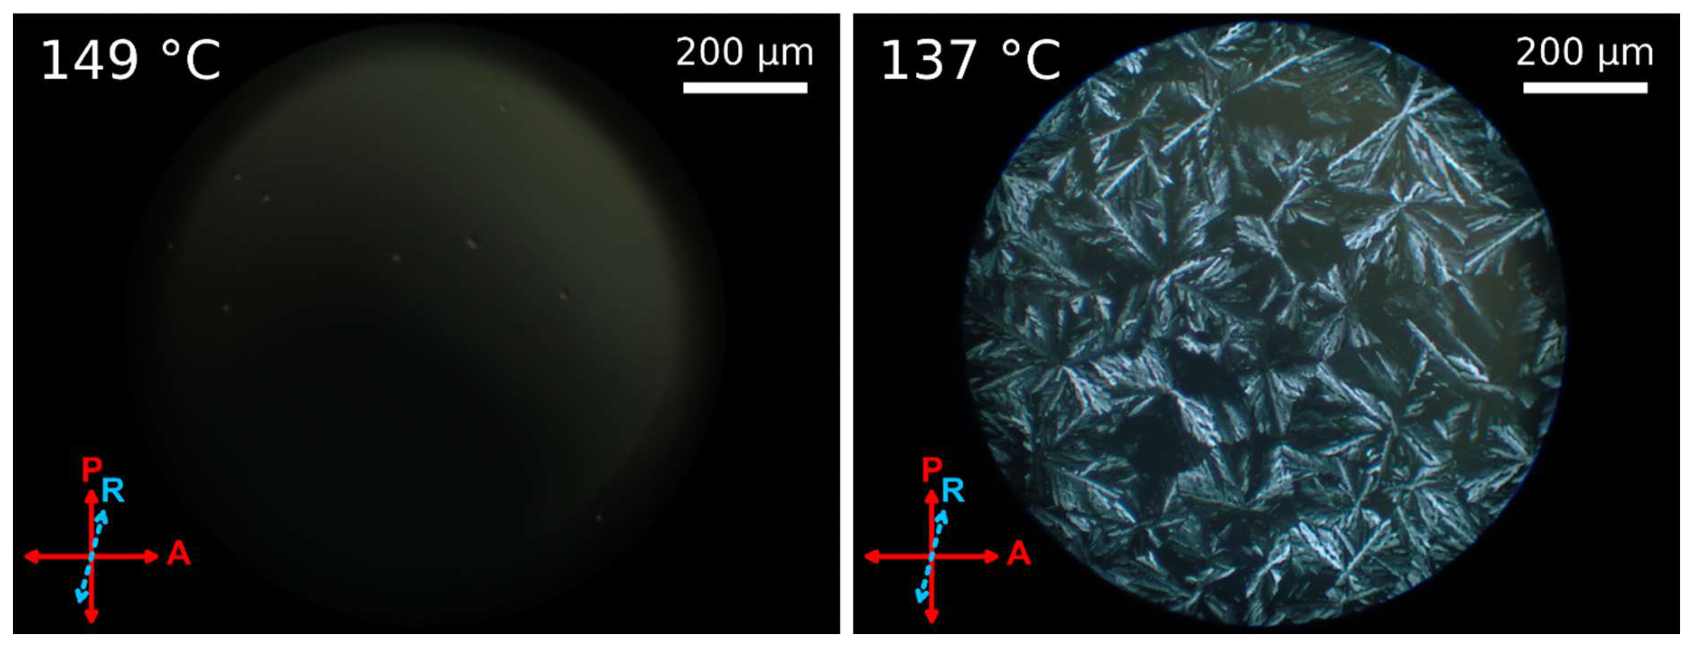
Figure 13.
Photomicrographs showing the change from the hexagonal (left) to the lamellar phase (right) in N(C18)2TDBS.
Figure 13.
Photomicrographs showing the change from the hexagonal (left) to the lamellar phase (right) in N(C18)2TDBS.
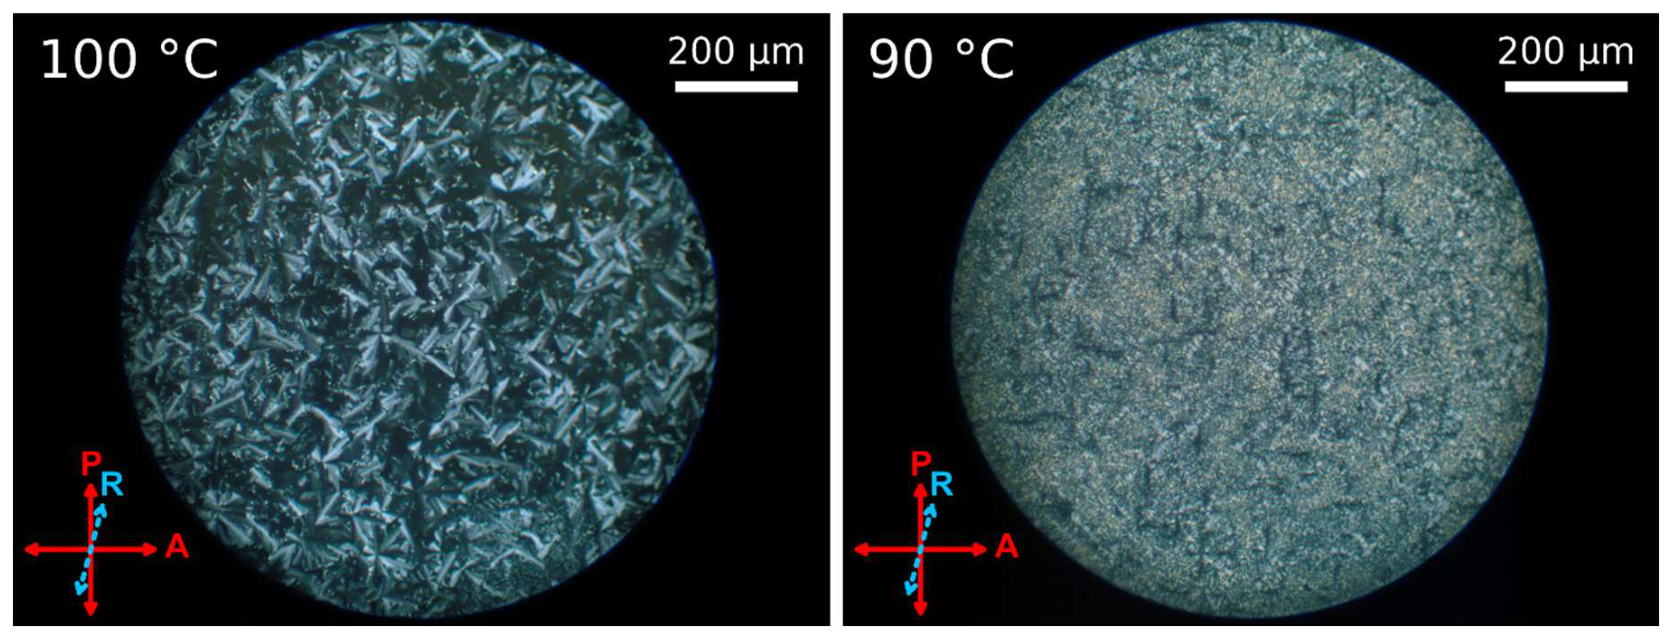
Figure 14.
An X-ray diffraction profile of N(C18)2DecBS across phases.
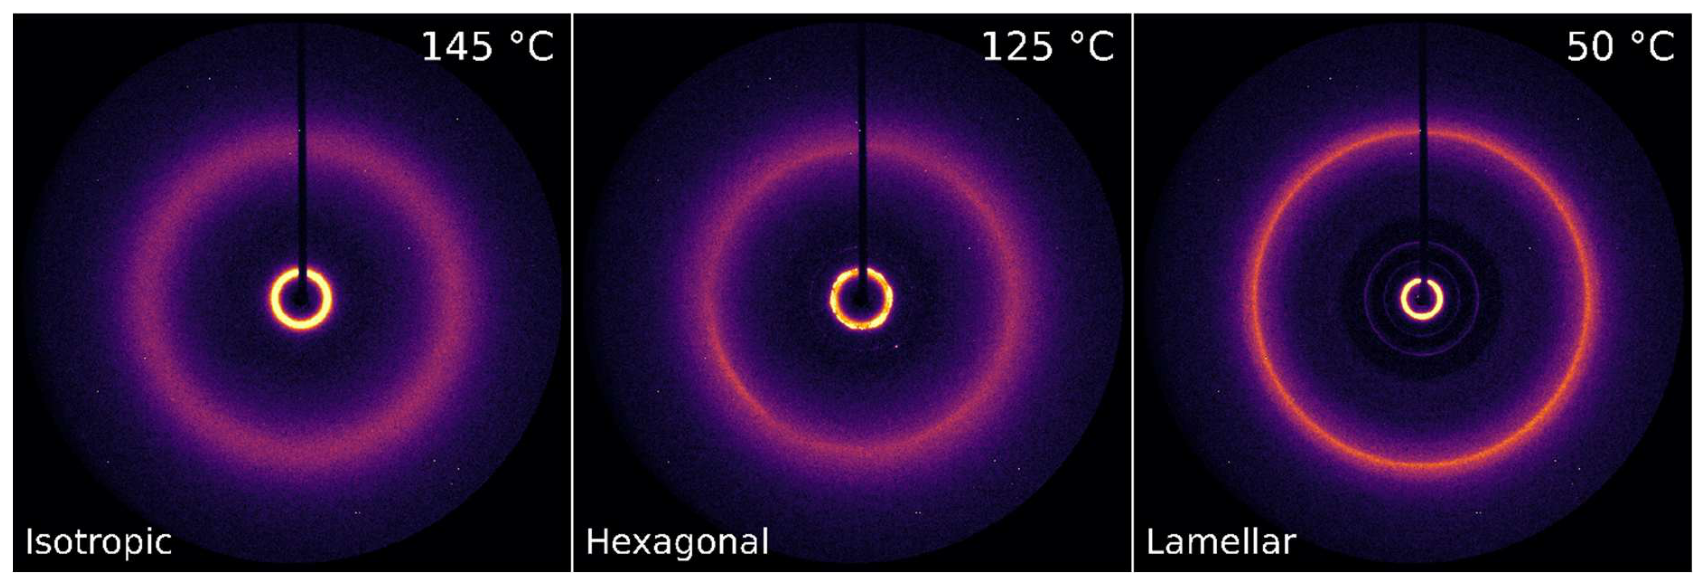
Figure 15.
d-spacing vs temperature for N(C18)2DecBS. Note that there is a two-phase coexistence region of hexagonal and lamellar phases.
Figure 15.
d-spacing vs temperature for N(C18)2DecBS. Note that there is a two-phase coexistence region of hexagonal and lamellar phases.
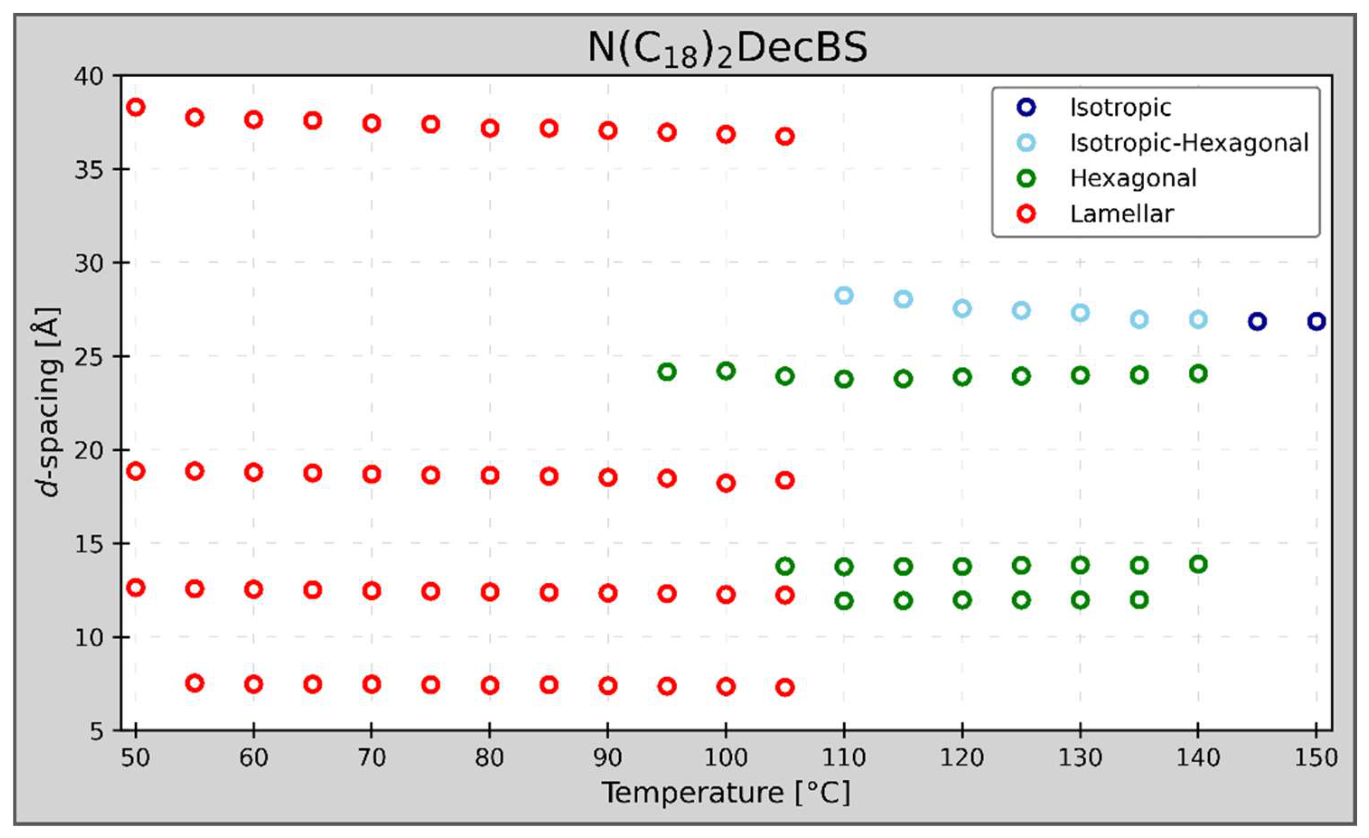

Table 1.
Transition Temperatures (T), Enthalpies (ΔH & ΔHovr, sum of enthalpies above room temperature), and approximated Entropies (ΔS & ΔSovr, sum of entropies above room temperature) for triple-chain catanionic surfactants with constant anion.
Table 1.
Transition Temperatures (T), Enthalpies (ΔH & ΔHovr, sum of enthalpies above room temperature), and approximated Entropies (ΔS & ΔSovr, sum of entropies above room temperature) for triple-chain catanionic surfactants with constant anion.
| Heating | Cooling | |||||||
| Sample | ΔHovr (kJ/mol) | ΔSovr (J/mol*K) | Peak T (0C) |
ΔH (kJ/mol) |
ΔS (J/mol*K) |
Peak T (0C) |
ΔH (kJ/mol) |
ΔS (J/mol*K) |
| N(C12)2DBS | 22.48 | 72.58 | -14.56 | 6.19 | 24.20 | -22 | 3.23 | 12.71 |
| 44.25 | 21.22 | 69.03 | 20.23 | 17.29 | 58.10 | |||
| 82.01 | 1.25 | 3.56 | 79.19 | 1.41 | 3.98 | |||
| N(C14)2DBS | 35.49 | 104.69 | 12.4 | 11.72 | 41.73 | -21.81 | 2.52 | 9.77 |
| 65.01 | 25.99 | 78.88 | 37.2 | 24.93 | 89.00 | |||
| 104.56 | 8.60 | 23.49 | 97.15 | 10.53 | 28.29 | |||
| 131.35 | 0.91 | 2.31 | 117.76 | 0.76 | 1.91 | |||
| N(C16)2DBS | 32.82 | 90.10 | 16.42 | 2.53 | 9.14 | 9.44 | 1.52 | 5.20 |
| 53.45 | 11.05 | 34.76 | 40.9 | 11.65 | 36.83 | |||
| 108.2 | 15.58 | 41.07 | 96.69 | 15.94 | 42.79 | |||
| 161.6 | 6.19 | 14.27 | 158.8 | 5.20 | 12.03 | |||
| N(C18)2DBS | 30.91 | 87.72 | 62.35 | -7.96 | -23.98 | 50.04 | 21.11 | 63.19 |
| 75.59 | 29.17 | 85.26 | 69.68 | 0.55 | 1.59 | |||
| 99.88 | 9.69 | 26.44 | 92.57 | 11.53 | 31.38 |
Table 2.
Transition Temperatures (T), Enthalpies (ΔH & ΔHovr, sum of enthalpies above room temperature), and approximated Entropies (ΔS & ΔSovr, sum of entropies above room temperature) for triple-chain catanionic surfactants with constant cation.
Table 2.
Transition Temperatures (T), Enthalpies (ΔH & ΔHovr, sum of enthalpies above room temperature), and approximated Entropies (ΔS & ΔSovr, sum of entropies above room temperature) for triple-chain catanionic surfactants with constant cation.
| Heating | Cooling | |||||||
| Sample | ΔHovr (kJ/mol) | ΔSovr (J/mol*K) |
Peak T (0C) |
ΔH (kJ/mol) |
ΔS (J/mol*K) |
Peak T (0C) |
ΔH (kJ/mol) |
ΔS (J/mol*K) |
| N(C18)2OBS | 39.90 | 113.23 | 59.58 | 0.51 | 1.57 | 46.55 | 27.82 | 86.19 |
| 69.49 | 23.69 | 70.07 | 98.92 | 14.60 | 39.11 | |||
| 106.34 | 13.89 | 37.18 | 137.72 | 1.80 | 4.34 | |||
| 145.13 | 1.81 | 4.41 | ||||||
| N(C18)2DecBS | 33.15 | 92.82 | 47.29 | 1.70 | 5.42 | 38.36 | 17.82 | 56.49 |
| 53.35 | -7.07 | -21.96 | 99.78 | 15.47 | 41.32 | |||
| 68.7 | 22.24 | 65.87 | 126.31 | 1.12 | 2.79 | |||
| 106.76 | 15.43 | 41.37 | ||||||
| 138.4 | 0.85 | 2.12 | ||||||
| N(C18)2DBS | 30.91 | 87.72 | 62.35 | -7.96 | -23.98 | 50.04 | 21.11 | 63.19 |
| 75.59 | 29.17 | 85.26 | 69.68 | 0.55 | 1.59 | |||
| 99.88 | 9.69 | 26.43 | 92.57 | 11.53 | 31.38 | |||
| N(C18)2TDBS | 40.73 | 116.57 | 77.41 | 33.09 | 95.64 | 66.12 | 32.90 | 96.40 |
| 97.14 | 7.63 | 20.93 | 90.41 | 9.67 | 26.48 |
Table 3.
Phases observed via VTXRD and their corresponding temperature range.
| Surfactant | Phases observed and corresponding temperature ranges [°C] | ||||
| Isotropic | Isotropic and hex | Isotropic and lamellar | hex and lamellar | lamellar | |
| N(C12)2DBS | T≥105 | NA | 70≤T≤100 | NA | T≤65 |
| N(C14)2DBS | T≥150 | 110≤T≤145 | NA | 85≤T≤105 | T≤80 |
| N(C16)2DBS | T≥165 | 105≤T≤160 | NA | T=100 | T≤95 |
| N(C18)2DBS | T≥150 | 105≤T≤145 | T=105 | 85≤T≤105 | T≤95 |
| N(C18)2DecBS | T≥145 | 110≤T≤140 | NA | 95≤T≤105 | T≤90 |
| N(C18)2TDBS | NA | 105≤T≤140 | NA | 85≤T≤100 | T≤80 |
| N(C18)2OBS | T≥155 | 110≤T≤150 | NA | 100≤T≤105 | T≤95 |
Table 4.
The measured d-spacing in the isotropic phase and the average ratio of the d-spacing in the lamellar phase to the isotropic phase and the hexagonal phase to the isotropic phase.
Table 4.
The measured d-spacing in the isotropic phase and the average ratio of the d-spacing in the lamellar phase to the isotropic phase and the hexagonal phase to the isotropic phase.
| surfactant | |||
| diso (Å) | average dlam/diso | average dhex/diso | |
| N(C12)2DBS | 25.4 | 1.21 | NA |
| N(C14)2DBS | 25.25 | 1.44 | 0.85 |
| N(C16)2DBS | 26.55 | 1.53 | 0.8 |
| N(C18)2DBS | 27.25 | 1.51 | 0.853 |
| N(C18)2DecBS | 26.85 | 1.53 | 0.866 |
| N(C18)2TDBS | 28.18 | 1.6 | 0.854 |
| N(C18)2OBS | 26.4 | 1.51 | 0.836 |
Disclaimer/Publisher’s Note: The statements, opinions and data contained in all publications are solely those of the individual author(s) and contributor(s) and not of MDPI and/or the editor(s). MDPI and/or the editor(s) disclaim responsibility for any injury to people or property resulting from any ideas, methods, instructions or products referred to in the content. |
© 2026 by the authors. Licensee MDPI, Basel, Switzerland. This article is an open access article distributed under the terms and conditions of the Creative Commons Attribution (CC BY) license (http://creativecommons.org/licenses/by/4.0/).
Copyright: This open access article is published under a Creative Commons CC BY 4.0 license, which permit the free download, distribution, and reuse, provided that the author and preprint are cited in any reuse.