

Submitted:
26 September 2026
Posted:
29 September 2026
You are already at the latest version
Abstract
Psychosocial hazards are established antecedents of psychological strain among construction personnel, yet whether that strain transmits exposure to in-role safety behavior has rarely been tested against criteria capable of detecting construct redundancy. This study examined the sequence linking psychosocial stressor exposure and role and employment insecurity to safety compliance through perceived strain-related safety impairment among construction personnel. A questionnaire survey obtained 196 responses, of which 157 were retained after removal of unengaged and duplicate cases. Partial least squares structural equation modeling was applied, with discriminant validity assessed by the heterotrait-monotrait ratio, mediation evaluated through specific indirect effects, and predictive relevance established out of sample against naive and linear benchmarks. Two construct pairs proved indistinguishable before remediation, one at unity. Exposure predicted impairment (0.676) and compliance (−0.301), whereas impairment predicted compliance non-significantly, and the indirect effect spanned zero. Insecurity predicted compliance positively (0.600), contrary to expectation. The findings indicate that psychosocial exposure reaches enforced safety behavior without an intervening deterioration in perceived functioning, directing preventive effort toward the organization of work rather than individual psychological capacity, and demonstrating that reported construct separations in this literature warrant re-examination under sensitive criteria.
Keywords:
construction safety
; psychosocial hazards
; safety compliance
; psychological distress
; job insecurity
; structural equation modeling
1. Introduction
Construction remains among the most hazardous industries, where safety depends on more than site conditions [1,2]. Production pressure, role ambiguity, and weak supervisory support are now treated as antecedents of safety behavior [3,4]. Impaired psychological states degrade the processes on which hazard detection depends [5,6]. Subjective appraisal governs whether awareness becomes protective action [7]. Mental ill health is accordingly an explicit target of safety research [8,9].
The exposures shaping construction workers' mental health are well documented. Chan et al. [10] reviewed sixteen studies and identified thirty-two risk factors, with working hours above sixty per week ranked first. Tijani et al. [11] extracted forty-nine stressors from thirty-eight papers across organizational, task, personal, and physical categories. Comparable exposures appear among bricklayers [12] and among professional staff, for whom long hours predicted stress [13]. Sun et al. [14] pooled forty-eight studies covering 13,083 workers and reported a correlation of 0.28 with mental health problems, rising to 0.41 for role conflict and 0.32 across Asian samples.
Evidence that psychological strain transmits stressor exposure to unsafe outcomes spans two decades. Siu et al. [15] found psychological distress mediating safety attitudes and accident rates among 374 workers, and Goldenhar et al. [16] related ten of twelve stressors to injury and near-miss outcomes among 408 laborers. Li et al. [17] routed demands and resources to injuries through emotional exhaustion. An important qualification followed. Wang et al. [18] reported that safety-related stress reduced participation (β = −0.192) while leaving compliance unaffected (β = −0.028), an asymmetry consistent with meta-analytic evidence on participation [19], with support predicting compliance and control predicting participation [20], and with the small indirect effects reported by Jung et al. [21].
Risk perception supplies the cognitive step between psychological state and behavior. Pandit et al. [22] showed hazard recognition mediating safety climate and risk perception across 280 workers at 57 workplaces. Degraded states impair appraisal directly, since mental fatigue reduced hazard detection among operators [23] and induced fatigue raised error rates in manual handling [24]. Measurement was weak until [25] developed a thirteen-item scenario-based instrument on 469 workers, later extended into a screening index [26] and separated from risk-taking behavior [27].
Organizational conditions govern whether hazards are voiced. Hall et al. [28] established psychosocial safety climate as a measurable upstream resource, and Manapragada and Bruk-Lee [29] showed that safety silence follows identifiable motives. Job insecurity degrades reporting and compliance [30], while supervisory enforcement predicts how far incidents go unrecorded [31]. These conditions intensify where enforcement is uneven. Mohamed et al. [32] linked national culture to unsafe behavior in Pakistan, Zahoor et al. [33] cross-validated a twenty-four-item safety climate scale on forty Pakistani projects, and Khan et al. [34] attributed persistent hazards to equipment and training costs.
Analytical practice has advanced in parallel. Variance-based structural equation modeling handles composite constructs and mediation [35,36], yet Henseler et al. [37] showed by simulation that the Fornell-Larcker criterion and cross-loadings detect genuine discriminant validity failures in as few as 0.3 and 0.0 percent of cases, whereas the heterotrait-monotrait ratio is reliable. Predictive assessment is benchmarked out of sample against linear models [38,39]. Construction applications predict injury type, site risk, and fatality from incident records [40,41], and the behavior scales show measurement equivalence across languages [42].
Three gaps persist in the existing body of work. Studies of psychosocial exposure stop at a mental health outcome, whereas studies of safety behavior begin from climate, so the full sequence from stressor to behavior is rarely estimated in one specification. Discriminant validity is routinely assessed by criteria that lack sensitivity, so reported separations between psychological constructs may not survive a stricter test. Predictive work draws on incident records, so no procedure classifies workers by psychosocial profile in advance. These omissions converge in developing economies, where enforcement is uneven and local instruments are rarely applied.
This study estimates one structural model linking psychosocial stressor exposure and employment insecurity to safety compliance through perceived strain-related safety impairment, using indicators adapted from established sources and screened for unengaged responding. Discriminant validity is assessed by the heterotrait-monotrait ratio rather than criteria shown to lack sensitivity and failing construct pairs receive the prescribed remediation rather than being set aside. Mediation is tested through specific indirect effects, and predictive relevance is evaluated out of sample against a linear benchmark using Q2predict, so the claim rests on measured indicators rather than model-derived scores. The framework establishes which exposures repay intervention and whether strain reaches enforced behavior at all.
2. Significance, Novelty, and Contribution
The contribution of this study is positioned against ten recent investigations of psychosocial influences on construction safety behavior, set out in Table 1. Psychological state across that set is represented most often by a single construct such as resilience, thriving, or empathy, and only Jung et al. [21] applied established clinical instruments for depression and anxiety. One study applied variance-based structural equation modeling, none reported the heterotrait-monotrait ratio, and none evaluated predictive performance on held-out cases, so no comparison study establishes that its construct separations withstand a sensitive test or that its estimates generalize beyond the estimation sample.
Nine of the ten drew their samples from China or South Korea, leaving the South Asian construction workforce unrepresented despite its scale and its distinct regulatory conditions. Two of the ten separated compliance from discretionary participation, a distinction that carries the asymmetry reported by Wang et al. [18] and that constrains the magnitude of effects the present instrument can detect. This study addresses the remaining dimensions within one specification.
3. Methodology
3.1. Theoretical Framework and Hypothesis Development
3.1.1. Psychosocial Exposure and Employment Insecurity
Safety behavior is treated here as the terminal element of a sequence originating in the organization of work and passing through the psychological condition of the individual. Two complementary formulations inform this sequence. The Job Demand-Control-Support model holds that strain arises where psychological demands are elevated and decision latitude and social support are limited [51,52], a proposition supported by meta-analytic evidence on the interrelationships among these characteristics [53]. The Job Demands-Resources formulation generalizes this structure by classifying any working conditions as a demand or a resource and by separating a health impairment process from a motivational one [54,55]. Later statements clarify that demands deplete regulatory capacity while resources buffer that depletion and sustain discretionary effort [56,57]. Both formulations are retained, since the control and support constructs of the earlier model correspond to resources in the latter one while the later model accommodates organizational conditions lying outside the task itself.
Psychosocial exposure in construction has been characterized consistently across systematic reviews, which identify time pressure, quantitative workload, restricted job control, deficient communication, role and interpersonal conflict, and production pressure as recurrent conditions [10,11,58]. Pooled estimates place the association between such exposures and psychological outcomes in the moderate range, with somewhat larger values for Asian samples [14]. Where hazards are tolerated as routine and concerns go unvoiced, the same conditions persist without correction, so normalization of risk and reticence in raising hazards are treated as elements of exposure rather than as separate outcomes [29,59]. These conditions are represented collectively as psychosocial stressor exposure. Role ambiguity and fear of adverse consequence for refusing hazardous work are specified separately as role and employment insecurity, since anticipatory threat to continuity of employment operates through a distinct mechanism and has been shown to affect reporting and compliance rather than psychological condition alone [30,60].
3.1.2. Strain and the Appraisal of Hazards
The psychological consequence of exposure is represented as perceived strain-related safety impairment, denoting the extent to which a worker judges their own hazard detection, concentration, and risk appraisal to deteriorate under conditions of strain. This construct combines symptom-level distress with the appraisal deficits attributed to it, a combination adopted on empirical rather than preferential grounds and justified in Section 3.5.2. Resource depletion is associated with attentional narrowing and with substitution of expedient routines for prescribed procedure, a mechanism supported by longitudinal evidence linking exhaustion to occupational injury [61] and by experimental work in construction relating induced fatigue to error and to degraded hazard detection [23,24]. Integrative reviews place individual appraisal alongside workgroup and organizational influences while noting that its mediating position remains inconsistently specified [62].
3.1.3. Safety Compliance as the Behavioral Outcome
Safety compliance denotes adherence to prescribed procedure and is distinguished in the established formulation from discretionary activity beyond formal requirement [63]. The instrument administered in this study captures the compliance component only, and the discretionary component is therefore outside its scope. This restriction directly bores on the expected magnitude of effects. Meta-analytic evidence reports a stronger association between organizational climate and discretionary behavior than between climate and compliance [19], leadership behaviors have been shown to motivate the two components through separate routes [64], and work characteristics drawn from the demand-control-support tradition predict them differentially [20]. Most directly, safety-related stress has been found to reduce discretionary participation while leaving compliance largely unaffected, an asymmetry attributed to the protection of enforced in-role obligation under conditions of limited energy [18]. Effects on compliance are accordingly hypothesized as directional but modest, and the possibility that impairment fails to transmit to enforced behavior is treated as an outcome of interest rather than as a failure of the model.
The specification comprises two exogenous constructs, one mediating construct, and one behavioral outcome. Six hypotheses are advanced, of which five concern direct associations and one concerns mediation. The hypotheses, their theoretical basis, and the expected direction of each association are set out in Table 2, and the corresponding path structure is depicted in Figure 1. Given the cross-sectional design, directional language throughout denotes hypothesized rather than demonstrated causal ordering.
3.2. Research Design
A quantitative, cross-sectional design was executed in three sequential stages. The first established the constructs and candidate indicators from the literature and fixed the measurement instrument. The second collected primary data through a structured questionnaire administered to construction personnel in Pakistan. The third estimated the structural model, evaluated mediation, and assessed predictive performance on withhold observations. The three stages and their principal outputs are represented in Figure 2. This sequence follows comparable investigations of psychosocial influences on construction safety behavior, which have combined questionnaire measurement with covariance-based or variance-based structural modeling [21,44,47]. The design does not permit temporal separation of predictor and outcome measurement, a constraint addressed procedurally in Section 3.5.4.
3.3. Instrument and Measurement
3.3.1. Construct Operationalization and Item Sources
The questionnaire comprised a demographic section and twenty-nine attitudinal items rated on a five-point agreement scale anchored at strongly disagree and strongly agree. Items were adapted from established sources rather than composed for this study. Indicators of time pressure, workload, and restricted job control follow the demand and latitude constructs of the demand-control tradition [51,52]; indicators of communication deficiency, role conflict, and interpersonal conflict follow psychosocial work environment measurement in construction populations [12,58]; indicators of production pressure and risk normalization follow organizational climate measurement [28]; and the indicator of reticence in raising hazards follows the safety silence formulation [29]. Symptom-level indicators of distress and the appraisal deficits attributed to it were drawn from construction mental health measurement [10,26], and compliance indicators follow the established in-role formulation [63]. The constructs, their indicator composition, item counts, and sources are set out in Table 3.
3.3.2. Administration and Pilot Testing
Instrument items were reviewed for clarity by the research team before administration and piloted with thirty construction personnel drawn from site worker, engineer, and supervisory roles. Pilot responses were examined for internal consistency and for ambiguity in phrasing, and minor revisions to wording were made; the construct structure and response format required no alteration. Questionnaires were administered in person, with items read aloud where literacy was limited, given that a substantial proportion of the target population holds primary or secondary schooling only. Participation was voluntary and anonymous and was preceded by informed consent, with no identifying information retained in the analytic file.
3.4. Sampling, Data Collection, and Response Screening
The target population comprised personnel engaged on building and infrastructure projects in Pakistan. Stratification was applied by occupational group so that site workers, site engineers, and supervisory staff were each represented, with site workers forming the majority on the grounds of their exposure to the hazards under study. Within strata, participation depended on availability during site visits, so the realized sample is not a probability sample; this constraint is common to site-based construction research and is acknowledged rather than obscured. One hundred and ninety-six responses were obtained. Two screening procedures were then applied, following the protocol used in a prior Pakistani construction sample [33]. Responses giving an identical answer to at least eighty percent of items were removed as unengaged, and verbatim duplicate response vectors were removed beyond their first occurrence. Thirty-nine responses were excluded on these grounds, yielding an analytic sample of one hundred and fifty-seven. Screening was performed before any construct was scored, so that exclusion decisions could not be informed by the associations subsequently estimated.
3.5. Analytical Procedure
3.5.1. Rationale for Variance-Based Structural Equation Modeling
Partial least squares structural equation modeling was selected over covariance-based estimation for three reasons. The analytic sample is modest relative to the number of indicators, a condition under which variance-based estimation retains statistical power [65]. The distributional assumptions of maximum likelihood estimation are unlikely to hold for five-point responses drawn from an occupationally heterogeneous sample. Most importantly, the study is causal-predictive in orientation rather than strictly confirmatory, and variance-based estimation supports assessment of out-of-sample performance alongside explanatory fit [39]. Estimation was performed in SmartPLS [66] using the path weighting scheme, with reporting following current guidance on composite model specification and evaluation [38,67].
3.5.2. Measurement Model Evaluation and Construct Remediation
Reflective measurement was assessed through indicator loadings, internal consistency, and average variance extracted. Discriminant validity was assessed by the heterotrait-monotrait ratio of correlations rather than by the Fornell-Larcker criterion or by inspection of cross-loadings, since simulation evidence indicates that the latter two procedures detect genuine discriminant validity failures at rates approaching zero under loading patterns and sample sizes typical of this literature [37]. Where the ratio exceeded the criterion for a construct pair, the prescribed remediation sequence was followed rather than the finding set aside: indicators correlating more strongly with an opposing construct than with their own were reassigned or eliminated, and construct pairs that remained empirically indistinguishable were merged into a more general construct supported by measurement theory [37]. Merging on this basis produced the combined impairment construct described in Section 3.1.2, which subsumes symptom-level distress and the appraisal deficits attributed to it. Item retention and the discriminant validity values obtained before and after remediation are reported in Section 4, since they constitute results rather than procedure.
3.5.3. Structural Estimation, Mediation, and Predictive Assessment
Structural relationships were estimated with bootstrapping using five thousand subsamples, two-tailed, at the five percent level, with percentile confidence intervals reported alongside path coefficients and effect sizes. Mediation was evaluated through specific indirect effects rather than inferred from the pattern of direct coefficients, since a comparison of direct paths does not identify the transmission route [36]. Predictive performance was assessed on observations withheld from estimation using the PLSpredict procedure with ten folds and ten repetitions, evaluated against two benchmarks: the indicator means of the training sample, through the Q2predict statistic, and a linear regression model estimated on the same indicators [38,39]. Comparison against a linear benchmark rather than against the explanatory statistics of the model itself is necessary, since explanatory power in a composite model does not establish predictive relevance. The cross-validated predictive ability test provided an inferential comparison of average prediction error between competing specifications [68]. A secondary classification analysis supports practical screening: the observed compliance composite, rather than any model-derived score, was dichotomized at a threshold justified by its empirical distribution, following the precedent of a screening index developed for construction workers on comparable grounds [26], and classified under stratified partitioning against the majority-class baseline. The partitioning scheme and predictive workflow are represented in Figure 3, and the criteria applied at every stage are collected in Table 4.
3.5.4. Common Method Variance
All constructs were obtained by self-report from a single instrument on a single occasion, a configuration under which common method variance may inflate observed associations [69]. Anonymity was assured and no identifying information was retained, reducing incentives toward socially desirable responding, and predictor and outcome items were separated within the questionnaire. The instrument nonetheless employed a uniform agreement format throughout, which affords no protection against a consistent response set, and the screening procedure described in Section 3.4 was adopted partly for this reason. Statistical assessment through collinearity examination across all constructs, together with item-level evidence bearing on acquiescent responding, is reported in Section 4.
4. Results and Analysis
4.1. Sample Characteristics
Of one hundred and ninety-six responses obtained, thirty-eight were removed as unengaged and one as a verbatim duplicate, retaining one hundred and fifty-seven for analysis. The composition of the retained sample is set out in Table 5. Site workers accounted for two-thirds of respondents, with site engineers and supervisory staff forming the remainder, and contract-based and daily-wage employment together accounted for more than nine in ten. The workforce was young and comparatively inexperienced, with seventy-nine percent aged between twenty and thirty and sixty-eight percent reporting three years of construction experience or less. Educational attainment was concentrated at primary and secondary level, which is consistent with the profile reported for frontline construction personnel in other developing economies [70]. Commercial and residential projects accounted for eighty-three percent of the sample. The distribution of employment status is relevant to the interpretation that follows, since the predominance of contract and daily-wage arrangements implies limited protection against the consequences of refusing hazardous work.
4.2. Measurement Model Evaluation
4.2.1. Indicator Reliability, Internal Consistency, and Convergent Validity
Outer loadings for the retained specification are reported in Table 6. Loadings ranged from 0.684 to 0.926, and all but one exceeded the 0.708 criterion; the exception, an indicator of production pressure loading at 0.684, was retained under the conditional rule declared in Table 4, since its removal would not have raised average variance extracted above the threshold already attained. Cronbach alpha ranged from 0.717 to 0.904 and composite reliability from 0.874 to 0.922, with every value inside the 0.70 to 0.95 interval, indicating adequate internal consistency without the redundancy that values above 0.95 would suggest. The Dijkstra-Henseler coefficient fell between these two bounds for every construct, ranging from 0.751 to 0.907. Average variance extracted ranged from 0.567 to 0.855, so each construct accounted for more than half the variance of its indicators. Convergent validity was therefore established for all four constructs.
4.2.2. Discriminant Validity and Construct Remediation
Discriminant validity was first evaluated for the seven-construct specifications implied by the original item assignment, and four construct pairs exceeded the criterion, as reported in the upper panel of Table 7. Work intensity demands and organizational stressors returned to a ratio of 0.947, while distress and stress-related risk-taking returned to 1.019, a value at unity indicating that the two were not empirically separable. The belief indicators concerning the general relationship between mental health and safety exceeded the criterion against both distress and risk-taking, at 0.919 and 0.925 respectively. Remediation followed the sequence declared in Section 3.5.2. One risk-taking indicator was eliminated, since it correlated more strongly with the belief indicators than with its own block, at 0.663 against 0.610; the belief indicators were removed as a construct lying outside the behavioral outcome of interest; and the two remaining offending pairs were merged. In the resulting four-construct specifications, reported in the lower panel of Table 7, the largest ratio was 0.738, and every bootstrap confidence interval excluded unity. Twenty-one of the twenty-nine administered indicators were retained.
4.3. Structural Model
4.3.1. Direct Effects and Explanatory Power
Path coefficients, their bootstrap standard errors, confidence intervals, and effect sizes are reported in Table 8, and the estimated structure is depicted in Figure 4. Inner variance inflation factors ranged from 1.009 to 1.845, so collinearity did not threaten the estimates. Psychosocial stressor exposure was strongly associated with perceived strain-related safety impairment, at 0.676 with a confidence interval from 0.584 to 0.772 and an effect size of 0.829, supporting H1. This magnitude exceeds the pooled correlation of 0.28 reported across forty-eight construction studies and the Asian subgroup estimate of 0.32 [14], a divergence considered in Section 5. Exposure was also negatively associated with safety compliance, at −0.301 with an interval from −0.495 to −0.111, supporting H2, though the effect size of 0.080 places this influence in the small range. Role and employment insecurity showed no association with impairment, at −0.032, so H3 was not supported. Its association with compliance was substantial but positive, at 0.600 with an effect size of 0.584, so H4 was not supported in the direction hypothesized. Impairment showed no association with compliance, at 0.109 with an interval spanning zero, so H5 was not supported. The model accounted for 45.4 percent of variance in impairment and 38.9 percent in compliance, with adjusted values of 0.447 and 0.377.
4.3.2. Mediation
The specific indirect effect running from exposure through impairment to compliance is reported in Table 9. Its point estimate was 0.073 with a bootstrap confidence interval from −0.079 to 0.242, which includes zero, so H6 was not supported. The absence of mediation follows directly from the non-significant second segment of the pathway, since a serial route is unable to transmit an effect through a link that itself carries none. The relationship between exposure and compliance was therefore direct rather than mediated. This pattern is consistent with the finding that safety-related stress reduced discretionary participation while leaving compliance essentially unaffected, at −0.028, in a sample of three hundred and fifty-nine construction workers [18], and with the small total indirect effects of depression and trait anxiety on compliance, at −0.044 and −0.090, reported among three hundred and ninety-nine Korean construction workers [21]. Comparable null or weak transmissions to in-role behavior have been reported where the mediator is attitudinal rather than behavioral [45,71].
4.4. Predictive Assessment
4.4.1. Out-of-Sample Prediction of Endogenous Indicators
Predictive performance across ten folds and ten repetitions is reported in Table 10. Every endogenous indicator returned a positive statistic against the naive benchmark of training-sample indicator means, with values ranging from 0.178 to 0.346, establishing predictive relevance. Against the linear model benchmark, nine of the ten indicators returned a lower root-mean square error, the exception being a single distress indicator exceeding the benchmark by 0.015. Under the decision rule declared in Table 4, this pattern corresponds to high predictive power. The cross-validated predictive ability test confirmed both comparisons inferentially: average loss was lower than the indicator-average benchmark by 0.266 and lower than the linear model by 0.054, each at p below 0.001. The advantage over the linear benchmark, while statistically reliable, is modest in absolute terms, which is expected where a composite model and a saturated regression draw on the same indicator set.
4.4.2. Screening Classification
The observed compliance composite, with a mean of 3.105 and a standard deviation of 0.998, was dichotomized at the scale midpoint of 3.00, a cut point falling close to the sample mean and separating respondents who endorsed continued adherence under strain from those who did not. The resulting distribution, presented in Figure 5, comprised one hundred and one compliant and fifty-six non-compliant cases, giving a majority-class baseline of 0.643. Classification performance under stratified ten-fold partitioning is reported in Table 11. Logistic regression attained an accuracy of 0.803 and a balanced accuracy of 0.767, exceeding the baseline by sixteen percentage points, with an area under the curve of 0.814. The support vector classifier and random forest performed somewhat better, attaining balanced accuracies of 0.814 and 0.838 and areas under the curve of 0.893 and 0.891. Training and validation performance by fold, presented in Figure 6, remained closely aligned throughout, with mean validation accuracy of 0.803 against training accuracy of comparable magnitude, indicating that the models did not overfit. The confusion matrix for the logistic classifier, presented in Figure 7, shows ninety compliant and thirty-six non-compliant cases correctly identified, against eleven and twenty misclassifications respectively. The asymmetry is consequential for screening, since the twenty non-compliant workers classified as compliant represent the cases a screening instrument would fail to flag.
4.5. Common Method Variance
Full collinearity variance inflation factors, computed by regressing each construct on all others, ranged from 1.601 to 1.994 and remained below the 3.3 criterion, so no construct was substantially explained by the remainder. This assessment should nonetheless be read alongside the screening evidence reported in Section 4.1. Thirty-eight responses, amounting to nineteen percent of those collected, gave an identical answer to at least eighty percent of items, and the discriminant validity failures documented in Section 4.2.2 clustered among indicators sharing a common phrasing template in which a stressor is asserted to impair safety. The uniform agreement format employed throughout the instrument affords no protection against a consistent response set, and the possibility that part of the association between exposure and impairment reflects shared method rather than shared substance is retained as a limitation rather than dismissed [69]. The independence of the compliance indicators from the exposure and impairment blocks, evident in the ratios reported in Table 7, indicates that this concern does not extend to the behavioral outcome.
5. Discussion
5.1. Direct Transmission of Exposure to Compliance
The pathway hypothesized to carry exposure into behavior did not operate. Psychosocial stressor exposure was associated with perceived strain-related safety impairment at 0.676 and with safety compliance at −0.301, yet impairment showed no association with compliance, and the specific indirect effect of 0.073 spanned zero. Two readings are available, and the evidence does not fully separate them. The first attributes the pattern to the enforced character of the outcome: compliance is monitored, procedurally specified, and subject to sanction, so it should be the behavior least responsive to internal state and most responsive to external condition, a distinction reflected in the differential prediction of climate-linked safety outcomes reported by Beus et al. [72] and in the divergent antecedents of behavior among temporary construction personnel identified by Seo et al. [73]. The second attributes it to the referent of the impairment indicators, which elicit a judgment about how strain affects safety rather than a record of behavior under strain. Judgments of this kind are systematically discounted when applied to the self, since construction workers rate their own vulnerability to hazards below that of colleagues performing identical work [74]. Under either reading, the practical implication is the same: exposure influences compliance without requiring an intervening deterioration in perceived functioning.
5.2. Employment Insecurity as a Compliance-Enforcing Condition
The association between role and employment insecurity and compliance was substantial and positive at 0.600, opposite in sign to the hypothesis and second only to the exposure pathway in effect size. The composition of the sample offers a plausible account. Contract-based and daily-wage arrangements together accounted for ninety-two percent of respondents, so continuation of employment depends on day-to-day supervisory judgment rather than on contractual protection. Where a worker anticipates adverse consequences for declining hazardous work, visible adherence to procedure becomes the behavior through which continued engagement is secured, and compliance is precisely the safety behavior that supervisors observe. Insecurity would then raise conspicuous rule-following while leaving unmonitored protective action untouched, a divergence consistent with the elevated exposure and constrained agency documented among temporary and migrant construction workforces [73,75] and with the deference to hierarchy reported in construction settings marked by steep authority gradients [76,77]. Compliance obtained under this mechanism is contingent rather than internalized and would not be expected to persist once the employment threat is removed.
5.3. Magnitude of Associations and the Influence of Measurement
The exposure to impairment coefficient of 0.676 exceeds by a wide margin the pooled correlation of 0.28 obtained across forty-eight construction studies, and the corresponding Asian subgroup estimate of 0.32. Meta-analytic syntheses of construction safety relationships report associations of comparable modesty between organizational conditions and safety outcomes [78,79], so the present magnitude warrants explanation rather than emphasis. Three features of the instrument bear on it. Nineteen percent of collected responses agreed with at least eighty percent of items and were excluded, indicating a pronounced agreement tendency in the population sampled. The indicators forming exposure and impairment share a phrasing template asserting that a stressor degrades safety, which invites endorsement as a general proposition irrespective of personal experience. The discriminant validity failures documented before remediation, reaching unity between distress and stress-related risk-taking, arose entirely among indicators sharing that template. Part of the observed association is therefore likely to reflect shared method rather than shared substance, and the estimate should be read as an upper bound.
5.4. Practical Implications and Scalability
The screening component performed above the majority-class baseline of 0.643 across all three classifiers, reaching balanced accuracies between 0.767 and 0.838 and areas under the curve between 0.814 and 0.893, which is sufficient to prioritize attention rather than to determine individual status. Three features support deployment at scale. The retained instrument comprises twenty-one items on a single response format, is completed in approximately ten minutes, and was administered orally where literacy was limited, so it imposes no requirement for written competence in a workforce where forty-five percent hold primary or secondary schooling only. The predictors are organizational conditions rather than clinical states, so no diagnostic capability is presupposed, and no medical confidentiality obligation arises. Intervention should target exposure directly, since the results indicate that its influence on compliance does not pass through psychological condition, and expert consensus on measures for construction mental health similarly favors organizational restructuring over individual-level provision [80]. Periodic administration would allow the instrument to function as a leading indicator alongside behavior-based observation [81] and, on larger projects, alongside physiological monitoring where such systems are already installed [82,83].
5.5. Limitations and Future Directions
Four limitations bound these findings, each with a specific route to resolution. The design is cross-sectional, so the ordering of exposure, impairment, and compliance is assumed rather than demonstrated; longitudinal evidence indicates that associations of this kind attenuate substantially when temporal separation is imposed [84], and multi-wave administration of the kind used to establish climate as a precursor to psychological outcomes would permit the sequence to be tested [85,86]. All measures derive from one self-report instrument on a single occasion with a uniform agreement format, so the exposure to impairment estimate remains vulnerable to shared method; replication with reverse-worded items and separated response formats would establish how much of it survives. The behavioral outcome captures compliance alone, and rests on two indicators, so the discretionary component of safety performance is unobserved despite prior evidence locating the strongest strain effects there; incorporating a participation scale is the single change most likely to alter the substantive conclusions. Finally, the sample is a non-probability sample drawn from a young and comparatively inexperienced workforce, which constrains generalization to established personnel and to firms with formalized safety systems [87,88]. Replication using clinically validated distress measurement, scenario-based risk perception, and objective incident records would establish whether the direct pathway reported here reflects a property of the setting or of the instrument [89,90].
6. Conclusions
This study estimated a four-construct model relating psychosocial stressor exposure and role and employment insecurity to safety compliance through perceived strain-related safety impairment, using 157 responses retained from 196 after removal of unengaged and duplicate cases. Construct composition was settled empirically rather than assumed, since two pairs proved indistinguishable under the heterotrait-monotrait criterion, one of them at unity. The hypothesized mediation did not operate. Exposure reached compliance directly, insecurity raised it, and perceived impairment transmitted nothing, a configuration that displaces psychological state from the causal position it is conventionally assigned in this literature.
- (1)
- Interventions strengthening individual resilience act on a link that carries no effect, whereas altering the exposure conditions reaches compliance directly and without intermediary.
- (2)
- Discriminant criteria in routine use conceal redundancy, since the pair returning unity under the heterotrait-monotrait ratio passed the Fornell-Larcker test unchallenged.
- (3)
- Where employment is contingent, insecurity raises visible compliance rather than depressing it, producing adherence purchased by threat and liable to lapse once withdrawn.
- (4)
- Excluding nineteen percent of responses for agreement tendency altered every structural estimate, making response screening a determinant of conclusions rather than a preliminary.
- (5)
- Predictive claims require an external referent, since high accuracy may fall beneath a majority-class baseline and explanatory power establishes nothing out of sample.
- (6)
- Items asserting that a stressor degrades safety invite endorsement as a proposition, so instruments phrased this way manufacture part of the association they detect.
Replication using clinically validated distress measurement, scenario-based risk perception, a discretionary participation outcome, and multi-wave administration would establish whether the direct pathway reported here is a property of the setting or of the instrument.
Author Contributions
Conceptualization, M.I.A. and K.A.; methodology, M.I.A. K.A. and M.U.H.; software, M.U.H and R.M.C.; validation, M.I.A. K.A. R.M.C. A.M. and H.K.; formal analysis, A.M. H.K. and M.I.K.; investigation, M.I.A. K.A. R.M.C and A.M.; resources, R.M.C and M.I.K.; data curation, M.I.A. K.A. R.M.C. A.M and H.K.; writing—original draft preparation, M.I.A. K.A. and M.U.H.; writing—review and editing, R.M.C and M.I.K.; supervision, K.A. and R.M.C. All authors have read and agreed to the published version of the manuscript.
Funding
This work was supported and funded by the Deanship of Scientific Research at Imam Mohammad Ibn Saud Islamic University (IMSIU) (grant number IMSIU-DDRSP2602).
Data Availability Statement
The original contributions presented in this study are included in the article. Further inquiries can be directed to the corresponding authors.
Conflicts of Interest
The authors declare no conflicts of interest.
References
- Yan, D.Y.; Zhao, X.B.; Kalutara, P.; et al. Modeling antecedents of safety compliance of construction workers in Australia: a perspective of trait activation theory. Eng. Constr. Archit. Manag. 2025, 32(2), 1141–62. [Google Scholar] [CrossRef]
- Liu, W.Y.; Meng, Q.F.; Li, Z.; et al. Linking organizational safety support and construction workers’ safety behavior: the roles of safety motivation, emotional exhaustion and psychosocial safety climate. Eng. Constr. Archit. Manag. 2025, 32(10), 6536–65. [Google Scholar] [CrossRef]
- Abdalla, A.; Li, X.D.; Yang, F. Stressors and job burnout of Chinese expatriate construction professionals. Eng. Constr. Archit. Manag. 2025, 32(2), 705–31. [Google Scholar] [CrossRef]
- Ashraf, H.; Ejaz, M.K.; Memon, S.A.; et al. Examining a two-step working model of safety knowledge in translating safety climate into safety behavior. Eng. Constr. Archit. Manag. 2025, 32(1), 282–304. [Google Scholar] [CrossRef]
- Ouyang, Y.W.; Luo, X.W. Effects of physical fatigue superimposed on high temperatures on construction workers’ cognitive performance. Saf. Sci. 2025, 181 . [Google Scholar] [CrossRef]
- Elmousalami, H.; Hui, F.K.P.; Aye, L. Electroencephalography (EEG) for psychological hazards and mental health in construction safety automation: Algorithmic Systematic Review (ASR). Autom. Constr. 2025, 177, 106346. [Google Scholar] [CrossRef]
- Sun, J.N.; Chang, F.R.; Zhou, Z.L.; et al. A systematic review of hazard recognition and risk perception research in the construction industry. Saf. Sci. 2025, 186 . [Google Scholar] [CrossRef]
- Nguyen, M. V.; Khanh, H.; Phan, C.T.; et al. Investigating the impacts of psychological safety climate on mental ill health in the Vietnamese construction industry. Eng. Constr. Archit. Manag. 2026, 33(4), 3240–63. [Google Scholar] [CrossRef]
- Abiemo, M.K.; Azila-Gbettor, E.M.; Atatsi, E.A.; et al. Predicting project performance from occupational stress, psychological availability and ethical leadership: moderated-mediation and mediated-moderation models. Eng. Constr. Archit. Manag. 2026, 33(2), 1194–213. [Google Scholar] [CrossRef]
- Chan, A.P.C.; Nwaogu, J.M.; Naslund, J.A. Mental Ill-Health Risk Factors in the Construction Industry: Systematic Review. J. Constr. Eng. Manag 2020, 146(3), 04020004. [Google Scholar] [CrossRef] [PubMed]
- Tijani, B.; Jin, X.H.; Osei-kyei, R. A systematic review of mental stressors in the construction industry. Int. J. Build. Pathol. Adapt. 2021, 39(2), 433–60. [Google Scholar] [CrossRef]
- Boschman, J.S.; Molen, H.F.; van der; Sluiter, J.K.; et al. Psychosocial work environment and mental health among construction workers. Appl. Ergon. 2013, 44(5), 748–55. [Google Scholar] [CrossRef] [PubMed]
- Bowen, P.; Edwards, P.; Lingard, H.; et al. Occupational stress and job demand, control and support factors among construction project consultants. Int. J. Proj. Manag. 2014, 32(7), 1273–84. [Google Scholar] [CrossRef]
- Sun, C.J.Y.; Hon, C.K.H.; Way, K.A.; et al. The relationship between psychosocial hazards and mental health in the construction industry: A meta-analysis. Saf. Sci. 2022, 145. [Google Scholar] [CrossRef]
- Siu, O.L.; Phillips, D.R.; Leung, T.W. Safety climate and safety performance among construction workers in Hong Kong - The role of psychological strains as mediators. Accid. Anal. Prev. 2004, 36(3), 359–66. [Google Scholar] [CrossRef] [PubMed]
- Goldenhar, L.M.; Williams, L.J.; Swanson, N.G. Modelling relationships between job stressors and injury and near-miss outcomes for construction laborers. Work Stress 2003, 17(3), 218–40. [Google Scholar] [CrossRef]
- Li, F.; Jiang, L.; Yao, X.; et al. Job demands, job resources and safety outcomes: The roles of emotional exhaustion and safety compliance. Accid. Anal. Prev. 2013, 51, 243–51. [Google Scholar] [CrossRef] [PubMed]
- Wang, D.; Wang, X.Q.; Xia, N.N. How safety-related stress affects workers’ safety behavior: The moderating role of psychological capital. Saf. Sci. 2018, 103, 247–59. [Google Scholar] [CrossRef]
- Clarke, S. The relationship between safety climate and safety performance: A meta-analytic review. J. Occup. Health Psychol. 2006, 11(4), 315–27. [Google Scholar] [CrossRef] [PubMed]
- Turner, N.; Stride, C.B.; Carter, A.J.; et al. Job Demands-Control-Support model and employee safety performance. Accid. Anal. Prev. 2012, 45, 811–7. [Google Scholar] [CrossRef] [PubMed]
- Jung, M.; Lim, S.; Chi, S. Impact of Work Environment and Occupational Stress on Safety Behavior of Individual Construction Workers. Int. J. Environ. Res. Public Health 2020, 17(22). [Google Scholar] [CrossRef] [PubMed]
- Pandit, B.; Albert, A.; Patil, Y.; et al. Impact of safety climate on hazard recognition and safety risk perception. Saf. Sci. 2019, 113, 44–53. [Google Scholar] [CrossRef]
- Li, J.; Li, H.; Wang, H.W.; et al. Evaluating the impact of mental fatigue on construction equipment operators’ ability to detect hazards using wearable eye-tracking technology. Autom. Constr. 2019, 105. [Google Scholar] [CrossRef]
- Fang, D.P.; Jiang, Z.M.; Zhang, M.Z.; et al. An experimental method to study the effect of fatigue on construction workers’ safety performance. Saf. Sci. 2015, 73, 80–91. [Google Scholar] [CrossRef]
- Man, S.S.; Chan, A.H.S.; Alabdulkarim, S. Quantification of risk perception: Development and validation of the construction worker risk perception (CoWoRP) scale. J. Saf. Res. 2019, 71, 25–39. [Google Scholar] [CrossRef] [PubMed]
- Man, S.S.; Chan, F.R.; Chan, A.H.S. Affective risk perception index as a screening tool for construction workers. Saf. Sci. 2024, 175. [Google Scholar] [CrossRef]
- Man, S.S.; Chan, A.H.S.; Alabdulkarim, S.; et al. The effect of personal and organizational factors on the risk-taking behavior of Hong Kong construction workers. Saf. Sci. 2021, 136. [Google Scholar] [CrossRef]
- Hall, G.B.; Dollard, M.F.; Coward, J. Psychosocial Safety Climate: Development of the PSC-12. Int. J. Stress Manag 2010, 17(4), 353–83. [Google Scholar] [CrossRef]
- Manapragada, A.; Bruk-Lee, V. Staying silent about safety issues: Conceptualizing and measuring safety silence motives. Accid. Anal. Prev. 2016, 91, 144–56. [Google Scholar] [CrossRef] [PubMed]
- Jiang, L.X.; Probst, T.M. A Multilevel Examination of Affective Job Insecurity Climate on Safety Outcomes. J. Occup. Health Psychol. 2016, 21(3), 366–77. [Google Scholar] [CrossRef] [PubMed]
- Probst, T.M. Organizational Safety Climate and Supervisor Safety Enforcement: Multilevel Explorations of the Causes of Accident Underreporting. J. Appl. Psychol. 2015, 100(6), 1899–907. [Google Scholar] [CrossRef] [PubMed]
- Mohamed, S.; Ali, T.H.; Tam, W.Y.V. National culture and safe work behavior of construction workers in Pakistan. Saf. Sci. 2009, 47. [Google Scholar] [CrossRef]
- Zahoor, H.; Chan, A.P.C.; Utama, W.P.; et al. Determinants of Safety Climate for Building Projects: SEM-Based Cross-Validation Study. J. Constr. Eng. Manag 2017, 143(6). [Google Scholar] [CrossRef]
- Khan, M.W.; Ali, Y.; De, Felice F; et al. Occupational health and safety in construction industry in Pakistan using modified-SIRA method. Saf. Sci. 2019, 118. [Google Scholar] [CrossRef]
- Henseler, J.; Hubona, G.; Ray, P.A. Using PLS path modeling in new technology research: updated guidelines. Ind. Manag. DATA Syst. 2016, 116(1), 2–20. [Google Scholar] [CrossRef]
- Nitzl, C.; Roldan, J.L.; Cepeda, G. Mediation analysis in partial least squares path modeling Helping researchers discuss more sophisticated models. Ind. Manag. DATA Syst. 2016, 116(9), 1849–64. [Google Scholar] [CrossRef]
- Henseler, J.; Ringle, C.M.; Sarstedt, M. A new criterion for assessing discriminant validity in variance-based structural equation modeling. J. Acad. Mark. Sci. 2015, 43(1), 115–35. [Google Scholar] [CrossRef]
- Hair, J.F.; Astrachan, C.B.; Moisescu, O.I.; et al. Executing and interpreting applications of PLS-SEM: Updates for family business researchers. J. Fam. Bus. STRATEGY 2021, 12(3). [Google Scholar] [CrossRef]
- Chin, W.; Cheah, J.H.; Liu, Y.D.; et al. Demystifying the role of causal-predictive modeling using partial least squares structural equation modeling in information systems research. Ind. Manag. DATA Syst. 2020, 120(12), 2161–209. [Google Scholar] [CrossRef]
- Choi, J.; Gu, B.; Chin, S.; et al. Machine learning predictive model based on national data for fatal accidents of construction workers. Autom. Constr. 2020, 110. [Google Scholar] [CrossRef]
- Poh, C.Q.X.; Ubeynarayana, C.U.; Goh, Y.M. Safety leading indicators for construction sites: A machine learning approach. Autom. Constr. 2018, 93, 375–86. [Google Scholar] [CrossRef]
- Barbaranelli, C.; Petitta, L.; Probst, T.M. Does safety climate predict safety performance in Italy and the USA? Cross-cultural validation of a theoretical model of safety climate. Accid. Anal. Prev. 2015, 77, 35–44. [Google Scholar] [CrossRef] [PubMed]
- Zhao, W.; Li, S.Q. How does psychosocial safety climate affect safety behavior in the construction industry? A cross-level analysis. Front Public Health 2024, 12. [Google Scholar] [CrossRef] [PubMed]
- Liang, Q.; Mei, L.; Xu, J.; et al. Barriers to Safety Participation of Construction Workers in Project Organization from a Stress Perspective. J. Manag. Eng. 2024, 40(6). [Google Scholar] [CrossRef]
- Cong, W.Y.; Zhang, S.J.; Liang, H.K.; et al. Impact of challenge and hindrance job stressors on informal safety communication of construction workers in China: the moderating role of co-worker relationship. Eng. Constr. Archit. Manag. 2024, 31(5), 2011–33. [Google Scholar] [CrossRef]
- Ma, G.F.; Zhang, Y.Y.; Jiang, S.; et al. Fostering resilient safety culture to boost safety performance of young construction workers: Insights from empirical and simulation studies. Int. J. Ind. Ergon. 2025, 105 . [Google Scholar] [CrossRef]
- Martin, H.; Manohar, R.; Ellis, L.; et al. Emotional and Cognitive Landscape of Perceived Risk: Anxiety, Caution, and Financial Loss in Shaping Safety Decisions Using Partial Least Squares Structural Equation Modeling. J. Constr. Eng. Manag 2025, 151(11). [Google Scholar] [CrossRef]
- Huang, D.S.; Li, F.D. Managing time pressures to improve construction safety: Speaking up as a key pathway. WORK-A J. Prev. Assess. Rehabil. 2026, 83(4), 1124–35. [Google Scholar] [CrossRef] [PubMed]
- Long, T.Y.; Xiao, Q.J.; Xiao, R.; et al. From Home to Site: How Family-Work Conflict Influences Construction Workers’ Safety through Thriving and Workplace Anxiety. J. Constr. Eng. Manag 2026, 152(2). [Google Scholar] [CrossRef]
- Li, B.N.; Huang, Y.C.; Lim, H.W.; et al. How Foreman Safety Leadership Influences Worker Safety Behavior: An Empirical Study from a Developmental Psychology Perspective. J. Constr. Eng. Manag 2026, 152(2). [Google Scholar] [CrossRef]
- KARASEK, R.A. JOB DEMANDS, JOB DECISION LATITUDE, AND MENTAL STRAIN - IMPLICATIONS FOR JOB REDESIGN. Adm. Sci. Q. 1979, 24(2), 285–308. [Google Scholar] [CrossRef]
- KARASEK, R.A.; TRIANTIS, K.P.; CHAUDHRY, S.S. CO-WORKER AND SUPERVISOR SUPPORT AS MODERATORS OF ASSOCIATIONS BETWEEN TASK CHARACTERISTICS AND MENTAL STRAIN. J. Occup. Behav. 1982, 3(2), 181–200. [Google Scholar] [CrossRef]
- Luchman, J.N.; González-Morales, M.G. Demands, Control, and Support: A Meta-Analytic Review of Work Characteristics Interrelationships. J. Occup. Health Psychol. 2013, 18(1), 37–52. [Google Scholar] [CrossRef] [PubMed]
- Demerouti, E.; Bakker, A.B.; Nachreiner, F.; et al. The job demands-resources model of burnout. J. Appl. Psychol. 2001, 86(3), 499–512. [Google Scholar] [CrossRef]
- Demerouti, E.; Bakker, A.B. The Job Demands-Resources model: Challenges for future research. SA J. Ind. Psychol. 2011, 37(2). [Google Scholar] [CrossRef]
- Bakker, A.B.; Demerouti, E. Job Demands-Resources Theory: Taking Stock and Looking Forward. J. Occup. Health Psychol. 2017, 22(3), 273–85. [Google Scholar] [CrossRef] [PubMed]
- Bakker, A.B.; Demerouti, E.; Sanz-Vergel, A. Job Demands-Resources Theory: Ten Years Later. Annu. Rev. Organ. Psychol. Organ. Behav. 2023, 10, 25–53. [Google Scholar] [CrossRef]
- Derdowski, L.A.; Mathisen, G.E. Psychosocial factors and safety in high-risk industries: A systematic literature review. Saf. Sci. 2023, 157. [Google Scholar] [CrossRef]
- Dollard, M.F.; Tuckey, M.R.; Dormann, C. Psychosocial safety climate moderates the job demand-resource interaction in predicting workgroup distress. Accid. Anal. Prev. 2012, 45, 694–704. [Google Scholar] [CrossRef] [PubMed]
- Sunindijo, R.Y.; Kamardeen, I. Work Stress Is a Threat to Gender Diversity in the Construction Industry. J. Constr. Eng. Manag 2017, 143(10). [Google Scholar] [CrossRef]
- Halbesleben, J.R.B. The Role of Exhaustion and Workarounds in Predicting Occupational Injuries: A Cross-Lagged Panel Study of Health Care Professionals. J. Occup. Health Psychol. 2010, 15(1), 1–16. [Google Scholar] [CrossRef] [PubMed]
- Xia, N.N.; Xie, Q.H.; Griffin, M.A.; et al. Antecedents of safety behavior in construction: A literature review and an integrated conceptual framework. Accid. Anal. Prev. 2020, 148. [Google Scholar] [CrossRef] [PubMed]
- Neal, A.; Griffin, M.A.; Hart, P.M. The impact of organizational climate on safety climate and individual behavior. Saf. Sci. 2000, 34(1–3), 99–109. [Google Scholar] [CrossRef]
- Griffin, M.A.; Hu, X.W. How leaders differentially motivate safety compliance and safety participation: The role of monitoring, inspiring, and learning. Saf. Sci. 2013, 60, 196–202. [Google Scholar] [CrossRef]
- Hair, J.; Alamer, A. Partial Least Squares Structural Equation Modeling (PLS-SEM) in second language and education research: Guidelines using an applied example. Res. METHODS Appl. Linguist. 2022, 1(3). [Google Scholar] [CrossRef]
- Cheah, J.H.; Magno, F.; Cassia, F. Reviewing the SmartPLS 4 software: the latest features and enhancements. J. Mark. Anal. 2024, 12(1), 97–107. [Google Scholar] [CrossRef]
- Becker, J.M.; Cheah, J.H.; Gholamzade, R.; et al. PLS-SEM’s most wanted guidance. Int. J. Contemp. Hosp. Manag. 2023, 35(1), 321–46. [Google Scholar] [CrossRef]
- Sharma, P.N.; Liengaard, B.D.D.; Hair, J.F.; et al. Predictive model assessment and selection in composite-based modeling using PLS-SEM: extensions and guidelines for using CVPAT. Eur. J. Mark. 2023, 57(6), 1662–77. [Google Scholar] [CrossRef]
- Podsakoff, P.M.; MacKenzie, S.B.; Lee, J.Y.; et al. Common method biases in behavioral research: A critical review of the literature and recommended remedies. J. Appl. Psychol. 2003, 88(5), 879–903. [Google Scholar] [CrossRef] [PubMed]
- Rafique, M.; Ahmed, S.; Ismail, M. Impact of Safety Climate on Safety Behavior in Construction Projects: Mediating Mechanism and Interacting Effect. J. Constr. Dev. Ctries. 2021, 26(2), 163–81. [Google Scholar] [CrossRef]
- Novieto, D.T. Safety climate and occupational safety behaviors: the mediating role of psychological ownership among construction professionals. Eng. Constr. Archit. Manag. 2023, 30(2), 853–68. [Google Scholar] [CrossRef]
- Beus, J.M.; Payne, S.C.; Bergman, M.E.; et al. Safety Climate and Injuries: An Examination of Theoretical and Empirical Relationships. J. Appl. Psychol. 2010, 95(4), 713–27. [Google Scholar] [CrossRef] [PubMed]
- Seo, H.C.; Lee, Y.S.; Kim, J.J.; et al. Analyzing safety behaviors of temporary construction workers using structural equation modeling. Saf. Sci. 2015, 77, 160–8. [Google Scholar] [CrossRef]
- Caponecchia, C.; Sheils, I. Perceptions of personal vulnerability to workplace hazards in the Australian construction industry. J. Saf. Res. 2011, 42. [Google Scholar] [CrossRef] [PubMed]
- Hargreaves, S.; Rustage, K.; Nellums, L.B.; et al. Occupational health outcomes among international migrant workers: a systematic review and meta-analysis. LANCET Glob. Health 2019, 7(7), E872–82. [Google Scholar] [CrossRef] [PubMed]
- Fang, D.P.; Chen, Y.; Wong, L. Safety climate in construction industry: A case study in Hong Kong. J. Constr. Eng. Manag 2006, 132(6), 573–84. [Google Scholar] [CrossRef]
- Starren, A.; Hornikx, J.; Luijters, K. Occupational safety in multicultural teams and organizations: A research agenda. Saf. Sci. 2013, 52, 43–9. [Google Scholar] [CrossRef]
- Alruqi, W.M.; Hallowell, M.R.; Techera, U. Safety climate dimensions and their relationship to construction safety performance: A meta-analytic review. Saf. Sci. 2018, 109, 165–73. [Google Scholar] [CrossRef]
- Alruqi, W.M.; Hallowell, M.R. Critical Success Factors for Construction Safety: Review and Meta-Analysis of Safety Leading Indicators. J. Constr. Eng. Manag 2019, 145(3). [Google Scholar] [CrossRef]
- Nwaogu, J.M.; Chan, A.P.C.; Naslund, J.A. Measures to Improve the Mental Health of Construction Personnel Based on Experts’ Opinion. J. Manag. Eng. 2022, 38(4). [Google Scholar] [CrossRef]
- Choudhry, R.M. Behavior-based safety on construction sites: A case study. Accid. Anal. Prev. 2014, 70. [Google Scholar] [CrossRef] [PubMed]
- Awolusi, I.; Marks, E.; Hallowell, M. Wearable technology for personalized construction safety monitoring and trending: Review of applicable devices. Autom. Constr. 2018, 85, 96–106. [Google Scholar] [CrossRef]
- Ahn, C.R.; Lee, S.; Sun, C.F.; et al. Wearable Sensing Technology Applications in Construction Safety and Health. J. Constr. Eng. Manag 2019, 145(11). [Google Scholar] [CrossRef]
- Lesener, T.; Gusy, B.; Jochmann, A.; et al. The drivers of work engagement: A meta-analytic review of longitudinal evidence. Work Stress 2020, 34(3), 259–78. [Google Scholar] [CrossRef]
- Dollard, M.F.; Bakker, A.B. Psychosocial safety climate as a precursor to conducive work environments, psychological health problems, and employee engagement. J. Occup. Organ Psychol. 2010, 83(3), 579–99. [Google Scholar] [CrossRef]
- Law, R.; Dollard, M.F.; Tuckey, M.R.; et al. Psychosocial safety climate as a lead indicator of workplace bullying and harassment, job resources, psychological health and employee engagement. Accid. Anal. Prev. 2011, 43(5), 1782–93. [Google Scholar] [CrossRef] [PubMed]
- Choudhry, R.M.; Fang, D.P.; Lingard, H. Measuring Safety Climate of a Construction Company. J. Constr. Eng. Manag 2009, 135(9), 890–9. [Google Scholar] [CrossRef]
- Nadhim, E.A.; Hon, C.; Xia, B.; et al. Investigating the Relationships between Safety Climate and Safety Performance Indicators in Retrofitting Works. Constr. Econ. Build. 2018, 18(2), 110–29. [Google Scholar] [CrossRef]
- Idris, M.A.; Dollard, M.F.; Coward, J.; et al. Psychosocial safety climate: Conceptual distinctiveness and effect on job demands and worker psychological health. Saf. Sci. 2012, 50(1), 19–28. [Google Scholar] [CrossRef]
- Chen, Y.T.; McCabe, B.; Hyatt, D. Impact of individual resilience and safety climate on safety performance and psychological stress of construction workers: A case study of the Ontario construction industry. J. Saf. Res. 2017, 61, 167–76. [Google Scholar] [CrossRef] [PubMed]
Figure 1.
Hypothesized structural model relating to psychosocial stressor exposure and role and employment insecurity to safety compliance through perceived strain-related safety impairment.
Figure 1.
Hypothesized structural model relating to psychosocial stressor exposure and role and employment insecurity to safety compliance through perceived strain-related safety impairment.
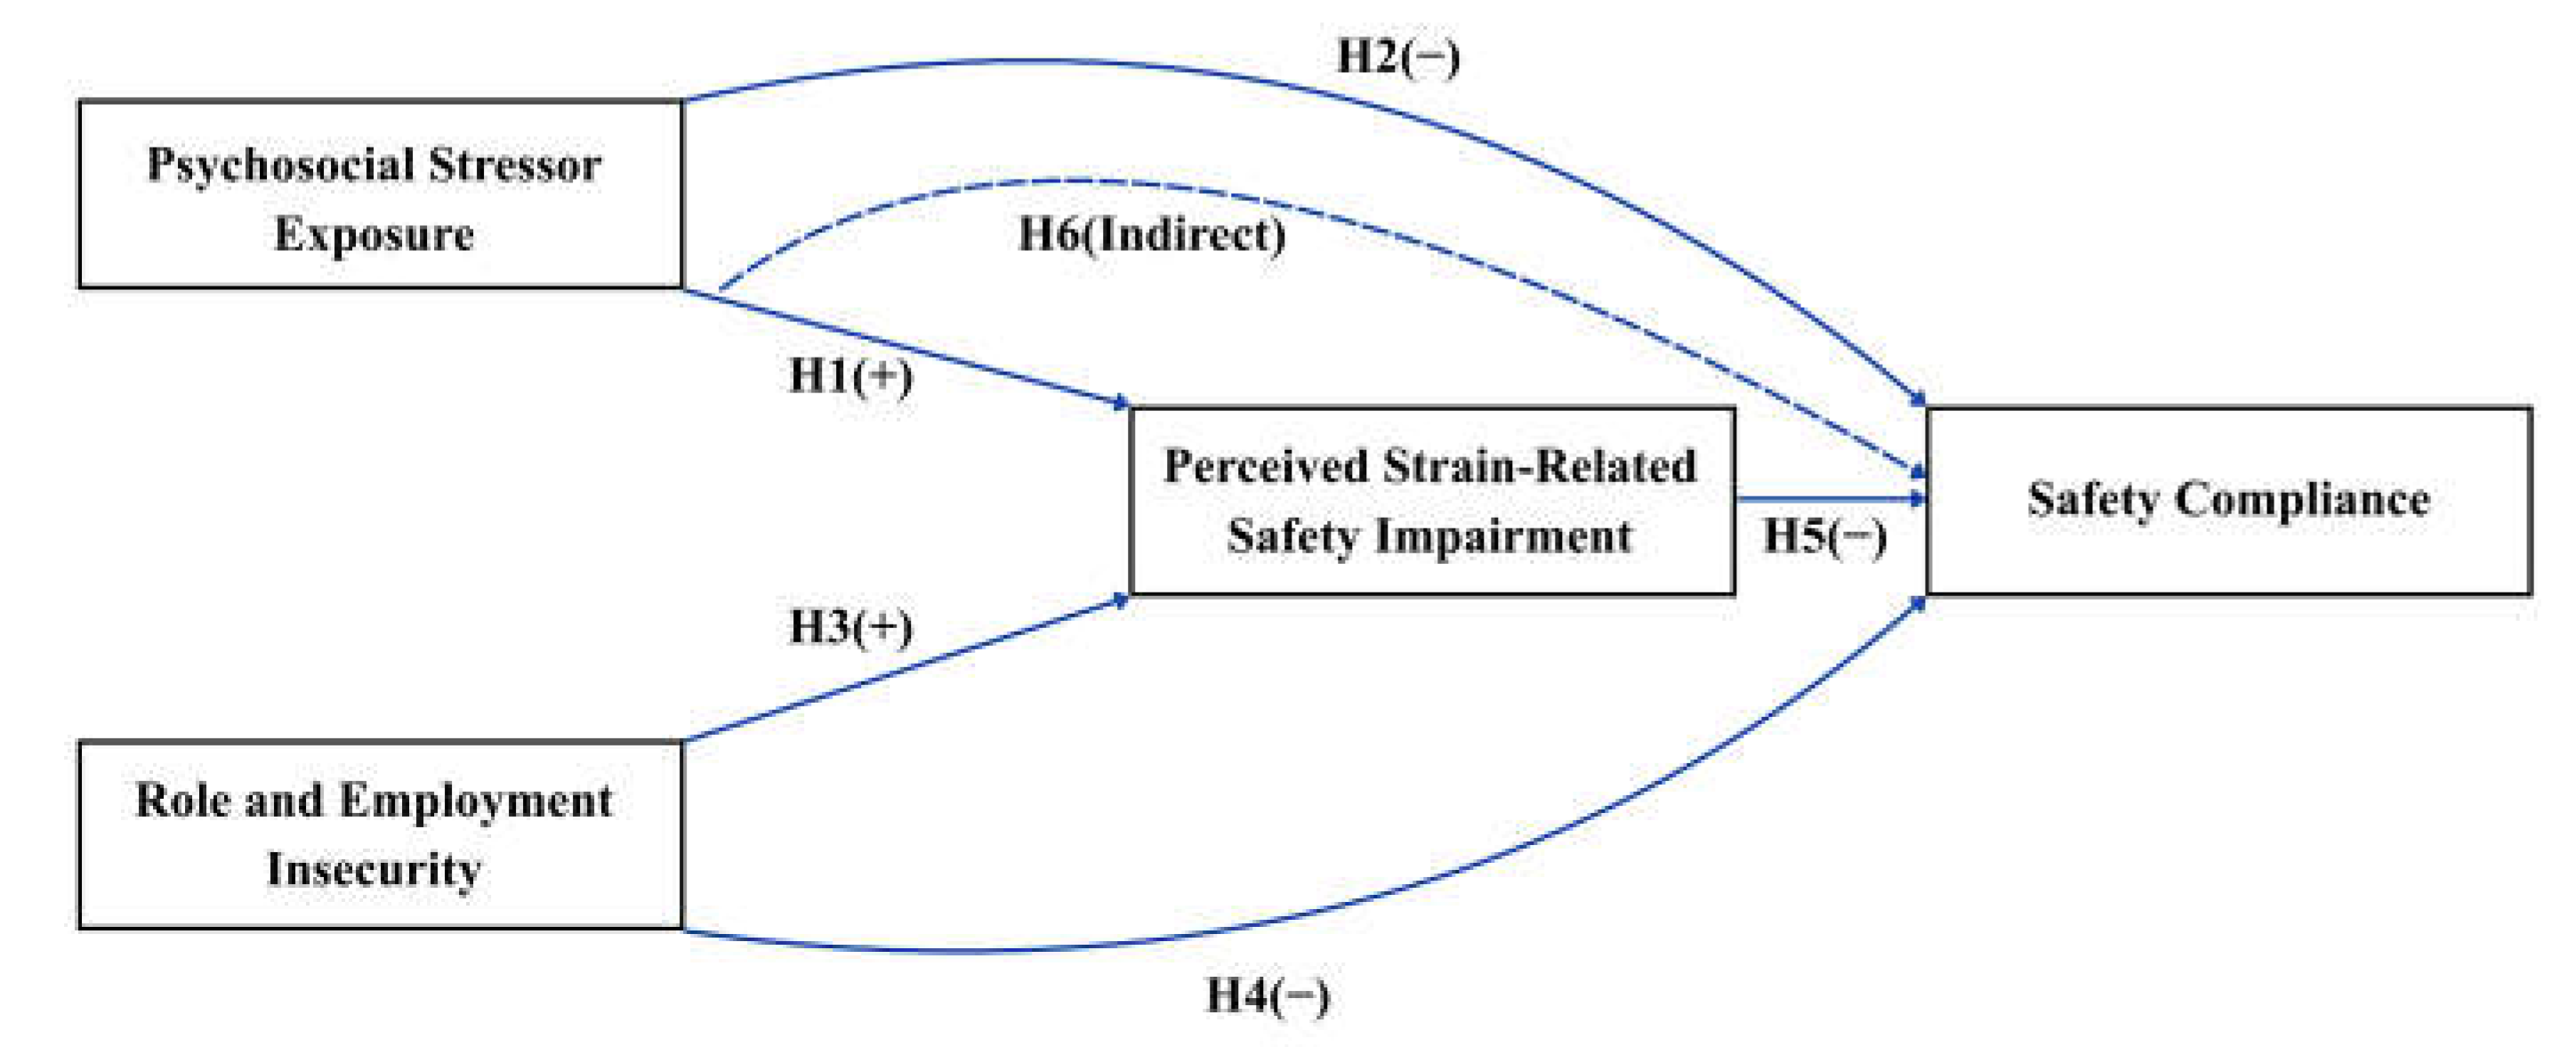
Figure 2.
Three-stage research design comprising construct specifications, questionnaire administration and screening, and model estimation with predictive assessment.
Figure 2.
Three-stage research design comprising construct specifications, questionnaire administration and screening, and model estimation with predictive assessment.
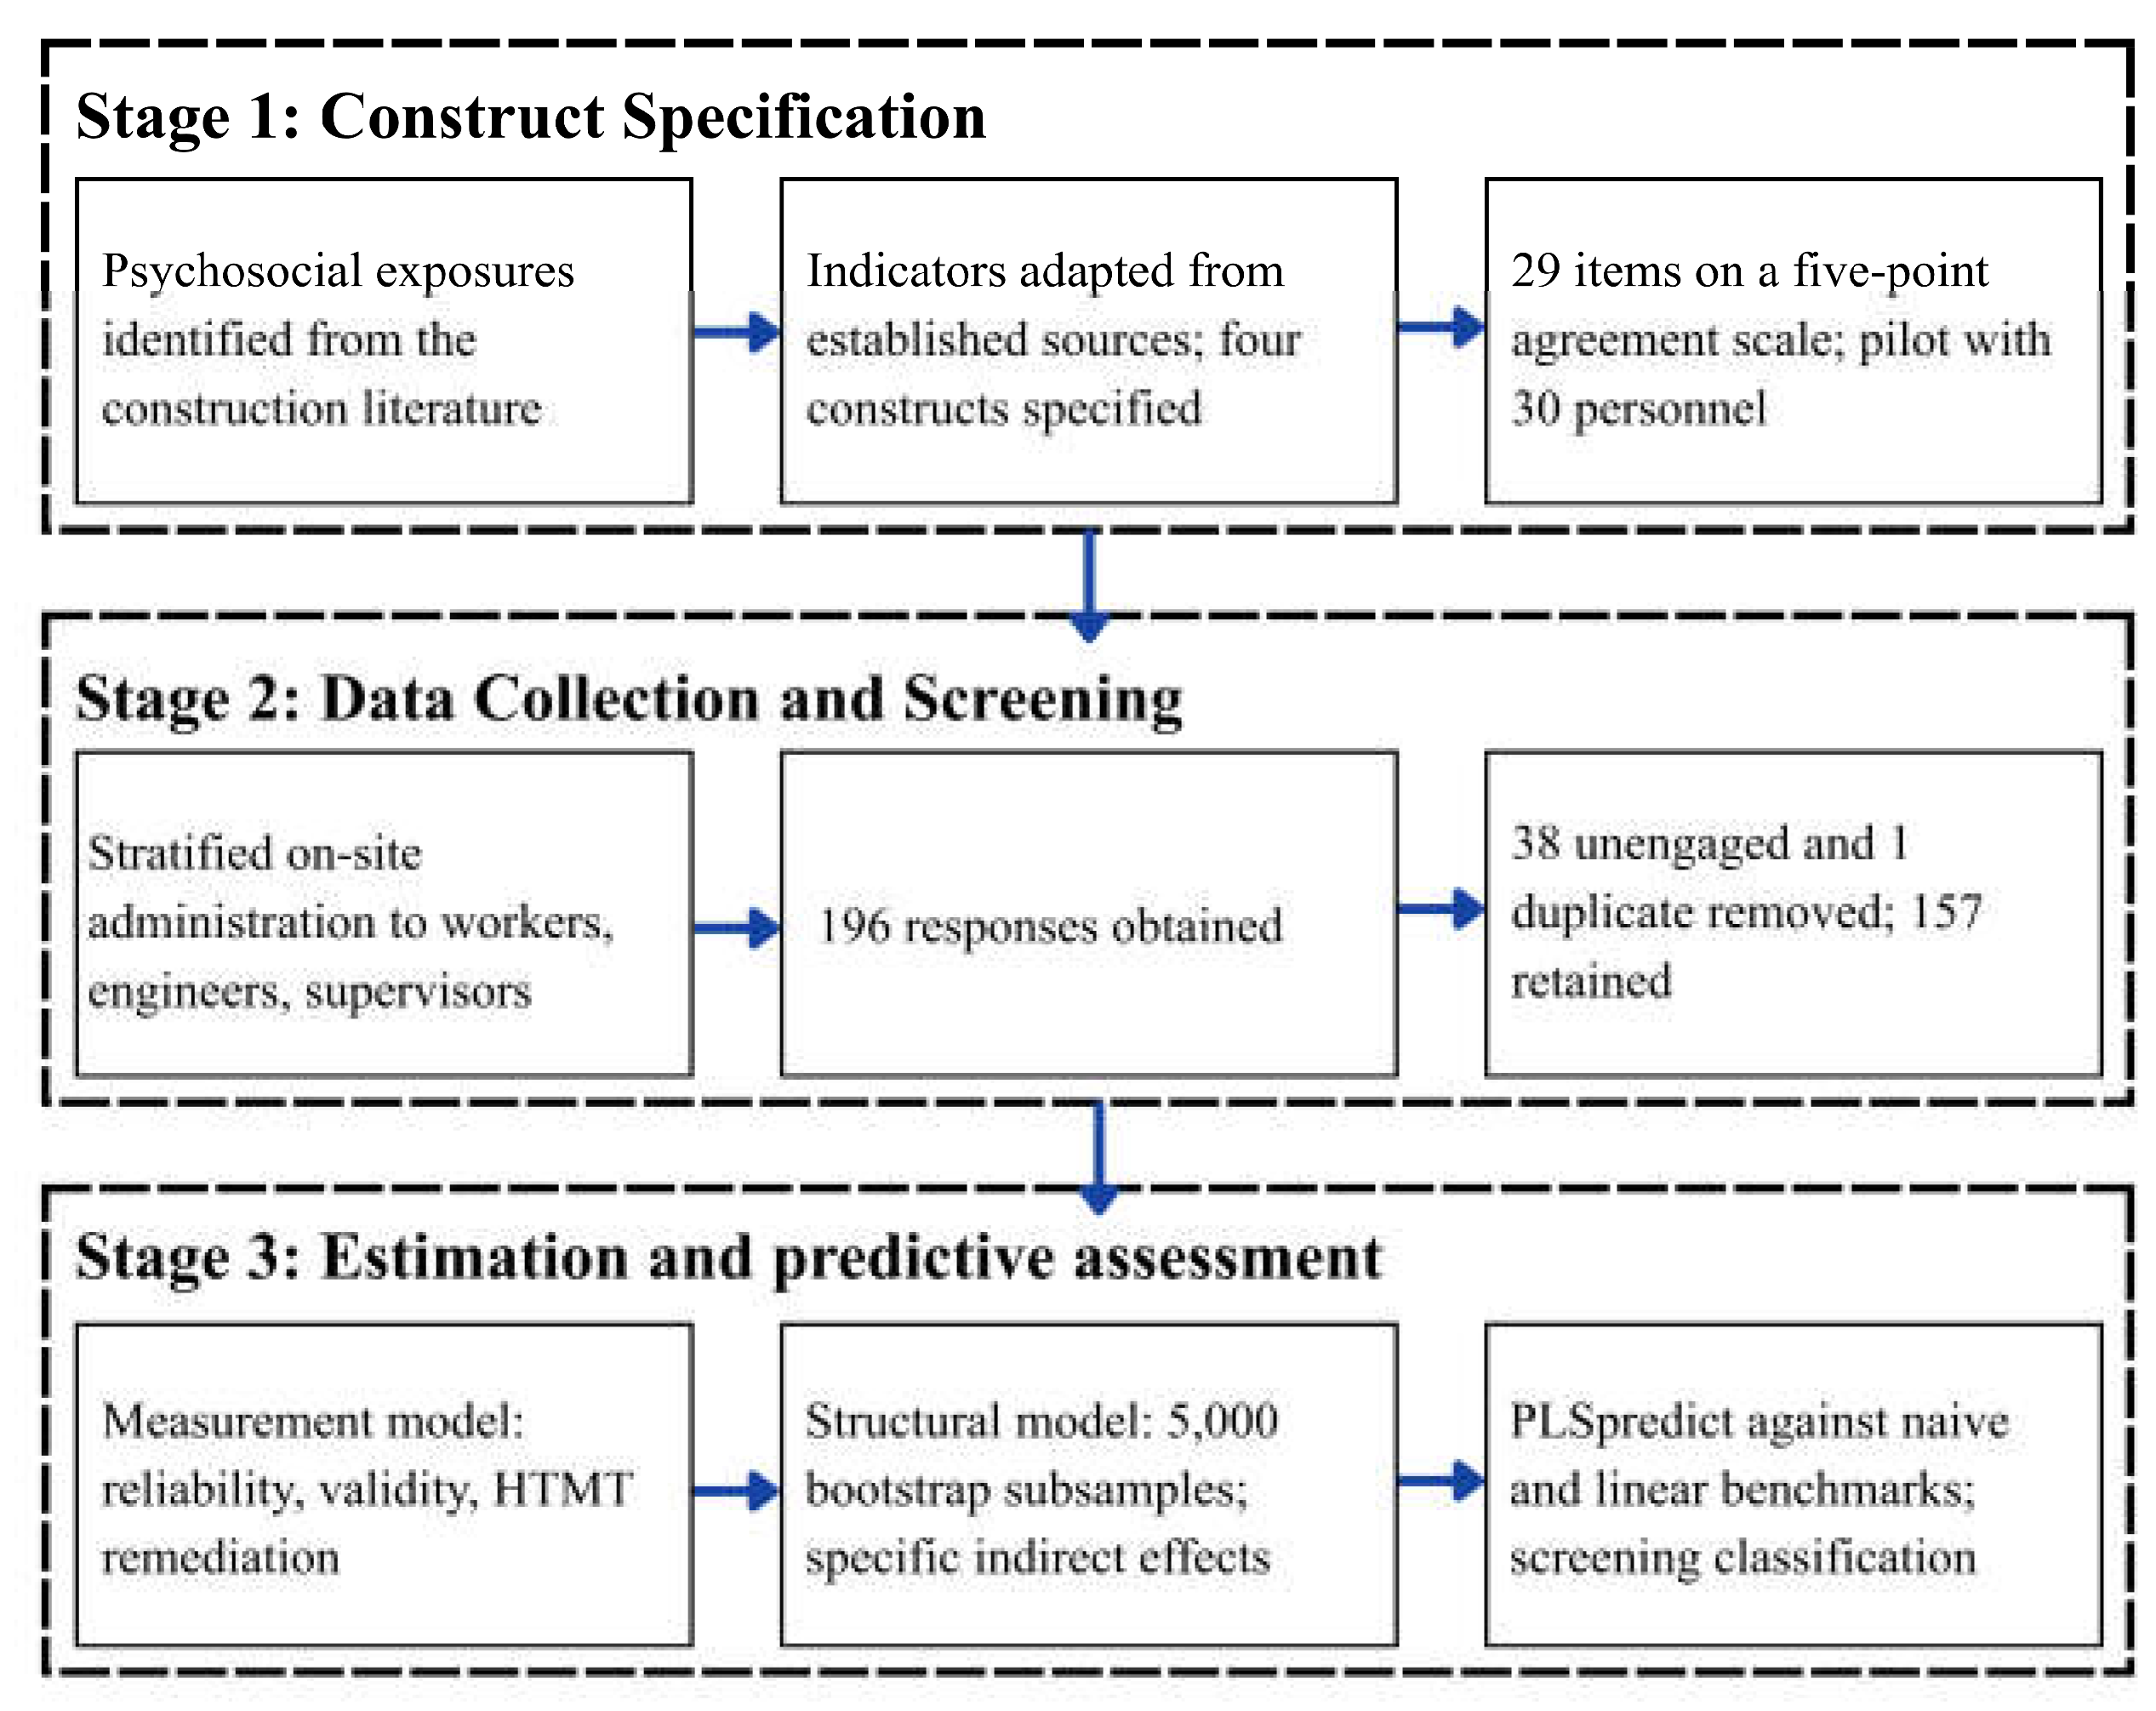
Figure 3.
Predictive assessment procedure, showing (a) stratified partitioning of the analytic sample into training and holdout folds, and (b) the workflow for estimation, prediction on withhold observations, and benchmarking against the naive and linear model benchmarks.
Figure 3.
Predictive assessment procedure, showing (a) stratified partitioning of the analytic sample into training and holdout folds, and (b) the workflow for estimation, prediction on withhold observations, and benchmarking against the naive and linear model benchmarks.
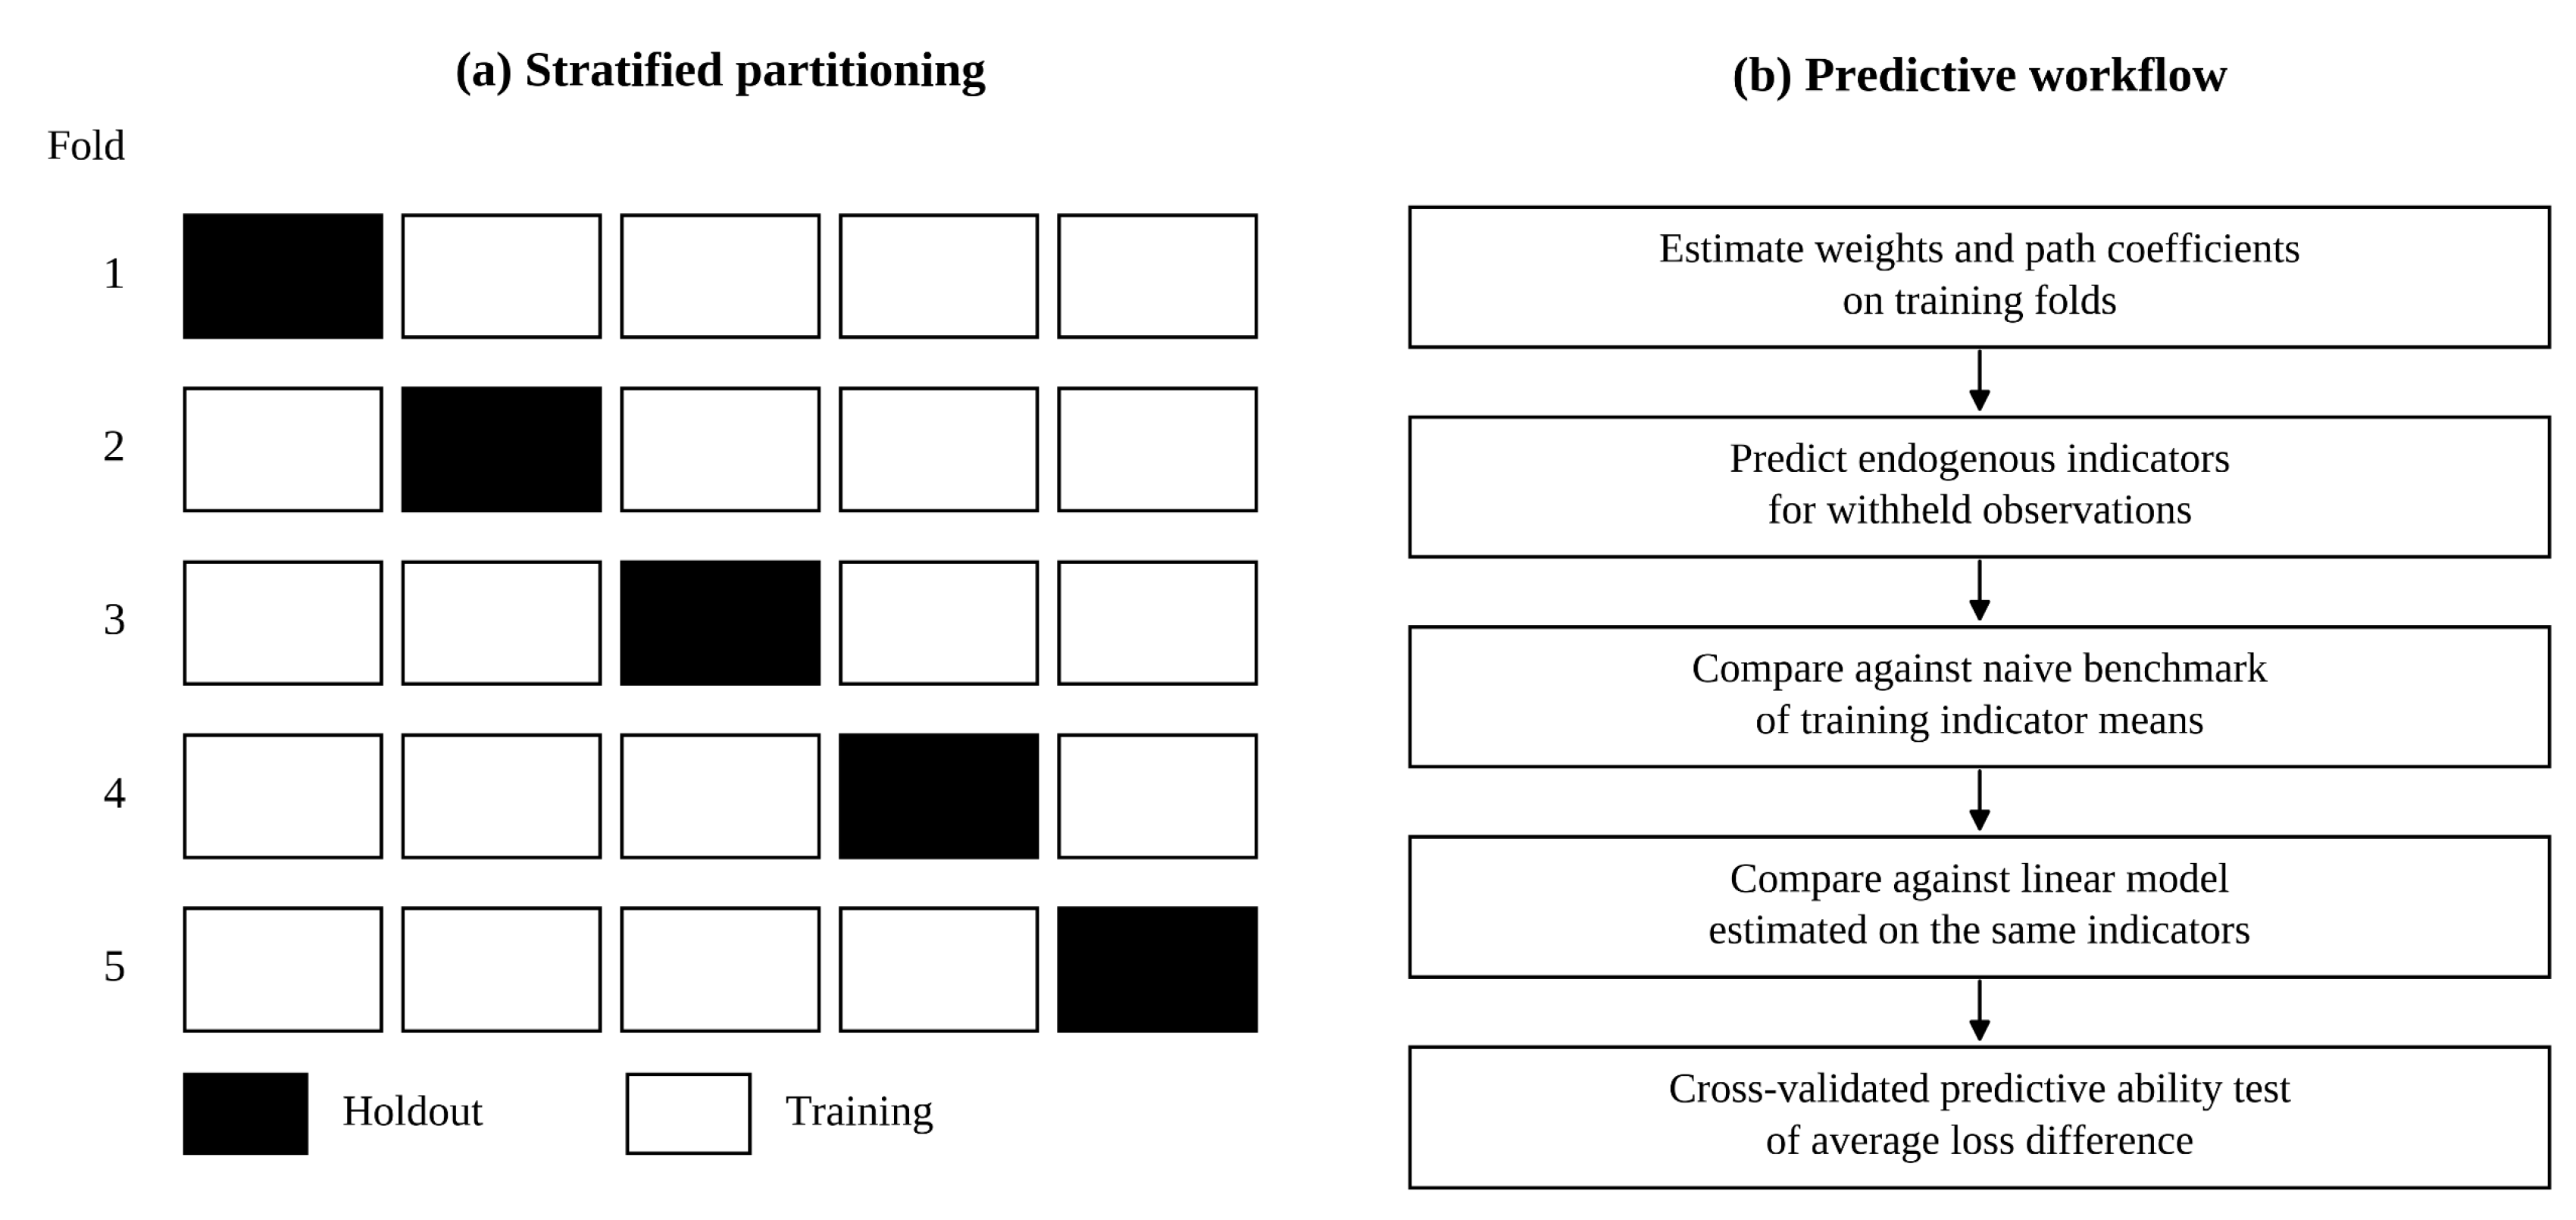
Figure 4.
Estimated structural model showing standardized path coefficients, t-statistics, and explanatory power for each endogenous construct.
Figure 4.
Estimated structural model showing standardized path coefficients, t-statistics, and explanatory power for each endogenous construct.
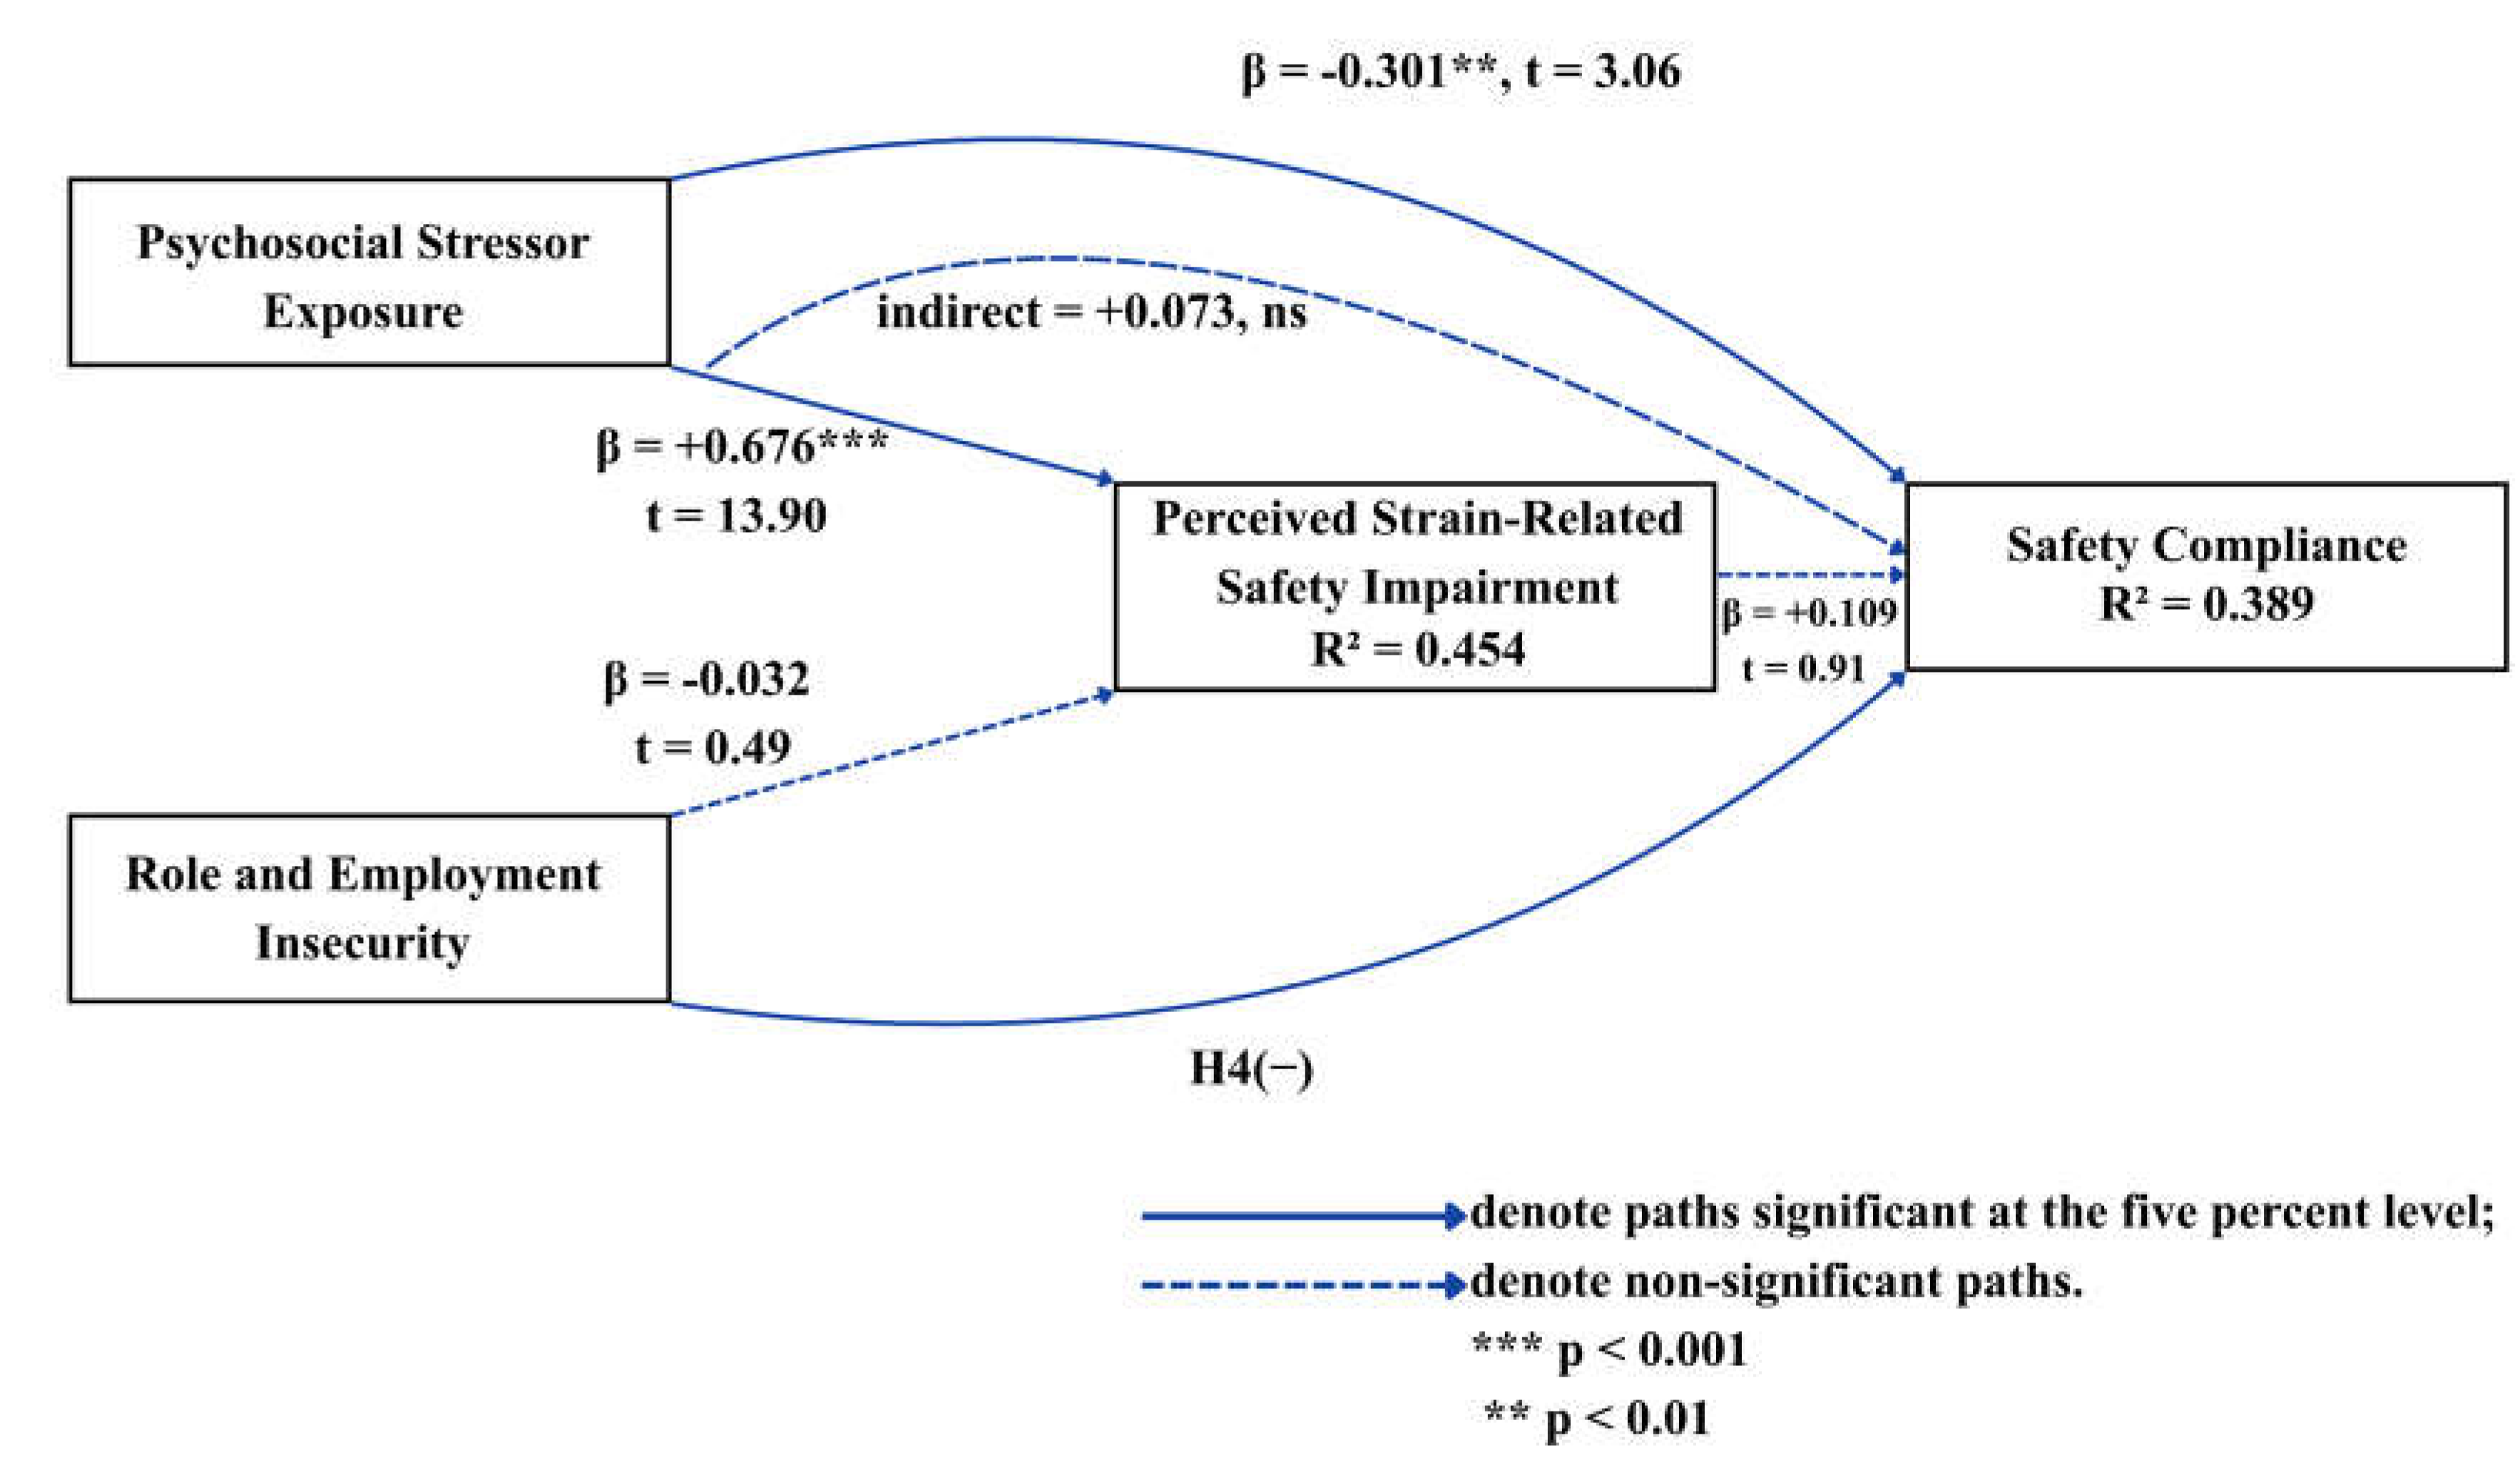
Figure 5.
Distribution of the observed safety compliance composite with the classification threshold at the scale midpoint.
Figure 5.
Distribution of the observed safety compliance composite with the classification threshold at the scale midpoint.
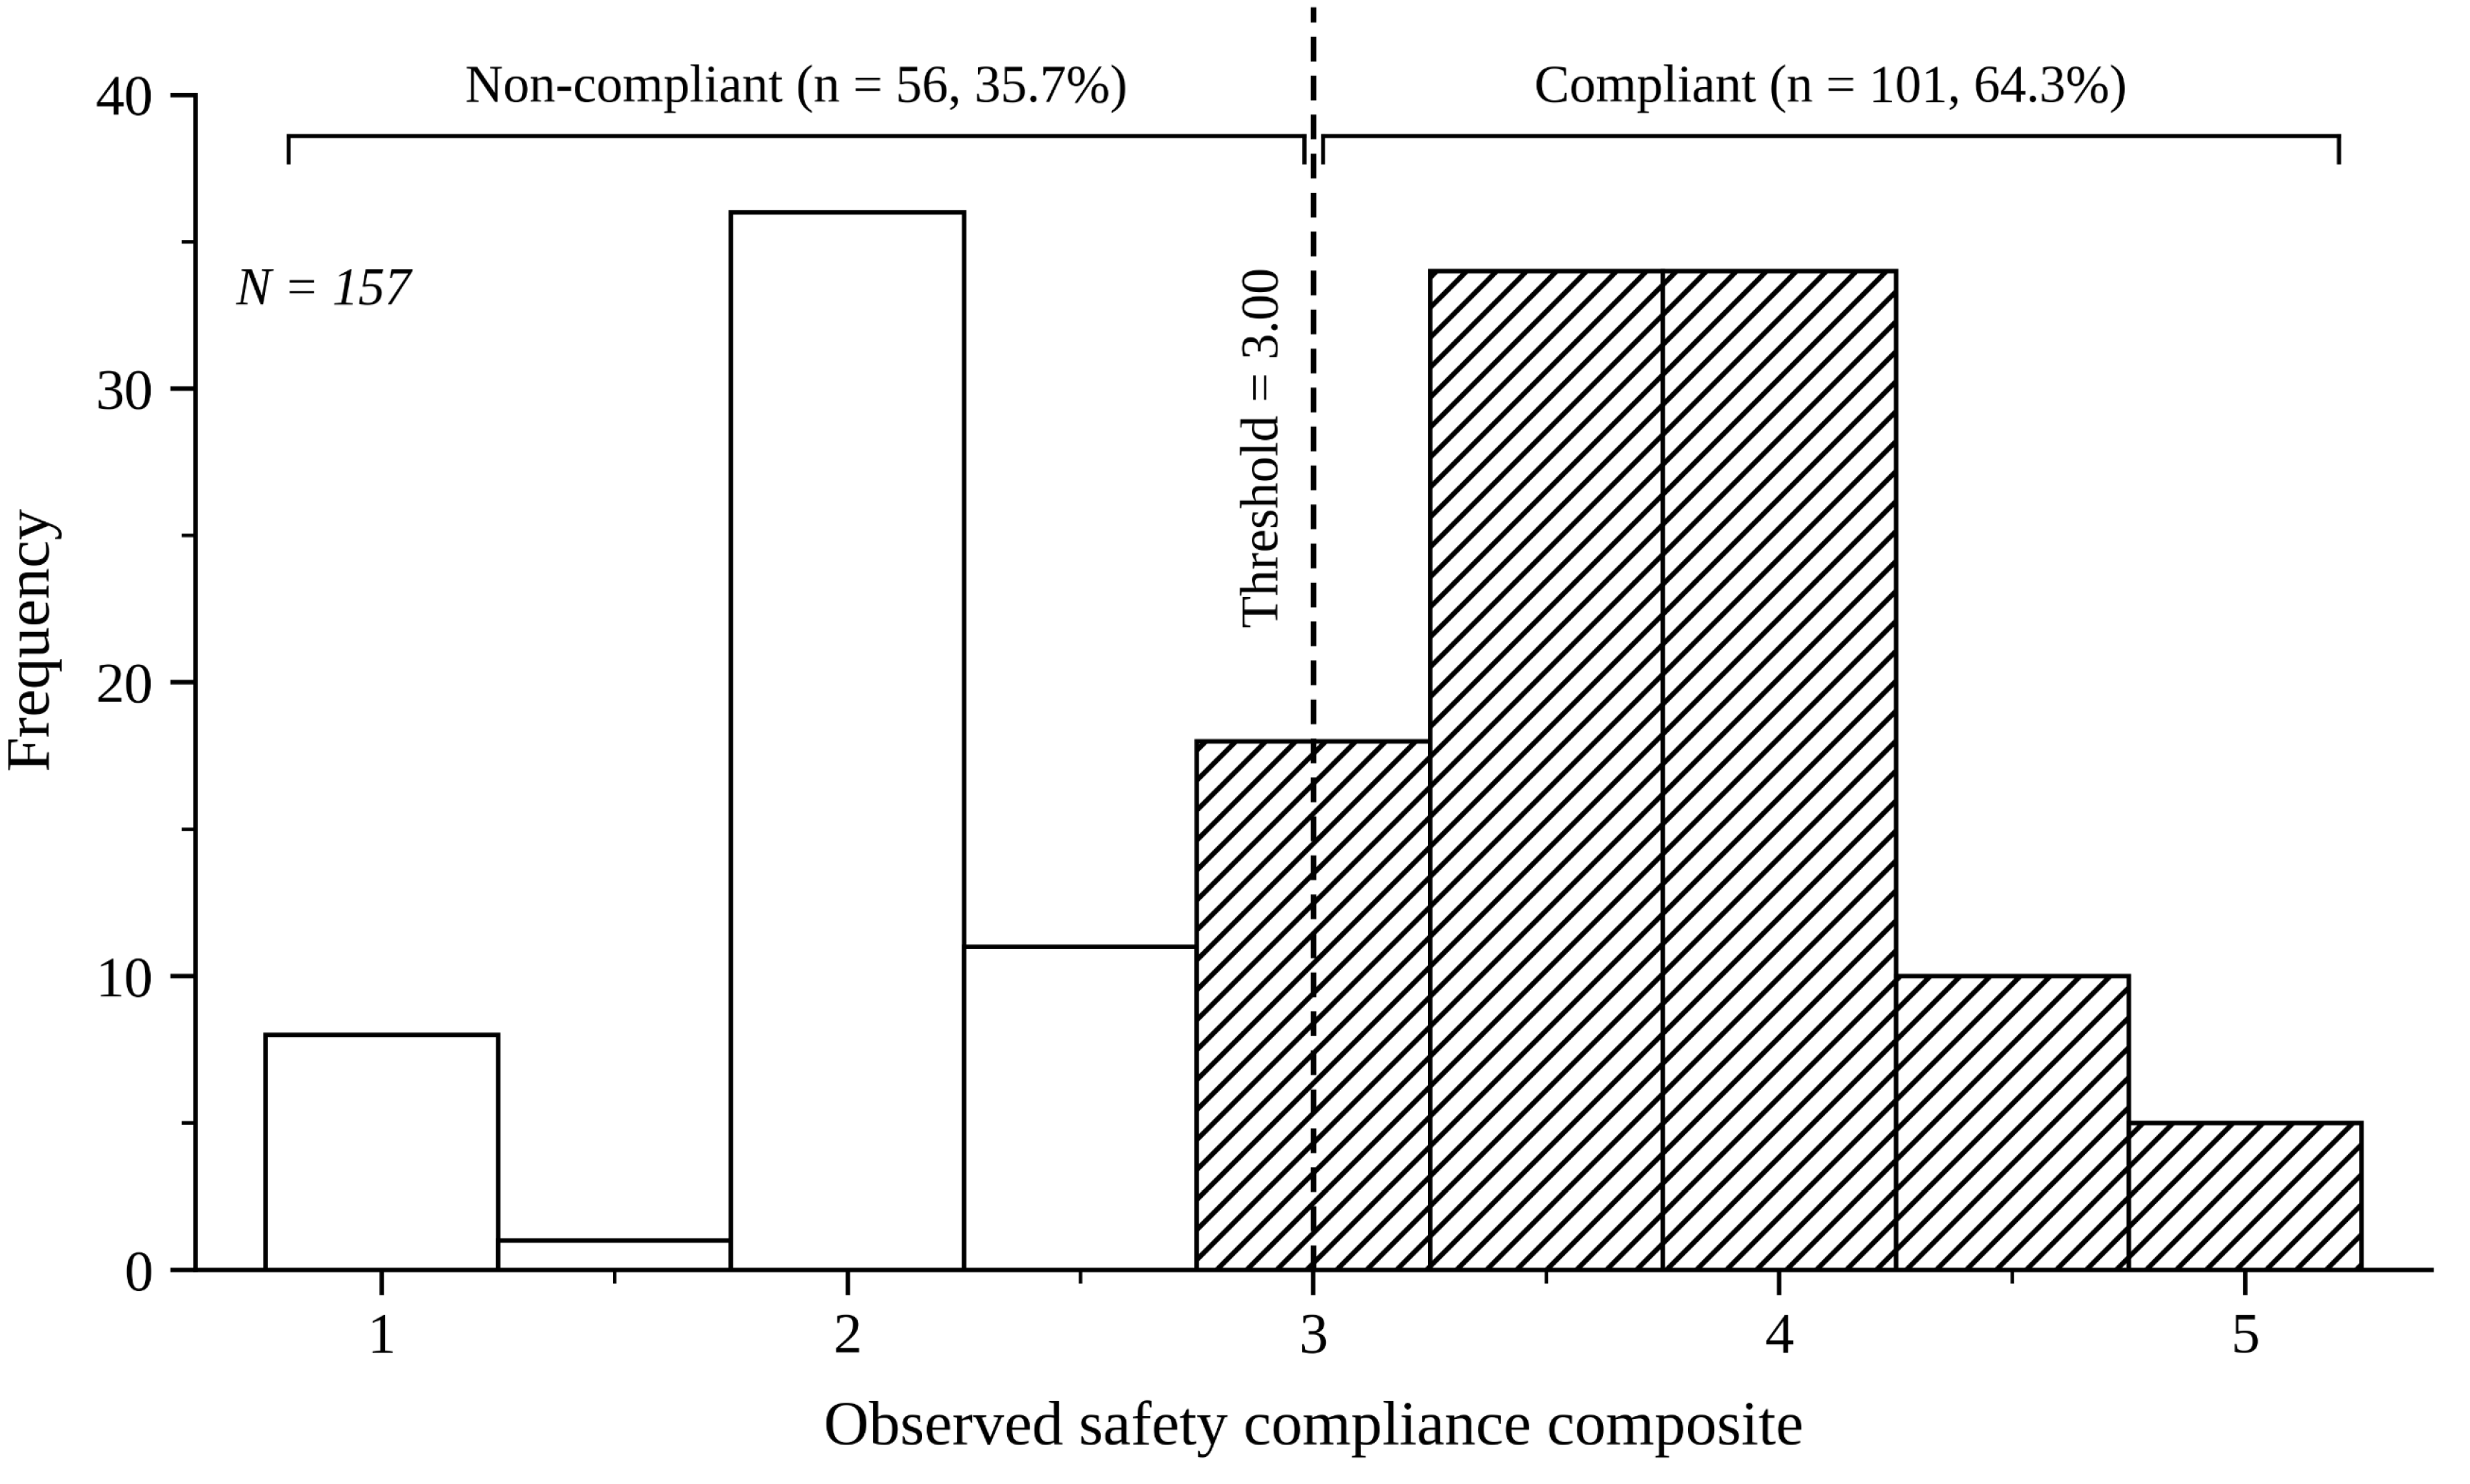
Figure 6.
Classification performance across ten folds, showing (a) training and validation accuracy against the majority-class baseline, and (b) training and validation log loss.
Figure 6.
Classification performance across ten folds, showing (a) training and validation accuracy against the majority-class baseline, and (b) training and validation log loss.
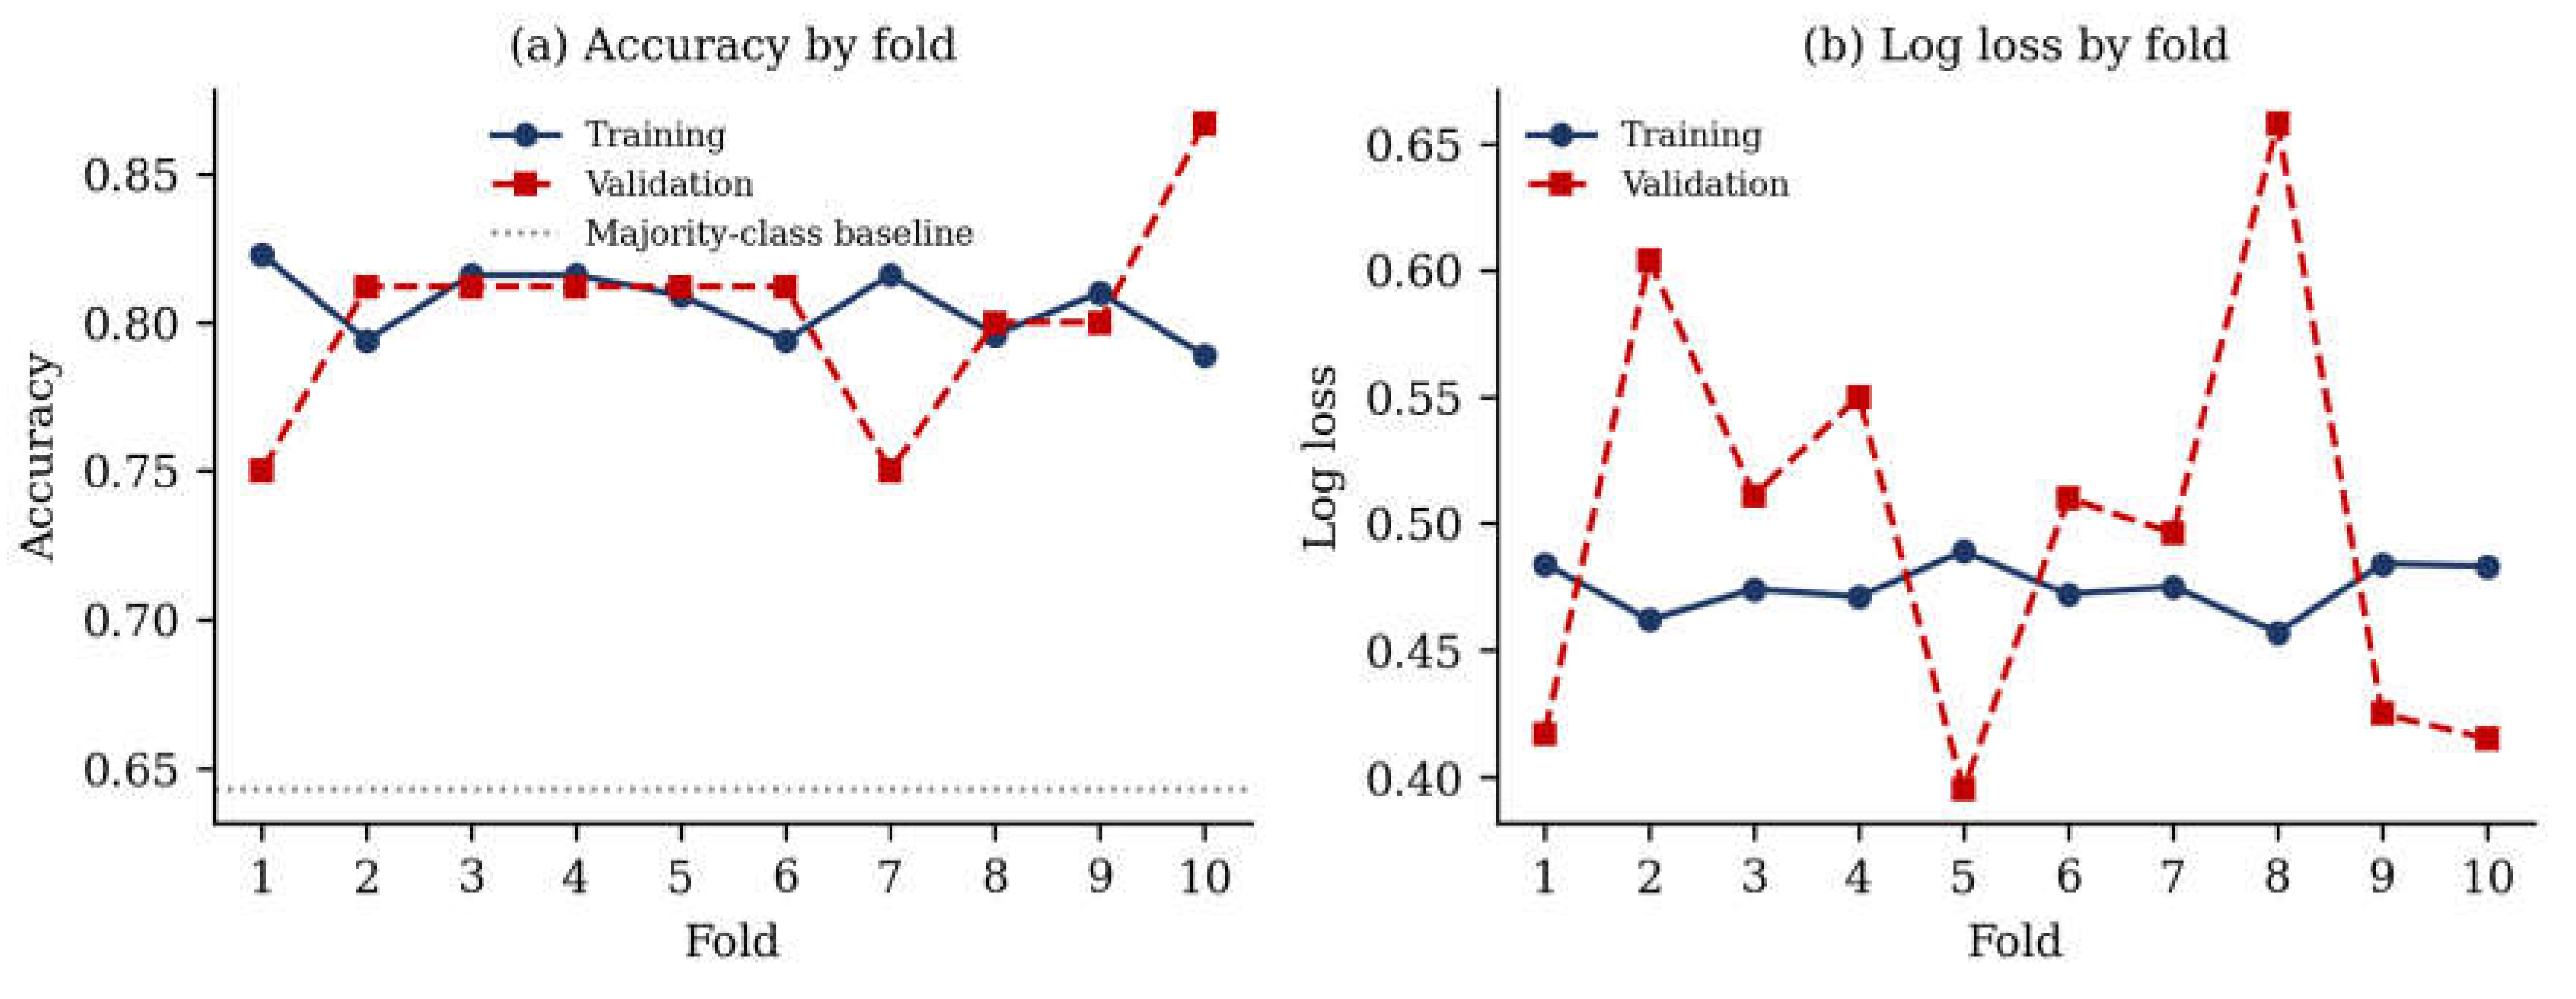
Figure 7.
Confusion matrix for the logistic classifier under stratified ten-fold partitioning.
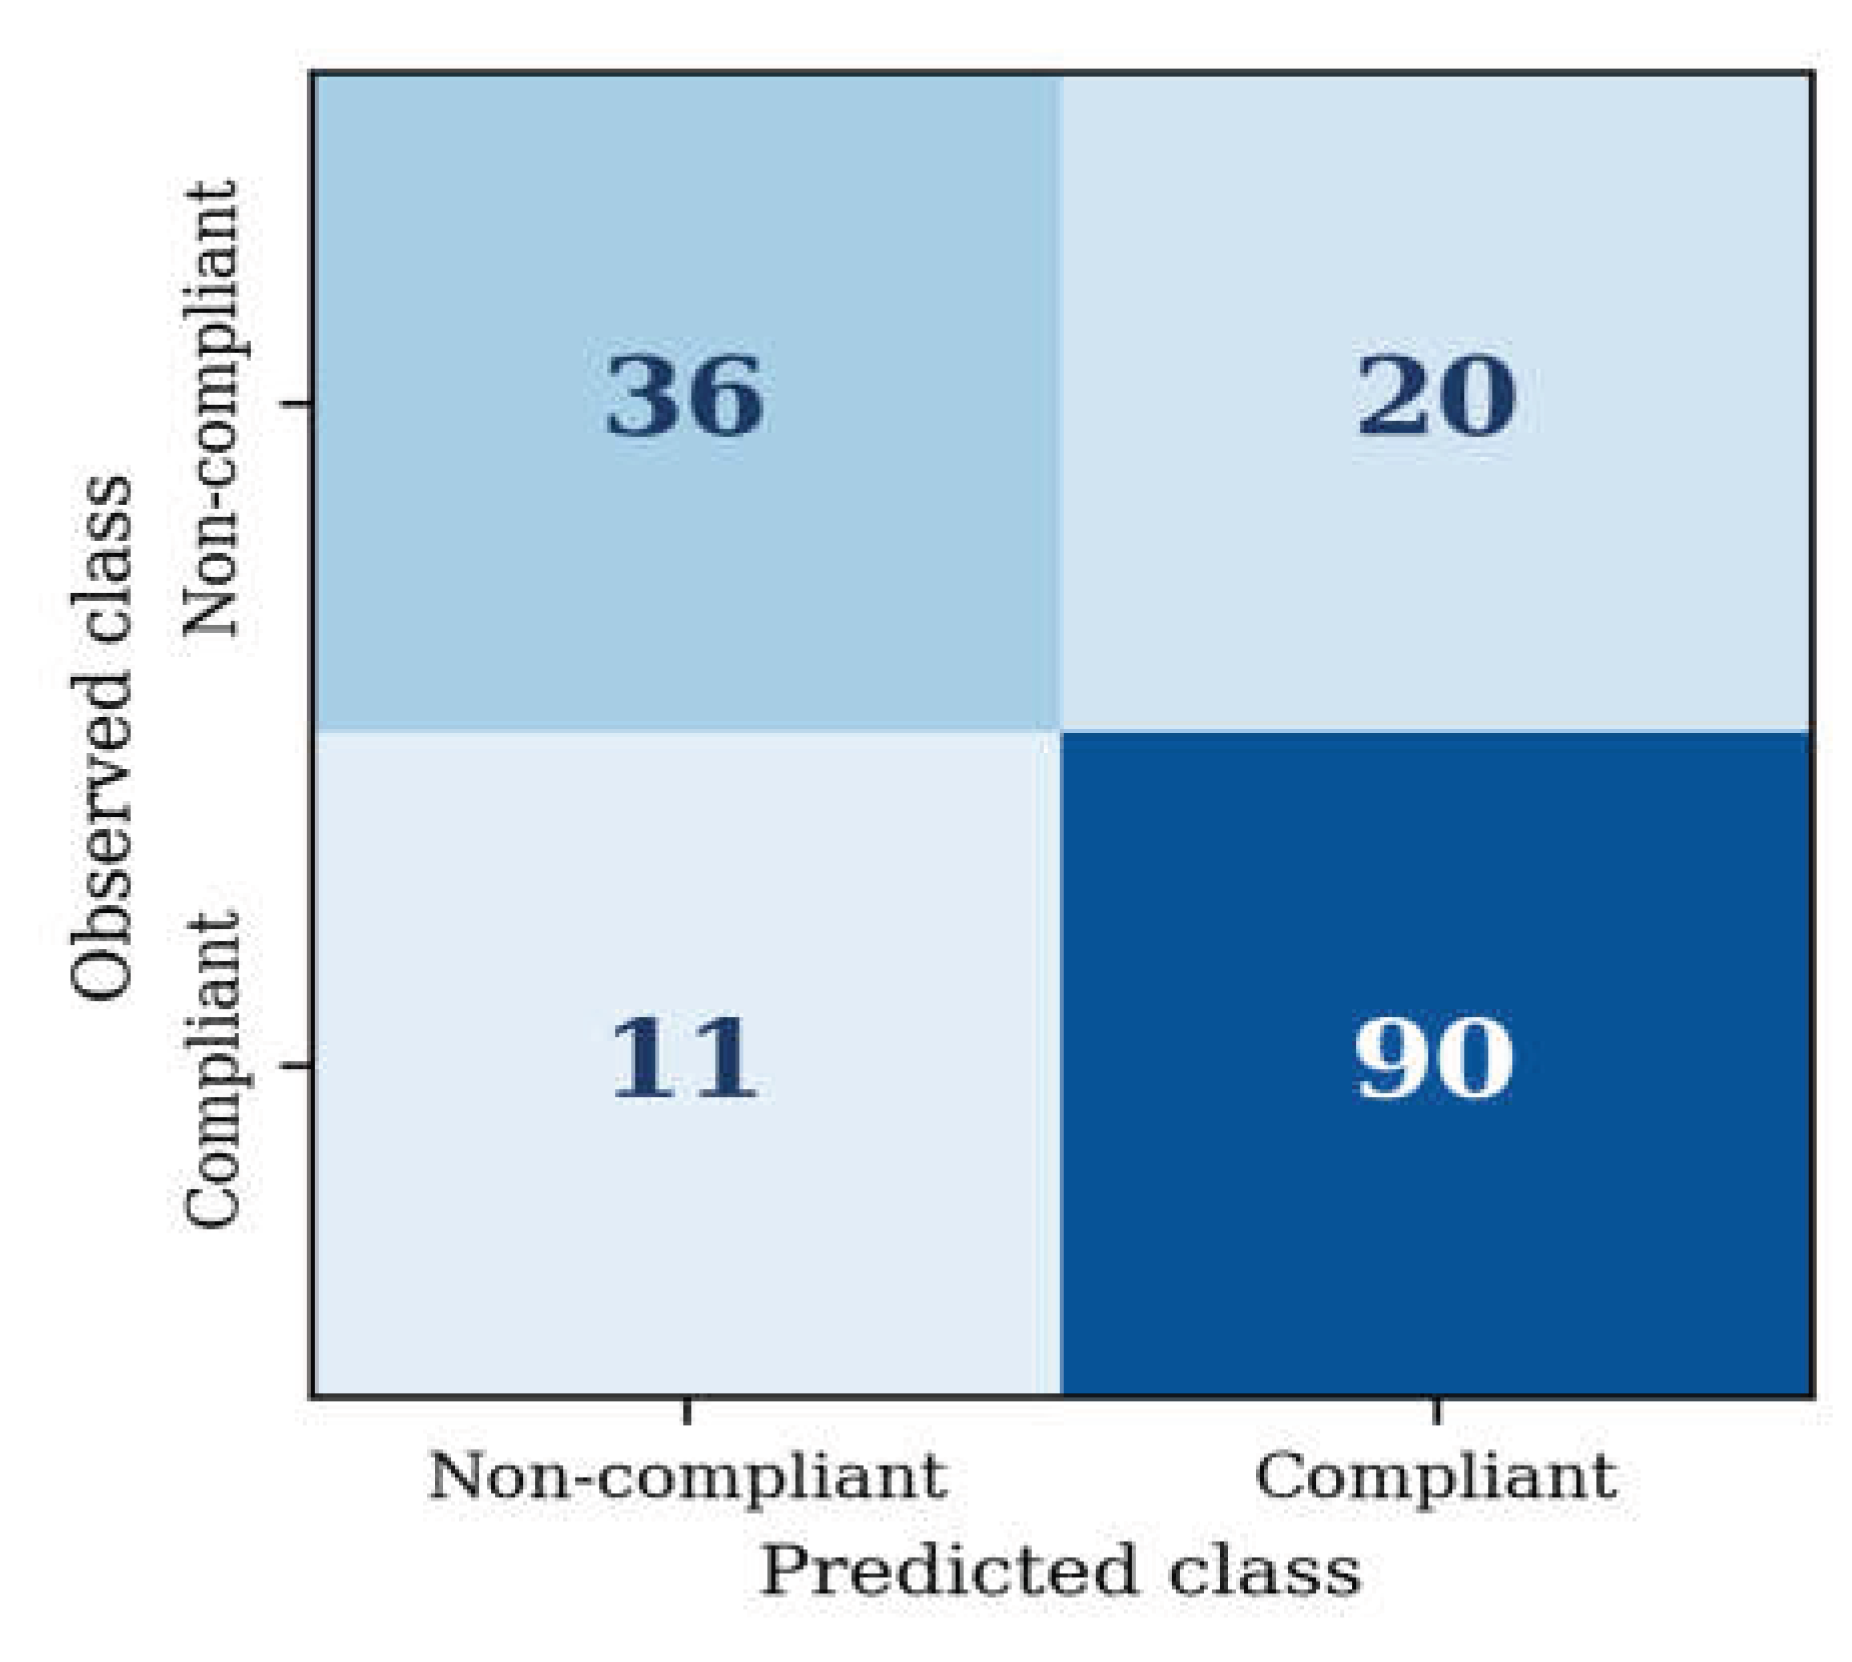

Table 1.
Comparison of the present study with ten recent investigations of psychosocial determinants of construction safety behavior.
Table 1.
Comparison of the present study with ten recent investigations of psychosocial determinants of construction safety behavior.
| Study | Context and sample | Psychosocial exposure | Psychological state | Risk perception | Safety outcome | Design & analysis | Out-of-sample prediction |
| Wang et al. [18] | China; 359 workers | Safety role ambiguity, role conflict, interpersonal conflict | Psychological capital (moderator) | No | Compliance and participation | Cross-sectional; hierarchical regression | Not performed |
| Jung et al. [21] | South Korea; 399 workers, 29 sites | Job demand, control, support, reward, justice | Depression (CES-D); trait anxiety (STAI) | No | Compliance and participation | Cross-sectional; SEM | Not performed |
| Zhao and Li [43] | China; 381 workers | Psychosocial safety climate; safety-related stress | Psychological resilience | No | Safety behavior | Cross-sectional; cross-level analysis | Not performed |
| Liang et al. [44] | China; over 500 workers | Job insecurity and organizational conditions | Stress; empathy | No | Safety participation | Cross-sectional; SEM and regression | Not performed |
| Cong et al. [45] | China; 293 workers | Challenge and hindrance job stressors | Not modeled | No | Informal safety communication | Cross-sectional; stepwise regression | Not performed |
| Ma et al. [46] | China; 218 young workers | Resilient safety culture; supervisor, coworker support | Job crafting | No | Safety performance | Cross-sectional; SEM and simulation | Not performed |
| Martin et al. [47] | United Kingdom; construction workers | Financial loss; quality of life | Anxiety; worry; dread | Yes | Risk perception and well-being | Cross-sectional; PLS-SEM | Not performed |
| Huang and Li [48] | China; 275 workers | Challenge and hindrance time pressure | Not modeled | No | Safety behavior | Two-wave; SEM | Not performed |
| Long et al. [49] | China; 208 workers | Family-work conflict; coworker safety support | Thriving at work; workplace anxiety | No | Safety behavior | Three-wave; mediation analysis | Not performed |
| Li et al. [50] | China; 513 workers | Foreman safety leadership | Attachment avoidance | No | Safety behavior | Cross-sectional; SEM | Not performed |
| Present study | Pakistan; 157 workers | Time pressure, workload, job control, communication, role and interpersonal conflict, production pressure, risk normalization, silence | Perceived strain-related safety impairment | Merged with strain after HTMT | Compliance | Cross-sectional; PLS-SEM with HTMT and indirect effects | Yes, against a linear benchmark |
Table 2.
Hypothesized associations, and their theoretical basis.
| Hypothesized association | Theoretical basis | |
| H1 | Psychosocial stressor exposure is positively associated with perceived strain-related safety impairment | Health impairment process of the Job Demands-Resources model |
| H2 | Psychosocial stressor exposure is negatively associated with safety compliance | Depletion of the regulatory capacity required for consistent rule following |
| H3 | Role and employment insecurity is positively associated with perceived strain-related safety impairment | Anticipated threat to continuity of employment as a chronic demand |
| H4 | Role and employment insecurity is negatively associated with safety compliance | Ambiguity regarding safety obligation impedes consistent adherence |
| H5 | Perceived strain-related safety impairment is negatively associated with safety compliance | Degraded appraisal and attention acting on in-role behavior |
| H6 | Perceived strain-related safety impairment mediates the association between psychosocial stressor exposure and safety compliance | Sequential impairment pathway from exposure to behavior |
Note: Directional language denotes hypothesized rather than demonstrated causal ordering, since the design is cross-sectional. Effects on compliance are expected to be modest, since prior evidence indicates that strain acts more strongly on discretionary safety behavior than on enforced in-role behavior.
Table 3.
Constructs, indicator composition, item counts, and measurement sources.
| Construct | Indicator composition | Items | Source |
| Psychosocial stressor exposure | Time pressure; quantitative workload; restricted job control; communication deficiency; role conflict; interpersonal conflict; production pressure; risk normalization; safety silence | 9 | [12,28,29,51] |
| Role and employment insecurity | Ambiguity regarding personal safety responsibility; fear of adverse employment consequence for refusing hazardous work | 2 | [30,60] |
| Perceived strain-related safety impairment | Distress attributed to work conditions; impairment of hazard detection, concentration, motivation, and protective equipment focus; underestimation of risk and propensity to expedient shortcuts under strain | 8 | [10,26] |
| Safety compliance | Adherence to prescribed protocol under strain; continued use of protective equipment under strain | 2 | [63] |
Note: Twenty-nine attitudinal items were administered on a five-point agreement scale; twenty-one are retained in the specification above. Eight were excluded, comprising items not assigned to any construct at the design stage and items whose empirical association placed them outside their intended construct. Item-level detail is reported inSection 4.
Table 4.
Evaluation criteria, decision rules, and supporting sources applied at each analytical stage.
Table 4.
Evaluation criteria, decision rules, and supporting sources applied at each analytical stage.
| Stage | Criterion | Decision rule | Source |
| Reflective measurement | Indicator loading | At or above 0.708; retention between 0.40 and 0.708 conditional on convergent validity and reliability | [38] |
| Internal consistency | Cronbach alpha and composite reliability between 0.70 and 0.95 | [65] | |
| Convergent validity | Average variance extracted at or above 0.50 | [38] | |
| Discriminant validity | Heterotrait-monotrait ratio below 0.85; remediation by reassignment, elimination, or merging where exceeded | [37] | |
| Structural model | Collinearity | Inner variance inflation factor below 3.3 | [67] |
| Path significance | Percentile bootstrap with five thousand subsamples, two-tailed, at the five percent level | [67] | |
| Effect size | Values of 0.02, 0.15, and 0.35 interpreted as small, medium, and large | [38] | |
| Mediation | Specific indirect effects with bootstrap confidence intervals; direct coefficients not used for inference | [36] | |
| Predictive assessment | Predictive relevance | Q2predict above zero against training-sample indicator means | [39] |
| Predictive power | Root-mean square error and mean absolute error below the linear model benchmark | [38] | |
| Model comparison | Cross-validated predictive ability test, average loss difference with confidence interval | [68] | |
| Screening classification | Balanced accuracy and area under the curve exceeding the majority-class baseline | [26] | |
| Method variance | Common method variance | Procedural separation of predictor and outcome items; collinearity examination across all constructs | [69] |
Table 5.
Demographic and occupational characteristics of the analytic sample (N = 157).
| Variable | Category | Frequency | Percentage |
| Age group | 20 to 30 years | 124 | 79.0 |
| 31 to 40 years | 27 | 17.2 | |
| Below 20 years | 6 | 3.8 | |
| Occupational role | Site worker (laborer, skilled tradesperson) | 104 | 66.2 |
| Other roles | 26 | 16.6 | |
| Site engineer | 23 | 14.6 | |
| Site supervisor | 4 | 2.5 | |
| Construction experience | 1 to 3 years | 72 | 45.9 |
| 4 to 6 years | 36 | 22.9 | |
| Less than 1 year | 34 | 21.7 | |
| More than 6 years | 15 | 9.6 | |
| Educational attainment | Primary or secondary schooling | 70 | 44.6 |
| Bachelor's degree | 40 | 25.5 | |
| Diploma or technical certification | 20 | 12.7 | |
| No formal education | 15 | 9.6 | |
| Other | 12 | 7.6 | |
| Project type | Commercial | 70 | 44.6 |
| Residential | 60 | 38.2 | |
| Industrial | 10 | 6.4 | |
| Infrastructure | 10 | 6.4 | |
| Other | 7 | 4.4 | |
| Employment status | Contract-based | 81 | 51.6 |
| Daily wage | 63 | 40.1 | |
| Permanent | 10 | 6.4 | |
| Other | 3 | 1.9 |
Note: Percentages are computed on the analytic sample of 157 retained responses and may not total 100 owing to rounding.
Table 6.
Indicator loadings, internal consistency, and convergent validity of the retained measurement model.
Table 6.
Indicator loadings, internal consistency, and convergent validity of the retained measurement model.
| Construct | Indicators | Loading range | Cronbach alpha | rho A | Composite reliability | AVE |
| Psychosocial stressor exposure | 9 | 0.684 to 0.808 | 0.904 | 0.907 | 0.922 | 0.567 |
| Role and employment insecurity | 2 | 0.924 to 0.926 | 0.831 | 0.831 | 0.922 | 0.855 |
| Perceived strain-related safety impairment | 8 | 0.699 to 0.847 | 0.897 | 0.902 | 0.917 | 0.582 |
| Safety compliance | 2 | 0.849 to 0.913 | 0.717 | 0.751 | 0.874 | 0.777 |
Note: All loadings are significant at p < 0.001. Criteria as declared inTable 4.
Table 7.
Heterotrait-monotrait ratios before and after construct remediation.
| Construct pair | Ratio | Outcome |
| Before remediation: seven-construct specification | ||
| Work intensity demands and organizational stressors | 0.947 | Exceeds criterion |
| Distress and stress-related risk-taking | 1.019 | Exceeds criterion |
| Distress and mental health beliefs | 0.919 | Exceeds criterion |
| Stress-related risk-taking and mental health beliefs | 0.925 | Exceeds criterion |
| All remaining pairs before remediation | below 0.85 | Within criterion |
| After remediation: four-construct specification | ||
| Psychosocial stressor exposure and Role and employment insecurity | 0.108 [-0.109, 0.327] | Within criterion |
| Psychosocial stressor exposure and Perceived strain-related safety impairment | 0.738 [0.623, 0.839] | Within criterion |
| Psychosocial stressor exposure and Safety compliance | -0.215 [-0.433, 0.023] | Within criterion |
| Role and employment insecurity and Perceived strain-related safety impairment | 0.035 [-0.177, 0.234] | Within criterion |
| Role and employment insecurity and Safety compliance | 0.735 [0.552, 0.908] | Within criterion |
| Perceived strain-related safety impairment and Safety compliance | -0.098 [-0.341, 0.144] | Within criterion |
Note: Values in brackets are 95 percent percentile bootstrap confidence intervals from 5,000 subsamples. Every interval in the remediated specification excludes unity.
Table 8.
Direct effects, effect sizes, and explanatory power of the structural model.
| Path | Coefficient | SE | t | p | 95% CI | f-squared | Outcome | |
| H1 | Exposure to Impairment | +0.676 | 0.049 | 13.899 | <0.001 | [+0.584, +0.772] | 0.829 | Supported |
| H2 | Exposure to Compliance | -0.301 | 0.099 | 3.056 | 0.002 | [-0.495, -0.111] | 0.080 | Supported |
| H3 | Insecurity to Impairment | -0.032 | 0.066 | 0.492 | 0.623 | [-0.166, +0.092] | 0.002 | Not supported |
| H4 | Insecurity to Compliance | +0.600 | 0.064 | 9.423 | <0.001 | [+0.473, +0.722] | 0.584 | Not supported |
| H5 | Impairment to Compliance | +0.109 | 0.119 | 0.911 | 0.362 | [-0.117, +0.346] | 0.011 | Not supported |
Note: Coefficients are standardized. Bootstrap with 5,000 subsamples, two-tailed. R-squared is 0.454 for perceived strain-related safety impairment and 0.389 for safety compliance, with adjusted values of 0.447 and 0.377. Inner variance inflation factors ranged from 1.009 to 1.845. H4 was significant but opposite in sign to the hypothesis.
Table 9.
Specific indirect effect of psychosocial stressor exposure on safety compliance.
| Pathway | Effect | SE | t | p | 95% CI | Outcome | |
| H6 | Exposure to impairment to compliance | +0.073 | 0.083 | 0.883 | 0.377 | [-0.079, +0.242] | Not supported |
Note: The confidence interval includes zero, so mediation is not established. The direct effect of exposure on compliance reported inTable 8 remains significant, indicating a direct rather than a mediated association.
Table 10.
Out-of-sample predictive performance of endogenous indicators against the naive and linear model benchmarks.
Table 10.
Out-of-sample predictive performance of endogenous indicators against the naive and linear model benchmarks.
| Indicator | Q-squared predict | RMSE | RMSE, linear model | Difference | MAE | MAE, linear model |
| MH1 | 0.297 | 0.893 | 0.909 | -0.016 | 0.693 | 0.694 |
| MH2 | 0.208 | 0.845 | 0.881 | -0.036 | 0.644 | 0.682 |
| MH3 | 0.307 | 0.832 | 0.838 | -0.006 | 0.644 | 0.647 |
| MH4 | 0.193 | 0.864 | 0.849 | +0.015 | 0.679 | 0.668 |
| MH5 | 0.178 | 0.936 | 0.965 | -0.029 | 0.768 | 0.776 |
| RP1 | 0.195 | 0.884 | 0.908 | -0.024 | 0.687 | 0.711 |
| RP2 | 0.326 | 0.802 | 0.834 | -0.032 | 0.647 | 0.668 |
| RP3 | 0.244 | 0.857 | 0.897 | -0.040 | 0.686 | 0.703 |
| SC1 | 0.200 | 0.972 | 1.039 | -0.067 | 0.751 | 0.794 |
| SC2 | 0.346 | 0.960 | 1.014 | -0.054 | 0.719 | 0.744 |
Note: Ten folds and ten repetitions. A negative difference indicates lower prediction error than the linear model benchmark. The cross-validated predictive ability test returned an average loss difference of -0.266 against the indicator-average benchmark (t = -30.36, p <0.001) and -0.054 against the linear model (t = -12.03, p <0.001).
Table 11.
Classification performance for safety compliance under stratified ten-fold partitioning.
| Classifier | Accuracy | Balanced accuracy | AUC | F1 | Precision | Recall | Log loss |
| Majority-class baseline | 0.643 | 0.500 | 0.500 | 0.783 | 0.643 | 1.000 | n/a |
| Logistic regression | 0.803 | 0.767 | 0.814 | 0.853 | 0.818 | 0.891 | 0.498 |
| Support vector classifier | 0.847 | 0.814 | 0.893 | 0.887 | 0.847 | 0.931 | 0.377 |
| Random forest | 0.854 | 0.838 | 0.891 | 0.887 | 0.882 | 0.891 | 0.408 |
Note: The outcome is the observed safety compliance composite dichotomized at 3.00, not a model-derived score. Baseline values are those obtained by assigning every case to the majority class. Predictors are the observed composites for psychosocial stress or exposure, role and employment insecurity, and perceived strain-related safety impairment.
Disclaimer/Publisher’s Note: The statements, opinions and data contained in all publications are solely those of the individual author(s) and contributor(s) and not of MDPI and/or the editor(s). MDPI and/or the editor(s) disclaim responsibility for any injury to people or property resulting from any ideas, methods, instructions or products referred to in the content. |
© 2026 by the authors. Licensee MDPI, Basel, Switzerland. This article is an open access article distributed under the terms and conditions of the Creative Commons Attribution (CC BY) license.
Copyright: This open access article is published under a Creative Commons CC BY 4.0 license, which permit the free download, distribution, and reuse, provided that the author and preprint are cited in any reuse.