Preprint
Article

This version is not peer-reviewed.

MTNR1B rs10830963 Genotype Amplifies Lipid Susceptibility to Poor Circadian Light Hygiene

A peer-reviewed version of this preprint was published in:
Biology 2026, 15(20), 1881. https://doi.org/10.3390/biology15201881

Submitted:

26 September 2026

Posted:

29 September 2026

You are already at the latest version

Abstract

Circadian light exposure influences cardiometabolic health, yet the extent to which genetic variation modifies this relationship remains unclear. We investigated whether MTNR1B rs10830963 genotype modulates blue-light exposure (BLE) patterns and blood lipid profiles in 63 Arctic residents (35 G-carriers) measured around the winter solstice and spring equinox. Participants were stratified by genotype (CC homozygotes vs. G-allele carriers) and contributed weeklong actigraphy data undergoing time-resolved analyses, mixed-effects and cosinor modeling. Genotype-dependent seasonal changes were observed in light-hygiene indices, including the normalized amplitude of BLE (NA BLE) and the nocturnal excess index of BLE (NEI). G-allele carriers also exhibited a less favorable lipid profile, with higher morning LDL-C, TG/HDL-C ratio, and Castelli risk index I, together with lower HDL-C in both seasons. A larger NA BLE was associated with lower TG, TG/HDL-C ratio, and Castelli index, and higher HDL-C, with stronger associations in G-allele carriers. Time-resolved analyses further showed that associations between morning fasting lipid values and 24-h BLE, assessed across 30-min exposure bins within each season, were rhythmically patterned and more pronounced in G-allele carriers, with later acrophases. These findings suggest that MTNR1B rs10830963 modifies the link between seasonal light exposure and lipid metabolism in Arctic residents.

Keywords: 
;  ;  ;  ;  ;  ;  ;  ;  

1. Introduction

Circadian biology is tightly regulated by environmental light, which acts as the primary synchronizer of internal rhythms to the external day–night cycle [1,2,3]. In high-latitude regions, extreme seasonal fluctuations in photoperiod and light intensity significantly disrupt circadian organization, sleep–wake architecture, and metabolic homeostasis [4,5,6,7,8,9,10,11,12,13]. Consequently, Arctic populations provide a unique natural experiment for examining how varying light exposure, ranging from the profound light deficiency of the winter solstice to the restorative, high-quality hygiene conditions of the spring equinox, modulates physiological regulation [6,8].
Blue-light exposure (BLE) is of particular physiological importance due to its potent activation of melanopsin-containing retinal ganglion cells, which directly entrain the suprachiasmatic nucleus [1,3,8,14,15,16,17]. Beyond its well-characterized roles in phase-shifting and sleep regulation, emerging evidence suggests that light exposure influences systemic cardiometabolic outcomes, including lipid metabolism [8,9,16,18,19,20,21,22,23]. However, the metabolic impact of light likely transcends simple parameters of intensity and timing; it is increasingly understood to be contingent upon individual genetic susceptibility [14,24,25,26,27,28]. However, the extent to which genetic variation modulates the interface between seasonal light environments and lipid homeostasis remains poorly understood. Circadian-related polymorphisms likely underpin inter-individual differences in these physiological responses [3,10,14,24,25,26,27,28]. Notably, MTNR1B rs10830963 is well established as a determinant of impaired glucose regulation and altered circadian rhythmicity, suggesting a broader role in mediating light-dependent metabolic pathways [14,25,29,30,31,32]. The MTNR1B rs10830963 G allele is common in European populations, with the proportion of G-allele carriers estimated to be close to 50% [32]. However, its influence on seasonal light–metabolic associations, particularly in the extreme photoperiodic environment of the Arctic has not been characterized.
In this study, we investigated whether the MTNR1B rs10830963 genotype is associated with distinct seasonal BLE patterns and subsequent fasting lipid profiles. By integrating actigraphy with time-resolved analyses across the 24-h cycle, we tested the hypothesis that the G-allele modifies the relationship between circadian light hygiene and lipid metabolism. We specifically posited that G-allele carriers would demonstrate both altered seasonal light-exposure profiles and a more pronounced sensitivity to light-mediated lipid regulation compared to CC homozygotes.

2. Materials and Methods

This study was approved by the Ethics Committee of Tyumen State Medical University (Protocol No. 101, 13 September 2021) and conducted in accordance with the Declaration of Helsinki. All participants provided written informed consent.

2.1. Study Design and Participants

The first phase of the “Light Arctic” study was conducted in Salekhard, Aksarka, and Urengoy, northwestern Siberia, around the winter solstice and spring equinox in 2022–2023. A total of 156 volunteers aged 12–59 years were enrolled. Inclusion criteria were residence at the study site and no recent transmeridian travel; exclusion criteria were severe or unstable medical conditions, pregnancy or breastfeeding, beta-blocker use, recent acute illness, and age <3 years. Of the enrolled volunteers, 63 participants met the data-quality criteria and were included in the study. The final sample comprised 40 non-Native and 23 Native participants; mean age was 36.24 ± 14.21 years, and 77.2% were women.

2.2. Actigraphy and Light Exposure

Participants wore an ActTrust 2 wrist actigraph (Condor Instruments, São Paulo, Brazil) on the non-dominant wrist for 7 consecutive days and completed sleep diaries. The device recorded motor activity (PIM), wrist temperature, ambient light intensity, and blue-light exposure (BLE, μW ⋅ cm−2) in 1-min epochs. Participants were instructed not to cover the device and to press the event marker at bedtime and awakening; diaries were used to verify timing and exclude artifacts. PIM was used because of its established agreement with polysomnography [33]. Circadian indices derived from the ActStudio software included the MESOR, 24-h amplitude and acrophase, IV, IS, RA, CFI, M10, M10 onset, L5, and L5 onset. Sleep variables included bedtime, wake time, time in bed, total sleep time, sleep efficiency, sleep latency, and WASO, determined by the ActStudio software, which applies standard algorithms [34]. For seasonal analyses, BLE was aggregated into consecutive 30-min epochs and averaged across the 7-day recording.

2.3. Blue-Light Exposure Metrics

In addition to standard indices, we calculated three blue-light metrics based on a guideline-relevant daytime/nighttime profile: daytime deficit index for blue light (DDI BLE), nocturnal excess index for blue light (NEI BLE), and normalized amplitude of blue-light exposure (NA BLE). DDI BLE was defined as the integrated deficit below the reference daytime curve between 06:00 and 20:00, and NEI BLE as the integrated excess above the reference curve between 20:00 and 05:00. Reference curves were based on published melanopic EDI recommendations [35] and previously described procedures [36,37,38,39]. NA BLE was calculated as the cosinor-derived 24-h amplitude/MESOR ratio [40].

2.4. Genotyping

Genomic DNA was extracted from venous blood using commercial kits according to the manufacturers’ instructions. MTNR1B rs10830963 was genotyped by allele-specific real-time PCR on Bio-Rad thermocyclers using fluorescence-based allelic discrimination. Genotype calls were manually reviewed when necessary. The distribution of genotypes was CC = 28 (44.4%), CG = 24 (38.2%), and GG = 11 (17.4%), consistent with Hardy–Weinberg equilibrium (χ2 = 2.002, p = 0.157).

2.5. Biochemical Assays

Fasting venous blood was collected between 08:00 and 09:00 after a 12-h fast. Plasma lipids, including total cholesterol (TC), high-density lipoprotein cholesterol (HDL-C), low-density lipoprotein cholesterol (LDL-C), and triglycerides (TG) were measured photometrically. The Castelli risk index I (CRI-I) was calculated as TC/HDL-C.

2.6. Statistical Analysis

Normality was assessed using the Shapiro–Wilk test. Between-group comparisons were performed using Student’s t-test or one-way ANOVA for normally distributed variables and the Mann–Whitney U-test or Kruskal–Wallis test for non-normally distributed variables. Categorical variables were compared using χ2 or Fisher’s exact test, as appropriate. Circadian parameters were estimated by cosinor analysis.
Time-resolved BLE–lipid associations were assessed by calculating Pearson correlation coefficients (r) between BLE in consecutive 30-min epochs and fasting morning lipid values. Epoch-wise correlations were calculated across 48 time bins per lipid outcome and evaluated using Benjamini–Hochberg false discovery rate (FDR) correction (FDR = 0.10). Cosinor models were fitted to the epoch-wise r profiles to examine rhythmicity of BLE–lipid coupling. Analyses were stratified by MTNR1B rs10830963 genotype. Multivariable models were adjusted for age, sex, population, and season. All tests were two-sided, and p < 0.05 was considered to indicate statistical significance.

3. Results

3.1. MTNR1B rs10830963 Polymorphism Determines Distinct 24-h Light-Exposure Patterns During the Winter Solstice and Spring Equinox in Arctic Residents

Baseline characteristics of the Arctic study participants are presented in Table 1. The CC and G-allele carriers genotype groups were well balanced with respect to age, BMI, sex distribution, and indigeneity, and no significant between-group differences were observed for any of these variables.
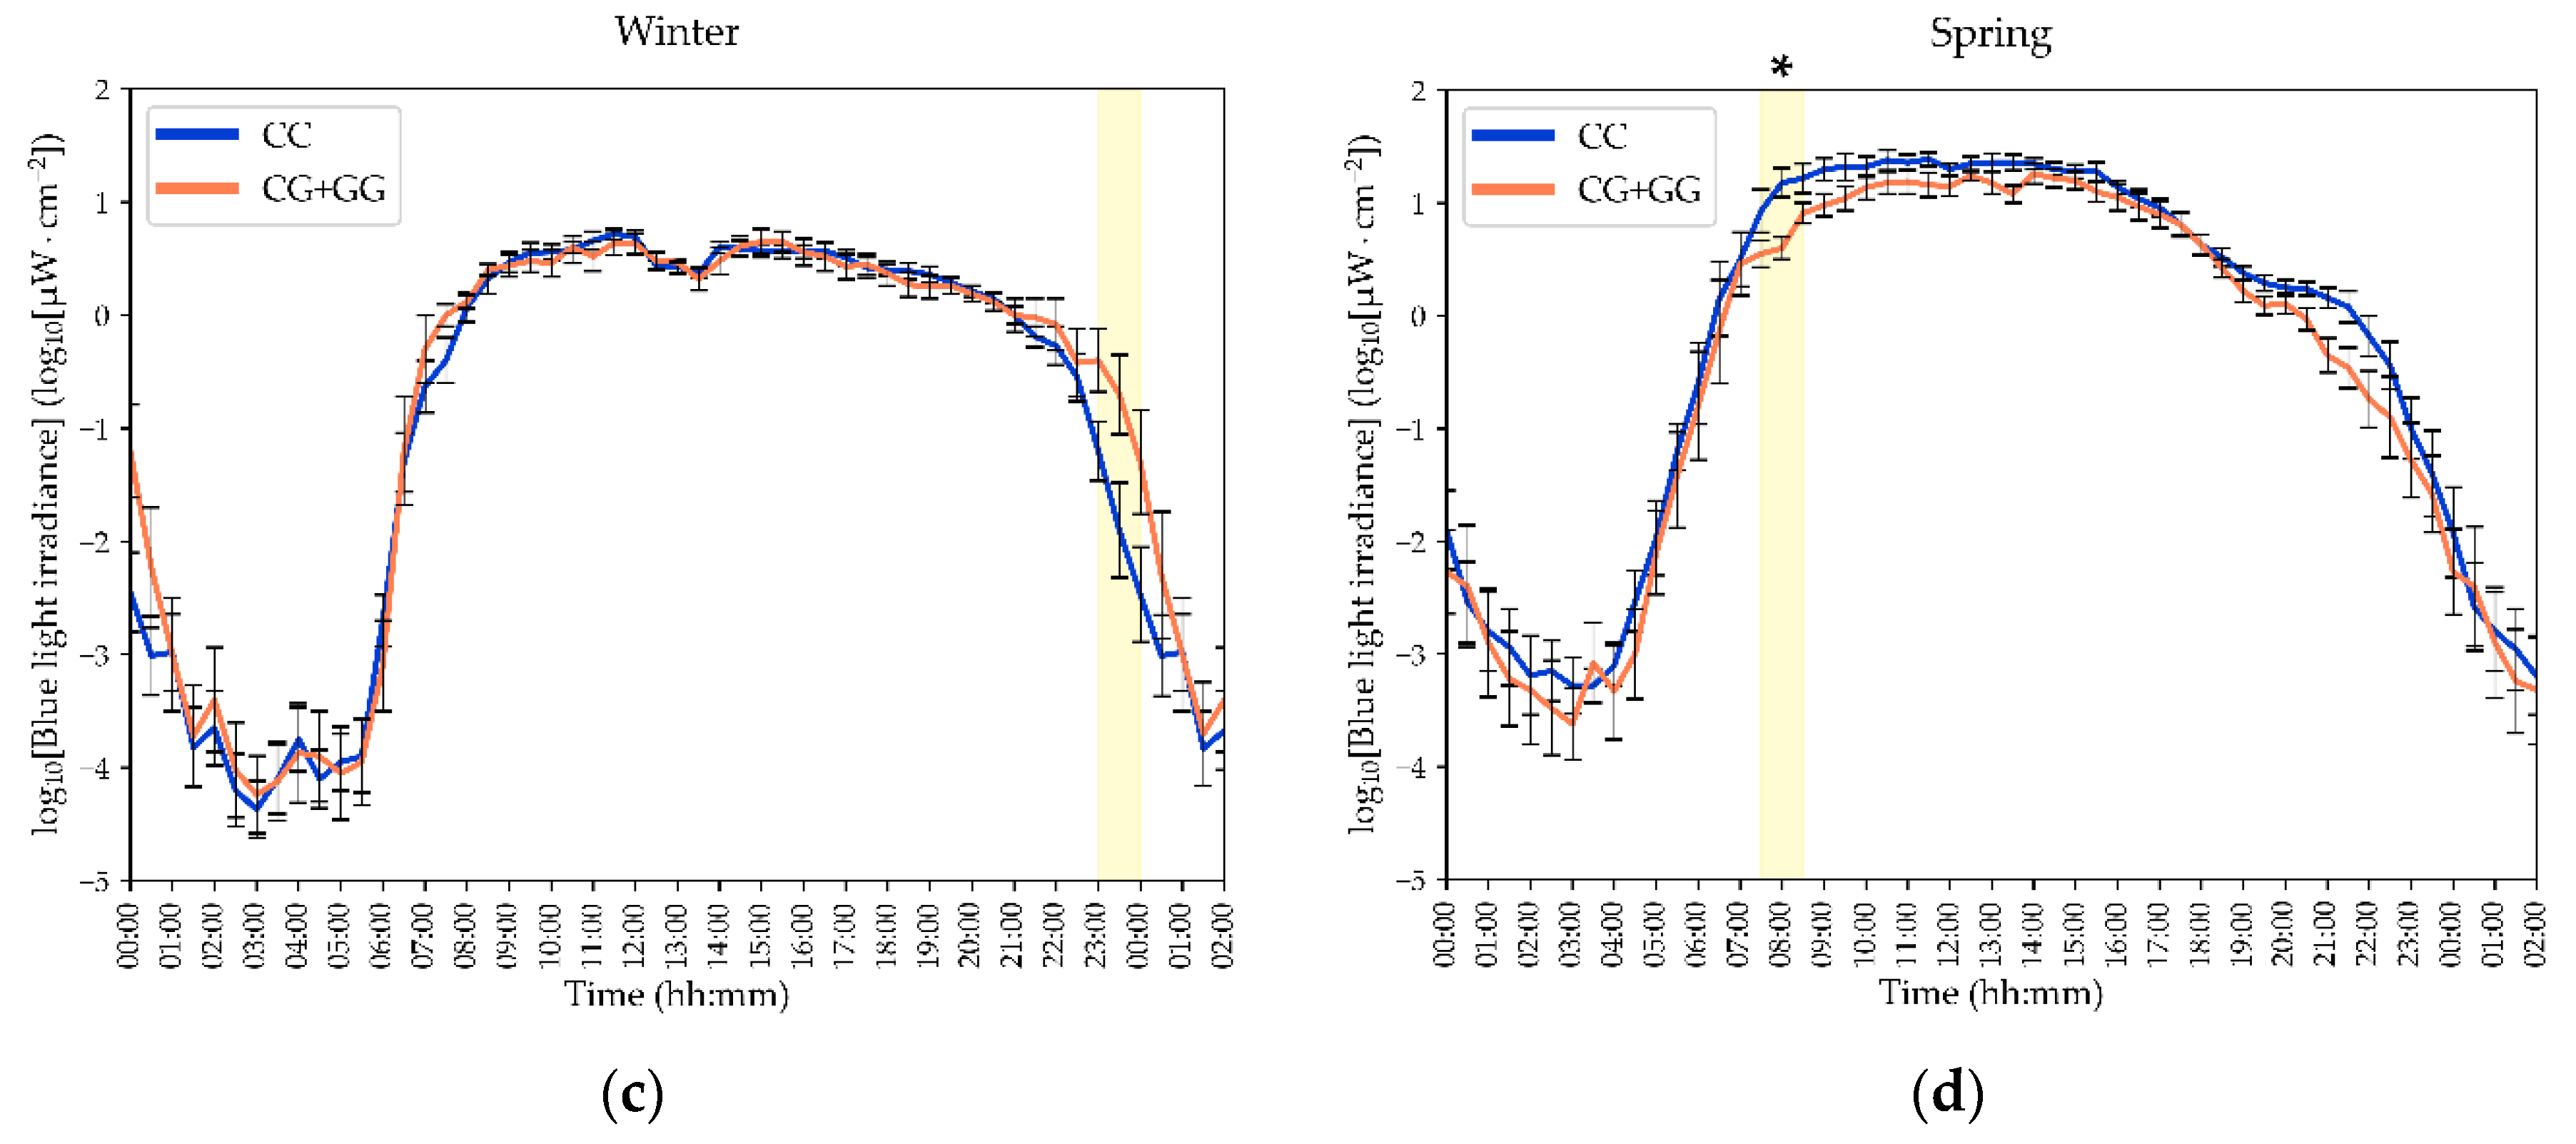
Distinct 24-h light-exposure patterns, as well as seasonal changes in these patterns, were dependent on the MTNR1B rs10830963 genotype. As shown in Figure 1, G-allele carriers exhibited higher evening BLE than CC homozygotes during the winter solstice, particularly between 23:00 and 24:00, whereas lower morning BLE in G-allele carriers was observed during the spring equinox between 07:30 and 08:30. These time-specific differences were identified using Mann–Whitney U-tests, and the intervals that remained significant after Benjamini–Hochberg correction are indicated in the figure.
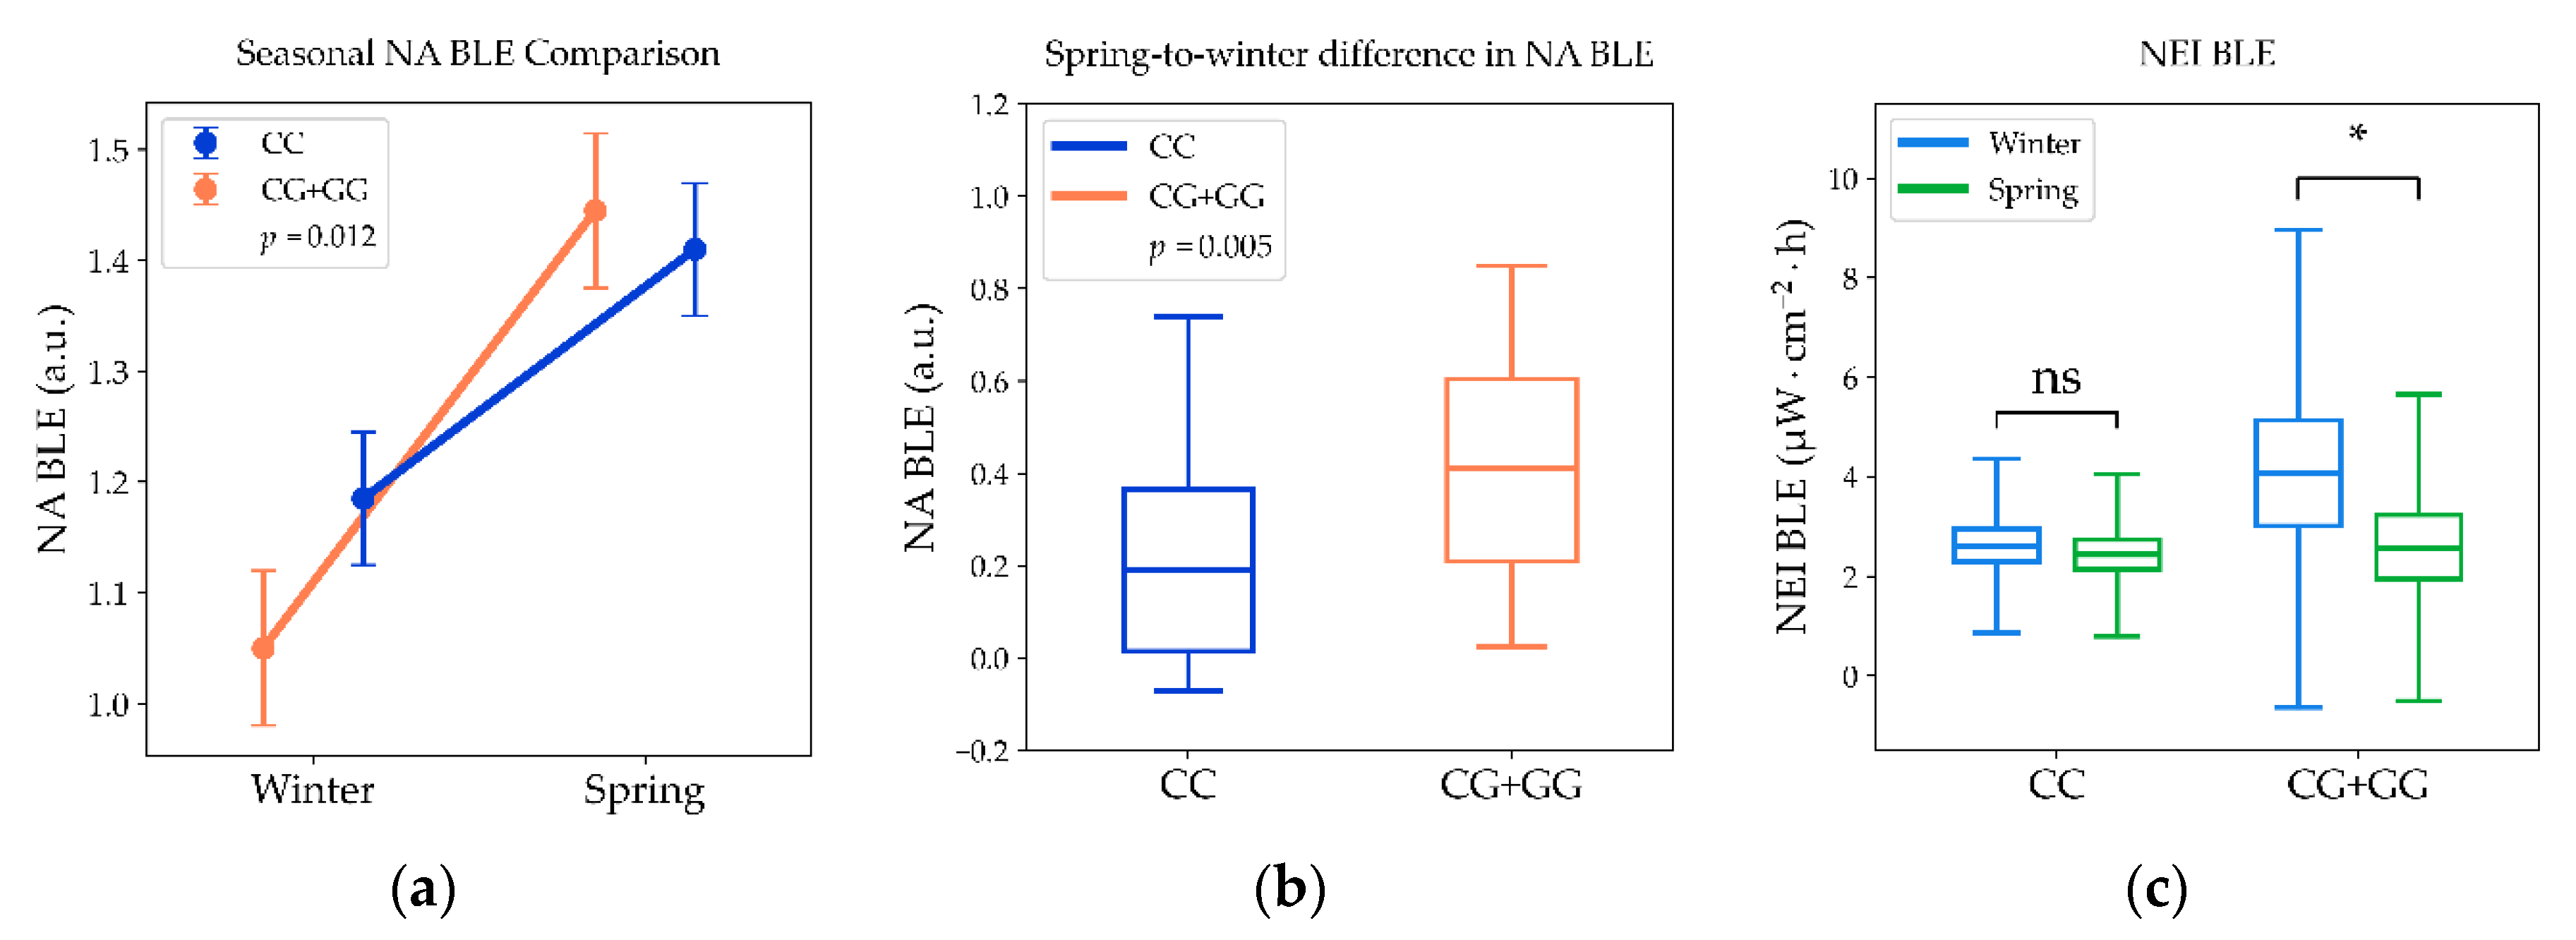
In line with these time-specific findings, most summary actigraphy and light-exposure indices did not differ significantly by genotype across seasons (Table 2). The only significant between-genotype difference was observed for the novel circadian light hygiene index NA BLE, which was lower in G-allele carriers than in CC homozygotes in winter (Figure 2a). The absence of a genotype difference in NA BLE during spring, despite a significant difference during winter, suggests that the MTNR1B-associated association was specific to the winter light environment. Overall, these findings indicate that MTNR1B rs10830963 primarily influenced the seasonal organization and dynamic range of BLE rather than broad daily summary measures.
These season-specific differences in 24-h light-exposure patterns were accompanied by MTNR1B rs10830963 genotype-dependent changes in the winter-to-spring gradients of the novel light hygiene indices NEI BLE and NA BLE (Figure 2). NA BLE increased from winter to spring in the entire cohort regardless of genotype (p < 0.0001; Figure 2a), but the magnitude of this increase was significantly greater in G-allele carriers than in CC homozygotes (+0.420; 95% CI 0.313–0.527 vs. +0.235; 95% CI 0.145–0.324; p = 0.035). Accordingly, the spring-to-winter change in NA BLE was also greater in G-allele carriers (p = 0.005; Figure 2b). NEI BLE showed a different pattern, decreasing significantly from winter to spring only in MTNR1B rs10830963 G-allele carriers (−1.46; 95% CI −3.01 to −0.09; z = 2.35; p = 0.019), whereas no significant seasonal change was observed in CC homozygotes (−0.22; 95% CI −0.78 to 0.35; z = 1.31; p = 0.191; Figure 2c). Together, these findings indicate that MTNR1B rs10830963 is associated with genotype-specific seasonal BLE profiles in Arctic residents, characterized by altered evening exposure in winter, reduced morning exposure in spring, and divergent winter-to-spring shifts in novel light hygiene indices among G-allele carriers.
The normalized amplitude of blue light exposure (NA BLE) was associated with multiple lipid outcomes in our longitudinal cohort of 63 Arctic residents measured during the winter solstice and spring equinox (Table 3). In the full sample, larger NA BLE predicted lower fasting triglycerides (TG) (β = −0.307, 95% CI −0.562 to −0.053, p = 0.018), higher HDL-C (β = 0.273, 95% CI 0.037 to 0.509, p = 0.023), lower TG/HDL ratio (β = −0.353, 95% CI −0.603 to −0.105, p = 0.006), and a lower CRI-I (β = −0.279, 95% CI −0.519 to −0.039, p = 0.023). Stratified analyses revealed that these associations were driven primarily by carriers of the MTNR1B rs10830963 G allele (CG+GG): effect sizes were larger and reached significance for TG (β = −0.507, 95% CI −0.942 to −0.071, p = 0.024), HDL-C (β = 0.448, 95% CI 0.039 to 0.857, p = 0.032), and TG/HDL-C (β = −0.594, 95% CI −1.022 to −0.166, p = 0.008). In contrast, corresponding estimates in CC homozygotes were attenuated and non significant (all p > 0.23), indicating a genotype specific relationship between NA BLE and lipid metabolism (Table 3). Reported partial η2 values indicate small-to-moderate effect sizes for significant associations (partial η2 range ≈ 0.046–0.157), and observed power ranged from modest to adequate for the primary findings.
Collectively, these results indicate that the normalized amplitude of blue light exposure is a predictor of TG, HDL-C, TG/HDL-C ratio, and CRI-I primarily in carriers of the MTNR1B rs10830963 G allele, independent of population, sex, age, and season (Table 3; Figure 2).

3.2. Circadian Light Hygiene Is Associated with Blood Lipid Profiles in an MTNR1B rs10830963 Genotype-Specific Manner

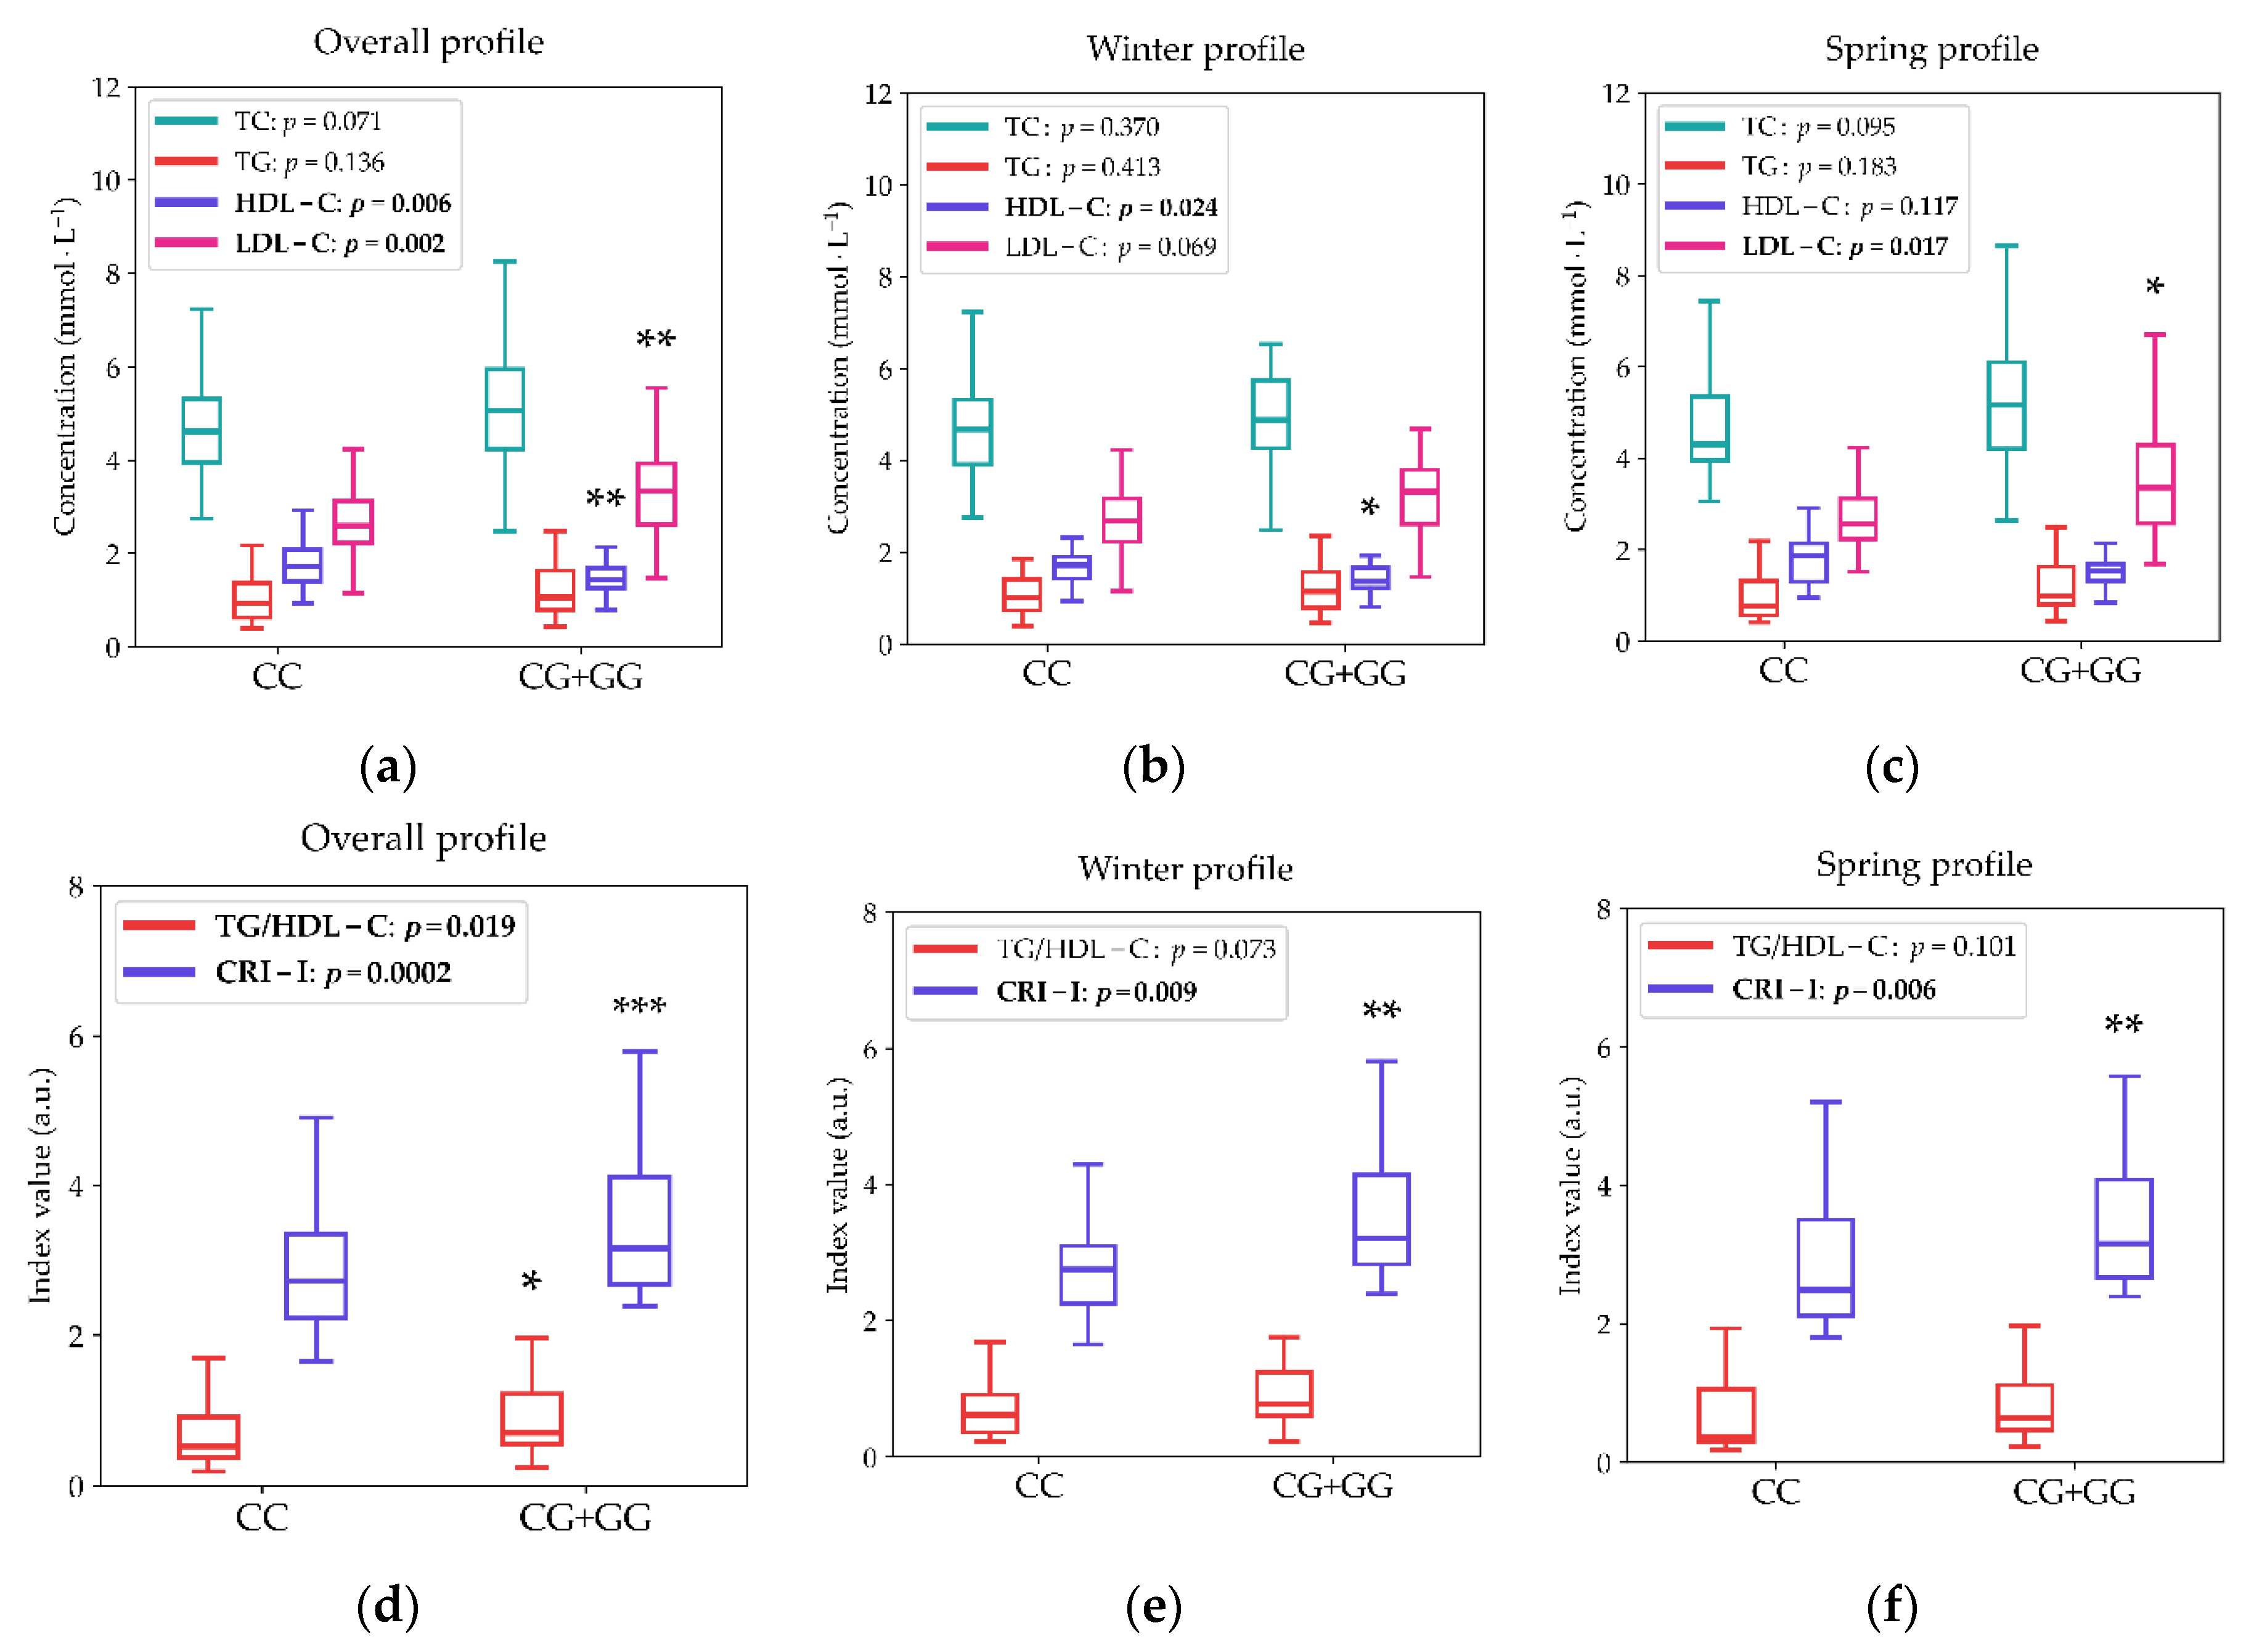
Blood lipid profiles were associated with circadian light hygiene both cross-sectionally within seasons and, more strongly, with the winter-to-spring dynamics of light exposure in an MTNR1B rs10830963 genotype-dependent manner. As shown in Figure 3, G-allele carriers exhibited an adverse lipid profile across the two-season longitudinal analysis, with significantly higher morning LDL-C, TG/HDL-C ratio, and CRI-I, together with lower HDL-C, compared with non-carriers. During the winter solstice, this pattern was driven primarily by reduced HDL-C and a borderline increase in LDL-C, resulting in a higher Castelli index in G-allele carriers. During the spring equinox, elevated LDL-C emerged as the main contributor to the higher CRI-I observed in G-allele carriers.
Consistent with these group differences, the normalized amplitude of blue-light exposure (NA BLE) was significantly associated with lipid outcomes in the full cohort, but the associations were stronger and more consistent in MTNR1B rs10830963 G-allele carriers (Table 3). A larger NA BLE was associated with lower TG, lower TG/HDL-C ratio, and lower CRI-I, as well as higher HDL-C. In stratified analyses, these associations remained significant in G-allele carriers for TG, HDL-C, TG/HDL-C, and CRI-I, whereas no significant associations were observed in CC homozygotes.
Taken together, these findings indicate that circadian light hygiene is linked to lipid metabolism in Arctic residents, and that this relationship is most evident in MTNR1B rs10830963 G-allele carriers. Moreover, the stronger associations observed for seasonal changes in light exposure support the notion that not only absolute light exposure but also its temporal organization across winter and spring may contribute to cardiometabolic risk modulation.

3.3. Time-Resolved Associations Between Blue-Light Exposure and Morning Fasting Lipid Indices Differ by MTNR1B rs10830963 Genotype

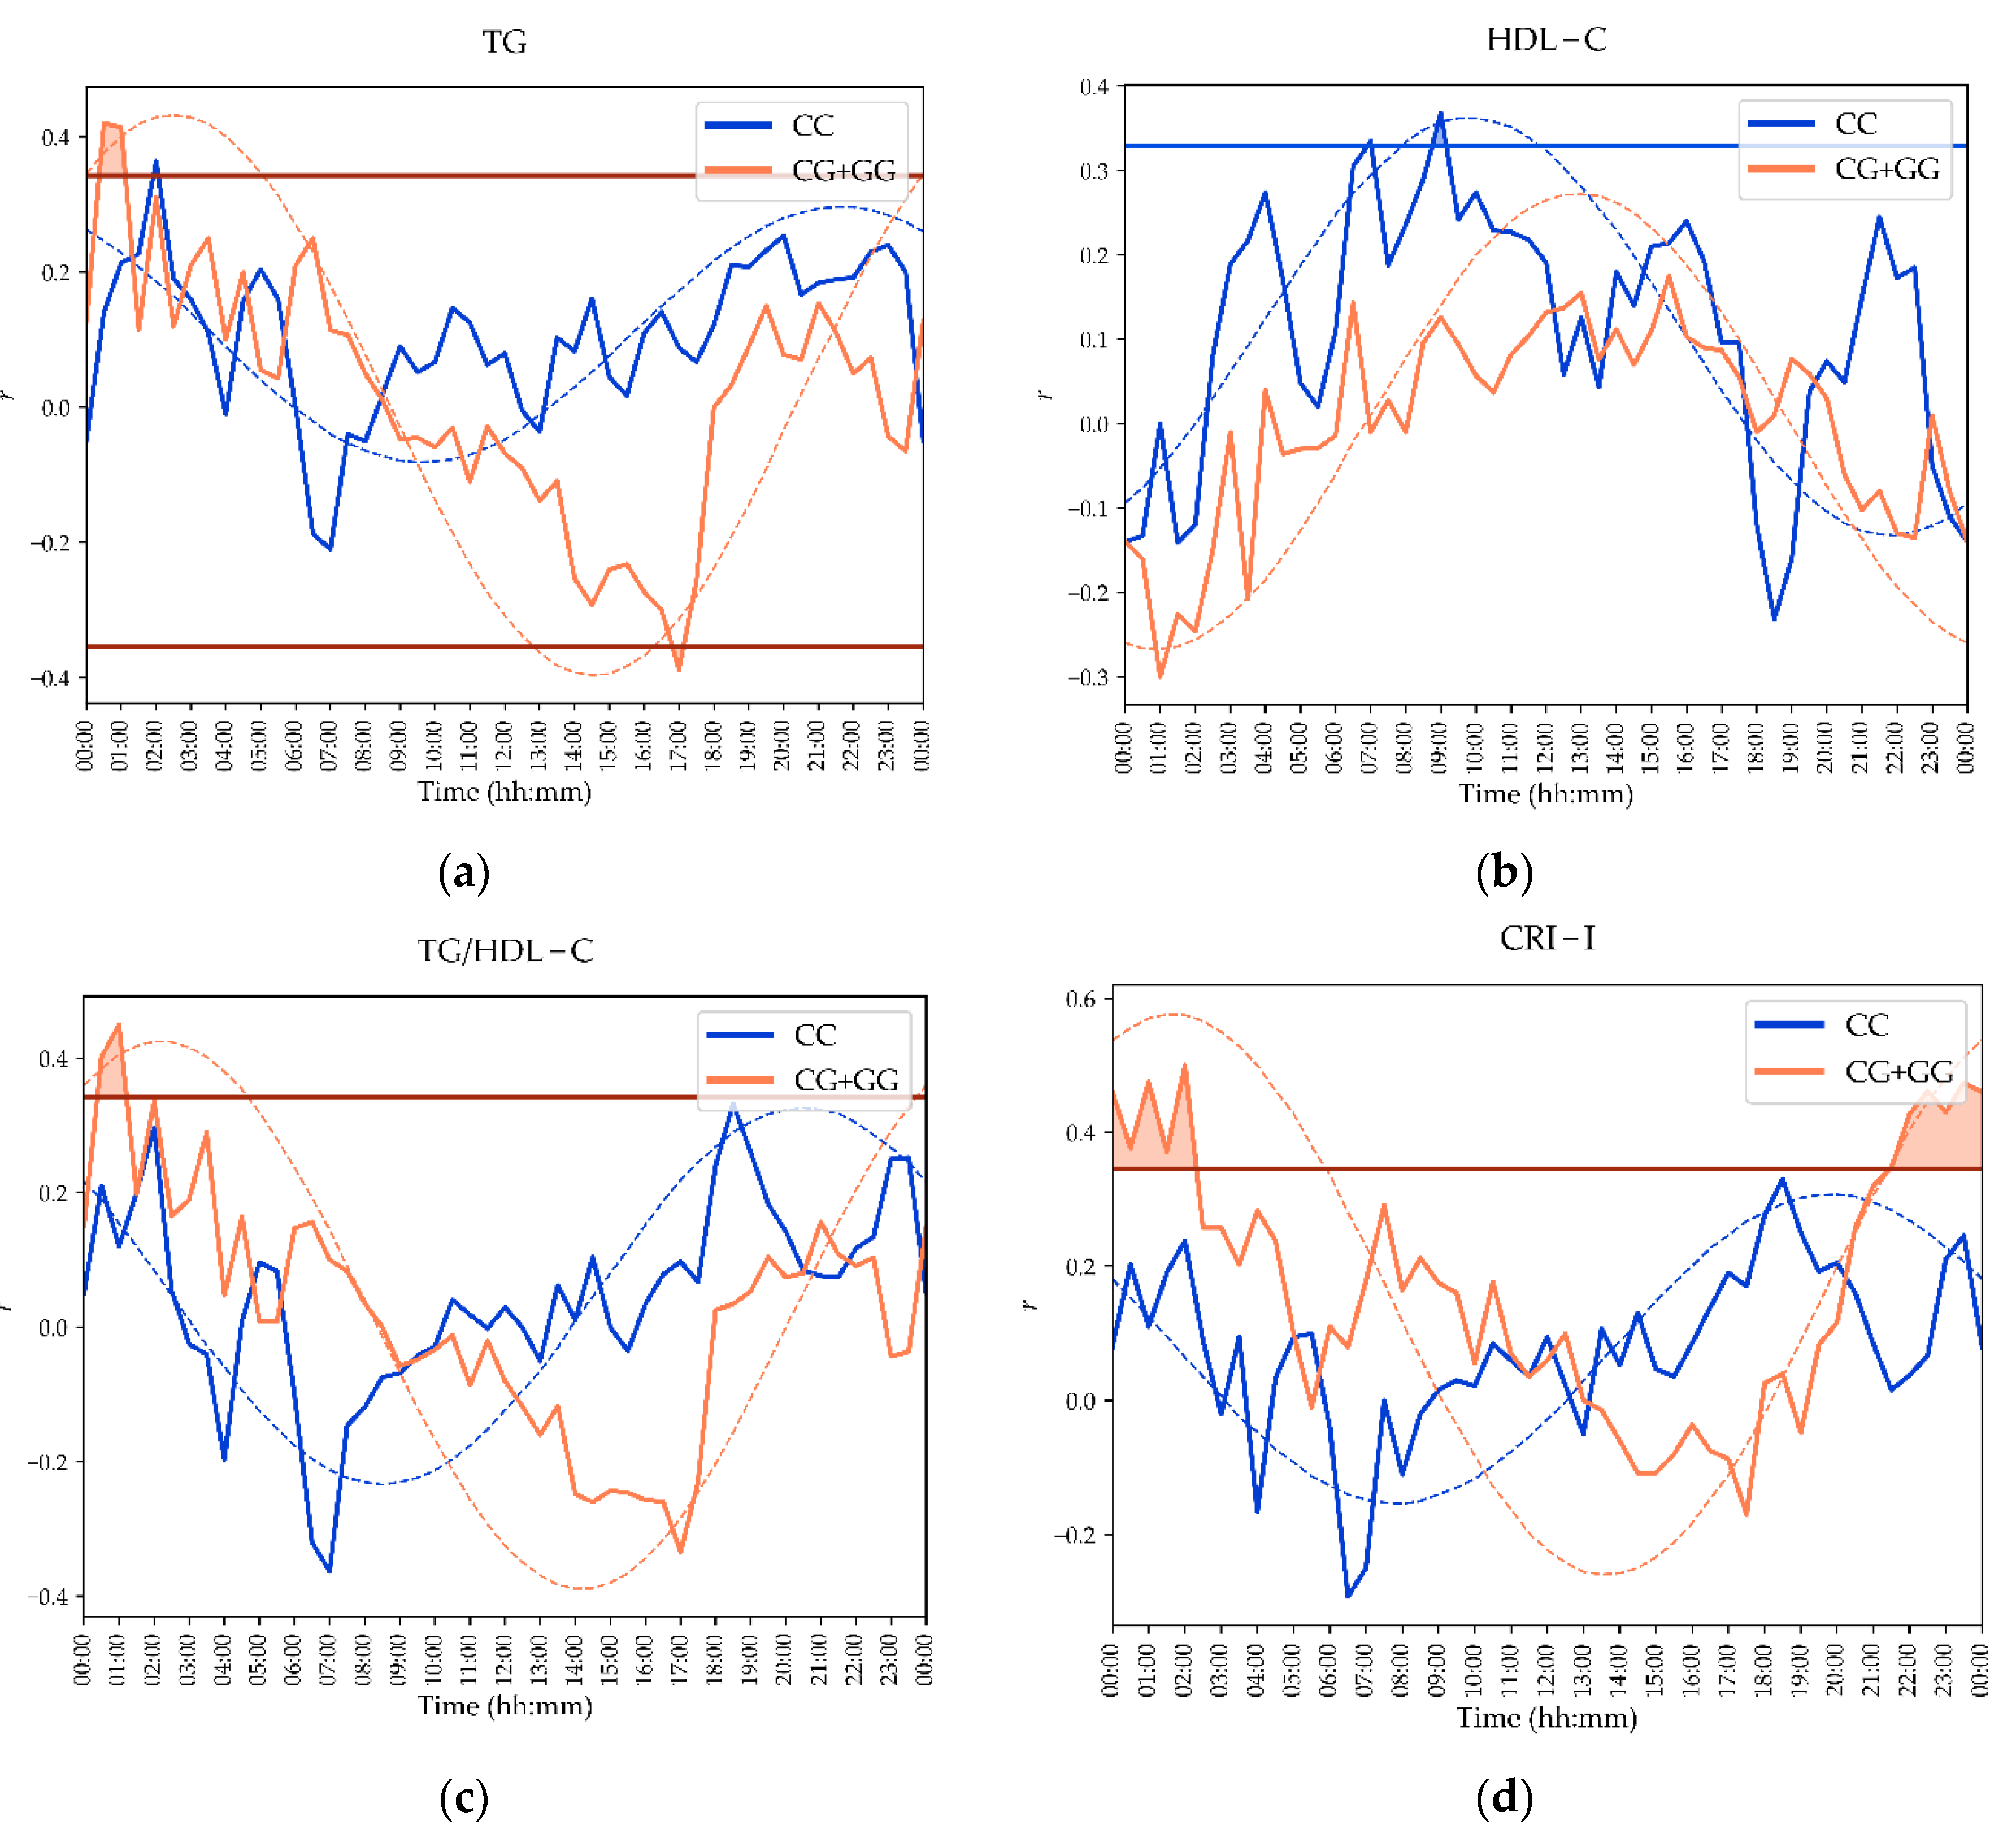
Time-resolved linear regression analyses showed that associations between BLE and morning fasting lipid indices varied across the 24-h cycle and differed by MTNR1B rs10830963 genotype (Figure 4). In G-allele carriers, more BLE during evening epochs was associated with higher TG, TG/HDL-C ratio, and CRI-I after Benjamini–Hochberg correction, with the strongest associations concentrated in specific late-day windows. A brief inverse association between BLE and TG was also observed at 17:00–17:30. In contrast, CC homozygotes showed a more limited pattern of significant associations, with the most consistent corrected relationship observed for HDL-C during selected time epochs.
Cosinor modeling confirmed that the time-resolved BLE–lipid associations followed significant 24-h rhythmic profiles in both genotype groups, rejecting the zero-amplitude assumption (Table 4). However, the rhythmic association patterns were stronger and more temporally delayed in G-allele carriers than in CC homozygotes, consistent with the genotype-dependent differences observed in the seasonal light-exposure analyses and in the NA BLE–lipid associations. Together, these findings indicate that the predictive value of BLE for morning lipid status depends not only on genotype, but also on the timing of exposure across the daily light cycle.

4. Discussion

This study shows that MTNR1B rs10830963 genotype is associated with distinct seasonal BLE patterns and genotype-specific relationships between circadian light hygiene and lipid metabolism in Arctic residents. The principal findings are threefold. First, G-allele carriers exhibited distinct 24-h BLE profiles across seasons, characterized by higher evening exposure in winter and lower morning exposure in spring. Second, novel light hygiene indices, particularly NA BLE and NEI, showed genotype-dependent winter-to-spring shifts. Third, the association between BLE and fasting lipid profiles was strongest in G-allele carriers, with larger NA BLE predicting a more favorable lipid profile and time-resolved cosinor analyses indicating stronger and more delayed BLE–lipid rhythms in G-carriers.
The observed seasonal variations in BLE underscore the challenges posed by the extreme Arctic photoperiod. The transition from the light-deficient winter solstice to the rapidly increasing photoperiod of spring likely impacts circadian entrainment, melatonin dynamics, and metabolic regulation [8,10,14,15,16,17,18,19]. The distinct light-exposure profiles in G-allele carriers suggest that this genotype may influence light-seeking behavior or sensitivity to seasonal environmental constraints. Notably, because broad actigraphy metrics remained stable across genotypes, our data indicate that the MTNR1B association is specific to the temporal structure of light exposure, the “circadian hygiene” rather than global sleep or activity levels. Given that G-allele carriers are known to exhibit delayed melatonin offset [31], our findings suggest that this genetic predisposition may be compounded by altered photic input or impaired light perception [41].
A critical finding of this study was the genotype-specific modulation of novel light hygiene indices, NA-BLE and NEI. These metrics proved more sensitive than standard daily measures of light exposure, activity, and sleep in capturing the adaptive transition from winter to spring. While NA-BLE increased in both genotype groups, this amplitude change was significantly greater in G-allele carriers. Conversely, NEI decreased solely in G-allele carriers, suggesting a more profound restructuring of their nocturnal light exposure patterns. Collectively, these results implicate MTNR1B in the regulation of adaptive responses to seasonal environmental light.
This interpretation is strongly supported by the time-resolved analyses, which revealed specific daily windows of BLE association with lipid outcomes, particularly in G-allele carriers. The observed lipid profiles are biologically plausible within the framework of circadian metabolic control. Lipid synthesis, transport, and clearance are demonstrably influenced by disruptions in light timing [8,9,42,43,44,45,46,47]. Our cohort data showed that larger NA-BLE was associated with a more favorable lipid profile (lower triglycerides, TG/HDL-C ratio, and CRI-I; higher HDL-C), with these beneficial associations being significantly amplified in G-allele carriers. This genotype-specific enhancement suggests that individuals carrying the MTNR1B G-allele possess a heightened sensitivity to the metabolic regulatory associations of light timing and its dynamic range.
Time-resolved correlations and cosinor modeling further elucidated the complexity of these interactions. BLE–lipid associations were not uniform throughout the 24-h cycle but instead clustered in specific temporal windows; moreover, cosinor analyses revealed significantly later acrophases and more robust rhythmicity in G-allele carriers. This result suggests that the predictive power of BLE for metabolic status depends not merely on exposure magnitude, but on its precise timing relative to the individual’s internal circadian phase. Such temporal specificity is paramount in Arctic environments, where conventional day–night cues are attenuated or highly unstable. The consistent phase-delay observed in BLE–lipid rhythms among G-allele carriers suggests a potential mechanistic role for melatonin signaling in mediating these metabolic outcomes. Furthermore, we identified specific evening windows where excessive BLE was coupled with adverse lipid profiles exclusively in G-allele carriers, while beneficial daylight associations with HDL-C were restricted to the CC genotype. These findings underscore the potential for personalized light-hygiene interventions to mitigate metabolic risk.
Several limitations warrant consideration. First, the modest sample size may limit statistical power for extensive subgroup analyses. Second, as this was a longitudinal observational study, causal pathways cannot be definitively established. Finally, while naturalistic light assessment enhances ecological validity, it inevitably introduces behavioral variability. Nevertheless, the study’s strengths, including repeated seasonal measurements, genotype stratification, and the application of both summary and high-resolution time-resolved metrics, provide a robust foundation for future investigation into precision circadian medicine.

5. Conclusions

This study demonstrates that the MTNR1B rs10830963 polymorphism is a significant determinant of seasonal light-exposure patterns and their subsequent associations with lipid homeostasis in an extreme Arctic environment. Our findings reveal that the metabolic consequences of BLE are not uniform across the population but are instead contingent upon a complex interplay between temporal light hygiene and genetic background. Specifically, the identified genotype-dependent sensitivity to nocturnal light excess and diurnal light-seeking underscores the role of MTNR1B as a critical mediator of circadian metabolic regulation.
These results shift the current paradigm by suggesting that cardiometabolic vulnerability in high-latitude regions may be rooted in an individual’s genetic capacity to entrain to seasonal photoperiodic fluctuations. While further research in larger, multi-ethnic cohorts is required to confirm the generalizability of these associations, our data provide a robust rationale for the development of personalized circadian hygiene protocols. Integrating genetic markers into metabolic health monitoring may offer a novel strategy for mitigating cardiovascular risk, moving the field toward a more precise, ecologically-informed approach to public health.

Supplementary Materials

The article contains no supplementary materials.

Author Contributions

Conceptualization, D.G., K.D. and M.B.; methodology, D.G., K.D., O.S., S.K., M.B., and G.C.; software, D.G.; validation, D.G., A.M., A.S., K.V., G.C., S.K., J.P., and O.M.; formal analysis, D.G., A.S., K.V., G.C., S.K., and O.M.; investigation, D.G., A.S., K.V., G.C., S.K., J.P., and O.M.; resources, D.G., A.M., K.V., G.C., S.K., J.P., and O.M.; data curation, D.G., A.M., A.S., K.V., G.C., S.K., J.P., and O.M.; writing—original draft preparation, D.G., O.S., S.K., M.B., G.C. and I.P.; writing—review and editing, D.G., L.A. and G.C.; visualization, D.G. and L.A.; supervision, D.G., K.D., O.S., A.M. and I.P.; project administration, D.G., A.M., and I.P.; funding acquisition, D.G. and I.P. All authors have read and agreed to the published version of the manuscript.

Funding

The study was supported by West-Siberian Science and Education Center, Government of Tyumen District, Decree of 20.11.2020, No. 928-rp. The study was supported in part by the Ministry of Science and Higher Education (government topic FMEN 2022-0009). The funding organizations had no role in the design or conduct of this research. The authors have no proprietary or commercial interest in any materials discussed in this article. We are grateful to all participants of this study and medical personal at Aksarka Boarding School, Salekhard, and Urengoy.

Institutional Review Board Statement

This cross-sectional study adhered to the tenets of the Declaration of Helsinki and was approved by the Ethics Committee of Tyumen State Medical University (Protocol No. 101, September 13, 2021). Written informed consent was obtained from all participants.

Data Availability Statement

The data presented in this study are available on reasonable request from the corresponding author. The data are not publicly available due to privacy.

Acknowledgments

We are grateful to all participants of this study and medical personal at Aksarka Boarding School, Salekhard, and Urengoy.

Conflicts of Interest

The authors declare no conflicts of interest.

Abbreviations

The following abbreviations and terms are used in this manuscript:
List of abbreviations
BLE Blue Light Exposure (irradiance in the short-wavelength range, measured by the Blue channel of the Condor AcTrust2 device)
NA BLE Normalized Amplitude of Blue Light Exposure (ratio of the 24 h amplitude of the fitted cosine curve for BLE data to its MESOR, used to standardize the dynamic range of blue light exposure relative to its average value)
DDI BLE Daytime Deficit Index for Blue Light Exposure
NEI BLE Nocturnal Excess Index for Blue Light Exposure
BMI Body Mass Index
CC CC-allele of MTNR1B rs10830963
CG+GG G-allele carriers of MTNR1B rs10830963
CRI-I Castelli Risk Index I (the ratio of total cholesterol, TG, to high-density lipoprotein cholesterol, HDL-C)
FDR False Discovery Rate (a statistical method used to correct for multiple comparisons, with a critical value of 0.1 in the study)
HDL-C High-Density Lipoprotein Cholesterol
LDL-C Low-Density Lipoprotein Cholesterol
MTNR1B Melatonin Receptor 1B gene
TG Triglycerides
L5 Least Active/Exposed 5 h Period (the 5 h of lowest values for physical activity or light exposure)
LE Light Exposure (general light exposure, measured via actigraphy in lux)
M10 Most Active/Exposed 10 h Period (the 10 h of highest values for physical activity or light exposure)
MESOR Midline-Estimating Statistic Of Rhythm (a rhythm-adjusted mean)
PIM Proportional Integrative Mode (a method for estimating motor activity in actigraphy)
WASO Wake After Sleep Onset (time spent awake after initially falling asleep)
List of terms
Acrophase Timing of the peak in a circadian rhythm
Amplitude Magnitude of variation in a circadian rhythm, peak-to-trough difference (e.g., daily light fluctuation)
Chronotype Individual’s natural preference for morning or evening activity
Actigraphy Non-invasive wrist-worn device monitoring movement, sleep, and light exposure for objective data

References

  1. Blume, C.; Garbazza, C.; Spitschan, M. Effects of Light on Human Circadian Rhythms, Sleep and Mood. Somnology 2019, 23, 147–156. [Google Scholar] [CrossRef] [PubMed]
  2. Stewart, D.; Albrecht, U. Beyond Vision: Effects of Light on the Circadian Clock and Mood-Related Behaviours. npj Biol. Timing Sleep 2025, 2. [Google Scholar] [CrossRef] [PubMed]
  3. Gubin, D.; Stefani, O.; Cornelissen, G. Light Hygiene for Circadian Health: A Molecular Perspective. Front. Biosci. (Landmark Ed.) 2025, 30, 39097–39097. [Google Scholar] [CrossRef] [PubMed]
  4. Arendt, J. Biological Rhythms During Residence in Polar Regions. Chronobiol. Int. 2012, 29, 379–394. [Google Scholar] [CrossRef] [PubMed]
  5. Paul, M.A.; Love, R.J.; Hawton, A.; Arendt, J. Sleep and the endogenous melatonin rhythm of high arctic residents during the summer and winter. Physiol. Behav. 2015, 141, 199–206. [Google Scholar] [CrossRef] [PubMed]
  6. Gubin, D.; Cornelissen, G.; Weinert, D.; Vetoshkin, A.; Gapon, L.; Poshinov, F.; Belozerova, N.; Danilova, L. Circadian disruption and vascular variability disorders (VVD)—Mechanisms linking aging, disease state and Arctic shift-work: Applications for chronotherapy. World Heart J. 2013, 5, 285–306. [Google Scholar]
  7. Gubin, D.; Vetoshkin, A.; Shurkevich, N.; Gapon, L.; Borisenkov, M.; Cornelissen, G.; Weinert, D. Chronotype and lipid metabolism in Arctic sojourn workers. Chronobiol. Int. 2023, 40, 1198–1208. [Google Scholar] [CrossRef] [PubMed]
  8. Gubin, D.; Danilenko, K.; Stefani, O.; Kolomeichuk, S.; Markov, A.; Petrov, I.; Voronin, K.; Mezhakova, M.; Borisenkov, M.; Shigabaeva, A.; Yuzhakova, N.; Lobkina, S.; Petrova, J.; Malyugina, O.; Weinert, D.; Cornelissen, G. Light environment of Arctic solstices is coupled with melatonin phase-amplitude changes and decline of metabolic health. J. Pineal Res. 2025, 77, e70023. [Google Scholar] [CrossRef] [PubMed]
  9. Gubin, D.; Kolomeichuk, S.; Danilenko, K.; Markov, A.; Petrov, I.; Voronin, K.; Mezhakova, M.; Borisenkov, M.; Shigabaeva, A.; Malyugina, O.; Boldyreva, J.; Petrova, J.; Weinert, D.; Cornelissen, G. Circadian activity and sleep associated with blood lipids in Arctic residents. J. Sleep Res. 2026, 35, e70225. [Google Scholar] [CrossRef] [PubMed]
  10. Gubin, D.; Kolomeichuk, S.; Danilenko, K.; Stefani, O.; Markov, A.; Petrov, I.; Voronin, K.; Mezhakova, M.; Borisenkov, M.; Shigabaeva, A.; Boldyreva, J.; Petrova, J.; Alkhimova, L.; Weinert, D.; Cornelissen, G. Circadian amplitude and CLOCK 3111 polymorphism predict morning leptin in Arctic residents, independent of photoperiod. Chronobiol. Int. 2026, 1–14. [Google Scholar] [CrossRef] [PubMed]
  11. Moraes, M.M.; Marques, A.L.; Borges, L.; Hatanaka, E.; Heller, D.; Núñez-Espinosa, C.; Gonçalves, D.A.P.; Soares, D.D.; Wanner, S.P.; Mendes, T.T.; Arantes, R.M.E. Sleep impairment and altered pattern of circadian biomarkers during a long-term Antarctic summer camp. Sci. Rep. 2023, 13, 15959. [Google Scholar] [CrossRef] [PubMed]
  12. Schöllhorn, I.; Stefani, O.; Blume, C.; Cajochen, C. Seasonal variation in the responsiveness of the melanopsin system to evening light: Why we should report season when collecting data in human sleep and circadian studies. Clocks Sleep 2023, 5, 651–666. [Google Scholar] [CrossRef] [PubMed]
  13. Wallace, D.A.; Evenson, K.R.; Isasi, C.R.; Patel, S.R.; Sotres-Alvarez, D.; Zee, P.C.; Redline, S.; Scheer, F.A.J.L.; Sofer, T. Characteristics of objectively-measured naturalistic light exposure patterns in U.S. adults: A cross-sectional analysis of two cohorts. Sci. Total Environ. 2025, 969, 178839. [Google Scholar] [CrossRef] [PubMed]
  14. Gubin, D.; Danilenko, K.; Stefani, O.; Kolomeichuk, S.; Markov, A.; Petrov, I.; Voronin, K.; Mezhakova, M.; Borisenkov, M.; Shigabaeva, A.; Yuzhakova, N.; Lobkina, S.; Weinert, D.; Cornelissen, G. Blue light and temperature actigraphy measures predicting metabolic health are linked to melatonin receptor polymorphism. Biology 2023, 13, 22. [Google Scholar] [CrossRef] [PubMed]
  15. Silvani, M.I.; Werder, R.; Perret, C. The influence of blue light on sleep, performance and wellbeing in young adults: A systematic review. Front. Physiol. 2022, 13, 943108. [Google Scholar] [CrossRef] [PubMed]
  16. Spitschan, M.; Kervezee, L.; Stefani, O.; Gordijn, M.; Veitch, J.A.; Lok, R.; Light for Public Health Consortium. Evidence-based public health messaging on the non-visual effects of ocular light exposure: A modified Delphi expert consensus. BMJ Public Health 2025, 3, e003205. [Google Scholar] [CrossRef] [PubMed]
  17. Tosini, G.; Ferguson, I.; Tsubota, K. Effects of blue light on the circadian system and eye physiology. Mol. Vis. 2016, 22, 61–72. [Google Scholar] [PubMed]
  18. Gubin, D.; Neroev, V.; Malishevskaya, T.; Kolomeichuk, S.; Weinert, D.; Yuzhakova, N.; Nelaeva, A.; Filippova, Y.; Cornelissen, G. Daytime lipid metabolism modulated by CLOCK gene is linked to retinal ganglion cells damage in glaucoma. Appl. Sci. 2022, 12, 6374. [Google Scholar] [CrossRef]
  19. Gubin, D.; Kolomeichuk, S.; Danilenko, K.; Stefani, O.; Markov, A.; Petrov, I.; Voronin, K.; Mezhakova, M.; Borisenkov, M.; Shigabaeva, A.; Boldyreva, J.; Petrova, J.; Alkhimova, L.; Weinert, D.; Cornelissen, G. Timing and amplitude of light exposure, not photoperiod, predict blood lipids in Arctic residents: A circadian light hypothesis. Biology 2025, 14, 799. [Google Scholar] [CrossRef] [PubMed]
  20. Hiramoto, K.; Oikawa, H. Effects of long-term blue light exposure on body fat synthesis and body weight gain in mice and the inhibitory effect of tranexamic acid. Int. J. Mol. Sci. 2025, 26, 5554. [Google Scholar] [CrossRef] [PubMed]
  21. Huang, W.C.; Lee, P.N.; Yeh, W.J.; Wu, W.C.; Shih, H.Y.; Chen, Y.J.; Yang, H.Y. Effects of blue light exposure on hepatic inflammation and gut microbiota in mice consuming a high-fat, high-fructose diet. Nutrients 2026, 18, 164. [Google Scholar] [CrossRef] [PubMed]
  22. Kent, B.A.; Rahman, S.A.; St Hilaire, M.A.; Grant, L.K.; Rüger, M.; Czeisler, C.A.; Lockley, S.W. Publisher correction: Circadian lipid and hepatic protein rhythms shift with a phase response curve different than melatonin. Nat. Commun. 2022, 13, 2241. [Google Scholar] [CrossRef] [PubMed]
  23. Wu, Q.; Liu, H.; Liang, H.; Jiang, X.; Qin, Y.; Liang, S.; Wang, J.; Liu, K. Opn3 drives blue-light-induced reduction in lipid droplets and antiviral defense. Biomolecules 2026, 16, 109. [Google Scholar] [CrossRef] [PubMed]
  24. Chellappa, S.L. Individual differences in light sensitivity affect sleep and circadian rhythms. Sleep 2021, 44, zsaa214. [Google Scholar] [CrossRef] [PubMed]
  25. Gubin, D.; Kolomeichuk, S.; Danilenko, K.; Stefani, O.; Markov, A.; Petrov, I.; Voronin, K.; Mezhakova, M.; Borisenkov, M.; Shigabaeva, A.; Boldyreva, J.; Petrova, J.; Alkhimova, L.; Weinert, D.; Cornelissen, G. Population-specific circadian drivers and MTNR1B predict Arctic morning cortisol. Am. J. Hum. Biol. 2026, 38, e70261. [Google Scholar] [CrossRef] [PubMed]
  26. Phillips, A.J.K.; Vidafar, P.; Burns, A.C.; McGlashan, E.M.; Anderson, C.; Rajaratnam, S.M.W.; Lockley, S.W.; Cain, S.W. High sensitivity and interindividual variability in the response of the human circadian system to evening light. Proc. Natl. Acad. Sci. USA 2019, 116, 12019–12024. [Google Scholar] [CrossRef]
  27. Stone, J.E.; McGlashan, E.M.; Quin, N.; Skinner, K.; Stephenson, J.J.; Cain, S.W.; Phillips, A.J.K. The role of light sensitivity and intrinsic circadian period in predicting individual circadian timing. J. Biol. Rhythm. 2020, 35, 628–640. [Google Scholar] [CrossRef] [PubMed]
  28. Swope, C.B.; Rong, S.; Campanella, C.; Vaicekonyte, R.; Phillips, A.J.; Cain, S.W.; McGlashan, E.M. Factors associated with variability in the melatonin suppression response to light: A narrative review. Chronobiol. Int. 2023, 40, 542–556. [Google Scholar] [CrossRef] [PubMed]
  29. de Luis, D.A.; Izaola, O.; Primo, D.; Aller, R. A circadian rhythm-related MTNR1B genetic variant (rs10830963) modulates body weight change and insulin resistance after 9 months of a high-protein/low-carbohydrate vs. a standard hypocaloric diet. J. Diabetes Complicat. 2020, 34, 107534. [Google Scholar] [CrossRef] [PubMed]
  30. Gubin, D.G.; Kolomeychuk, S.N.; Petrov, I.M.; Markov, A.A.; Petrova, Yu.A.; Voronin, K.A.; Mezhakova, M.S.; Boldyreva, Y.V.; Shigabaeva, A.U. CLOCK rs1801260 and MTNR1B rs10830963 polymorphisms modulate the association between cholesterol levels and circadian rhythms in Arctic residents. Bull. Exp. Biol. Med. 2026, 180, 743–747. [Google Scholar] [CrossRef] [PubMed]
  31. Lane, J. M.; Chang, A.-M.; Bjonnes, A. C.; Aeschbach, D.; Anderson, C.; Cade, B. E.; Cain, S. W.; Czeisler, C. A.; Gharib, S. A.; Gooley, J. J.; Gottlieb, D. J.; Grant, S. F. A.; Klerman, E. B.; Lauderdale, D. S.; Lockley, S. W.; Munch, M.; Patel, S.; Punjabi, N. M.; Rajaratnam, S. M. W.; Rueger, M.; St. Hilaire, M. A.; Santhi, N.; Scheuermaier, K.; Van Reen, E.; Zee, P. C.; Shea, S. A.; Duffy, J. F.; Buxton, O. M.; Redline, S.; Scheer, F. A. J. L.; Saxena, R. Impact of common diabetes risk variant in MTNR1B on sleep, circadian, and melatonin physiology. Diabetes 2016, 65, 1741–1751. [Google Scholar] [CrossRef] [PubMed]
  32. Zhu, H.; Zhao, Z.J.; Liu, H.Y.; Cai, J.; Lu, Q.K.; Ji, L.D.; Xu, J. The melatonin receptor 1B gene links circadian rhythms and type 2 diabetes mellitus: An evolutionary story. Ann. Med. 2023, 55, 1262–1286. [Google Scholar] [CrossRef] [PubMed]
  33. Blackwell, T.; Redline, S.; Ancoli-Israel, S.; Schneider, J.L.; Surovec, S.; Johnson, N.L.; Cauley, J.A.; Stone, K.L. Comparison of sleep parameters from actigraphy and polysomnography in older women: The SOF study. Sleep 2008, 31, 283–291. [Google Scholar] [CrossRef] [PubMed]
  34. Cole, R.J.; Kripke, D.F.; Gruen, W.; Mullaney, D.J.; Gillin, J.C. Automatic sleep/wake identification from wrist activity. Sleep 1992, 15, 461–469. [Google Scholar] [CrossRef] [PubMed]
  35. Brown, T. M.; Brainard, G. C.; Cajochen, C.; Czeisler, C. A.; Hanifin, J. P.; Lockley, S. W.; Lucas, R. J.; Münch, M.; O’Hagan, J. B.; Peirson, S. N.; Price, L. L. A.; Roenneberg, T.; Schlangen, L. J. M.; Skene, D. J.; Spitschan, M.; Vetter, C.; Zee, P. C.; Wright, K. P. Recommendations for daytime, evening, and nighttime indoor light exposure to best support physiology, sleep, and wakefulness in healthy adults. PLoS Biol. 2022, 20, e3001571. [Google Scholar] [CrossRef] [PubMed]
  36. Gubin, D.G.; Borisenkov, M.F.; Kolomeichuk, S.N.; Markov, A.A.; Weinert, D.; Cornelissen, G.; Stefani, O. Evaluating circadian light hygiene: Methodology and health implications. Russ. Open Med. J. 2024, 13, e0415. [Google Scholar] [CrossRef]
  37. Gubin, D.; Weinert, D.; Stefani, O.; Otsuka, K.; Borisenkov, M.; Cornelissen, G. Wearables in chronomedicine and interpretation of circadian health. Diagnostics 2025, 15, 327. [Google Scholar] [CrossRef] [PubMed]
  38. Gubin, D.G.; Boldyreva, J.V.; Danilova, L.A.; Kolomeichuk, S.A.; Alkhimova, L.E.; Markov, A.A.; Malyugina, O.A.; Kuznetsova, N.V.; Stefani, O.; Weinert, D.; Cornelissen, G. Normalized amplitude of blue light exposure (NA BLE) as a novel index for circadian light hygiene: Associations with actigraphy measures and seasonal dependencies. Russ. Open Med. J. 2025, 14, e0401. [Google Scholar] [CrossRef]
  39. Gubin, D.; Kolomeichuk, S.; Boldyreva, J.; Borisenkov, M.; Danilova, L.; Alkhimova, L.; Cornelissen, G.; Weinert, D. CLOCK genotype modulates associations between blue light exposure and circadian activity amplitude. Physiol. Behav. 2026, 314, 115375. [Google Scholar] [CrossRef] [PubMed]
  40. Cornelissen, G. Cosinor-based rhythmometry. Theor. Biol. Med. Model. 2014, 11, 16. [Google Scholar] [CrossRef] [PubMed]
  41. Gubin, D.; Neroev, V.; Malishevskaya, T.; Cornelissen, G.; Astakhov, S.Y.; Kolomeichuk, S.; Yuzhakova, N.; Kabitskaya, Y.; Weinert, D. Melatonin mitigates disrupted circadian rhythms, lowers intraocular pressure, and improves retinal ganglion cell function in glaucoma. J. Pineal Res. 2021, 70, e12730. [Google Scholar] [CrossRef] [PubMed]
  42. Chua, E.C.; Shui, G.; Lee, I.T.; Lau, P.; Tan, L.C.; Yeo, S.C.; Lam, B.D.; Bulchand, S.; Summers, S.A.; Puvanendran, K.; Rozen, S.G.; Wenk, M.R.; Gooley, J.J. Extensive diversity in circadian regulation of plasma lipids and evidence for different circadian metabolic phenotypes in humans. Proc. Natl. Acad. Sci. USA 2013, 110, 14468–14473. [Google Scholar] [CrossRef] [PubMed]
  43. Gooley, J.J. Circadian regulation of lipid metabolism. Proc. Nutr. Soc. 2016, 75, 440–450. [Google Scholar] [CrossRef] [PubMed]
  44. Ishihara, A.; Courville, A.B.; Chen, K.Y. The complex effects of light on metabolism in humans. Nutrients 2023, 15, 1391. [Google Scholar] [CrossRef] [PubMed]
  45. Pan, X.; Mota, S.; Zhang, B. Circadian clock regulation on lipid metabolism and metabolic diseases. Adv. Exp. Med. Biol. 2020, 1276, 53–66. [Google Scholar] [CrossRef] [PubMed]
  46. Poggiogalle, E.; Jamshed, H.; Peterson, C.M. Circadian regulation of glucose, lipid, and energy metabolism in humans. Metabolism 2018, 84, 11–27. [Google Scholar] [CrossRef] [PubMed]
  47. Wegener, C.; Amatobi, K.M.; Ozbek-Unal, A.G.; Fekete, A. Circadian control of lipid metabolism. In Advances in Experimental Medicine and Biology; Springer: Cham, 2024. [Google Scholar] [CrossRef] [PubMed]
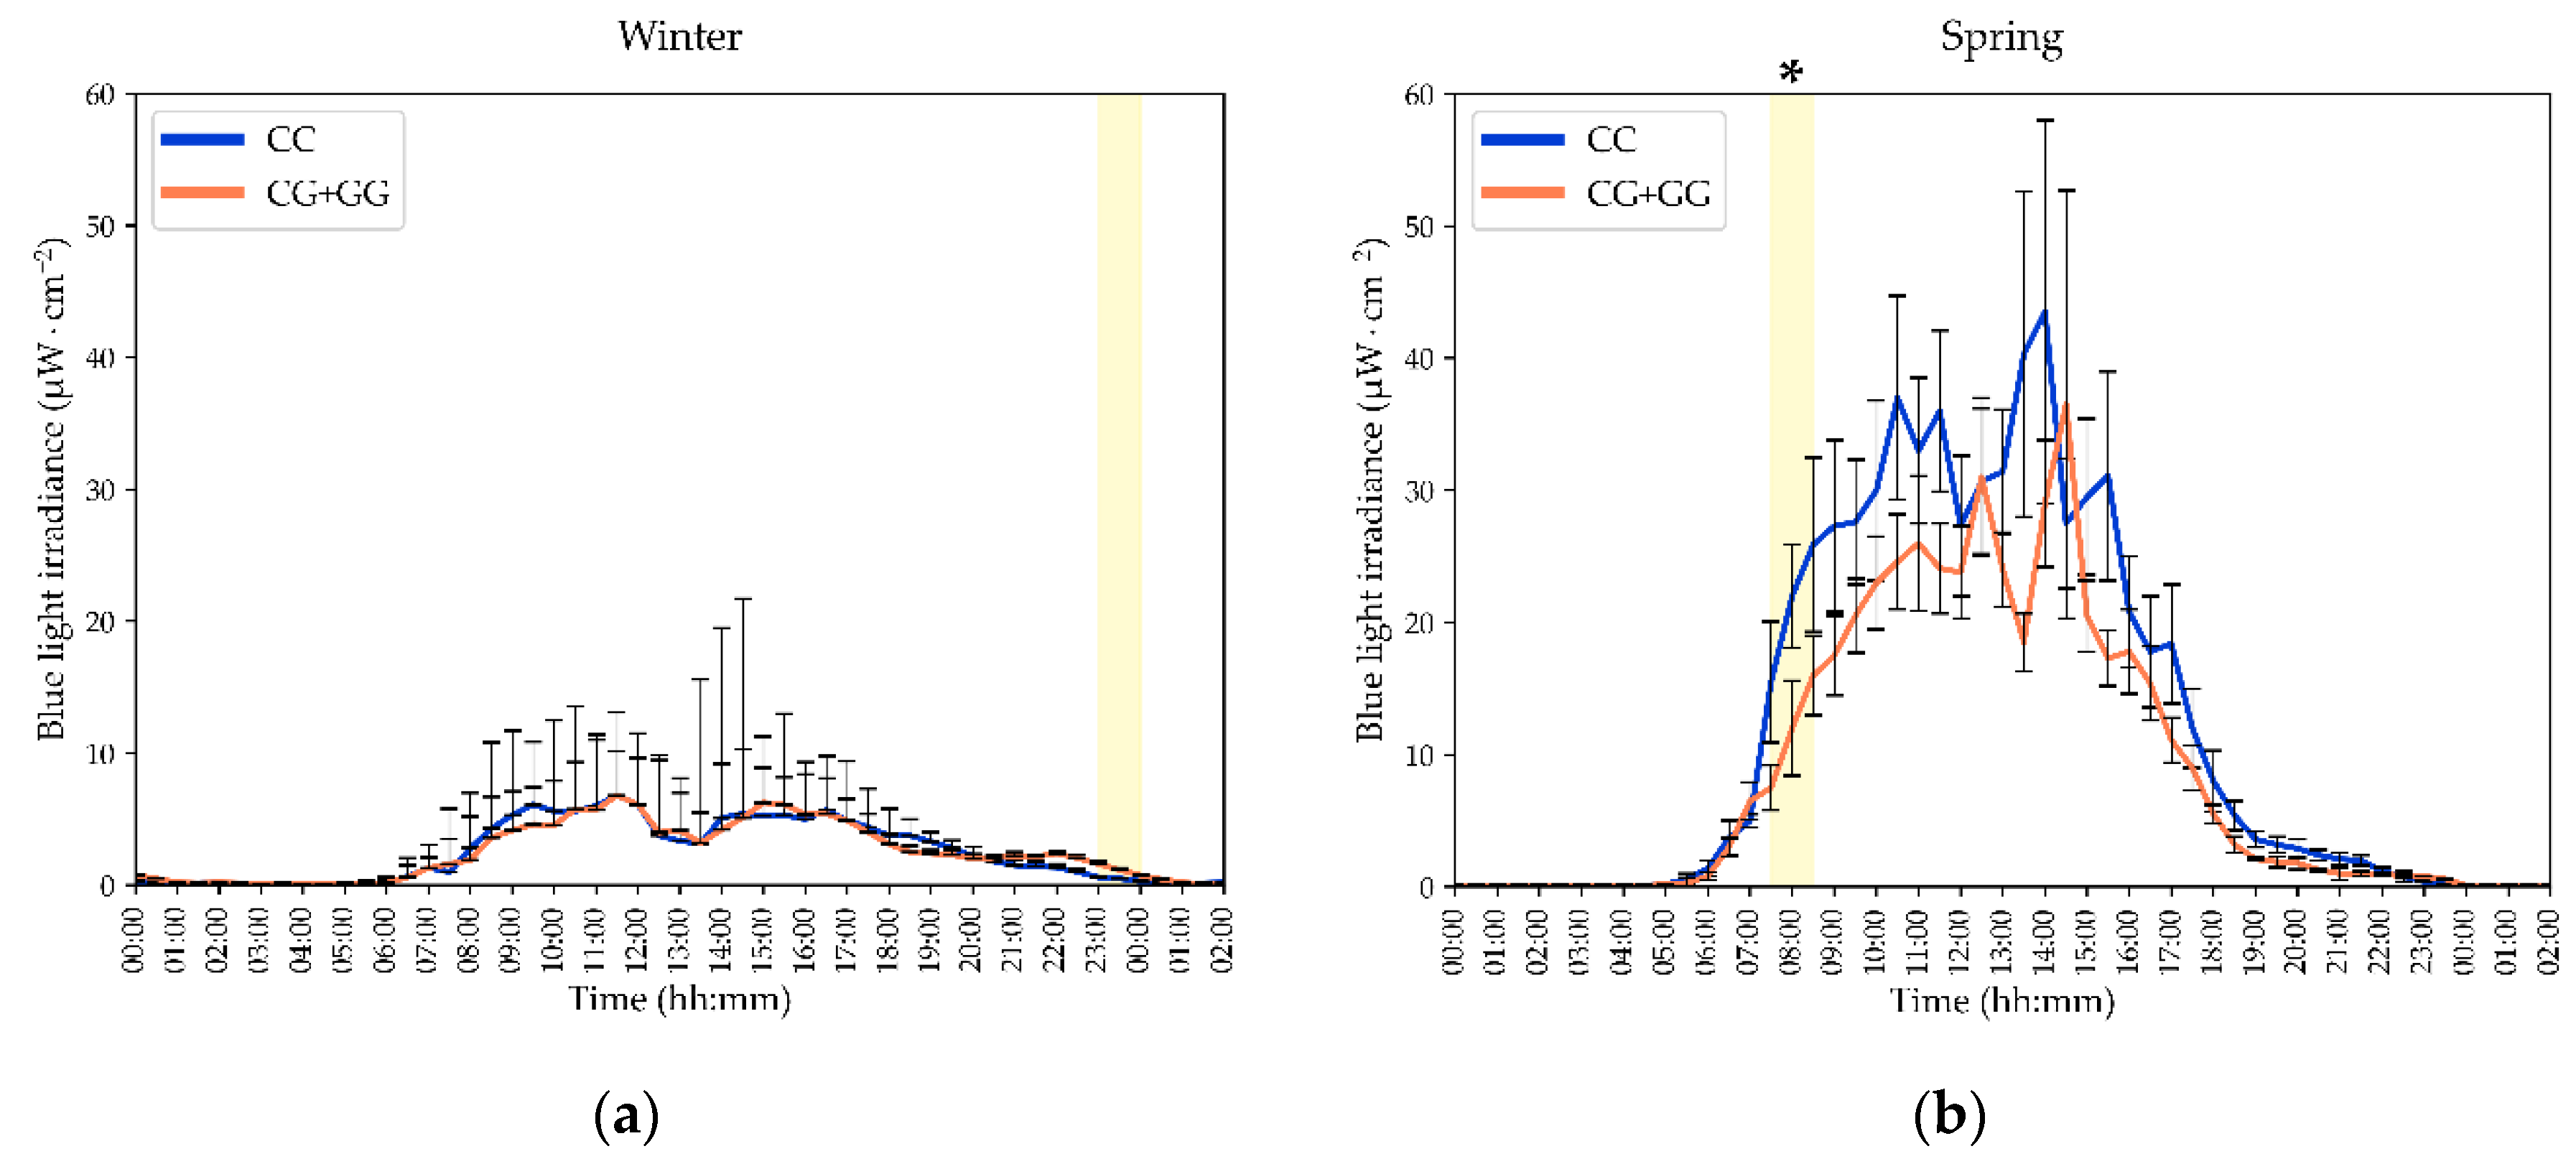
Figure 1. Season-specific 24 h blue light exposure (BLE) patterns differ by MTNR1B rs10830963 genotype. Left panel (Winter, a, c): raw BLE irradiance and log10-transformed BLE irradiance (log10[μW ⋅ cm−2]) is shown to emphasize evening low exposure differences; G allele carriers (CG+GG) exhibit significantly higher BLE than CC homozygotes between 23:00–24:00. Right panel (Spring, b, d): G allele carriers show significantly lower BLE than CC homozygotes between 07:30–08:30. Shaded areas indicate time windows with significant group differences by two sided Mann–Whitney U-test. Asterisks (*) mark time windows that remain significant after Benjamini–Hochberg correction for multiple comparisons at false discovery rate (FDR) = 0.10. Curves show median values and standard errors. MTNR1B, melatonin receptor 1B gene. The lower segments of CI were removed for plot a.
Preprints 235263 g001aPreprints 235263 g001b
Figure 2. MTNR1B rs10830963 genotype modulates winter-to-spring changes in novel light hygiene indices. (a) NA BLE increased from winter to spring in the full cohort, but the increase was significantly greater in G-allele carriers than in CC homozygotes; the genotype-by-season interaction was significant (two-way ANOVA, p = 0.012), and winter NA BLE was lower in G-allele carriers (p = 0.048). (b) The spring-to-winter difference in NA BLE was greater in G-allele carriers (p = 0.005). (c) NEI decreased significantly from winter to spring only in MTNR1B rs10830963 G-allele carriers (−1.46; 95% CI −3.01 to −0.09; Wilcoxon z = 2.35; p = 0.019), whereas no significant seasonal change was observed in CC homozygotes. NA BLE, normalized amplitude of blue light exposure; NEI, nocturnal excess index. Data are presented as mean with 95% CI unless otherwise indicated.
Preprints 235263 g002
Figure 3. Interplay of MTNR1B rs10830963 G-allele carriage with lipid metabolism across seasons. In the two-season longitudinal analysis, MTNR1B rs10830963 G-allele carriers exhibit significantly higher morning LDL-C (p = 0.002), TG/HDL-C ratio (p = 0.019), and CRI-I (p = 0.0002), alongside lower HDL-C (p = 0.006) compared to non-carriers. Winter: Reduced HDL-C (p = 0.024) and borderline elevated LDL-C (p = 0.069) contribute to an increased CRI-I (p = 0.009) in G-allele carriers during the polar night. Spring: Elevated LDL-C (p = 0.017) serves as the primary driver of the significantly higher CRI-I (p = 0.006) observed in G-allele carriers during the spring equinox. Note that results are overall consistent between the seasons. Differences in p-values around 0.05 are likely due to the modest sampling. * p < 0.05; ** p < 0.01; *** p < 0.001 (Mann–Whitney U-test).
Preprints 235263 g003
Figure 4. Time-resolved associations between blue-light exposure and morning fasting lipid indices across seasons by MTNR1B rs10830963 genotype. Time-resolved Pearson correlation coefficients (r) between blue-light exposure (BLE) and morning fasting lipid indices across consecutive 30-min time epochs. Panels show associations with (a) triglycerides (TG), (b) high-density lipoprotein cholesterol (HDL-C), (c) TG/HDL-C ratio, and (d) CRI-I. Orange and blue horizontal lines indicate the Benjamini–Hochberg false discovery rate threshold (FDR = 0.10) for G-allele carriers and CC homozygotes, respectively. Time epochs with significant associations after correction are shaded in brown for G-allele carriers and in blue for CC homozygotes. In panel a, a brief significant inverse association between BLE and TG was observed at 17:00–17:30. Orange and blue cosine curves represent the 24-h cosinor fits for G-allele carriers and CC homozygotes, respectively, indicating significant rhythmicity in both genotype groups. The analysis addresses whether morning fasting lipid levels are predicted by BLE across seasonal settings spanning the winter solstice and spring equinox. BLE, blue-light exposure; TG, triglycerides; HDL-C, high-density lipoprotein cholesterol; CRI-I, Castelli risk index I; BH, Benjamini–Hochberg correction; FDR, false discovery rate. Horizontal threshold lines denote the FDR-adjusted significance cutoff for each genotype group. Cosinor curves were fitted to the time-resolved correlation profiles and reject the zero-amplitude hypothesis, indicating significant 24-h rhythmicity.
Preprints 235263 g004
Table 1. General characteristics 1 of Arctic study participants by MTNR1B rs10830963 genotype.
Variable MTNR1B CC MTNR1B CG+GG p
Age 41.10 ± 2.09 40.67 ± 2.47 0.892
Body Mass Index (BMI) 24.67 ± 1.04 26.15 ± 1.20 0.355
Sex (Male/Female) 8 / 28 7 / 35 0.535
Indigeneity (Native/Non-Natives) 7 / 21 16 / 19 0.090
1 Data are presented as mean ± SD for continuous variables and as n for categorical variables. BMI, body mass index; m/f, male/female. P-values were calculated using independent-samples t-tests for continuous variables and χ2 or Fisher’s exact tests, as appropriate, for categorical variables. Indigeneity was classified as Native or Non-Native. No significant between-genotype differences were observed for age, BMI, sex distribution, or indigeneity.
Table 2. Actigraphy and light-exposure metrics 1 by MTNR1B rs10830963 genotype and season.
Variable Winter Spring
MTNR1B CC MTNR1B CG+GG MTNR1B CC MTNR1B CG+GG
Light Exposure
LE MESOR 24.7 (19.1; 30.2) 23.0 (16.8; 29.2) 109.1 (74.2; 144.1) 75.3 (58.1; 92.5)
LE Amplitude 27.6 (21.7; 33.5) 23.8 (17.2; 30.3) 150.4 (101.2; 199.6) 106.7 (81.4; 132.0)
LE Acrophase 14:03 (13:35; 14:31) 14:13 (13:35; 14:44) 12:51 (12:33; 13:08) 12:58 (12:34; 13:23)
BLE MESOR 2.78 (2.08; 3.47) 2.50 (1.87; 3.12) 16.64 (11.16; 22.13) 11.69 (8.44; 14.95)
BLE Amplitude 3.18 (2.43; 3.92) 2.57 (1.92; 3.21) 23.68 (15.86; 31.50) 17.05 (12.19; 21.92)
BLE Acrophase 14:04 (13:35; 14:32) 14:07 (13:43; 14:32) 12:46 (12:28; 13:04) 12:53 (12:29; 13:18)
IV BLE 0.722 (0.657; 0.786) 0.783 (0.667; 0.901) 0.948 (0.831; 1.064) 0.902 (0.743; 1.061)
IS BLE 0.432 (0.390; 0.473) 0.412 (0.347; 0.476) 0.373 (0.322; 0.425) 0.411 (0.349; 0.472)
M10 BLE 5.32 (4.09; 6.55) 4.62 (3.47; 5.77) 33.69 (23.07; 44.31) 25.62 (18.45; 32.78)
M10 Onset BLE 08:52 (08:26; 09:18) 08:45 (08:16; 09:14) 07:46 (07:31; 08:02) 07:52 (07:29; 08:16)
L5 BLE 0.131 (0.061; 0.201) 0.145 (0.030; 0.260) 0.084 (0.017; 0.152) 0.083 (0.028; 0.139)
L5 Onset BLE 02:09 (01:39; 02:38) 01:53 (01:12; 02:34) 01:25 (00:39; 02:10) 01:59 (00:37; 03:21)
RA BLE 0.941 (0.915; 0.966) 0.919 (0.851; 0.986) 0.983 (0.973; 0.992) 0.982 (0.970; 0.993)
DDI BLE 349.4 (336.4; 362.4) 357.0 (345.6; 368.4) 203.7 (168.7; 238.7) 212.2 (187.8; 236.5)
NEI BLE 2.48 (1.77; 3.18) 3.78 (1.75; 4.70) 2.45 (1.80; 3.10) 2.55 (1.26; 3.84)
NA BLE 1.17 (1.11; 1.23) 1.03 (0.94; 1.13)* 1.42 (1.35; 1.48) 1.45 (1.40; 1.50)
Activity and Sleep
MESOR 2473 (2244; 2701) 2686 (2276; 3095) 2581 (2236; 2926) 2828 (2301; 3354)
Amplitude 2038 (1787; 2290) 2074 (1774; 2374) 1758 (1530; 1985) 2018 (1593; 2442)
Acrophase 15:05 (14:30; 14:40) 15:14 (14:52; 15:37) 14:41 (14:90; 15:13) 14:47 (14:16; 15:37)
Bedtime 22:47 (22:13; 23:21) 23:12 (22:37; 23:47) 22:45 (22:19; 23:11) 23:00 (22:19; 23:41)
Wake time 07:41 (07:16; 08:06) 07:34 (07:10; 07:58) 06:59 (06:30; 07:27) 06:52 (06:11; 07:33)
Total Sleep 07:27 (07:08; 07:47) 07:01 (06:33; 07:28) 07:14 (06:51; 07:37) 07:16 (06:40; 07:51)
Sleep Efficiency 88.07 (85.64; 90.50) 86.99 (84.54; 89.45) 88.29 (85.11; 91.48) 88.02 (85.03; 91.02)
WASO 00:57 (00:48; 01:07) 00:55 (00:43; 01:08) 00:54 (00:44; 01:03) 00:52 (00:41; 01:03)
IV 0.878 (0.801; 0.955) 0.872 (0.785; 0.959) 0.863 (0.800; 0.926) 0.861 (0.787; 0.935)
IS 0.524 (0.490; 0.558) 0.562 (0.521; 0.603) 0.541 (0.504; 0.580) 0.541 (0.498; 0.584)
M10 4048 (3592; 4505) 4151 (3503; 4800) 4173 (3692; 4654) 4600 (3717; 5483)
M10 Onset 09:12 (08:43; 09:42) 09:36 (09:08; 10:04) 08:41 (08:13; 09:09) 09:17 (08:43; 09:52)
L5 272.4 (139.4; 286.4) 322.5 (199.1; 446.0) 212.9 (139.4; 286.4) 254.8 (154.2; 355.4)
L5 Onset 02:45 (02:14; 03:17) 02:14 (01:33; 02:54) 01:40 (01:13; 02:07) 01:40 (01:08; 02:12)
RA 0.865 (0.835; 0.896) 0.864 (0.826; 0.901) 0.877 (0.853; 0.902) 0.863 (0.830; 0.896)
1 Values are mean (95% confidence interval). Data are shown separately for winter and spring in MTNR1B CC homozygotes and G-allele carriers. LE, light exposure, lux; BLE, blue-light exposure, μW ⋅ cm−2; MESOR, 24-h rhythm-adjusted mean; amplitude, 24-h amplitude; 24-h acrophase, overall high values recurring each day, as assessed by fitting a 24-h cosine model to the data; M10, mean of the 10 consecutive hours with highest values; L5, mean of the 5 consecutive hours with lowest values; IV, intra-daily variability; IS, inter-daily stability; RA, relative amplitude; DDI, daylight deficiency index; NEI, nocturnal excess index. Phase and onset times are reported in hh:mm. DDI and NEI are expressed as μW ⋅ cm−2 ⋅ h. The only significant between-genotype difference was observed for the novel circadian light hygiene index, NA BLE, during winter, with lower values in G-allele carriers than in CC homozygotes (p < 0.05), marked *.
Table 3. Normalized amplitude of blue-light exposure predicts morning blood lipids only in MTNR1B rs10830963 G allele carriers 1.
Outcome Group r β [95% CI] p Partial η2 Power
TG All –0.202 –0.307 [–0.562, –0.053] 0.018 0.049 0.66
CG+GG –0.253 –0.507 [–0.942, –0.071] 0.024 0.116 0.63
CC –0.154 –0.131 [–0.488, 0.226] 0.464 0.011 0.11
HDL-C All 0.147 0.273 [0.037, 0.509] 0.023 0.046 0.63
CG+GG 0.262 0.448 [0.039, 0.857] 0.032 0.104 0.58
CC 0.072 0.127 [–0.177, 0.432] 0.406 0.014 0.13
TG/HDL-C All –0.216 –0.353 [–0.603, –0.105] 0.006 0.067 0.80
CG+GG –0.328 –0.594 [–1.022, –0.166] 0.008 0.157 0.78
CC –0.122 –0.148 [–0.479, 0.183] 0.375 0.015 0.14
CRI-I All –0.205 –0.279 [–0.519, –0.039] 0.023 0.046 0.63
CG+GG –0.204 –0.386 [–0.785, –0.117] 0.050 0.080 0.49
CC –0.138 –0.196 [–0.518, 0.127] 0.230 0.028 0.22
1 Results from linear mixed-effects models using longitudinal data from 63 Arctic residents during the winter solstice and spring equinox. Outcome variables are fasting triglycerides (TG), high density lipoprotein cholesterol (HDL-C), TG/HDL-C ratio, and CRI-I. Predictor: normalized amplitude of blue light exposure (NA BLE). Genotype groups: All (full sample), CG+GG (G allele carriers), CC (non-carriers). Models adjusted for population, sex, age, and season; reported statistics: Pearson correlation (r), standardized regression coefficient (β) with 95% confidence interval, p-value, partial η2 (effect size), and observed power. Significant associations (p < 0.05) are shown in bold. Sample size: n = 63 total (CC = 28; CG+GG = 35). Units: TG and HDL-C in mmol ⋅ L−1. Abbreviations: NA BLE, normalized amplitude of blue light exposure; MTNR1B, melatonin receptor 1B gene; CI, confidence interval.
Table 4. Cosinor model parameters for blue-light exposure–lipid associations by MTNR1B rs10830963 genotype 1.
Outcome MTNR1B genotype Acrophase (hh:mm) F -statistic Percent Rhythm p
BLE – TG/HDL-C CG+GG 02:31 47.19 67.7% <0.001
CC 20:30 21.97 49.4% <0.001
BLE – TG CG+GG 02:32 42.31 65.3% <0.001
CC 21:38 12.27 35.3% <0.001
BLE – CRI-I CG+GG 01:38 40.56 64.3% <0.001
CC 19:48 17.31 43.5% <0.001
BLE – HDL-C CG+GG 12:55 52.21 69.9% <0.001
CC 09:51 12.66 36.0% <0.001
* Cosinor model parameters are shown for associations between blue-light exposure (BLE) and morning fasting triglycerides (TG), HDL-C, TG/HDL-C ratio, and CRI-I, stratified by MTNR1B rs10830963 genotype (CC and G-allele carriers, CG+GG). Higher model fit (percent rhythm, equivalent to R2), and later acrophases indicate stronger and more delayed BLE–lipid associations in G-allele carriers. Abbreviations: BLE, blue-light exposure; TG, triglycerides; HDL-C, high-density lipoprotein cholesterol; CRI-I, Castelli risk index I; MTNR1B, melatonin receptor 1B gene.
Disclaimer/Publisher’s Note: The statements, opinions and data contained in all publications are solely those of the individual author(s) and contributor(s) and not of MDPI and/or the editor(s). MDPI and/or the editor(s) disclaim responsibility for any injury to people or property resulting from any ideas, methods, instructions or products referred to in the content.
Copyright: This open access article is published under a Creative Commons CC BY 4.0 license, which permit the free download, distribution, and reuse, provided that the author and preprint are cited in any reuse.