

Submitted:
25 September 2026
Posted:
28 September 2026
You are already at the latest version
Abstract
Background/Objectives: Oral semaglutide (Wegovy pill) and orforglipron (Foundayo) were recently approved for chronic weight management. Their safety and effectiveness have not been evaluated in real-world practice, particularly during the first few months when dose escalation, early treatment response, and tolerability may shape adherence.Methods: We retrospectively analyzed de-identified electronic health records through September 2026, including 16,220 oral Wegovy and 1,106 Foundayo recipients. Propensity matching on demographics, baseline characteristics including cardiometabolic burden, incretin history, the date of treatment initiation, and clinical visit frequency yielded 756 adult patients per drug. Clinical notes were curated with large language models (LLM), validated by physician adjudication.Results: In the unmatched cohorts, prior incretin exposure was recorded in 56.0% of oral Wegovy users versus 63.8% of Foundayo users (P<0.001). Prior injectable Wegovy use predominated among subsequent oral Wegovy users, whereas prior Zepbound use predominated among subsequent Foundayo users (both P<0.001). Dose escalation by day-90 lagged the recommended schedules for both agents. In matched cohorts, despite similar pre-treatment weight trajectories, mean weight change by 90 days after GLP-1 pill initiation was −3.1% with oral Wegovy (n=26) versus +0.4% with Foundayo (n=18), corresponding to a 3.55-percentage-point difference (95% CI, 1.02-6.08; P=0.007). Post-treatment initiation, LLM-curated clinical notes with physician adjudication confirmed weight-gain in a higher percentage of Foundayo users (5.3%) than oral Wegovy users (2.4%) (RR 2.20; P=0.016). Higher documentation of abnormal lipids was also evident from the LLM-curated notes among Foundayo users (1.7%) versus oral Wegovy users (<1.4%) (RR>5; P=0.009). Serial diagnostic lab testing showed a decrease in triglycerides during oral Wegovy use (−31.6 mg/dL; P=0.011, n=19) and a decrease in non-HDL cholesterol during Foundayo use (−30.5 mg/dL; P=0.04, n=11). Statins use did not meaningfully change upon Foundayo initiation, whereas significant statin-record frequency decrease was observed upon oral Wegovy prescribing (4.8% to 1.8%; P=0.020). Among Foundayo users, those with post-index statin co-prescriptions had numerically higher documented prevalence of abnormal lipids as expected, but also dizziness, and elevated liver enzymes than those without post-index statin co-prescriptions. Furthermore, adverse liver events and elevated liver enzymes were also numerically more frequent among Foundayo users than matched oral Wegovy users, presenting an emerging hypothesis that warrants prospective validation considering the FDA's postmarketing requirement to evaluate Foundayo liver safety and a subsequent FDA adverse-event report of hepatic failure. Conclusions: In a small subset of patients with follow-up weight measurements approximately 90 days after treatment initiation, oral Wegovy was associated with greater weight loss than Foundayo in routine care. Larger-scale and prospective follow-up analyses are warranted to more robustly compare the safety and effectiveness of these agents.
Keywords:
oral semaglutide
; orforglipron
; Wegovy
; Foundayo
; GLP-1 receptor agonists
; obesity
; weight management
Introduction
Oral incretin therapy creates a choice between two pharmacologically distinct approaches to weight management. Oral semaglutide is a peptide formulation, whereas orforglipron is a nonpeptide small molecule; both activate the same receptor but differ in formulation and recommended time of daily administration. Randomized trials have established substantial weight reduction with each agent, raising the question of how their outcomes compare when prescribed in routine care. The development of oral semaglutide progressed from a 50-mg trial demonstrating weight reduction to a 25-mg trial supporting the weight-management formulation, while a large phase 3 trial established the efficacy of orforglipron in adults with obesity1–3.
The two pills also differ in administration requirements. Oral semaglutide depends on the absorption enhancer salcaprozate sodium that facilitates uptake across the stomach, an approach established in clinical and preclinical studies4. Its prescribing information requires fasting administration and a delay before food, beverages, or other oral medications, whereas Foundayo can be taken with or without food; both products require gradual dose escalation5,6. Consequently, an early routine-care comparison reflects prescribed dose, treatment uptake, and the ability to sustain use as well as pharmacology. Trial efficacy at a maintenance dose may not reflect real-world outcomes during the first few months after prescribing, when many patients are still titrating or have yet to begin treatment.
Prior treatment further changes the clinical question. A patient beginning a first glucagon-like peptide-1 receptor agonist (GLP-1 RA) is seeking additional weight loss from an untreated baseline. By contrast, a patient changing from an injectable GLP-1 RA may instead be trying to preserve an established loss. Weight regain after semaglutide withdrawal illustrates the importance of continued treatment to maintenance7. More recently, a randomized trial demonstrated that orforglipron preserved a greater proportion of prior injectable-associated weight reduction than placebo after switching from semaglutide or tirzepatide8. These findings make treatment history essential to interpreting post-prescription weight trajectories, including reports of weight gain.
Direct randomized evidence also requires careful attention to the comparator. A 2026 trial in adults with type 2 diabetes mellitus (T2DM) found greater weight reduction with orforglipron than with oral semaglutide at diabetes-treatment doses of 7 or 14 mg9. That comparison does not establish the relative early performance of Foundayo and the oral Wegovy formulation in a population containing both new users and patients changing treatment. Nor do prescription records alone capture the reasons for non-initiation, dose changes, or treatment interruption. Clinical notes can supply this context and describe favorable and unfavorable experiences, provided that extracted findings are validated and distinguished from adjudicated adverse drug reactions.
Here we characterized prior GLP-1 RA exposure, prescribed dose, and documented treatment decisions in patients receiving oral Wegovy or Foundayo, then compared weight trajectories and clinical findings in propensity-matched adults. We also examined medication prescription frequency and longitudinal lab changes among patients with documentation before and after pill initiation. This approach connected the treatment history preceding a new prescription with early weight change, contemporaneous clinical experiences, and medication patterns, while evaluating the reliability of note-derived information through physician review.
Methods
Study Design and Cohort Definitions
We conducted a retrospective observational study using de-identified Electronic Health Records (EHR) from the nference Federated EHR platform with a data cutoff of September 2026. The descriptive exposure cohort included patients with product-specific prescription evidence or clinical-note evidence of oral Wegovy or Foundayo use. Generic semaglutide or injectable Wegovy without evidence of the oral formulation did not establish oral Wegovy exposure. Foundayo terminology included orforglipron and its investigational names. Within that cohort, patients required a dated first qualifying pill prescription and an age of at least 18 years. The reduction from the descriptive cohort therefore reflected differences in data coverage as well as the prescription and age requirements. The first recorded prescription was the index date for matched analyses; it did not establish first-ever use, dispensing, or ingestion. Neither an observed follow-up weight nor an outcome note was required for matching.
Exposure History, Clinical-Note Extraction, and Dose Records
A large language model (LLM), gpt-oss-20b, extracted structured exposure histories, treatment decisions, reasons, and clinical findings from clinical notes. Exposure and outcome tasks were prompted separately. Outputs retained supporting verbatim evidence, product and formulation information, event status, and available timing. Accepted evidence had to match the underlying note text. The extraction distinguished present findings from denied, historical, uncertain, or hypothetical statements, and explicit drug attribution from temporal co-occurrence. Patients were counted once per drug, category, and analysis interval; overlapping clinical categories could still include the same patient. The complete extraction prompts, required output schemas, and model configuration are provided separately (see Supplementary Methods).
For patients with a dated pill anchor, prior treatment was classified from the latest recorded GLP-1 RA product before that anchor. Explicit brand names were retained; records with no brand were not reassigned to a brand. Prior-treatment weight change described available measurements across the prior-record interval. Treatment-decision prevalence used the full unmatched cohort, while reason prevalence used patients with the corresponding documented decision. Reasons were nonexclusive and were not assumed absent when unrecorded.
Prescription-dose distributions used recognized tablet strengths: 1.5, 4, 9, and 25 mg for oral Wegovy and 0.8, 2.5, 5.5, 9, 14.5, and 17.2 mg for Foundayo. We selected the nearest dose record within 14 days of each 30-day landmark. The index distribution used the first prescription date. Missing doses were not carried forward, and percentages used patients with a recognized dose at each visit. The highlighted dose sequence represented the ordered strengths in the United States Food and Drug Administration (FDA) labels, displayed at 30-day landmarks. Label-directed escalation occurs after 30 days for oral Wegovy and at least 30 days for Foundayo, with further Foundayo escalation dependent on response and tolerability.
Baseline Characterization and Propensity Matching
The propensity-score model included age, sex, race, body mass index (BMI), weight, calendar date of the index prescription, prior GLP-1 RA treatment category (Zepbound, Mounjaro, Ozempic, Wegovy, other GLP-1 RA treatment, or no recorded prior treatment), time since the last prior GLP-1 RA record, span of prior GLP-1 RA records and prior weight change. Matching covariates also included indicators for diagnoses recorded during the year before the index prescription: T2DM, hypertension, dyslipidemia, coronary artery disease, heart failure, chronic kidney disease, obstructive sleep apnea, depression, anxiety, gastroesophageal reflux, gallbladder disease, pancreatitis, and liver disease. To account for differences in baseline data availability, the model additionally included the number of distinct days with diagnosis records and the number of distinct days with weight measurements during that year, an indicator for no recorded diagnoses, and indicators for missing continuous covariates.
Propensity scores were estimated using penalized logistic regression. Each Foundayo patient was matched to the nearest eligible oral Wegovy patient on the propensity-score logit, using a caliper of 0.2 pooled standard deviations (SDs), a maximum 90-day difference between index dates. Matching used a fixed random ordering and was performed 1:1 without replacement. Observed baseline summaries and standardized mean differences (SMDs) were calculated separately from imputed model covariates (Table 1).
Weight Trajectories
Multiple weight records on a calendar day were summarized by their median. Baseline weight was the last available daily value during days −30 through 0. Historical observations nearest 12 and six months before index were selected within 45-day windows; observations around three months before index and 30, 60, 90, 120, and 150 days afterward used 15-day windows. Negative-time changes used the same index baseline, so positive historical values indicated a higher weight before the pill prescription. Each landmark used available patients with both baseline and landmark weights. Missing follow-up was not imputed, and the contributing population could differ across visits. The 30-, 60-, and 90-day comparisons were the principal early trajectory analyses. Later oral Wegovy points were descriptive, with fewer than 11 contributors. No between-drug inference was made at those later points. Historical and post-index periods were displayed with different time scales, with proportionate spacing within each period.
Clinical Findings and Prior-Use Subgroups
We evaluated present favorable and unfavorable findings documented from the index date through day 90. A patient contributed to prevalence estimation when at least one usable note output was available in that interval. Each clinical category was a patient-level indicator of at least one qualifying finding, independent of the number of repeated mentions. The main analysis did not require explicit attribution to the pill and did not require absence of the finding at baseline. Thus, the estimand was documented prevalence among patients, not incident disease or adverse-reaction incidence among all matched patients.
The gastrointestinal composite was the union of nausea, vomiting, diarrhea, constipation, abdominal pain, reflux or dyspepsia, bloating, gastroparesis, bowel obstruction, and other gastrointestinal findings. Pancreatic and hepatobiliary findings were separate. The adverse-liver-events row was a deduplicated union of present unfavorable hepatic or biliary categories and additional liver-related findings captured by a broader text screen. It did not constitute an adjudicated drug-induced liver injury endpoint. Reported weight gain was further examined within recorded-prior-use and no-recorded-prior-use subgroups; unresolved histories were excluded from these subgroup displays.
Among matched patients with reported weight gain, we identified each patient’s earliest qualifying mention during days 1-90 after the index prescription, excluding index-day mentions before selecting that date. We summarized documentation timing as the median and interquartile range and compared distributions between drugs using an exploratory, unpaired, two-sided Mann-Whitney U test with an exact permutation P value accounting for ties. This case-only analysis described documentation timing rather than symptom onset and did not preserve the original matched-pair comparison.
Laboratory Measurements Before and After Treatment Initiation
Laboratory measurements were evaluated within the propensity-matched cohorts of 756 patients per drug. Baseline measurements were obtained during the 180 days before the index prescription, excluding index day; follow-up included all available measurements after index. Measurements with nonnumeric or qualified results, unrecognized units, or invalid dates were excluded from quantitative analysis. For each laboratory test, patients were included only if they had at least one valid measurement in both periods. Each patient’s median measurement was calculated separately before and after index, and their change was defined as the post-index median minus the pre-index median. Reported cohort means were averages of these patient-level medians. Non-HDL cholesterol was calculated from same-day total and HDL cholesterol values, and the neutrophil-to-lymphocyte ratio was calculated from same-day absolute neutrophil and lymphocyte counts. Missing measurements were not imputed. Within-drug changes were assessed using two-sided paired t-tests, with 95% confidence intervals for the mean change. Benjamini-Hochberg correction was applied across the 35 laboratory-drug comparisons.
Medication Prescription Frequency Before and After Pill Initiation
We examined statins, acid-suppressing medications, and migraine-specific therapies to explore medication patterns related to the lipid abnormalities, reflux or dyspepsia, and headache findings identified in clinical notes (Supplementary Table 1). Acid-suppressing medications included proton pump inhibitors, H2 blockers, and potassium-competitive acid blockers. Migraine-specific therapies included triptans, ergots, gepants, titans, and calcitonin gene-related peptide antibodies. Medication orders, dispensing records, and administration records were included.
For each patient in the propensity-matched cohorts, we compared the same number of days before and after the first oral-pill prescription, excluding the prescription date itself. The number of days was determined by the last available medication record after initiation, capped at 180 days. For example, a patient whose last medication record occurred 60 days after initiation contributed 60 days before and 60 days after initiation. Patients required a medication record at least 30 days after initiation and additionally required medication records on at least two distinct days before and two distinct days after initiation. The number of days with medication records after initiation had to be between half and twice the number before initiation. These criteria were intended to limit differences in documentation activity.
For each medication class, we divided the number of unique days with a prescription for that class by the number of unique days with a record for any medication prescription, including the index oral pill, and multiplied by 100. Multiple records on the same day counted once. We calculated this percentage separately before and after initiation for each patient, then averaged the percentages across patients. We compared each patient’s before-after percentages using two-sided paired t-tests and calculated 95% confidence intervals for the mean changes. Frequency ratios were calculated by dividing the post-initiation mean percentage by the pre-initiation mean percentage. Benjamini-Hochberg correction covered the six comparisons across three medication classes and two oral drugs.
Statin Exposure and Associated Clinical Findings
Within each propensity-matched oral-drug cohort, patients were grouped according to whether they had at least one statin prescription after pill initiation. Clinical findings were assessed using the existing LLM extraction from all available post-index notes, excluding index day. Each patient counted once per finding, with prevalence calculated among subgroup members with available clinical documentation. Two-sided Fisher exact tests compared subgroups within each oral-drug cohort, with Benjamini-Hochberg correction applied within the corresponding clinical-finding families. Statin subgroups were not separately matched, and findings were not required to occur after the first post-index statin prescription.
Physician Validation of Note Extraction
Stratified random samples were drawn separately for exposure history and treatment decisions and for outcomes, adverse events, and benefits. Each task contributed 100 note-level outputs, comprising 50 with at least one extracted event and 50 with no extracted events, with at most one note per patient within that task. A physician reviewed the exact note and structured LLM output, rating overall agreement and task-specific components as agree, disagree, or unable to determine. Components covered exposure or finding identity, event presence, evidence support, context, timing, attribution, and treatment consequences as applicable.
Agreement accuracy was calculated among adjudicable outputs as the proportion rated agree, with two-sided Wilson 95% CIs. To account for the balanced validation sample, overall agreement was additionally standardized to the full extraction population's event-positive prevalence. Sampling was separate for the two tasks, so the combined 200 reviews were not assumed to represent 200 distinct patients. Notes outside the sampled model outputs were not independently chart-reviewed; sensitivity and specificity for the complete clinical record were not estimated (Table 2).
Statistical Analysis
Continuous baseline variables were summarized as observed means and SDs with contributing counts, and categorical variables as counts and percentages. SMDs used the fixed pre-match pooled SD where applicable. Descriptive unmatched categorical comparisons used two-sided Fisher exact tests; comparisons of prior-record intervals and prior weight change used two-sided Welch tests where contributor counts permitted inference. These exploratory comparisons were not adjusted for multiplicity. Matched weight and clinical-finding estimates used the original match and common comparison-stratum weights based on the matched Foundayo population, restricted at each endpoint to strata with observations in both arms. Approximate t tests and 95% CIs used the available cluster degrees of freedom. Incomplete observed pairs were retained without rematching or treating missing outcomes as absence. Uncertainty was conditional on the fitted match and observed follow-up and did not remove selection bias from missingness.
For clinical findings, BH correction was applied jointly to the full family of 94 favorable and unfavorable endpoints, including categories omitted from the displayed panels; nonestimable comparisons entered the adjustment as P=1. The two displayed weight-gain subgroup contrasts were exploratory, and no subgroup-specific significance claim was treated as evidence of interaction. The additional liver union used observed proportions and a two-sided Fisher exact test because matched-pair covariance was unavailable; its q-value came from the separate 11-comparison exploratory liver family. The prevalence ratio (RR) in the clinical figure was the Foundayo prevalence divided by oral Wegovy prevalence. It was a descriptive prevalence ratio, not a person-time rate ratio; ratios with a zero oral Wegovy prevalence were not estimable. Confidence intervals for absolute between-drug differences were reported where available rather than inferring precision from the ratios. Nominal P-values were reported for weight, exposure, dose-related decisions. Exact positive event counts below 11 were masked as <11; zero counts were shown as 0, and displayed percentages were retained.
Statistical Analysis Plan for Study Advancement
This was an exploratory study that was not prospectively registered, and it is reported following the STROBE and RECORD guidelines10,11. Weight change through day 90 was the principal comparative outcome. Prior treatment, dose patterns, note-derived clinical findings, prior-use subgroups, laboratory changes, and prescription frequency were supporting analyses. Large language models can extract structured clinical information from notes, but their outputs require validation against the source text, which motivated our physician review12,13. Propensity-score balance assessed by SMDs14–16. Variance estimation retained the matched-pair structure17. Benjamini-Hochberg correction was applied within the test families defined in each Methods subsection18.
De-Identification and HIPAA Compliance Certification
Prior to analysis, all EHR data were de-identified under an expert determination consistent with the Health Insurance Portability and Accountability Act (HIPAA) Privacy Rule (45 CFR §164.514(b)(1)). The de-identification methodology employed a multi-layered transformation approach to both structured and unstructured data fields19,20. In structured data, direct identifiers including patient names and precise geographic locations were excluded entirely, while indirect identifiers underwent specific transformations: patient identifiers, medical record numbers, and accession numbers were replaced with one-way cryptographic hashes using confidential salts to preserve linkage across patient encounters; all dates were shifted backward by patient-specific random offsets (1-31 days) to preserve temporal relationships while obscuring exact event timing; the ZIP codes were truncated to two-digit state-level resolution; and continuous variables including age, height, weight, and BMI were thresholded to prevent identification of extreme values (for example, ages ≥89 years transformed to ‘89+’ and BMI >40 transformed to ‘40+’). In clinical text, an ensemble de-identification system that combines attention-based deep learning with rule-based methods achieved an estimated >99% recall for personally identifiable information (PII) detection, with detected identifiers replaced by plausible fictional surrogates. nference established secure data environments within each participating center, specifically designed to enable data access and analysis without requiring Institutional Review Board oversight, approval, or exemption confirmation. Accordingly, informed consent and IRB review were not required for this study.
Data Harmonization
To address heterogeneity in EHR data, we harmonized clinical variables including medications, anthropometric measurements, and diagnoses to standardized concepts. For medications, we first constructed a standardized drug concept database combining the nference knowledge graph with RXNorm (https://www.nlm.nih.gov/research/umls/rxnorm/index.html) hierarchies to capture ingredient, brand, and dose-specific information. Medication records were matched using a hierarchical approach prioritizing RXNorm codes when available, followed by ingredient-level matching, and finally natural language processing and pattern matching on free-text medication orders when structured codes were absent. For anthropometric measurements (height, weight, BMI), we created a unified vocabulary from SNOMED (https://www.snomed.org/, https://athena.ohdsi.org) and LOINC (https://loinc.org/) and matched EHR measurement descriptions using standardized text matching algorithms with abbreviation expansion and synonym resolution; ambiguous mappings were resolved using OpenAI GPT-4o (https://platform.openai.com/docs/models/gpt-4o) with summary statistics as context, followed by manual verification. For diagnoses, we developed a hierarchical disease concept database from the knowledge graph and matched EHR diagnosis by identifying the most specific common child concept in the hierarchy. This approach enabled consistent identification of clinical entities while preserving granularity where available.
Results
Derivation and Baseline Characterization of Matched Oral Wegovy and Foundayo Cohorts
The descriptive exposure cohort comprised 16,220 oral Wegovy and 1,106 Foundayo patients with a prescription or LLM-adjudicated confirmatory mention of pill use in clinical notes. A subset of 9,889 oral Wegovy and 1,065 Foundayo adults formed the matching pool. Propensity-score matching yielded matched cohorts of 756 patients per drug. Mean age was 55.0 versus 55.2 years, and 552 (73.0%) versus 557 (73.7%) were female. Among patients with available measurements, baseline weight was 93.5 versus 92.5 kg and body mass index (BMI) was 32.7 versus 32.3 kg/m2. With respect to baseline comorbidities, T2DM was documented in 8.1% versus 6.6%, hypertension in 40.7% versus 40.6%, and dyslipidemia in 43.8% versus 46.6%. Absolute SMDs were small for these characteristics, but some residual imbalance remained in prior weight change (SMD: 0.10). Missing baseline information was common, with baseline weight available for 507 oral Wegovy (67%) and 501 Foundayo (66%) patients, and baseline BMI for 420 (56%) and 429 (57%) patients, respectively (Figure 1, Table 1).
Differences in Prior Incretin Exposure Between Patients Initiating Oral Wegovy Versus Foundayo
Before matching, prior incretin exposure was recorded in 56.0% of oral Wegovy patients and 63.8% of Foundayo patients (P<0.001). Among the latest recorded prior treatments, Zepbound preceded oral Wegovy in 14.3% of patients and Foundayo in 19.9% (P<0.001), whereas injectable Wegovy was more common before oral Wegovy (12.1% versus 7.9%; P<0.001). Corresponding proportions were 3.8% versus 2.5% for Ozempic (P=0.025) and 2.6% versus 2.0% for Mounjaro (P=0.275) (Figure 1A). The mean interval from the last prior incretin record to the oral-pill index date was shorter for oral Wegovy than Foundayo among patients previously receiving injectable Wegovy (249 versus 358 days; P=0.004) or Ozempic (473 versus 786 days; P=0.004). Corresponding intervals were 171 versus 192 days for Zepbound (P=0.103) and 371 versus 271 days for Mounjaro (P=0.070) (Figure 1B). After matching, recorded prior incretin exposure was similar between oral Wegovy and Foundayo patients (66.1% versus 66.0%; P=1.000) (Table 1).
Dose Escalation and Treatment Decisions Described Heterogeneous Early Use
At the index prescription, dosage amount was available for 15,600 oral Wegovy and 1,079 Foundayo patients. Approximately 71% in each group received the starting dose, 1.5 and 0.8 mg, respectively. At day 30, the most frequently recorded doses were 4 mg for oral Wegovy (57%) and 2.5 mg for Foundayo (50%). By day 90, oral Wegovy doses were 1.5 mg in 12%, 4 mg in 38%, 9 mg in 33%, and 25 mg in 17% of the 1,017 patients with a dose record. Among 41 Foundayo patients with a day 90 dose record, 44% received 2.5 mg, 27% received 5.5 mg, and 12% received 9 mg. The declining number of contributing records limits inference about the pace of escalation for all treated patients (Figure 2).
Treatment initiation was confirmed in clinical notes for 11.3% of the oral Wegovy cohort and 13.6% of the Foundayo cohort (P=0.021). Dose escalation was documented in 3.0% versus 5.5% (P<0.001), dose maintenance in 3.9% versus 2.9% (P=0.105), and treatment discontinuation in 2.0% versus 2.2% (P=0.659). These are frequencies of documented decisions rather than estimates of adherence or persistence. Among patients with documented non-initiation of therapy (N=422 for oral Wegovy and N=29 for Foundayo), cost or insurance coverage was reported as a reason in 38.4% and 17.2%, respectively (P=0.027). Following a planned dose-increase schedule was cited as a reason for escalation in 14.8% of oral Wegovy patients and 19.7% of Foundayo patients with documented dose escalation (P=0.346). Among patients whose dose was maintained, achievement of a treatment goal or maintenance therapy was cited in 19.0% and 6.2%, respectively (P=0.098); the LLM extraction did not distinguish achieving a target dose from achieving a clinical outcome.
Among patients with documented dose reduction, side effects were recorded as at least one reason in 64.0% of oral Wegovy patients and 66.7% of Foundayo patients (P=1.000). Among those with documented discontinuation, corresponding proportions were 25.0% and 16.7%, respectively (Figure 2).
Oral Wegovy Was Associated with Greater Weight Reduction by 90 Days
The matched cohorts had similar observed weight trajectories before the index prescription. Twelve months earlier, weight was 3.5% above the index baseline in oral Wegovy patients and 3.7% above baseline in Foundayo patients (P=0.901); corresponding differences from baseline were +1.1% versus +2.0% at six months (P=0.467) and +0.8% versus +0.6% at three months (P=0.761). Thus, both groups had already experienced weight reduction before the new prescription among patients contributing historical observations (Figure 3).
After initiation, mean weight change was −1.3% (95% CI, −1.94 to −0.57; n=93) for oral Wegovy and −0.9% (95% CI, −1.88 to 0.09; n=93) for Foundayo at 30 days (P=0.557). At 60 days, mean changes were −2.3% (95% CI, −4.15 to −0.45; n=46) and −0.9% (95% CI, −2.66 to 0.81; n=48), respectively (P=0.284). Among patients with 90-day weight measurements, mean weight change was −3.1% for oral Wegovy (95% CI, −5.01 to −1.19; n=26) and +0.4% for Foundayo (95% CI, −1.40 to 2.29; n=18), corresponding to a between-group difference of 3.55 percentage points favoring oral Wegovy (95% CI, 1.02-6.08; P=0.007). These patients represented 3.4% and 2.4% of the respective matched cohorts, and the comparison was therefore restricted to a small subset with available follow-up (Figure 3).
Note-Derived Clinical Findings Were Broadly Similar, with Exploratory Differences in Selected Adverse Findings
Favorable clinical findings were documented at similar rates, including ease of use or good tolerability in 4.8% versus 5.3% (P=0.692), pain relief in 4.3% versus 4.1% (P=0.873), and improved physical function in 3.8% versus 3.1% (P=0.595) (Figure 4A). There were also no unfavorable findings which differed significantly between the two groups after adjustment for multiple hypothesis testing (Figure 4B). A gastrointestinal toxicity composite was documented in 3.4% of oral Wegovy and 5.3% of Foundayo patients (P=0.140; q=1.000). Abnormal lipids (1.7% versus <1.4%; prevalence ratio >5; P=0.009; q=0.769) and adverse liver events (fewer than 11 patients per group; prevalence ratio >2; P=0.144; q=1.000) were more frequently documented among Foundayo than oral Wegovy patients (Figure 4B).
For both oral Wegovy and Foundayo, reported weight gain was more prevalent among patients with recorded prior GLP-1 RA use than among those without such a record. Within the prior-use subgroups (n=329 for oral Wegovy and 328 for Foundayo), standardized prevalence was 3.44% and 6.99%, respectively (prevalence ratio, 2.03; nominal P=0.046). In patients with no recorded prior use (n=186 and 197), the corresponding prevalences were 0.63% and 2.89% (prevalence ratio, 4.57; nominal P=0.089) (Figure 4C). Among patients with a reported weight-gain mention during days 1-90, the median time to the first post-index mention was 41.5 days (Interquartile range [IQR], 19-70) for oral Wegovy and 42.5 days (IQR, 12-61.25) for Foundayo, with no statistically significant difference in timing distributions (Mann-Whitney P=0.685) (Figure 4D). These intervals describe the timing of documentation, rather than the onset of weight gain. Weight-gain findings were those documented in clinical notes after pill initiation, drawn from the same clinical-outcome extractions for which physician review of 100 sampled outputs showed 92.0% agreement (95% CI, 85.0-95.9) (Table 2).
Exploratory Lipid Changes After Treatment Initiation
Several laboratory-drug comparisons showed nominal within-patient changes, although none remained significant after multiple-testing correction (Figure 5). Among oral Wegovy patients with paired triglyceride measurements, mean concentrations decreased from 146.9 to 115.4 mg/dL (mean change, −31.6 mg/dL; 95% CI, −54.9 to −8.2; n=19; P=0.011; q=0.378). Corresponding concentrations in Foundayo patients decreased from 142.7 to 130.4 mg/dL (n=19; P=0.437) (Figure 5D). Non-HDL cholesterol decreased from 136.5 to 106.1 mg/dL in Foundayo patients (mean change, −30.5 mg/dL; 95% CI, −59.1 to −1.8; n=11; P=0.040; q=0.438), compared with 120.8 to 105.6 mg/dL in oral Wegovy patients (n<11; P=0.078) (Figure 5E). LDL cholesterol showed numerical reductions in both cohorts, but estimates were based on fewer than 11 paired patients per drug. Mean LDL cholesterol decreased from 119.0 to 102.6 mg/dL with oral Wegovy (mean change, −16.4 mg/dL; 95% CI, −46.8 to 14.0; P=0.234) and from 123.3 to 95.4 mg/dL with Foundayo (mean change, −27.9 mg/dL; 95% CI, −58.1 to 2.2; P=0.065) (Figure 5A). Total cholesterol decreased from 173.3 to 164.1 mg/dL with oral Wegovy (n=17; P=0.222) and from 192.2 to 167.2 mg/dL with Foundayo (mean change, −25.0 mg/dL; 95% CI, −50.4 to 0.4; n=14; P=0.053) (Figure 5C). These comparisons assessed change within each drug cohort; differences in within-drug significance do not establish differences between drugs.
Statin Prescription Frequency Decreased After Oral Wegovy Initiation, While Acid-Suppressing Prescription Frequency Increased After Foundayo Initiation
Medication analyses assessed statins, acid-suppressing medications, and migraine-specific therapies (Supplementary Table 1). The medication analysis included 149 oral Wegovy and 143 Foundayo patients who met the follow-up and prescription-record requirements. Each patient contributed equal numbers of days before and after initiation. The median duration on either side was 61 days for both drugs, with an IQR of 48-77 days for oral Wegovy and 43-76 days for Foundayo.
Among oral Wegovy patients, statin prescription frequency was 4.8% before initiation compared to 1.8% afterward (change, −3.01 percentage points [pp]; 95% CI, −5.54 to −0.48; fold change, 0.37; P=0.020; q=0.060). Among Foundayo patients, it was 1.9% versus 2.7% (change, 0.79 pp; 95% CI, −0.82 to 2.40; fold change, 1.41; P=0.335; q=0.439) (Figure 6A). Pre- and post-initiation prescription frequencies for acid-suppressing medication were 1.1% and 3.5% among Foundayo patients (change, 2.40 pp; 95% CI, 0.52-4.28; fold change, 3.10; P=0.013; q=0.060), compared with 3.1% and 4.1% among oral Wegovy patients (change, 1.02 pp; 95% CI, −1.20 to 3.23; fold change, 1.32; P=0.366; q=0.439) (Figure 6B). Migraine-specific therapies showed no change for oral Wegovy (1.4% versus 1.8%; fold change, 1.25; P=0.554; q=0.554) or Foundayo (2.0% versus 0.7%; fold change, 0.37; P=0.166; q=0.331) (Figure 6C). In exploratory analyses, Foundayo users with post-index statin prescriptions had higher documented prevalence of abnormal lipids and dizziness, with a numerical increase in elevated liver enzymes compared to Foundayo users without statin prescriptions (Figure S1B). Corresponding patterns were not evident among oral Wegovy users (Figure S1A). These signals warrant continued monitoring as patient numbers and follow-up duration increase.
Physician Review Supported the Reliability of Extracted Treatment Histories and Clinical Findings
A physician reviewed 100 note-level outputs for exposure history and treatment decisions and a separate sample of 100 outputs for clinical outcomes, adverse events, and benefits. Overall agreement was 97.0% (95% CI, 91.5-99.0) for exposure and treatment decisions and 92.0% (85.0-95.9) for outcomes. Field-level agreement ranged from 93.0% to 100.0%, with the lowest agreement observed for clinical finding classification. Because the validation sample intentionally included equal numbers of outputs with and without extracted events, we additionally reweighted agreement to reflect the actual proportion of event-positive outputs in the full extraction dataset. The resulting overall agreement estimates were 94.4% for exposure and treatment decisions and 91.7% for clinical outcomes. These metrics evaluate agreement with sampled extractions and are not estimates of sensitivity or specificity for all clinical events (Table 2).
Discussion
Oral GLP-1 receptor agonists extend incretin therapy to patients who prefer to avoid injections, yet the pivotal trials that established their efficacy leave open how they perform when prescribed in routine care2,3. In this early observational comparison of matched adults, oral Wegovy was associated with greater weight reduction than Foundayo 90 days after the first recorded prescription, a difference of 3.55 percentage points. Clinical notes curated by an LLM and reviewed by a physician offered a complementary view. Reported weight gain and abnormal lipids were more often documented among Foundayo patients and headache less often, but none of these differences survived correction for multiple testing. Together, these results describe an early divergence in weight and a set of clinical signals worth pursuing, rather than a ranking of long-term efficacy or safety.
Treatment history shapes how this divergence should be read. More than half of patients came to the pills with prior incretin exposure, Foundayo recipients more often after tirzepatide, and both matched groups had lost weight before the pill was prescribed. Against a baseline that already reflects treatment-associated loss, a stable or rising weight after a switch may represent incomplete maintenance rather than primary nonresponse. Semaglutide withdrawal leads to substantial regain7,21, and orforglipron preserved more injectable-associated weight loss than placebo in a randomized maintenance trial8. A comparison of two active oral treatments without a placebo or continued-injectable arm does not contradict that benefit. The time horizon also differs from the pivotal trials, which reported mean reductions of 13.6% with oral semaglutide 25 mg at 64 weeks and 11.2% with the highest orforglipron dose at 72 weeks, each against placebo2,3. In type 2 diabetes, orforglipron outperformed lower doses of oral semaglutide in a direct comparison, underscoring that population and dose determine comparative results9. In our cohorts, most patients with a recorded dose had not reached the maximum dose by day 90, and notes documented delayed starts and interruptions, so these early trajectories cannot be extrapolated to maintenance-dose outcomes. The pills also differ in administration: oral semaglutide depends on an absorption enhancer that requires fasting dosing4, but we could not measure whether dosing instructions were followed.
The secondary analyses are best read as documented clinical experience rather than estimates of adverse drug reactions. Weight gain and lipid abnormalities recorded in notes may reflect preexisting disease, changing treatment, or selective clinical attention. Physician review supported the reliability of the extraction, but agreement with what a note says does not establish incident disease, complete documentation, or causality, a distinction that matters when relating routine notes to trials with systematic adverse-event ascertainment. Laboratory measurements suggested favorable lipid changes with both pills, including nominal reductions in triglycerides with oral Wegovy and in non-HDL cholesterol with Foundayo. However, these came from small subsets with variable follow-up, none survived correction, and they may reflect measurement timing, concurrent lipid-lowering treatment, or regression to the mean. Prescription records added a further perspective. Statin prescription frequency fell after oral Wegovy initiation and acid-suppressing prescription frequency rose after Foundayo initiation, yet neither change survived correction, and neither establishes discontinuation or new treatment. Among Foundayo patients, those with post-index statin prescriptions more often had documented abnormal lipids and dizziness, and numerically more often elevated liver enzymes. The lipid difference is expected given the indication for statins, and these small, unmatched subgroups do not establish a drug interaction.
The study combined a broad exposure cohort, matching without replacement, pre-index weight history, structured prescription doses, evidence-supported note extraction, and physician review of sampled outputs. This study also has several limitations. First, as an observational comparison, it cannot establish causality; matching balanced measured characteristics, but differences in prior incretin exposure, clinical-trial participation, and incompletely recorded treatment histories may still contribute to the findings. Second, the 90-day weight comparison rests on 26 oral Wegovy and 18 Foundayo patients with a follow-up weight measurement. These patients may differ from the rest of the matched cohort in treatment response, tolerability, continuation, or healthcare use, and the balance achieved at matching may not hold in this subset. Third, a recorded prescription alone does not confirm that patients started or continued taking the pill, and note-based evidence of use was available only when clinicians documented it. A prescribed dose may also not match the dose the patient took. Differences in dose escalation and treatment continuation between the two groups could therefore contribute to the observed findings, but their contribution could not be established. Fourth, clinical findings depend on what was documented and processed. Missing notes alter which experiences are counted, events were sparse, and none of the clinical-finding comparisons survived correction for multiple testing. Fifth, follow-up was short. Later oral Wegovy observations had fewer than 11 contributors and no Foundayo comparator, so the comparative conclusion does not extend beyond 90 days.
These findings motivate a focused comparison of early oral-pill treatment that distinguishes first exposure from switching, records actual dose and continued use, and systematically captures weight and clinical events. The next question is whether the observed 90-day weight separation persists with more complete follow-up and comparable treatment exposure, and whether any of the clinical-finding signals replicates under a limited, prospectively specified testing plan. The liver findings are a priority for that evaluation. Adverse liver events and elevated liver enzymes were numerically more frequent with Foundayo than with oral Wegovy, and elevated liver enzymes were numerically more frequent among Foundayo patients with statin co-prescriptions than among those without. Liver safety of Foundayo also remains under regulatory evaluation after approval. Future studies should therefore measure liver enzymes at scheduled intervals and record concurrent statin use and dose. For now, in the small subset of matched adults with follow-up weight measurements, oral Wegovy was associated with greater early weight loss than Foundayo, while the clinical-finding, laboratory, and medication-record patterns provide hypotheses rather than established comparative safety effects.
Data Availability
This study analyzed de-identified electronic health record data. The data were extracted under an established privacy-preserving protocol and cannot be shared beyond what is reported here due to the parameters of the expert determination.
Code Availability
The analysis code is not publicly available. Please contact the corresponding author for details.
Competing Interest Statement
The authors are employees or consultants of nference, inc., which conducts research collaborations with various biopharmaceutical companies whose therapeutic products are included in this study. None of these companies, nor any other nference collaborator, funded, supported, or had any role in the independent study design, data acquisition, analysis, interpretation, manuscript preparation, or the decision to submit this work for publication. All analyses were conducted by the authors using de-identified electronic health record data. The authors declare no additional competing interests.
Author Contributions
Venky Soundararajan conceived and supervised the study. Venky Soundararajan and Karthik Murugadoss designed the study. Karthik Murugadoss performed the analyses and prepared the visualizations with A.J. Venkatakrishnan and Christopher Gregg. Gowtham Varma and Santhosh Shiv performed the LLM evaluation, with clinical insights from Marcelo Montorzi and Michael C. Gibson. All authors prepared, reviewed, and approved the final manuscript.
Funding
No external funding was received for this study.
Acknowledgments
The authors thank Patrick Lenehan for thorough review of the manuscript.
References
- Knop, F.K.; et al. Oral semaglutide 50 mg taken once per day in adults with overweight or obesity (OASIS 1): A randomised, double-blind, placebo-controlled, phase 3 trial. Lancet 2023, 402, 705–719. [Google Scholar] [CrossRef] [PubMed]
- Wharton, S.; et al. Oral semaglutide at a dose of 25 mg in adults with overweight or obesity. N. Engl. J. Med. 2025, 393, 1077–1087. [Google Scholar] [CrossRef] [PubMed]
- Wharton, S.; et al. Orforglipron, an oral small-molecule GLP-1 receptor agonist for obesity treatment. N. Engl. J. Med. 2025, 393, 1796–1806. [Google Scholar] [CrossRef] [PubMed]
- Buckley, S.T.; et al. Transcellular stomach absorption of a derivatized glucagon-like peptide-1 receptor agonist. Sci. Transl. Med. 2018, 10, eaar7047. [Google Scholar] [CrossRef] [PubMed]
- Available online: https://www.accessdata.fda.gov/drugsatfda_docs/label/2025/218316Orig1s000lbl.pdf.
- Available online: https://www.accessdata.fda.gov/drugsatfda_docs/label/2026/220934s003lbl.pdf.
- Wilding, J.P.H.; et al. Weight regain and cardiometabolic effects after withdrawal of semaglutide: The STEP 1 trial extension. Diabetes Obes. Metab. 2022, 24, 1553–1564. [Google Scholar] [CrossRef] [PubMed]
- Aronne, L.J.; et al. Orforglipron for maintenance of body weight reduction: The double-blind, randomized phase 3b ATTAIN-MAINTAIN trial. Nat. Med. 2026, 32, 2679–2687. [Google Scholar] [CrossRef] [PubMed]
- Rosenstock, J.; et al. Efficacy and safety of once-daily oral orforglipron compared with oral semaglutide in adults with type 2 diabetes (ACHIEVE-3): A multinational, multicentre, non-inferiority, open-label, randomised, phase 3 trial. Lancet 2026, 407, 1147–1160. [Google Scholar] [CrossRef] [PubMed]
- von Elm, E.; et al. The Strengthening the Reporting of Observational Studies in Epidemiology (STROBE) statement: Guidelines for reporting observational studies. PLoS Med. 2007, 4, e296. [Google Scholar] [CrossRef] [PubMed]
- Benchimol, E.I.; et al. The REporting of studies Conducted using Observational Routinely-collected health Data (RECORD) statement. PLoS Med. 2015, 12, e1001885. [Google Scholar] [CrossRef] [PubMed]
- Agrawal, M.; Hegselmann, S.; Lang, H.; Kim, Y.; Sontag, D. Large language models are few-shot clinical information extractors. In Proceedings of the 2022 Conference on Empirical Methods in Natural Language Processing 1998–2022, Association for Computational Linguistics, Stroudsburg, PA, USA, 2022. [Google Scholar]
- Huang, J.; et al. A critical assessment of using ChatGPT for extracting structured data from clinical notes. npj Digit. Med. 2024, 7, 106. [Google Scholar] [CrossRef] [PubMed]
- Rosenbaum, P.R.; Rubin, D.B. The central role of the propensity score in observational studies for causal effects. Biometrika 1983, 70, 41–55. [Google Scholar] [CrossRef]
- Austin, P.C. Optimal caliper widths for propensity-score matching when estimating differences in means and differences in proportions in observational studies. Pharm. Stat. 2011, 10, 150–161. [Google Scholar] [CrossRef] [PubMed]
- Austin, P.C. Balance diagnostics for comparing the distribution of baseline covariates between treatment groups in propensity-score matched samples. Stat. Med. 2009, 28, 3083–3107. [Google Scholar] [CrossRef] [PubMed]
- Austin, P.C. Comparing paired vs non-paired statistical methods of analyses when making inferences about absolute risk reductions in propensity-score matched samples. Stat. Med. 2011, 30, 1292–1301. [Google Scholar] [CrossRef] [PubMed]
- Benjamini, Y.; Hochberg, Y. Controlling the false discovery rate: A practical and powerful approach to multiple testing. J. R. Stat. Soc. Ser. B Stat. Methodol. 1995, 57, 289–300. [Google Scholar] [CrossRef]
- Murugadoss, K.; et al. Building a best-in-class automated de-identification tool for electronic health records through ensemble learning. Patterns 2021, 2, 100255. [Google Scholar] [CrossRef] [PubMed]
- Murugadoss, K.; et al. Scaling text de-identification using locally augmented ensembles. medRxiv 2024. [Google Scholar] [CrossRef]
- Rubino, D.; et al. Effect of continued weekly subcutaneous semaglutide vs placebo on weight loss maintenance in adults with overweight or obesity: The STEP 4 randomized clinical trial. JAMA 2021, 325, 1414–1425. [Google Scholar] [PubMed]
Figure 1.
Treatment history and construction of the matched outcome cohorts. The descriptive cohorts comprised 16,220 oral Wegovy and 1,106 Foundayo patients. (A) Latest recorded prior GLP-1 RA product; brand-unrecorded medications remained separate from named brands. (B) Time from the last prior medication record to the pill anchor, which does not establish a medication-free interval. (C) Mean weight change across the available prior GLP-1 RA records; error bars denote 95% CIs where estimable. The Foundayo estimate after prior Ozempic use is displayed without its highly imprecise interval. Sparse means are descriptive. (D) The exposure cohort, adult matching pool, and 756 matched patients per drug. Matching covariates included demographics, BMI and weight, prior treatment, comorbidities, index date and baseline data availability. Blue denotes oral Wegovy and red Foundayo. Exact small contributor counts are masked; baseline characteristics accompany the funnel (Table 1).
Figure 1.
Treatment history and construction of the matched outcome cohorts. The descriptive cohorts comprised 16,220 oral Wegovy and 1,106 Foundayo patients. (A) Latest recorded prior GLP-1 RA product; brand-unrecorded medications remained separate from named brands. (B) Time from the last prior medication record to the pill anchor, which does not establish a medication-free interval. (C) Mean weight change across the available prior GLP-1 RA records; error bars denote 95% CIs where estimable. The Foundayo estimate after prior Ozempic use is displayed without its highly imprecise interval. Sparse means are descriptive. (D) The exposure cohort, adult matching pool, and 756 matched patients per drug. Matching covariates included demographics, BMI and weight, prior treatment, comorbidities, index date and baseline data availability. Blue denotes oral Wegovy and red Foundayo. Exact small contributor counts are masked; baseline characteristics accompany the funnel (Table 1).
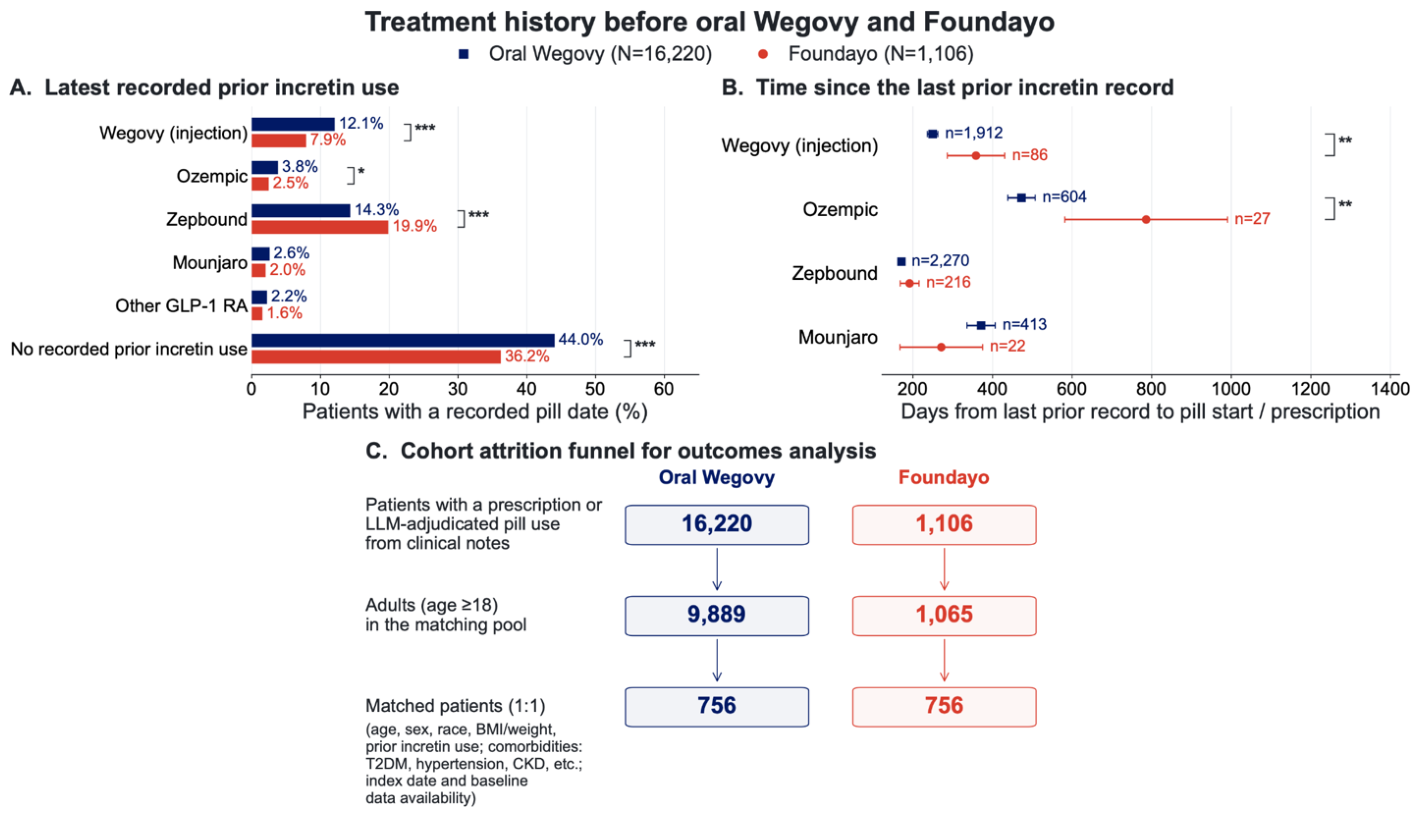
Figure 2.
Prescribed dose, documented treatment decisions, and reasons during oral-pill treatment. Analyses used the full unmatched cohorts of 16,220 oral Wegovy and 1,106 Foundayo patients. (A, B) Recognized prescription-dose distributions for oral Wegovy and Foundayo, respectively, among patients with dose records at each landmark. Gold borders indicate the ordered FDA-labeled dose sequence on the displayed 30 day schedule, not verified adherence to label-directed timing or required escalation to the maximum dose. (C) Frequencies of documented treatment decisions in the full cohorts. (D) Reasons for starting or not starting. (E) Reasons for dose escalation or maintenance. (F) Reasons for reduction, temporary holds, or discontinuation. Reason percentages use patients with the named decision as their denominator; reasons can coexist. Dose distributions and reasons use the contributing counts annotated in each panel. Blue denotes oral Wegovy and red Foundayo, with lighter shades for lower doses. Stars denote nominal P<0.05, P<0.01, and P<0.001.
Figure 2.
Prescribed dose, documented treatment decisions, and reasons during oral-pill treatment. Analyses used the full unmatched cohorts of 16,220 oral Wegovy and 1,106 Foundayo patients. (A, B) Recognized prescription-dose distributions for oral Wegovy and Foundayo, respectively, among patients with dose records at each landmark. Gold borders indicate the ordered FDA-labeled dose sequence on the displayed 30 day schedule, not verified adherence to label-directed timing or required escalation to the maximum dose. (C) Frequencies of documented treatment decisions in the full cohorts. (D) Reasons for starting or not starting. (E) Reasons for dose escalation or maintenance. (F) Reasons for reduction, temporary holds, or discontinuation. Reason percentages use patients with the named decision as their denominator; reasons can coexist. Dose distributions and reasons use the contributing counts annotated in each panel. Blue denotes oral Wegovy and red Foundayo, with lighter shades for lower doses. Stars denote nominal P<0.05, P<0.01, and P<0.001.
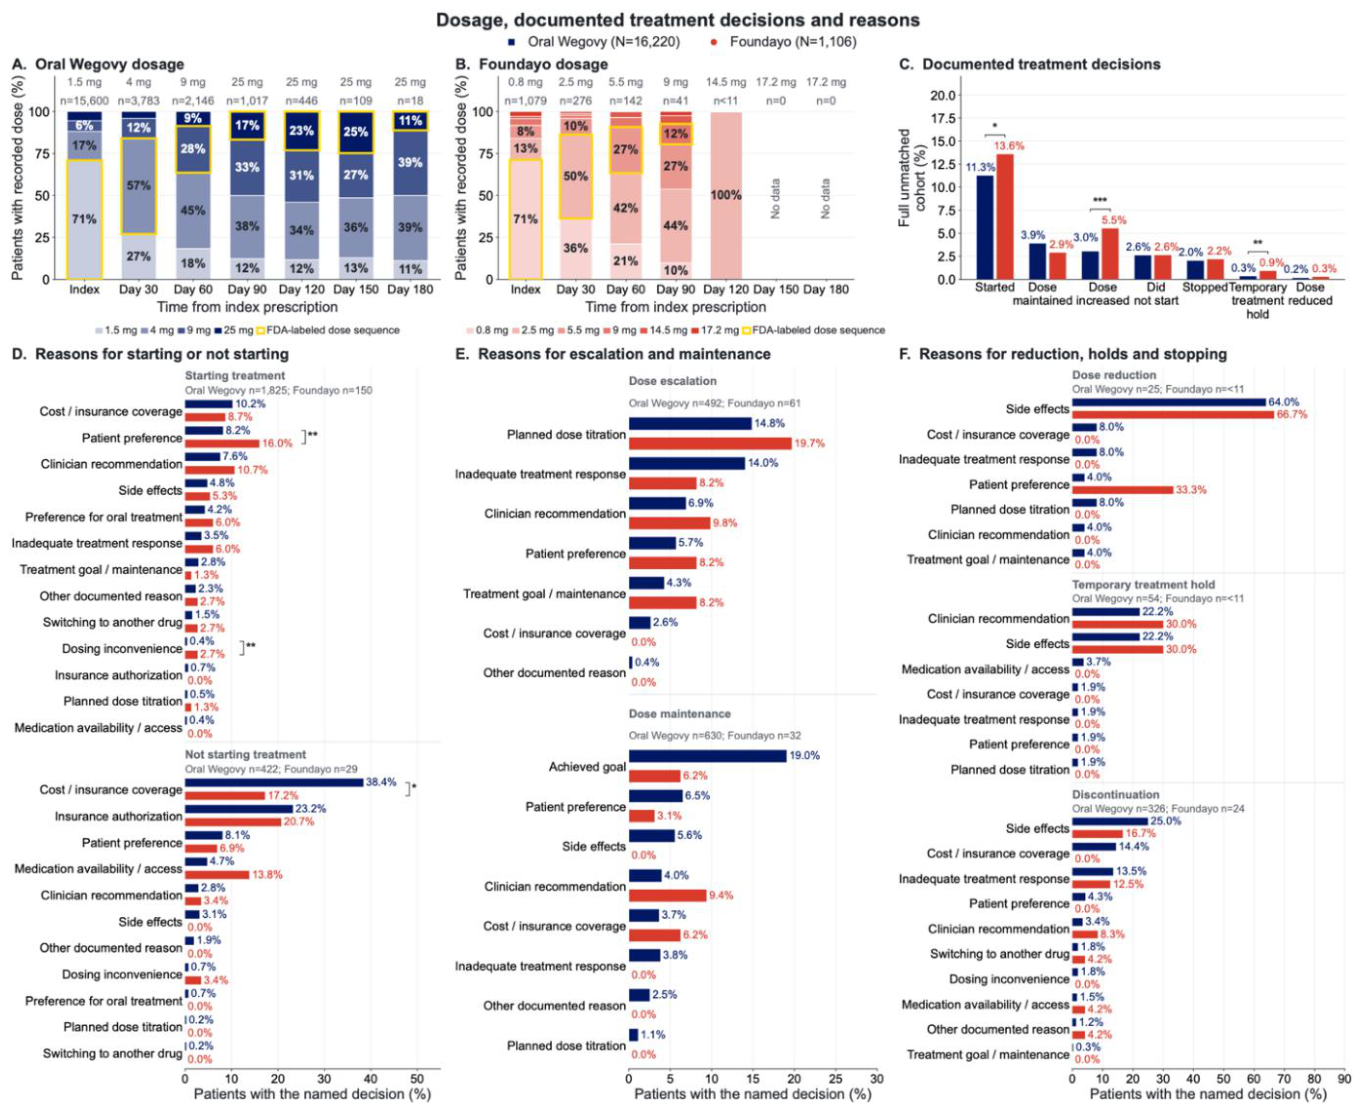
Figure 3.
Weight trajectory before and after pill initiation in propensity-matched adults. The comparison began with 756 oral Wegovy and 756 Foundayo patients; each time point uses those with both an index-baseline and a landmark weight. Values are percent change from the same index baseline, including pre-index observations. Shading and whiskers denote 95% intervals. Contributor counts below each landmark are ordered oral Wegovy/Foundayo and mask positive counts below 11. No measurements for the Foundayo cohort were available at 120 and 150 days. Historical and post-index time are proportionately spaced within separately scaled periods. Blue denotes oral Wegovy and red Foundayo. Nominal between-drug P-values describe the observed matched comparison.
Figure 3.
Weight trajectory before and after pill initiation in propensity-matched adults. The comparison began with 756 oral Wegovy and 756 Foundayo patients; each time point uses those with both an index-baseline and a landmark weight. Values are percent change from the same index baseline, including pre-index observations. Shading and whiskers denote 95% intervals. Contributor counts below each landmark are ordered oral Wegovy/Foundayo and mask positive counts below 11. No measurements for the Foundayo cohort were available at 120 and 150 days. Historical and post-index time are proportionately spaced within separately scaled periods. Blue denotes oral Wegovy and red Foundayo. Nominal between-drug P-values describe the observed matched comparison.
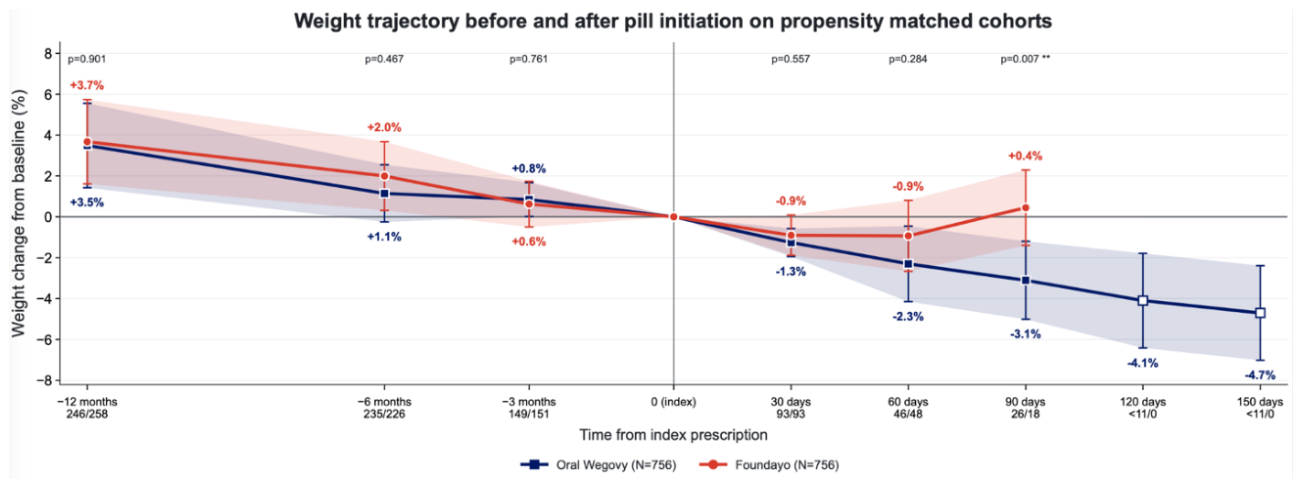
Figure 4.
Clinical findings documented during the first 90 days after pill initiation. The legend gives the full matched cohort size, 756 per drug. (A) Favorable clinical findings. (B) Unfavorable clinical findings, ordered by overall prevalence. Categories can overlap. Columns report the Foundayo-to-oral-Wegovy prevalence ratio, nominal P-value, and BH q-value; none of the principal clinical-finding comparisons survived BH correction. Bold P-values denote nominal P<0.05; bold prevalence ratios denote values >2 or <0.5 and do not indicate significance. NE, not estimable. Percentages for categories with fewer than 11 patients are shown as <1.4% (10 of 756), and the prevalence ratio is shown as a range when either group has fewer than 11 patients; sparse rows omitted from display remain in the BH family. (C) The reported-weight-gain finding by recorded prior GLP-1 RA use. Blue denotes oral Wegovy and red Foundayo. (D) Time from the index prescription to the first reported weight-gain mention during days 1-90. Boxes show the interquartile range, internal lines indicate medians, and whiskers extend to the most extreme observations within 1.5 interquartile ranges of the box. Numeric annotations give median (IQR) in days. .
Figure 4.
Clinical findings documented during the first 90 days after pill initiation. The legend gives the full matched cohort size, 756 per drug. (A) Favorable clinical findings. (B) Unfavorable clinical findings, ordered by overall prevalence. Categories can overlap. Columns report the Foundayo-to-oral-Wegovy prevalence ratio, nominal P-value, and BH q-value; none of the principal clinical-finding comparisons survived BH correction. Bold P-values denote nominal P<0.05; bold prevalence ratios denote values >2 or <0.5 and do not indicate significance. NE, not estimable. Percentages for categories with fewer than 11 patients are shown as <1.4% (10 of 756), and the prevalence ratio is shown as a range when either group has fewer than 11 patients; sparse rows omitted from display remain in the BH family. (C) The reported-weight-gain finding by recorded prior GLP-1 RA use. Blue denotes oral Wegovy and red Foundayo. (D) Time from the index prescription to the first reported weight-gain mention during days 1-90. Boxes show the interquartile range, internal lines indicate medians, and whiskers extend to the most extreme observations within 1.5 interquartile ranges of the box. Numeric annotations give median (IQR) in days. .
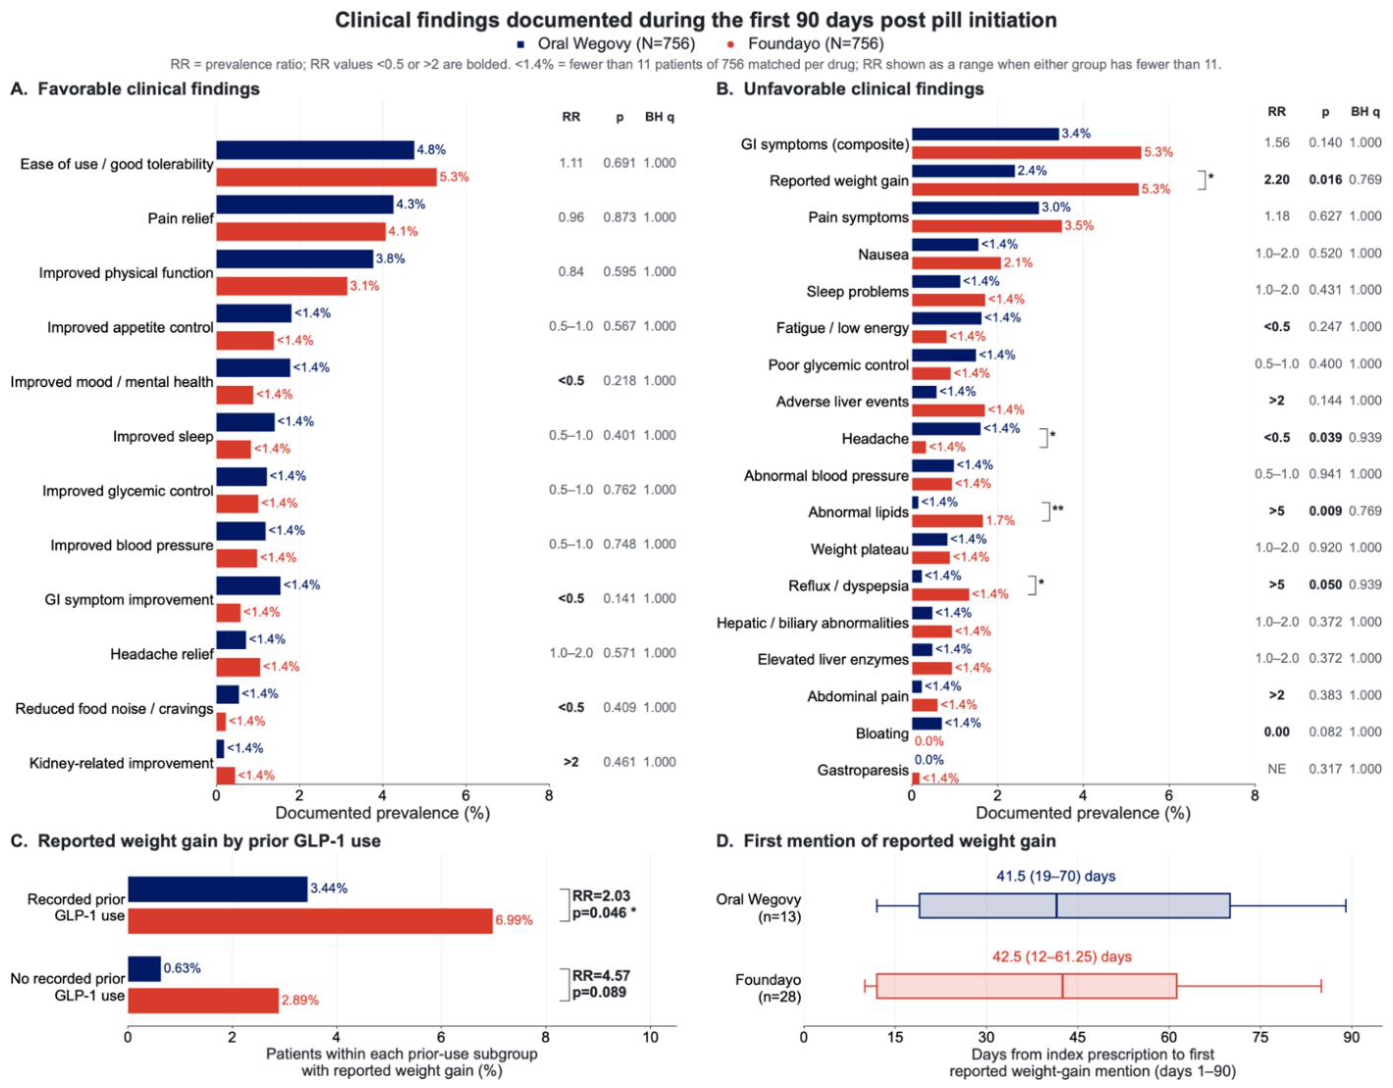
Figure 5.
Laboratory values before and after oral-pill initiation. Laboratory analyses used available paired measurements from the propensity-matched cohorts of 756 patients per drug. Panels show (A) LDL cholesterol, (B) HDL cholesterol, (C) total cholesterol, (D) triglycerides, (E) non-HDL cholesterol, (F) HbA1c, (G) glucose, (H) alanine aminotransferase, (I) aspartate aminotransferase, (J) alkaline phosphatase, (K) total bilirubin, (L) albumin, (M) neutrophils, (N) lymphocytes, (O) white blood cells, (P) platelets, (Q) neutrophil-to-lymphocyte ratio, and (R) C-reactive protein. Each observation underlying a box is a patient’s median value during days −180 to −1 (Pre) or all available days after index (Post). Index-day measurements were excluded, and follow-up was not restricted to 90 days. The same patients contribute to the pre- and post-index boxes within each drug and laboratory test. Blue denotes oral Wegovy and red Foundayo; light and dark fills indicate pre- and post-index values, respectively. Boxes span the interquartile range, center lines indicate medians, and whiskers extend to the most extreme observations within 1.5 times the interquartile range of the box. Numeric labels give distribution medians to one decimal place. Foundayo had no paired C-reactive protein measurements. Colored brackets identify nominally significant within-drug changes from two-sided paired t-tests.
Figure 5.
Laboratory values before and after oral-pill initiation. Laboratory analyses used available paired measurements from the propensity-matched cohorts of 756 patients per drug. Panels show (A) LDL cholesterol, (B) HDL cholesterol, (C) total cholesterol, (D) triglycerides, (E) non-HDL cholesterol, (F) HbA1c, (G) glucose, (H) alanine aminotransferase, (I) aspartate aminotransferase, (J) alkaline phosphatase, (K) total bilirubin, (L) albumin, (M) neutrophils, (N) lymphocytes, (O) white blood cells, (P) platelets, (Q) neutrophil-to-lymphocyte ratio, and (R) C-reactive protein. Each observation underlying a box is a patient’s median value during days −180 to −1 (Pre) or all available days after index (Post). Index-day measurements were excluded, and follow-up was not restricted to 90 days. The same patients contribute to the pre- and post-index boxes within each drug and laboratory test. Blue denotes oral Wegovy and red Foundayo; light and dark fills indicate pre- and post-index values, respectively. Boxes span the interquartile range, center lines indicate medians, and whiskers extend to the most extreme observations within 1.5 times the interquartile range of the box. Numeric labels give distribution medians to one decimal place. Foundayo had no paired C-reactive protein measurements. Colored brackets identify nominally significant within-drug changes from two-sided paired t-tests.
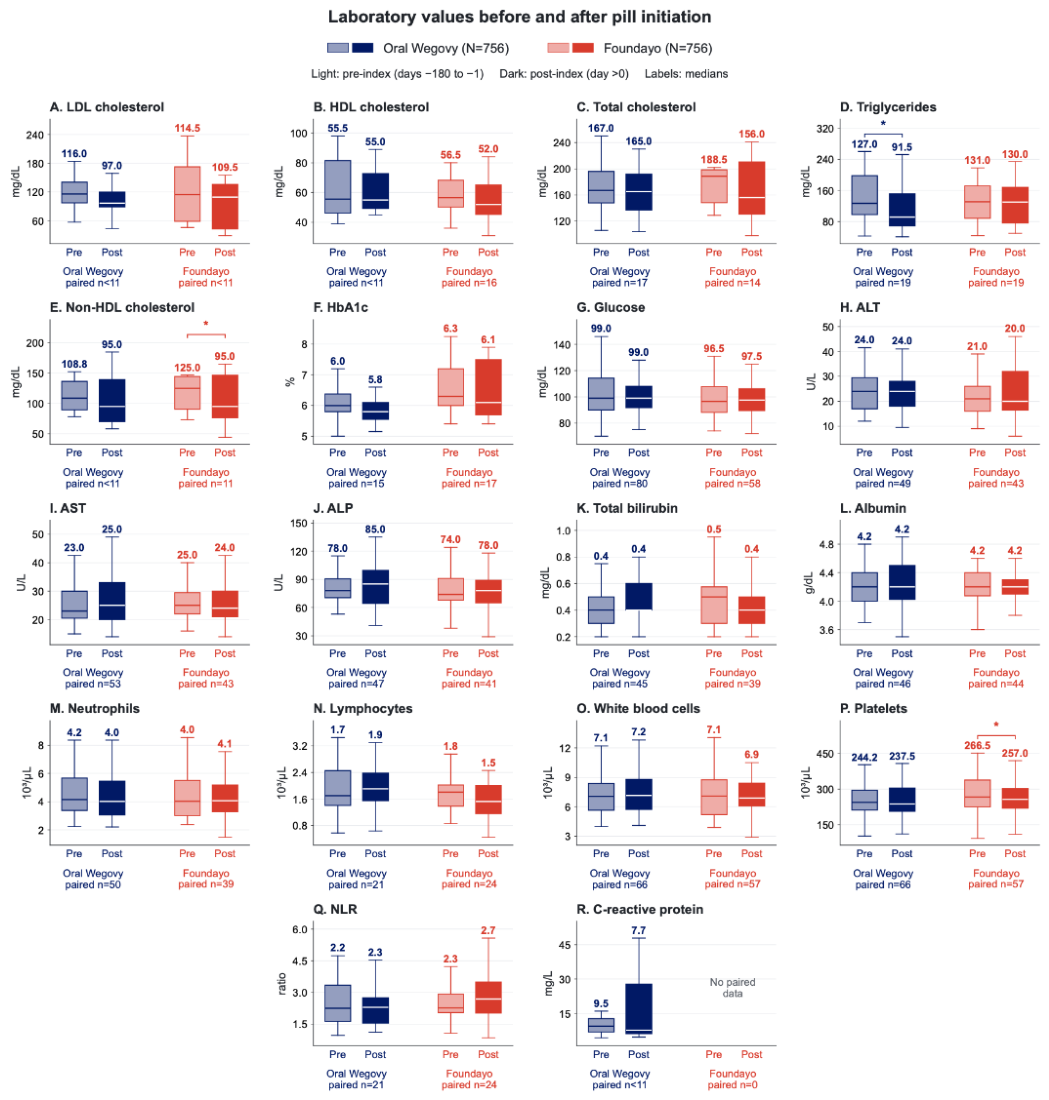
Figure 6.
Prescription frequency before and after oral-pill initiation (A-C) Prescription frequency for statins, acid-suppressing medications, and migraine-specific therapies, respectively, before and after pill initiation. Bars show the mean patient-level percentage of prescription-days that included the indicated class, with 95% confidence intervals. Equal observation periods before and after initiation excluded index day and were capped at 180 days. Analyses included 149 oral Wegovy and 143 Foundayo patients. Light and dark shades indicate pre- and post-index values; brackets show post/pre fold changes and nominal P-values from paired t-tests. Blue denotes oral Wegovy and red Foundayo. The top legend gives the full matched cohort size of 756 per drug.
Figure 6.
Prescription frequency before and after oral-pill initiation (A-C) Prescription frequency for statins, acid-suppressing medications, and migraine-specific therapies, respectively, before and after pill initiation. Bars show the mean patient-level percentage of prescription-days that included the indicated class, with 95% confidence intervals. Equal observation periods before and after initiation excluded index day and were capped at 180 days. Analyses included 149 oral Wegovy and 143 Foundayo patients. Light and dark shades indicate pre- and post-index values; brackets show post/pre fold changes and nominal P-values from paired t-tests. Blue denotes oral Wegovy and red Foundayo. The top legend gives the full matched cohort size of 756 per drug.
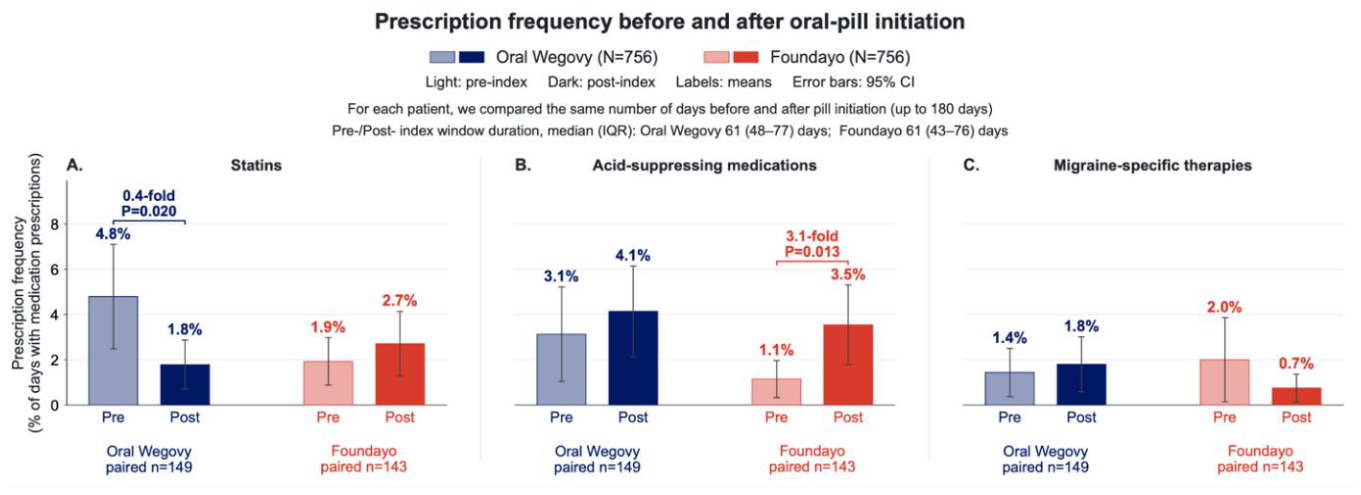

Table 1.
Clinical characteristics before and after matching for oral Wegovy and Foundayo. The matching pool comprises adults aged ≥18 years with a qualifying first prescription; the 1:1 match without replacement contains 756 oral Wegovy and 756 Foundayo patients. Values are observed mean (standard deviation), with contributing n, or count (column percentage). Rows summarize demographics, anthropometric measurements, prior treatment, prior-year diagnoses and baseline clinical history. Diagnoses use a one-year lookback; absent records do not establish absence of disease. Absolute standardized mean differences (SMDs) use observed values and the fixed pre-match pooled standard deviation; they differ from imputed model-balance diagnostics. Counts below 11 are shown as <11; complementary cells and contributing counts are additionally suppressed where needed. NR means not reported because a comparison is suppressed or not estimable; blank SMD cells indicate no comparison reported for missingness rows. BMI denotes body mass index and GLP-1 denotes glucagon-like peptide-1. Prior-record span is not continuous treatment duration. Cohort selection is shown in Figure 1.
Table 1.
Clinical characteristics before and after matching for oral Wegovy and Foundayo. The matching pool comprises adults aged ≥18 years with a qualifying first prescription; the 1:1 match without replacement contains 756 oral Wegovy and 756 Foundayo patients. Values are observed mean (standard deviation), with contributing n, or count (column percentage). Rows summarize demographics, anthropometric measurements, prior treatment, prior-year diagnoses and baseline clinical history. Diagnoses use a one-year lookback; absent records do not establish absence of disease. Absolute standardized mean differences (SMDs) use observed values and the fixed pre-match pooled standard deviation; they differ from imputed model-balance diagnostics. Counts below 11 are shown as <11; complementary cells and contributing counts are additionally suppressed where needed. NR means not reported because a comparison is suppressed or not estimable; blank SMD cells indicate no comparison reported for missingness rows. BMI denotes body mass index and GLP-1 denotes glucagon-like peptide-1. Prior-record span is not continuous treatment duration. Cohort selection is shown in Figure 1.
| Characteristic | Before matching | After matching | ||||
|
Oral Wegovy (N=9,889) |
Foundayo (N=1,065) |
SMD |
Oral Wegovy (N=756) |
Foundayo (N=756) |
SMD | |
| Demographics | ||||||
| Age, years | 53.2 (14.8) n=9,889 |
54.9 (14.9) n=1,065 |
0.113 | 55.0 (15.0) n=756 |
55.2 (14.6) n=756 |
0.009 |
| Female | 7,318 (74.0%) | 792 (74.4%) | 0.008 | 552 (73.0%) | 557 (73.7%) | 0.015 |
| White | 7,323 (74.1%) | 873 (82.0%) | 0.192 | 624 (82.5%) | 621 (82.1%) | 0.010 |
| Black | 1,812 (18.3%) | 101 (9.5%) | 0.258 | 70 (9.3%) | 70 (9.3%) | 0.000 |
| Asian | 189 (1.9%) | 25 (2.3%) | 0.030 | 21 (2.8%) | 18 (2.4%) | 0.027 |
| Other/unknown race | 565 (5.7%) | 66 (6.2%) | 0.020 | 41 (5.4%) | 47 (6.2%) | 0.034 |
| Anthropometric measurements | ||||||
| Weight, kg | 99.6 (22.6) n=7,334 |
92.8 (20.8) n=729 |
0.313 | 93.5 (20.6) n=507 |
92.5 (20.6) n=501 |
0.046 |
| Weight, kg: missing | 2,555 (25.8%) | 336 (31.5%) | 249 (32.9%) | 255 (33.7%) | ||
| BMI, kg/m2 | 34.4 (5.2) n=5,839 |
32.5 (5.4) n=630 |
0.365 | 32.7 (5.2) n=420 |
32.3 (5.5) n=429 |
0.065 |
| BMI, kg/m2: missing | 4,050 (41.0%) | 435 (40.8%) | 336 (44.4%) | 327 (43.3%) | ||
| Prior treatment | ||||||
| Prior Zepbound | 1,154 (11.7%) | 214 (20.1%) | 0.232 | 144 (19.0%) | 149 (19.7%) | 0.018 |
| Prior Mounjaro | 215 (2.2%) | 21 (2.0%) | 0.014 | 16 (2.1%) | 13 (1.7%) | 0.028 |
| Other prior tirzepatide | 784 (7.9%) | 145 (13.6%) | 0.184 | 124 (16.4%) | 120 (15.9%) | 0.017 |
| Prior injectable semaglutide | 2,937 (29.7%) | 171 (16.1%) | 0.329 | 131 (17.3%) | 128 (16.9%) | 0.010 |
| No recorded prior GLP-1 | 4,445 (44.9%) | 376 (35.3%) | 0.198 | 256 (33.9%) | 257 (34.0%) | 0.003 |
| Other/uncertain prior GLP-1 | 354 (3.6%) | 138 (13.0%) | 0.345 | 85 (11.2%) | 89 (11.8%) | 0.019 |
| Prior-year diagnoses | ||||||
| Type 2 diabetes | 601 (6.1%) | 70 (6.6%) | 0.020 | 61 (8.1%) | 50 (6.6%) | 0.060 |
| Hypertension | 4,174 (42.2%) | 429 (40.3%) | 0.039 | 308 (40.7%) | 307 (40.6%) | 0.003 |
| Dyslipidemia | 4,077 (41.2%) | 470 (44.1%) | 0.059 | 331 (43.8%) | 352 (46.6%) | 0.056 |
| Coronary artery disease | 789 (8.0%) | 99 (9.3%) | 0.047 | 51 (6.7%) | 60 (7.9%) | 0.042 |
| Heart failure | 329 (3.3%) | 29 (2.7%) | NR | <11 | 20 (2.6%) | NR |
| Chronic kidney disease | 582 (5.9%) | 50 (4.7%) | 0.053 | 32 (4.2%) | 34 (4.5%) | 0.012 |
| Obstructive sleep apnea | 2,105 (21.3%) | 248 (23.3%) | 0.048 | 191 (25.3%) | 181 (23.9%) | 0.032 |
| Depression | 1,868 (18.9%) | 196 (18.4%) | 0.012 | 152 (20.1%) | 146 (19.3%) | 0.020 |
| Anxiety | 2,607 (26.4%) | 281 (26.4%) | 0.001 | 193 (25.5%) | 208 (27.5%) | 0.045 |
| Gastroesophageal reflux | 1,781 (18.0%) | 180 (16.9%) | 0.029 | 123 (16.3%) | 130 (17.2%) | 0.024 |
| Gallbladder disease | 151 (1.5%) | 18 (1.7%) | 0.013 | 12 (1.6%) | 12 (1.6%) | 0.000 |
| Pancreatitis | 15 (0.2%) | <11 | NR | <11 | <11 | NR |
| Liver disease | 672 (6.8%) | 74 (6.9%) | 0.006 | 54 (7.1%) | 50 (6.6%) | 0.021 |
| Baseline clinical history | ||||||
| Days since last prior GLP-1 record | 260.9 (341.0) n=5,444 |
223.6 (325.1) n=689 |
0.112 | 219.9 (323.4) n=500 |
215.2 (312.9) n=499 |
0.014 |
| Days since last prior GLP-1 record: missing | 4,445 (44.9%) | 376 (35.3%) | 256 (33.9%) | 257 (34.0%) | ||
| Span of prior GLP-1 records, days | 27.5 (64.5) n=5,432 |
30.4 (60.9) n suppressed |
0.046 | 25.1 (53.6) n suppressed |
28.3 (56.1) n suppressed |
0.050 |
| Span of prior GLP-1 records, days: missing | 4,457 (45.1%) | Suppressed | Suppressed | Suppressed | ||
| Prior measured weight change, kg | -3.2 (6.4) n=644 |
-2.5 (5.3) n=95 |
0.111 | -1.9 (8.0) n=67 |
-2.5 (4.8) n=60 |
0.102 |
| Prior measured weight change, kg: missing | 9,245 (93.5%) | 970 (91.1%) | 689 (91.1%) | 696 (92.1%) | ||
| Days with prior-year diagnoses | 15.3 (14.7) n=9,889 |
16.9 (16.5) n=1,065 |
0.104 | 17.3 (15.7) n=756 |
17.2 (15.7) n=756 |
0.007 |
| Days with prior-year weights | 4.2 (4.9) n=9,889 |
4.0 (4.6) n=1,065 |
0.060 | 3.4 (3.8) n=756 |
3.6 (4.2) n=756 |
0.042 |
| No prior-year diagnosis records | 331 (3.3%) | 30 (2.8%) | 0.031 | 16 (2.1%) | 21 (2.8%) | 0.038 |
Table 2.
Physician agreement with clinical-note extraction. Each extraction task included 100 reviewed note-level outputs, balanced between 50 with and 50 without extracted events, with at most one note per patient within each task. Agreement accuracy is the percentage rated agree among adjudicable outputs; intervals are Wilson 95% CIs. Overall agreement was also standardized to event-positive prevalence in the complete extraction outputs. Component rows refer to the same reviewed outputs and must not be summed. These are physician agreement metrics, not sensitivity or specificity estimates.
Table 2.
Physician agreement with clinical-note extraction. Each extraction task included 100 reviewed note-level outputs, balanced between 50 with and 50 without extracted events, with at most one note per patient within each task. Agreement accuracy is the percentage rated agree among adjudicable outputs; intervals are Wilson 95% CIs. Overall agreement was also standardized to event-positive prevalence in the complete extraction outputs. Component rows refer to the same reviewed outputs and must not be summed. These are physician agreement metrics, not sensitivity or specificity estimates.
| Task or component | Agreement, % (95% CI) | Prevalence-standardized agreement, % |
| Overall agreement | ||
| Exposure history and treatment decisions | 97.0 (91.5-99.0) | 94.4 |
| Outcomes, adverse events and benefits | 92.0 (85.0-95.9) | 91.7 |
| Exposure history and treatment decisions: components | ||
| Drug and exposure state | 96.0 (90.2-98.4) | |
| Event presence | 98.0 (93.0-99.4) | |
| Evidence support | 100.0 (96.3-100.0) | |
| Reasons and treatment context | 99.0 (94.6-99.8) | |
| Route, dose and supply | 99.0 (94.6-99.8) | |
| Timing and sequence | 100.0 (96.3-100.0) | |
| Drug attribution | 97.0 (91.5-99.0) | |
| Event presence | 97.0 (91.5-99.0) | |
| Evidence support | 99.0 (94.6-99.8) | |
| Clinical finding classification (e.g. nausea, vomiting, constipation, appetite reduction) | 93.0 (86.3-96.6) | |
| Timing, status and severity | 95.0 (88.8-97.8) | |
| Treatment consequence | 99.0 (94.6-99.8) | |
Disclaimer/Publisher’s Note: The statements, opinions and data contained in all publications are solely those of the individual author(s) and contributor(s) and not of MDPI and/or the editor(s). MDPI and/or the editor(s) disclaim responsibility for any injury to people or property resulting from any ideas, methods, instructions or products referred to in the content. |
© 2026 by the authors. Licensee MDPI, Basel, Switzerland. This article is an open access article distributed under the terms and conditions of the Creative Commons Attribution (CC BY) license.
Copyright: This open access article is published under a Creative Commons CC BY 4.0 license, which permit the free download, distribution, and reuse, provided that the author and preprint are cited in any reuse.