Preprint
Article

This version is not peer-reviewed.

Mosquito Community Composition and Host Feeding Patterns in the Philippines Reveal Dominance of Culex quinquefasciatus and Predominant Chicken Blood Feeding

Submitted:

25 September 2026

Posted:

28 September 2026

You are already at the latest version

Abstract

Japanese encephalitis virus (JEV) is the leading cause of viral encephalitis in Southeast Asia and is thought to circulate between Culex mosquitoes, amplifying pig hosts, and ardeid birds, with humans acting as incidental dead-end hosts. However, multiple mosquito species may contribute to transmission, making community composition, abundance, and feeding behaviour important for understanding human exposure risk. This study investigated mosquito diversity, abundance, and blood feeding patterns across 24 sites in three Philippine provinces with a history of JEV cases. Mosquitoes were collected using CO₂-baited BG-Pro traps during five surveys between August 2024 and February 2026, and associations with environmental and host-density variables were assessed using generalised linear mixed-effects models. A total of 8,595 mosquitoes were collected, including 5,378 females representing eight genera and 13 species. Culex dominated collections (86.5%), with Culex quinquefasciatus the most abundant species. Mosquito abundance, diversity, and blood feeding activity were higher during the rainy season, while abundance increased with temperature and chicken density and diversity was greatest in high NDVI and low human dense environments. Genus-specific analyses showed overall abundance patterns were largely driven by Culex, whereas Aedes and Armigeres exhibited distinct environmental responses. Of 274 blood meals, 88.3% originated from chickens, primarily from Cx quinquefasciatus, highlighting the critical need to study the potential role of chickens in JEV ecology.

Keywords: 
;  ;  ;  ;  ;  

1. Introduction

Vector-borne diseases (VBDs) are reported to cause 17% of all human infectious disease cases and over 700,000 human deaths annually [1]. Most of these deaths are caused by diseases carried by mosquitoes. Each VBD will be carried by a specific species of mosquitoes, with some species capable to transmitting multiple pathogens of human health concern. The most medically important genera of mosquitoes are Culex, Aedes and Anopheles [2]. Anopheles mosquitoes are the primary vector of malaria, as well as being capable of transmitting some filariases and other arboviruses [3]. Aedes can transmit a myriad of arboviruses, and some species such as Aedes aegypti are the primary vector for dengue, chikungunya and zika viruses [4]. Culex are the primary vector of Japanese encephalitis virus (JEV), West Nile virus and some filariasis species [5]. However the role of each genus can change, as demonstrated in recent studies contradicting the previous theory that vertical transmission between Aedes species of rift-valley fever is the only major transmission cycle and instead implicating Culex genus mosquitoes [6]. Understanding which of these mosquitoes are present in a variety of ecological landscapes is important in understanding VBD risk to animals and humans. Differences in breeding preferences, host preference and environmental requirements can result in significant differences in mosquito communities spatially and temporally. Thus, understanding mosquito community composition is important to understand variation in VBD risk.
In the Philippines VBD burden is high, with the country reporting the highest recorded dengue cases globally in 2019 [7]. Arboviruses such as dengue, zika, chikungunya and JEV are all reported [8]. JEV is an endemic neglected tropical disease in the Philippines and causes 15% of all acute human encephalitis cases [9]. In the global context, JE burden is decreasing as vaccination increases, however in the Philippines JEV vaccination is only available privately and at great cost [10,11]. Reported cases to World Health Organization (WHO) were increasing in the lead up to vaccine deployment in 2019 [12]. However this improvement was negatively impacted by the COVID-19 pandemic as reporting relies on state sentinel hospital testing, with 153 cases reported in 2025 compared to a peak of 361 cases in 2017 [12]. Suspected cases are reported in all regions of the Philippines and historically the Central Luzon region reports the highest number of cases, followed by Ilocos and Cagayan Valley regions [9,13]. More recent analysis puts the highest incidence of JEV for Cagayan Valley, Ilocos, Cordillera Administrative Region (CAR), and Central Luzon (Region III) where reported clinical cases for under 15 years old are all greater than 2/100,000 [13]. In particular, CAR has been reporting increasing case numbers, particularly in the Mountain Region compared to historical records and is currently experiencing a JEV outbreak (14 -16). In a previous case study, investigators reported the lack of entomological evidence, as they did not identify the proposed primary vector Cx tritaeniorhynchus [15]. Despite a high case burden, the epidemiology of JEV in the Philippines is understudied. As climate change is expected to increase the environmental suitability for mosquitoes to thrive [17], most of the studies from the country are focussed on mapping environmentally suitability for Aedes albopictus and Ae aegypti and concurrent dengue risk (18 -20). Vectors belonging to the genera Culex are understudied in the Philippines and to our knowledge no studies have been carried out to evaluate different environmental factors impact on Culex.
Although Culex are identified as the principal vectors of JEV, the primary vectors species remains uncertain. A recent review found over 40 potential vector species which could transmit JEV or have JEV in their saliva following oral exposure [21]. Among these, Cx tritaeniorhynchus was most frequently detected as positive for JEV infection in the field and is generally regarded as the primary vector in much of Asia [21]. The next most commonly positive species were Cx vishnui, Cx gelidus, Cx fuscophela and Cx bitaniorhynchus [22]. Additionally, in the Philippines Cx tritaeniorhynchus is considered the primary vector of JEV, which is supported by three pools of Cx tritaeniorhynchus and one pool of Cx vishnui testing positive for JEV out of 61,974 trapped mosquitoes in two studies [23,24]. This demonstrates that Cx tritaeniorhynchus may indeed be the primary vector of JE [13,14] but also highlights the difficulty of capturing infected mosquitoes. The ability of a mosquito to act as a vector within an environment can be described by the mosquitoes vectoral capacity, which is the average number of infections which can distribute from a single infected case [25]. Multiple different factors can impact an mosquitoes vectoral capacity such as daily blood feeding rate, transmission rate among exposed mosquitoes, probability of daily survival and extrinsic incubation period [26]. For example, a high competent vector may not spread pathogens if they do not feed upon amplifying hosts regularly or if temperature is not sufficient for the virus to replicate within the mosquito [27]. Therefore, we must consider additional mosquito dynamics.
One such dynamic is the population density of mosquito species. In the Philippines, abundance studies frequently report, Cx vishnui as the most abundant species collected [23,28], whilst larval studies identify Cx fuscocephala, Cx vishnui and Cx quinquefasciatus as the most common species [28]. Similar patterns have reported elsewhere in Asia like in India, Cx vishnui is thought to be the primary vector of JEV [29] and in some Asian countries it is Cx gelidus [30]. These findings suggest that vector abundance as well as competence studies are important in determining individual mosquito species role in JEV transmission.
Given the low prevalence of JEV infection detected in mosquitoes in previous Philippine studies [23,24], investigating vector occurrence and abundance provides an alternative approach to understanding where competent vectors are most likely to occur and, consequently, where the risk of JEV transmission may be greatest. This has previously been demonstrated as important in JEV ecology, where human activities like rice farming can increase the abundance of JE vectors [31]. Therefore, understanding mosquito community and ecology are important to understand JEV risk. Climatic variables like temperature, rainfall and humidity are well known to impact survival and reproductive success of all mosquito species including Culex (31 -33). Seasonal variation frequently produces large fluctuations in mosquito populations, with rainy seasons often associated with increased availability of larval habitats and higher adult abundance [34,35], including for Culex vectors [36]. Landscape characteristics can also shape mosquito communities. Vegetation cover, commonly measured using the Normalised Difference Vegetation Index (NDVI), has been associated with mosquito diversity and habitat suitability, while human population density and urbanisation influence breeding opportunities, host availability and mosquito species composition [37]. Furthermore, agricultural activities, particularly rice cultivation and livestock production, have long been recognised as important drivers of JEV transmission by creating favourable conditions for both mosquito vectors and amplifying hosts (animals that produce sufficient viremia levels to infect additional mosquitoes) [38]. Although these relationships have been investigated in several countries such as India and Vietnam [36,39,40], relatively little is known about how environmental factors influence potential JEV vectors in the Philippines.
Whilst mosquito abundance is an important metric of potential vector for assessing the frequency of contact between mosquitoes and vertebrate hosts [41], alone it does not account for the number of species present or the relative contribution of individual species within a community [42]. Ecological diversity indices therefore offer an additional means of characterising mosquito populations. Measures such as Shannon diversity index, Simpsons Index and Pielou’s Evenness incorporate both the number of species and their relative abundances, allowing more comprehensive assessment of community structure [43,44,45]. Such metrics are particularly relevant in JEV systems, where multiple mosquito species may contribute to pathogen transmission.
Although mosquito abundance and diversity can help identify areas of elevated transmission risk, it is ultimately determined by interactions between vectors and hosts. Consequently, understanding mosquito host-feeding preferences is an important component of assessing transmission dynamics [41]. Field studies of mosquito communities and blood meal preferences can be used to better understand JEV transmission dynamics [46,47]. The last published field study on mosquito blood meals in the Philippines was 1934 and focused on Anopheles mosquitoes for malaria research [48]. Additional studies examined preferential trapping for animals versus human baited traps in 1997 on Anopheles mosquitoes for malaria research [49] and on Culex mosquitoes in 1993 for JEV research [28]. In this JEV study, it was found that Cx quinquefasciatus was mainly anthropophilic host seeking by comparing ratios of animal (pig and water buffalo (Bubalus bubalis Carabanesis)) versus human baited traps, whereas Cx vishnui preferred animal baited traps [28]. An updated understanding of JEV vectors’ host feeding preferences would inform current JEV transmission cycles in the Philippines.
This study aimed to understand the environmental and seasonal drivers of JEV vectors in the Philippines. In addition, it also aimed to describe Philippines mosquito species composition across multiple urban and rural sites and to describe the blood feeding histories of Culex mosquitoes. The study was located in Central Luzon (Region III) and Cordillera Administrative Region (CAR), as Region III has historically the largest JE incidence in the country and CAR reported increasing JE cases despite no cases occurring in the prior to 2015 [13,15]. To determine whether environmental and seasonal patterns differed among mosquito groups, analyses were conducted at both the overall community level and separately by mosquito genus. Finally, blood fed mosquitoes were screened to identify host blood sources and improve understanding of contemporary mosquito host-feeding preferences and their potential implications for JEV transmission.

2. Materials and Methods

2.1. Study Sites and Mosquito Trapping

A total of 15 recurring sites were chosen for mosquito trapping in Region III and CAR. The sites were chosen for their landscape variability and continued accessibility after consultation with local health workers. These were based in Zambales, Tarlac city and Baguio City provinces. Opportunistic sampling around these sites was also conducted, when requested by local counterparts or health workers and incorporated into the dataset. Recurring study sites were one of five different types, with a minimum of 1 site type at each municipality: i) Slaughterhouses for livestock (cattle or pigs), ii) Workplaces like rural health units and offices, iii) Garden Units which were private plots of land with no human dwellings (for example, private gardens or vegetable farms), iv) Residential which were homes with less than five livestock animals and v) Backyard Farms which were homes with >5 livestock animals. Additional sites were added to improve trapping in areas with low-human population densities due to the low number of trap nights, the majority of which were from the province of Tarlac (Figure 1).
At each site, two CO2 baited BG-Pro traps (Biogents AG, Regensburg, Germany) were deployed, one baited with yeast solution (200g of sugar was mixed with 10g of yeast and 500ml of warm water) and the other with bicarbonate soda and citric acid [50] as a source of CO2. For the latter traps, 500g of citric acid was mixed with 500ml of water and transferred to a saline drip bottle. The IV valve was set to drip at two drips/s into an 800ml plastic bottle filled with 250g of bicarbonate soda (Figure S1). Traps were deployed in the afternoon or evening and collected in the morning, however due to travel times, setup and collection times varied. The majority of traps were left for around 14 hours (15:00-07:00). Trapping was conducted across five fieldtrips, three during rainy season in August 2024 and August/October 2025 and two during dry season in February 2025 and 2026.

2.2. Mosquito Processing and Identification

Collected mosquitoes were immobilised by freezing (approximately 20 minutes)and sorted morphologically via a stereoscope using ID guides [51,52]. If the mosquito was blood fed, its abdominal contents were squashed onto Whatman™ 903 Proteinsaver Sample Collection Cards using individual pipette tips, to create dried blood spots (DBS). Specimens were stored at -20 °C at Central Luzon State University for later identification if it could not be done during the field trip.
DBS were stored at room temperature and analysed at the University of Glasgow to identify the source of their blood meals using conventional PCR methods later described.

2.3. Blood Meal Analysis

DNA was extracted from field-caught DBS using DNeasy® Blood and Tissue kit (Qiagen, Hilden, Germany) according to manufacturer instructions for animal tissues. DNA was eluted in 50µL water to increase final DNA concentration.
To identify mosquito blood meals Cytochrome c oxidase I (COI) universal vertebrate primers were used [53]. COI long primers (COI long-F: 5’-AACCACAAAGACATTGGCAC-3’ and COI long-R: 5’ AAGAATCAGAATARGTGTTG-3’) were used in a 25µl reaction with 12.5µl GoTaq® G2 Hot Start Master Mix (Promega), 0.5µM of each primer, and 1.5µL of template DNA. The thermal cycle was 95 °C for 1 minute, followed by 35 cycles at 95 °C for 30 seconds, 50 °C for 50 seconds and 72 °C for 1 minute and a final step at 74 °C for five minutes. After amplification, samples were run on a 1% agarose gel and the expected band size was 664bp. If samples amplified, there were cut out of the gel and purified using PureLink Quick Gel Extraction Kit, according to manufactures instructions (Life Technologies, Paisley, United Kingdom).
After PCR amplification, Sanger sequencing was outsourced to Eurofins Genomics (Eurofins Genomics Europe Shared Services GmbH). The obtained sequences were then compared to the NCBI nucleotide database using a Basic Local Alignment Search Tool (BLAST) search. Host species was assigned based on the highest percentage identity assigned to the sequence.

2.4. Environmental Variables

Temperature and humidity were recorded using Kestrel D2 data loggers (Kestrel® Instruments, Pennsylvania, United States) deployed at each site and attached to one of the traps, with measurements taken at hourly intervals from 14:00 to 09:00. Due to occasional logger malfunction or data loss, nightly environmental conditions were summarised by pooling measurements across all available loggers within a region. For each trapping night, mean temperature, minimum and maximum temperature and mean relative humidity were calculated and assigned to all traps operating during that night.
Spatial environmental variables were assigned at site level. A one kilometre radius buffer was drawn around the geographic coordinates of each trapping site as this was the typical dispersal range previously found for host-seeking Culex (majority remaining within 1km) [54]. Vegetation characteristics were quantified using the Normalised Difference Vegetation Index (NDVI), derived from MODIS satellite imagery accessed via the NASA AppEEARS platform [55]. As NDVI showed limited temporal variation across sampling seasons, a mean NDVI value calculated from monthly composites was used to characterise each site.
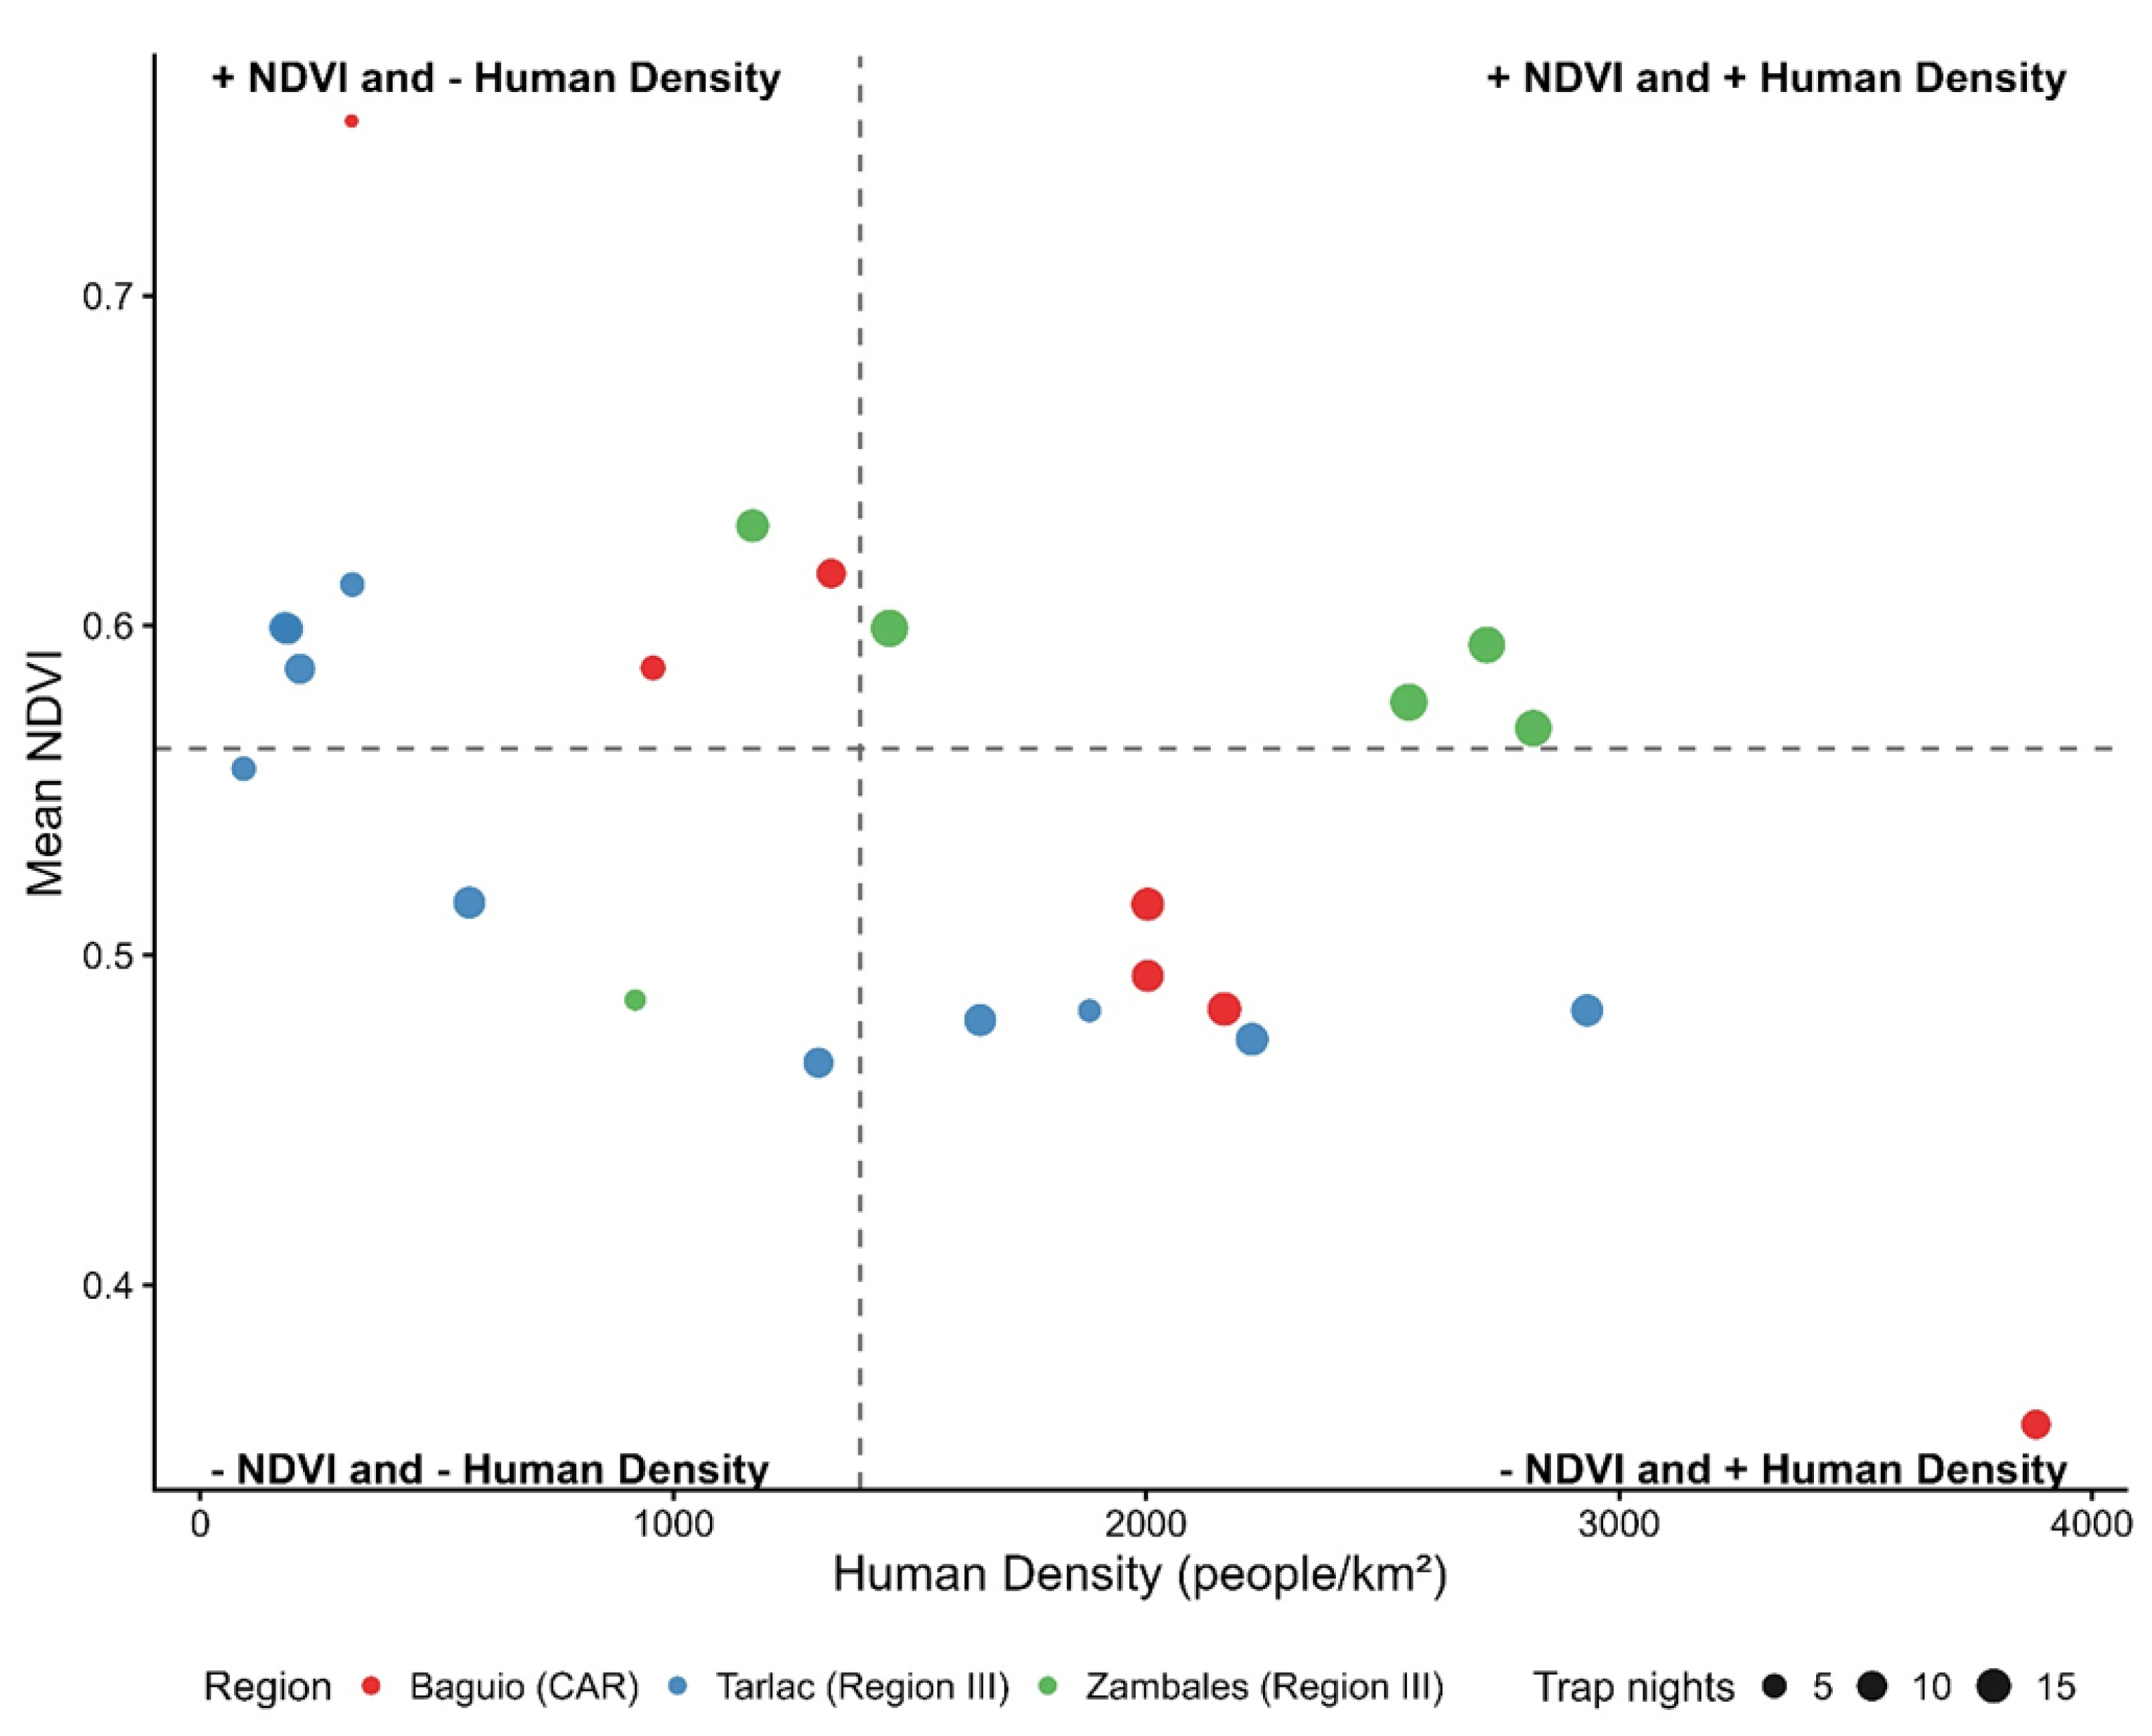
Human population density was extracted from the Global Human Settlement Layer within the same one km buffer. As methods to identify urban and rural areas vary widely across studies, here we group our sites into four urbanicity groups based on the median values of NDVI and human population density as shown in Figure 2: (1) high NDVI and low human density, (2) high NDVI and high human density, (3) low NDVI and low human density, and (4) low NDVI and high human density. Human population density and vegetation cover represent two key dimensions of urbanisation, the amount of green space available and degree of human development. Thus, combining these variables provides a simple and reproducible measure of urbanity. A similar method has been previously used in Uganda, where NDVI, household density, land cover and night-time brightness was used as a measure of urbanicity [56].
Pig and chicken densities were obtained from the latest Gridded Livestock of the World dataset produced by the Food and Agriculture Organization (FAO) and expressed as animals per square kilometre within each site buffer. Both datasets were from 2020 and have a resolution of 5 minutes of arc resolution (approximately 10km at the equator).
Only female mosquitoes were included in abundance and diversity indices analysis. Traps which failed (for example, battery or bait failure) were excluded from analysis. Mosquito abundance was defined as count of mosquitoes caught per trap. Specifically, it was calculated as the total number of mosquitoes for each successful trap deployment. As some sites had an additional trap placed, or a single trap failed, a sensitivity analysis was conducted to assess the robustness of any abundance models. Blood fed mosquitoes were the abundance (count) of mosquitoes caught that were blood fed from each trap.
For diversity indices, only data from traps with at least one female mosquito collected were used. Mosquito community diversity was quantified using three diversity indices calculated at the trap-night level using the ‘vegan’ package (version 2.7-2) in R (version 4.5.2). Three complimentary indices were calculated: 1) Simpson’s diversity index (Smithson and Verkuilen-corrected version) which quantifies community dominance and represents the probability that two randomly selected individuals belonged to different species. 2) Shannon’s diversity index which characterises overall diversity by incorporating both species richness and evenness. 3) Species evenness (Pielou’s evenness index) which measures how evenly individuals are distributed among species by dividing Shannon’s index by the natural logarithm of species richness.

2.5. Statistical Analysis

Generalised linear mixed effects models (GLMMs) were used to assess the effects of environmental variables on mosquito abundance and community diversity using R (version 4.5.2) with package glmmTMB (version 1.1.13). Diversity indices and mosquito abundance were analysed separately. Prior to model fitting, multicollinearity among environmental predictors was assessed using a two-step method; firstly, pairwise Pearson correlations were examined (Figure S2) and any variables with a pairing above 0.7 was excluded [57]. Secondly, to identify variables with multiple collinearity rather than only in pairs, variance inflation factors (VIF) were calculated for the remaining predictors, with variables of the highest VIF removed until all remaining were below seven [58].
A total of nine GLMMs were used, each with a different response variable. For diversity measures, four response variables were modelled: i) presence/absence of multiple species, ii) Simpson’s Diversity Index, iii) Shannon Diversity Index and iv) Pielou’s Evenness Index. Presence/absence was modelled using a binomial distribution, while conditional models were fitted using Gaussian distributions for Shannon diversity and Pielou’s evenness (Figure S3). As Simpson’s diversity index is confined between 0-1, conditional models for this index were fitted using beta-based distributions (Figure S3).
Four GLMMs were fitted to assess patterns in mosquito abundance: v) overall trap abundance, vi) trap abundance for Culex spp, vii) trap abundance for Aedes spp and vii) trap abundance for Armigeres spp. collections. These genera were chosen as they were the three most abundant genera and abundance was greater than 100. Negative Binomial GLMM was chosen for overall abundance as the data was right skewed but with a low proportion of zeroes (Figure S4). Genus-specific abundance was modelled using negative binomial GLMMs but where likelihood ratio tests indicated significant zero inflation, zero-inflated negative binomial models were fitted instead (Figure S4).
Most traps caught zero blood fed mosquitoes; therefore blood fed abundance was modelled using an ix) hurdle framework comprising a presence/absence component and a truncated negative binomial count component describing blood fed abundance conditional on at least one blood fed mosquito being present.
The explanatory variables considered in all models were season, NDVI-human density category (Figure 2), bait type, maximum temperature, minimum temperature, relative humidity, pig density and chicken density. Model selection was then performed on these full models in two steps: first to choose RE structure, models with both, one or no random effects were compared using Akaike’s Information Criterion (AIC), with the lowest AIC structure retained. Second, once the RE structure was determined, explanatory variables were evaluated using likelihood ratio tests (LRTs). The season and NDVI-human density category interaction was tested first by comparing models with and without the interaction term, which was retained if significant (p < 0.05). The remaining explanatory variables were then subjected to backward stepwise selection using LRTs, in short, nonsignificant terms were sequentially removed until only significant predictors remained in the final model. Model goodness diagnostics were also assessed throughout using the package DHARMa (version 0.4.7), including tests of residual uniformity, dispersion, and, where applicable, zero-inflation.

3. Results

3.1. Mosquito Trapping Observation

Total trapping effort comprised of 545 trap deployments across all regions, which captured a total of 8,595 mosquitoes (Table S1). 76 of these could not be identified to species levels due to degradation or damage to the body. Of the remaining 8,519 mosquitoes, 36.9% were male. These were excluded from further analysis, leaving 5,378 female mosquitoes. The majority of mosquitoes caught were of Culex genus (n=4,653) with an additional eight genus being caught (Aedes, Armigeres, Anopheles, Mansonia, Uranotaenia, Toxorhynchites, Hodgesia, Aedomyia). The total number of mosquitoes caught per field period is summarised in Table 1.
Across the three regions, most female mosquitoes were caught from Tarlac (n=3,171), then Zambales (n=1,919) and finally Baguio (n=288).
A total of 24 individual sites were trapped, with 15 sites returned to during each field collection (recurring sites). Table 2 shows the number of trapping nights and female mosquitoes caught per urbanicity category. Sampling effort was highest in sites characterized by low NDVI and high human density (89 trapping nights), followed by high NDVI and high human density sites (74 trapping nights), high NDVI and low human density (64 trap nights) and low NDVI and low human density (30 trap nights).
Baguio was the coldest province, with a mean temperature of 21.2 °C (range: 16.8-29.4 °C), followed by Tarlac (mean = 26.3 °C, range: 21.5-34.1 °C). Zambales was the warmest province, with a mean temperature of 27.3 °C (range: 23.0-34.7 °C). Relative humidity was highest in Baguio (mean = 89.1%), followed by Tarlac (81.9%) and Zambales (81.7%) (Figure S5). Mean chicken and pig densities showed little variation among sites and appear to be inversely related, with higher densities of one livestock type generally associated with lower densities of the other (Figure S6).
Prior to modelling, VIF analysis showed that elevation and mean temperature had high collinearity with other variables (Figure S2), therefore these were removed from all further analysis.
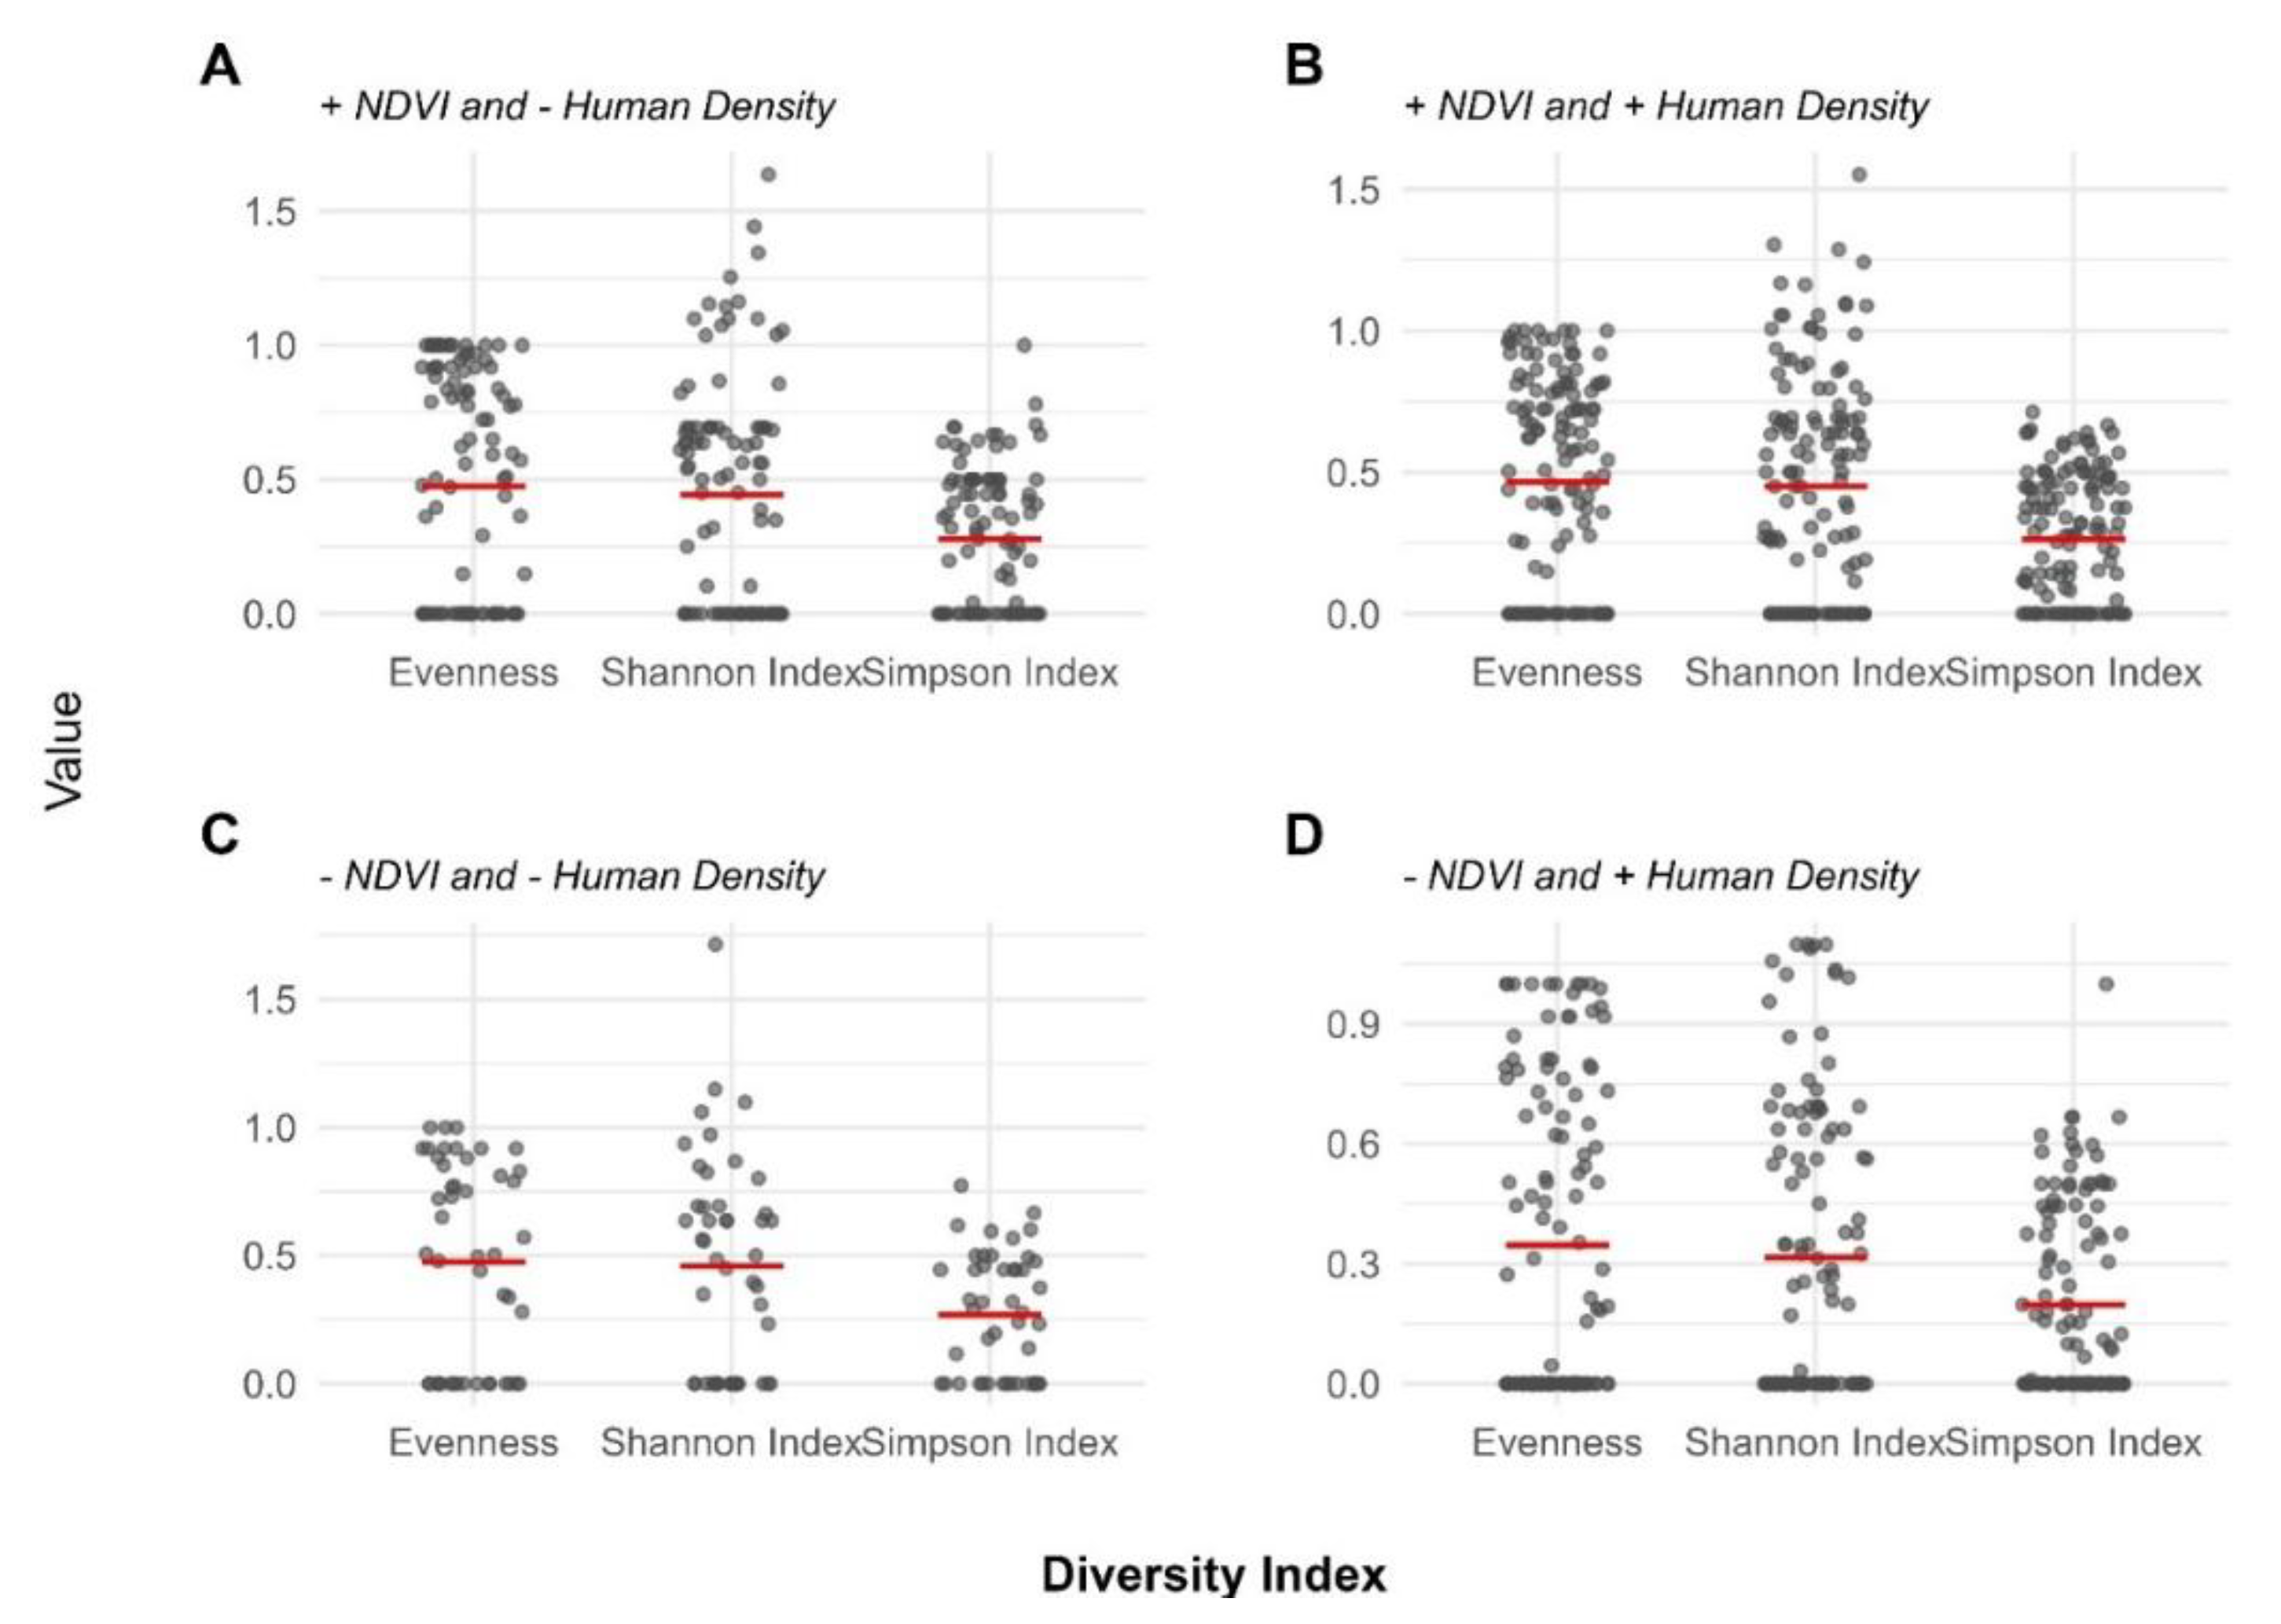
Eight different genus and 11 different species were identified morphologically. However, the number of times these genera were caught varied substantially. Only four genus were caught reliably multiple times, these being Anopheles, Culex, Armigeres and Aedes as shown in Table S1. In addition, many traps only caught one species, creating a disproportional number of zeroes in the diversity indices (Figure 3). Low NDVI and high human density sites had the lowest average diversity indices. However individual indices had high variation, and a lot of traps caught single species only, resulting in zero values.

3.2. Drivers of Mosquito Diversity

While the best-supported models for diversity indices (ii-iv) retained only urbanicity and season, the multispecies model (i) additionally retained bait type, maximum temperature, relative humidity, and chicken density (Table S2). There was no interaction between urbanicity and season, except in the evenness model (Table S2).
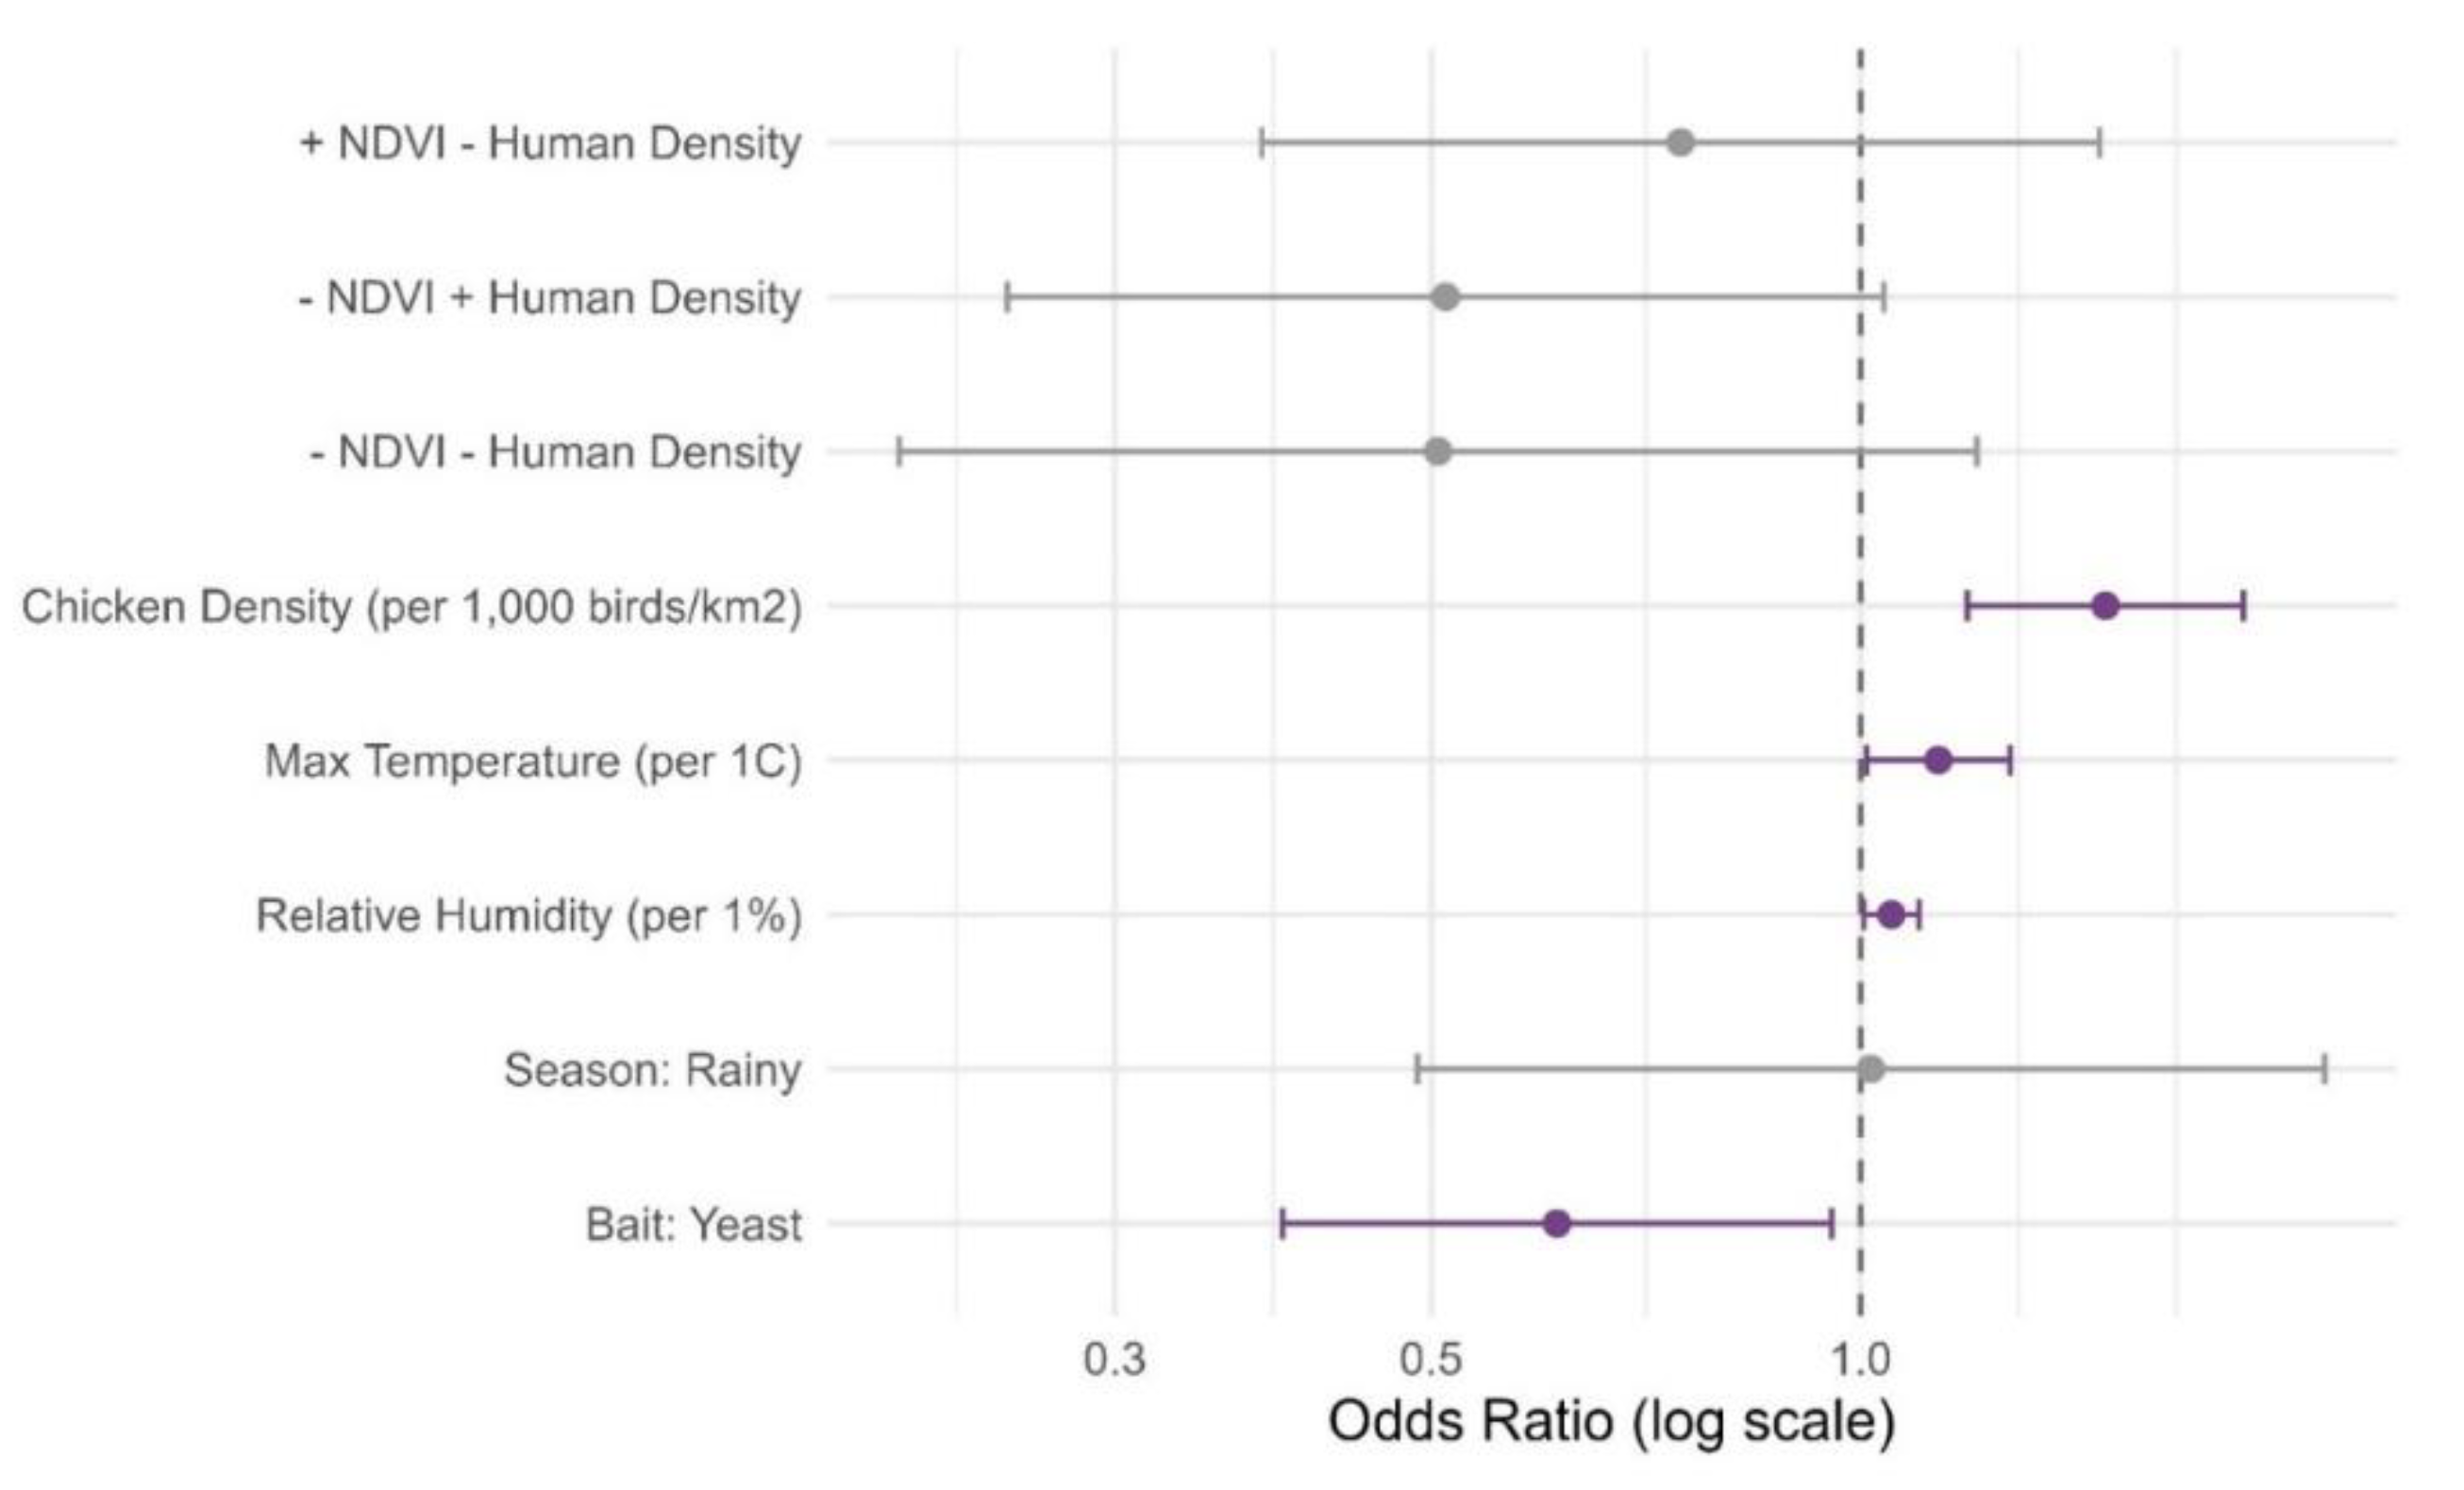
The multispecies model (i) revealed that the odds of capturing multiple mosquito species increased by 39% per 1,000 chickens/km² (OR = 1.39, 95% CI 1.09-1.78, p = 0.008), 15% per 1 °C increase in maximum temperature (OR = 1.15, 95% CI 1.03-1.28, p = 0.008), and 5% per 1% increase in relative humidity (OR = 1.05, 95% CI 1.01-1.09, p = 0.017) (Figure 4). Yeast baited traps were less likely to contain multiple species (OR = 0.62, 95% CI 0.40-0.96, p = 0.030) (Figure 4). Season was not significantly associated with multispecies occurrence. However, low NDVI and high human-density sites had significantly lower odds of multispecies occurrence than the high NDVI and high human-density reference category (OR = 0.50, p = 0.027).
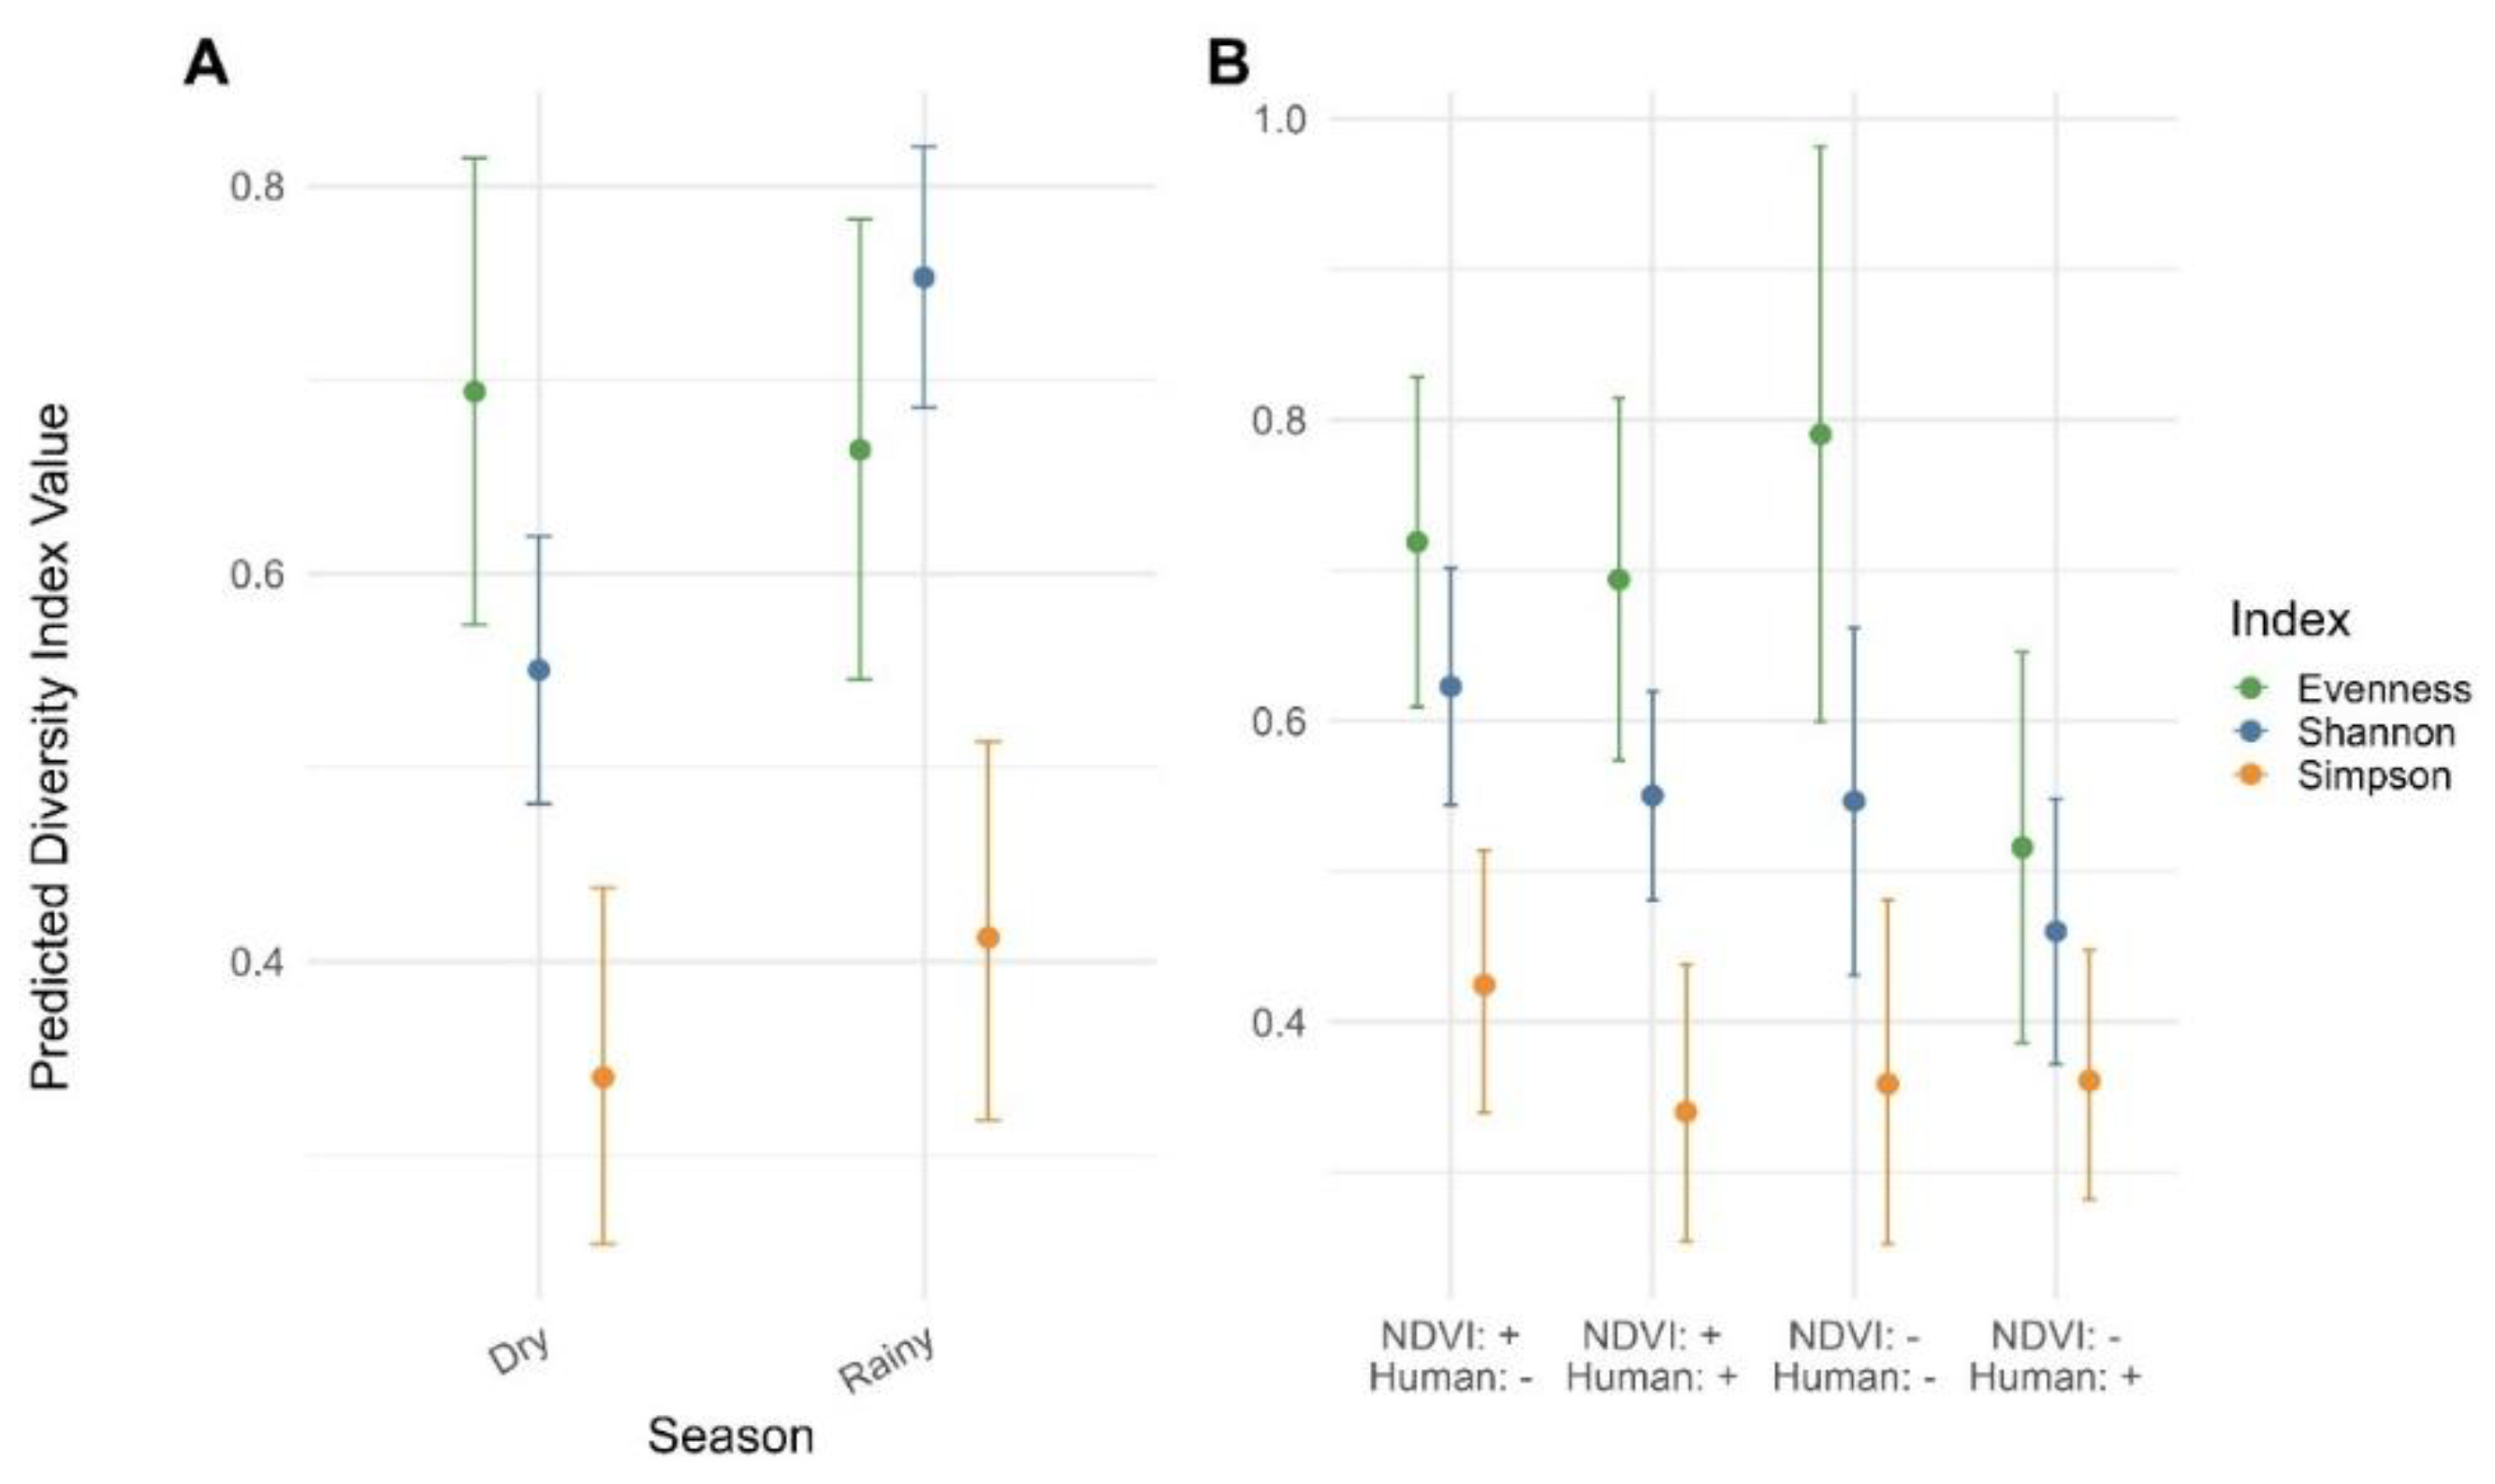
Among traps containing multiple species, both Simpson diversity (ii) and Shannon (iii) were higher during the rainy season. Shannon diversity increased by 0.20 units during the rainy season (β = 0.20, p < 0.001), while Simpson diversity also increased (β = 0.31, p = 0.003). Shannon diversity tended to be lower at low NDVI and high human density sites than at the reference sites with high NDVI and high human density, although this effect was only marginally significant (β = -0.09, p = 0.055) (Figure 5). As the only model retaining a season and urbanicity interaction, the evenness model (iv) indicated that rainy-season increases in evenness were strongest at high NDVI and low human-density sites (β = 0.19, p = 0.007) and low NDVI and high human-density sites (β = 0.31, p < 0.001). Together, these findings suggest that mosquito community structure varies across urbanicity gradients and seasons, with diversity and evenness generally increasing during the rainy season and tending to be lower in highly urbanised, low NDVI environments.

3.3. Divers of Mosquito Abundance

The final model of overall abundance (v) retained season, urbanicity, chicken density, as well as a season x urbanicity interaction. Site and night were included as random effects (Table S3).
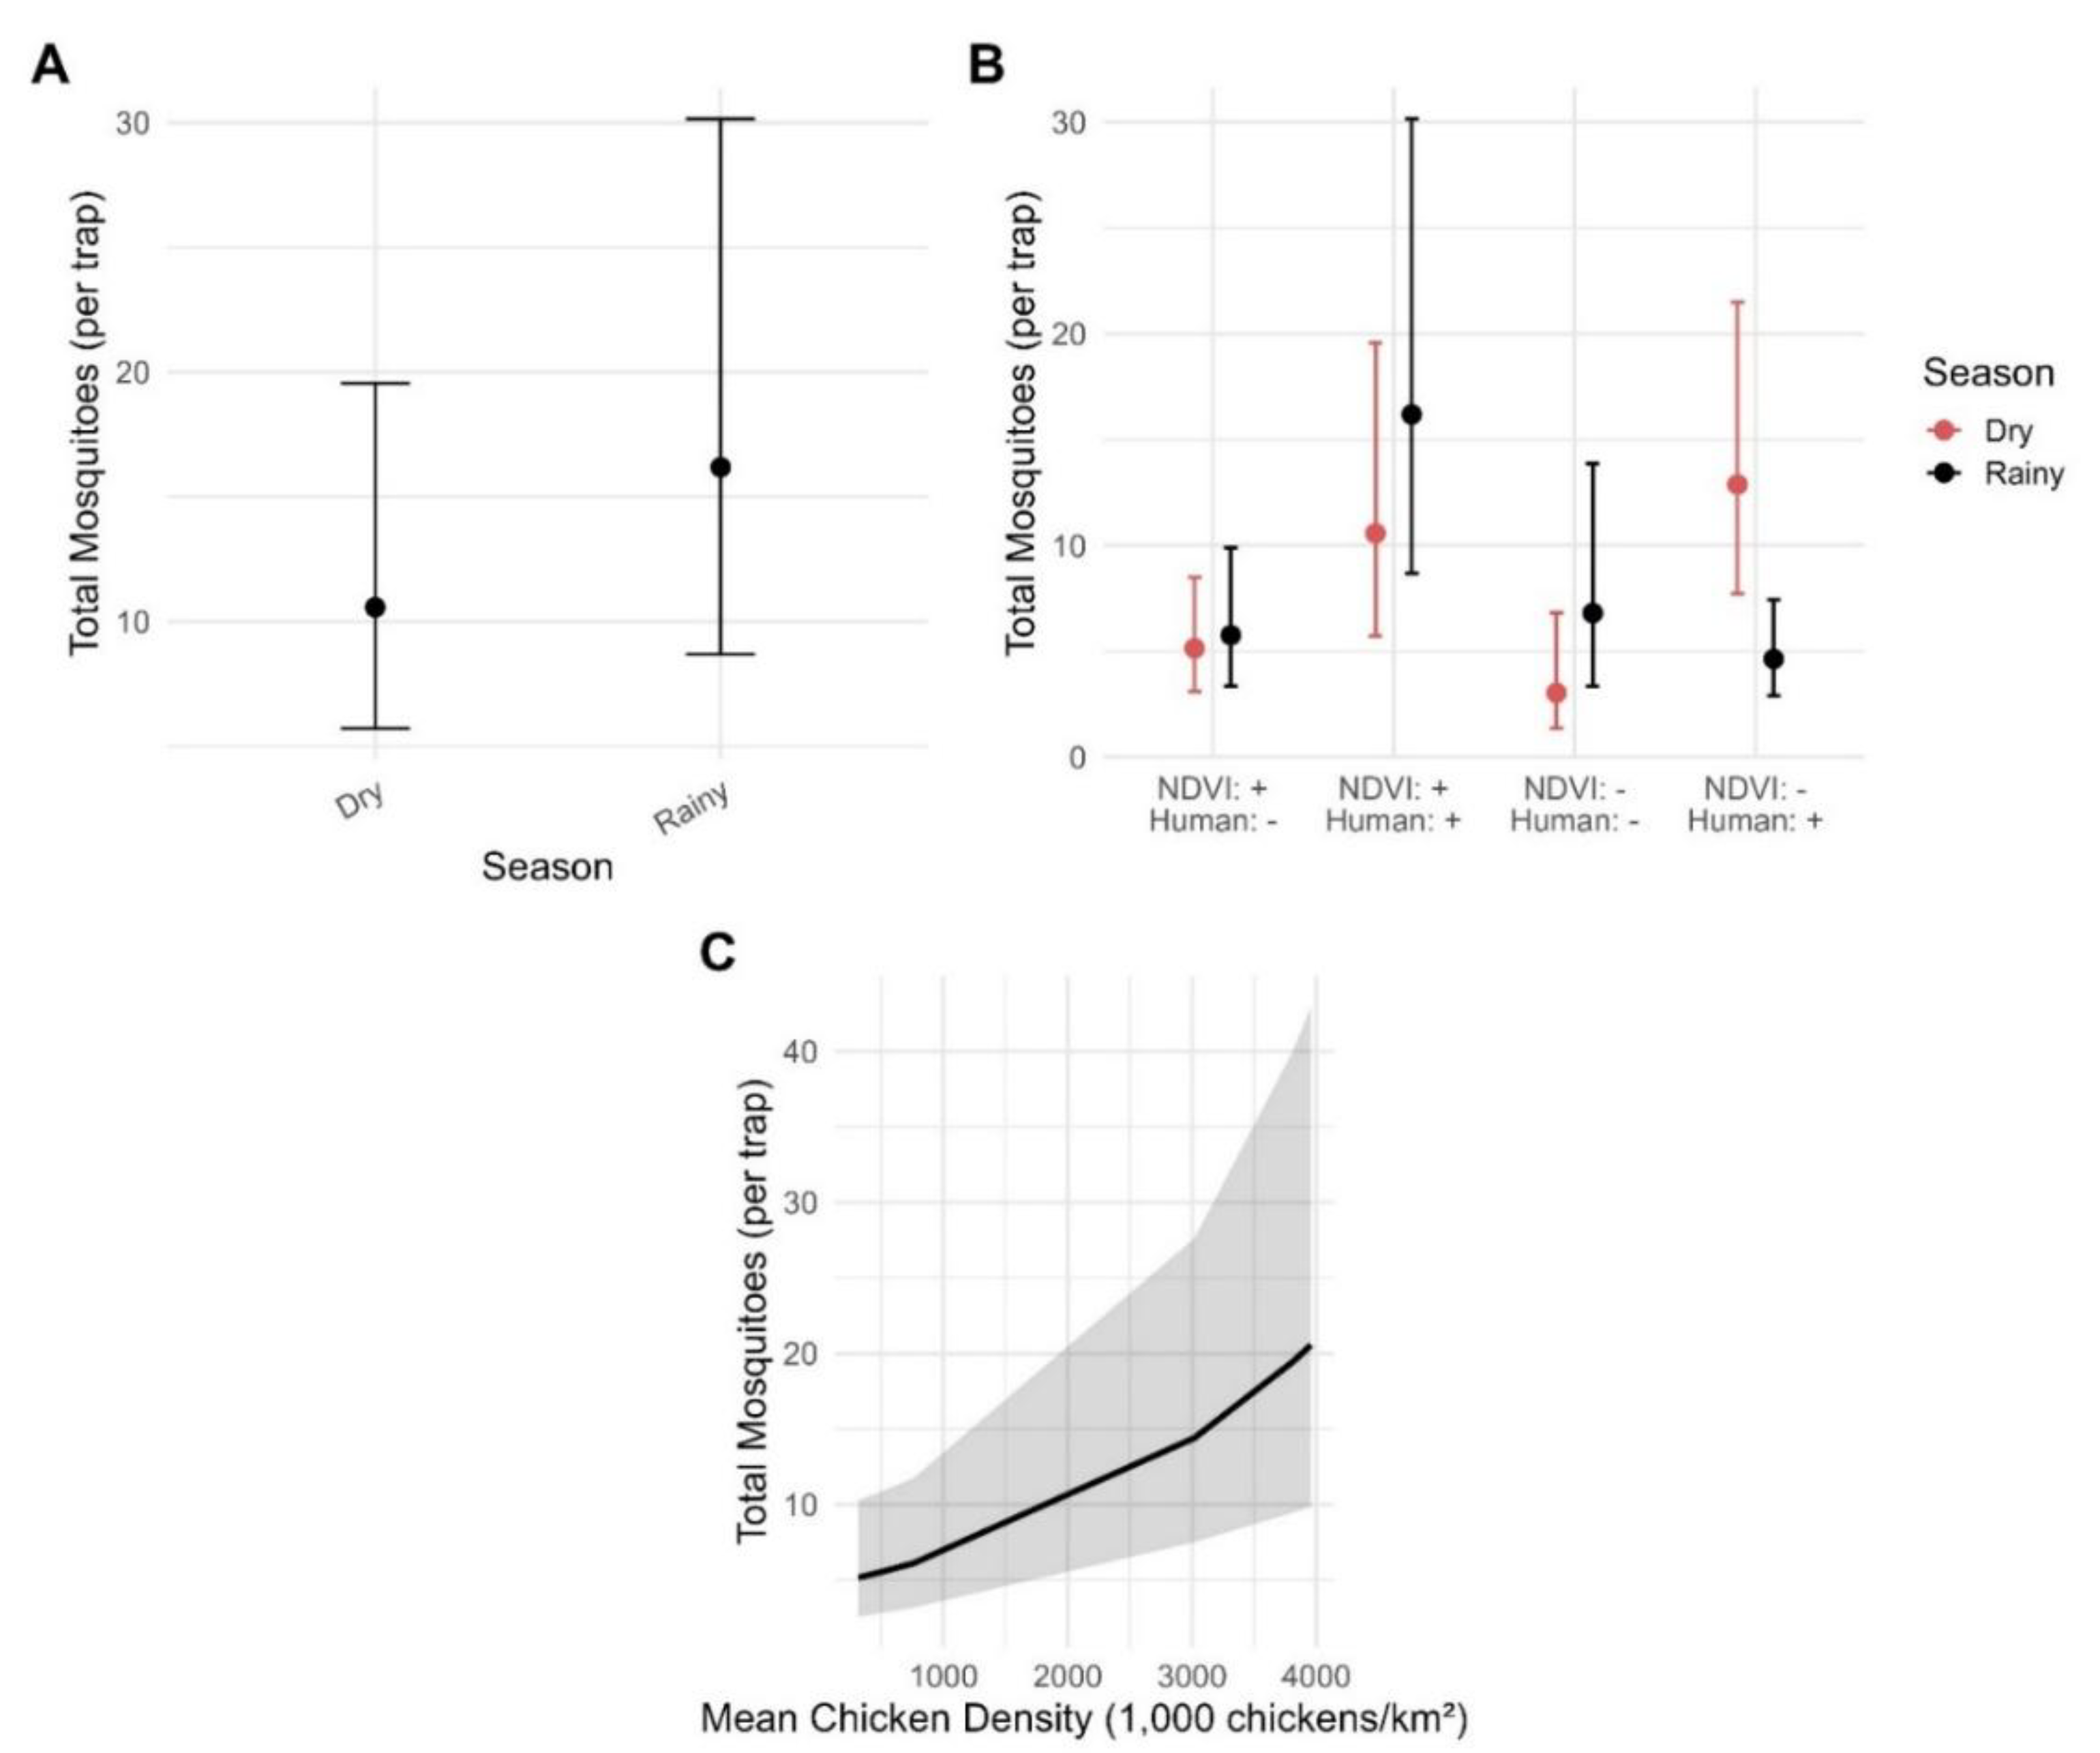
Mosquito abundance was significantly higher during the rainy season at the high NDVI and high human-density reference sites, increasing by 53% relative to the dry season (abundance ratio = 1.53, β = 0.43, p =0.021). Abundance also increased with chicken density, rising by approximately 46% per additional 1,000 chickens km⁻² (abundance ratio = 1.46, β = 0.00038, p < 0.001) (Figure 6). Compared with high NDVI and high human-density reference category, low NDVI and low human-density sites had 81% lower abundance (abundance ratio = 0.29, β = -1.25, p = 0.017).
A significant season and urbanicity interaction indicated that the effect of rainfall on abundance varied among urbanicity categories. Compared with the high NDVI and high human density reference sites, the rainy season increase in abundance was weaker at low NDVI and high human-density sites (abundance ratio = 0.24, β = -1.45, p < 0.001). No significant differences in seasonal response were observed at high NDVI and low human-density sites (β = -0.31, p = 0.282) or low NDVI and low human-density sites (β = 0.38, p = 0.351). Together, these findings suggest that mosquito abundance was greatest in areas with higher chicken densities, and that the influence of season varied according to local vegetation and human-density characteristics. This pattern indicates that urbanised environments may continue to support substantial mosquito populations, but that these communities become increasingly dominated by a smaller number of species.
The final abundance model identified positive associations between mosquito abundance and rainy season collections, high NDVI and high human density sites, and higher chicken density. To assess whether these relationships reflected changes across the entire mosquito community or were primarily driven by one genus, we subset the data per genus and reanalysed. Culex were the most commonly caught genus by a large margin (Table 3), accounting for 86.5% of the total number of female mosquitoes caught. As less than 100 Anopheles mosquitoes were caught this genus was not included in further testing. The dataset is heavily dominated by Culex mosquitoes thus genus-specific models for Aedes and Armigeres should therefore be interpreted cautiously.
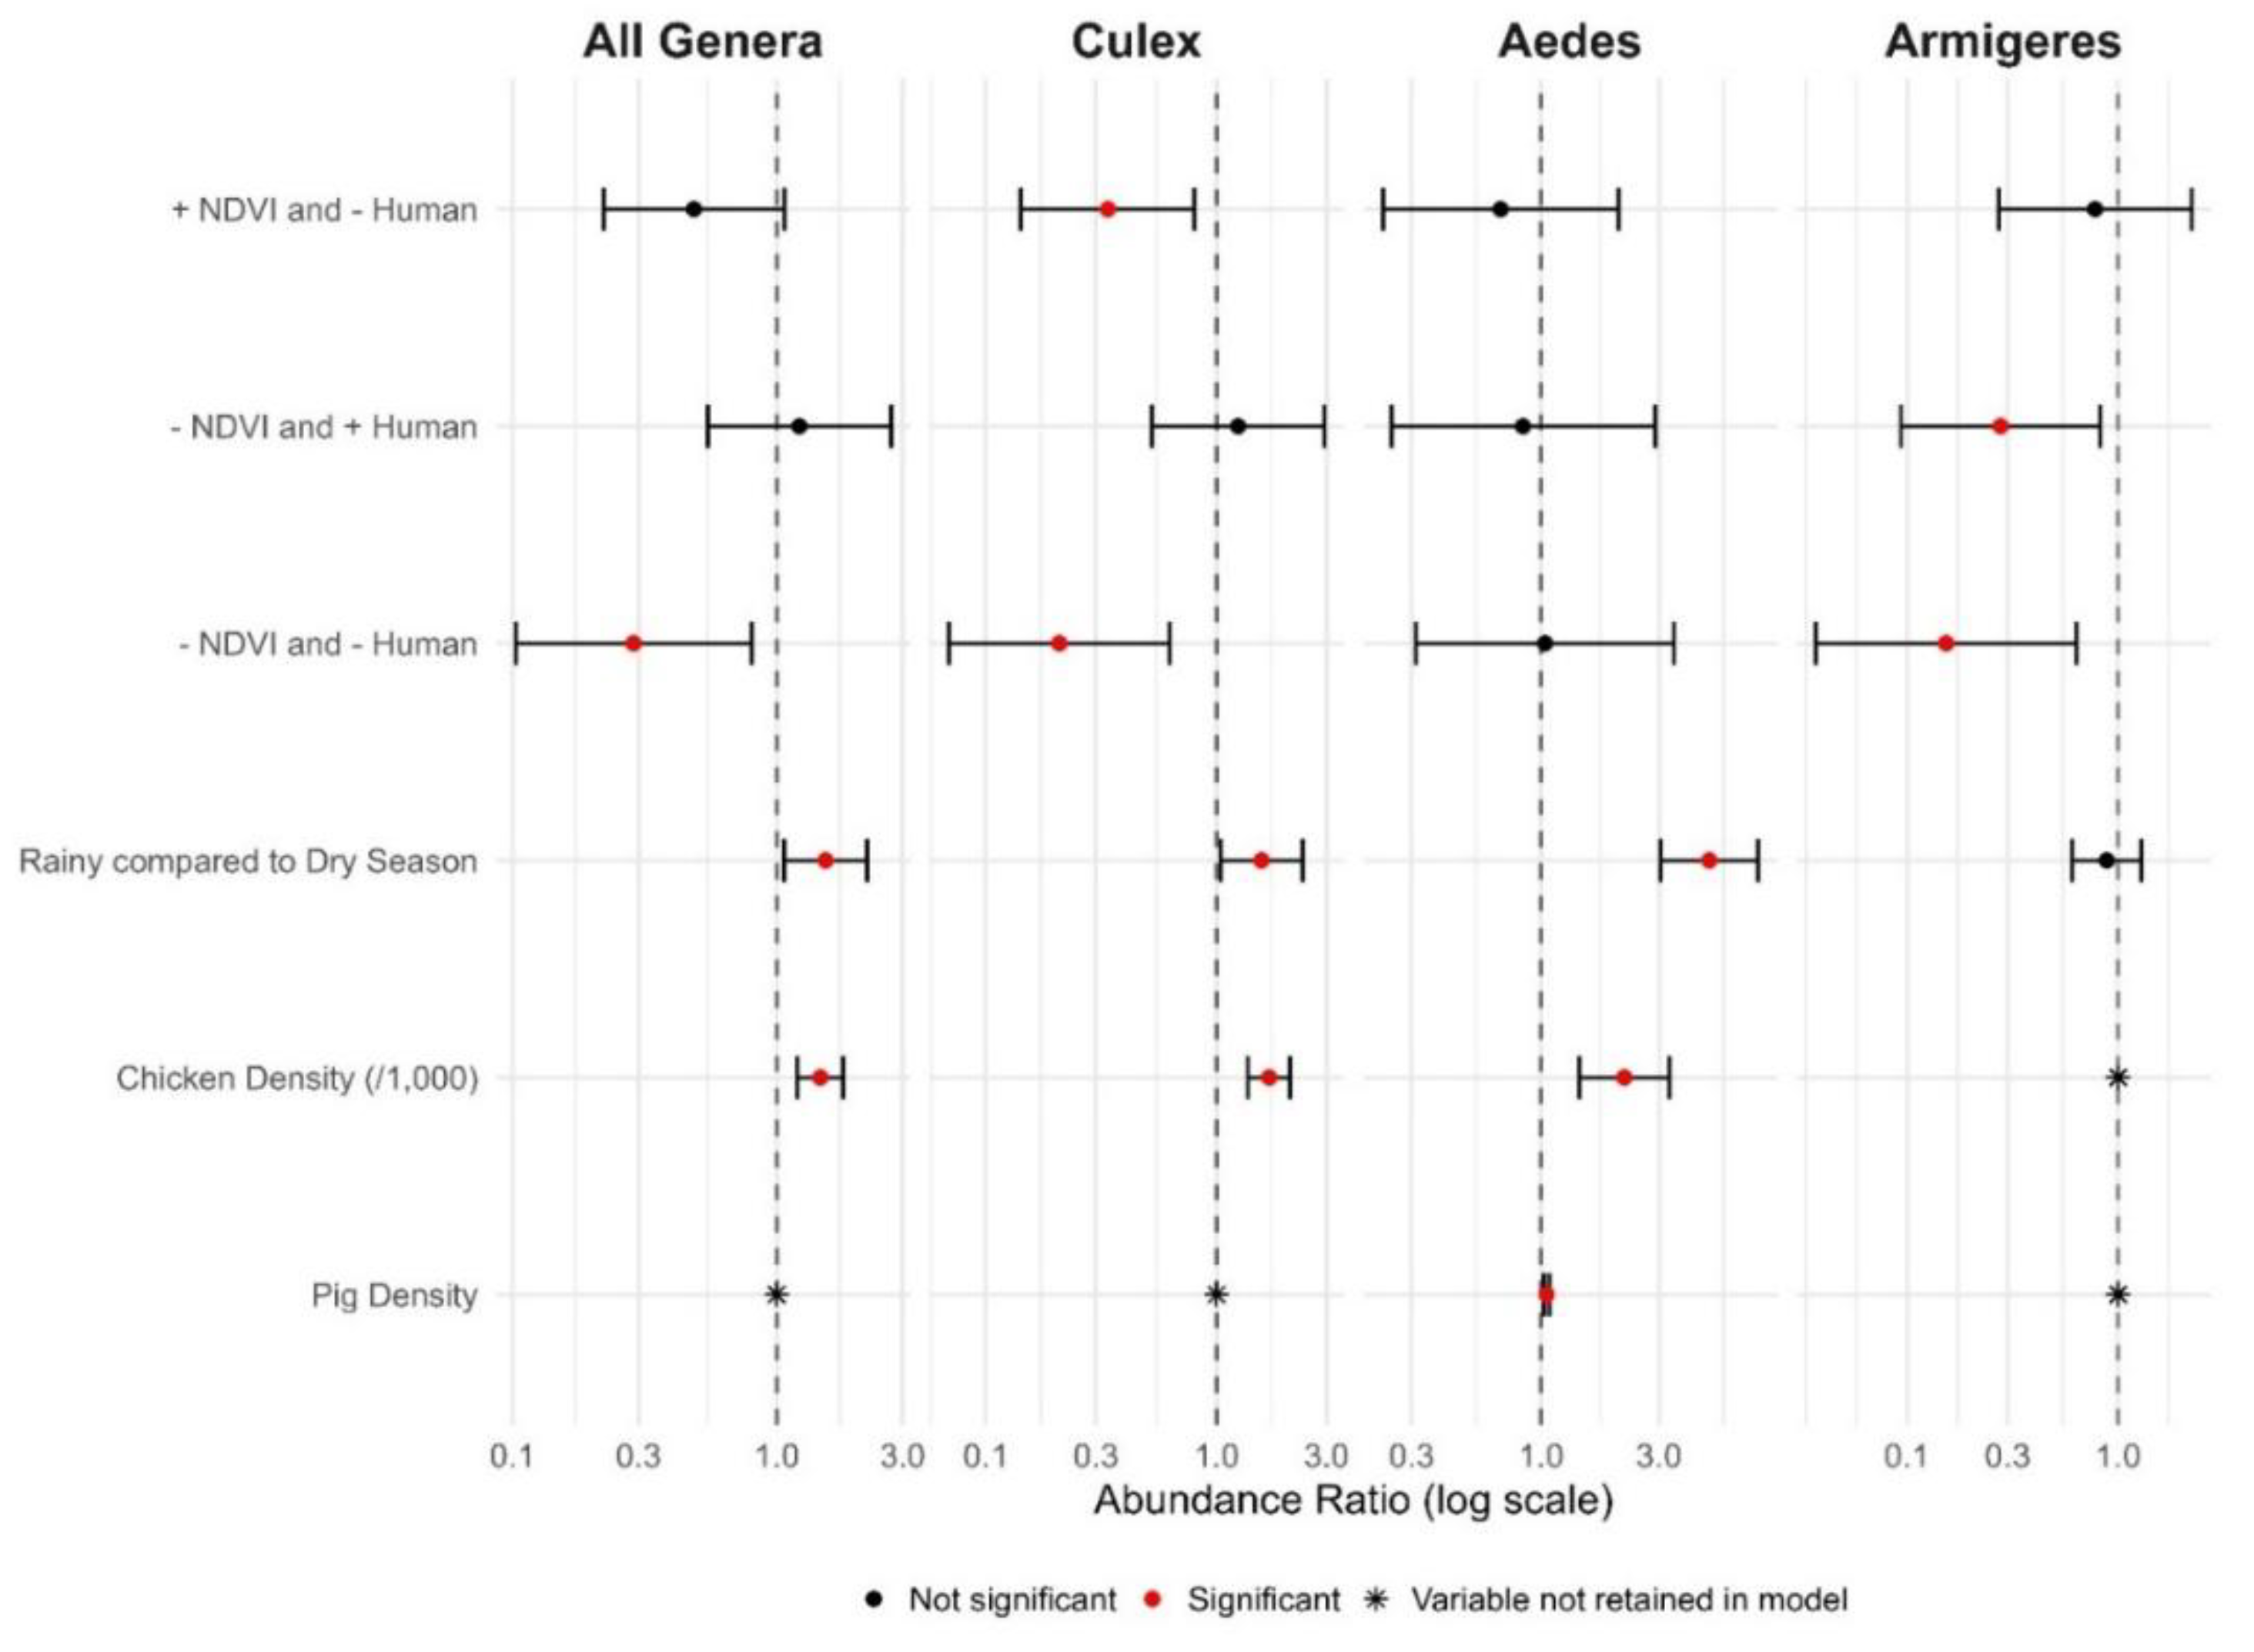
The abundance of each genus was tested in the following GLMM’s (Table S3). Firstly, all genus abundance values were found to differ significantly from each other (Figure 7). When each subset was tested, only Culex subset (vi) followed the pattern observed in the overall mosquito community abundance pattern. This pattern being; abundance increasing during the rainy season (abundance ratio = 1.68, β = 0.45, p = 0.032) and with increasing chicken density, with abundance increasing by approximately 43% per additional 1,000 chickens km⁻² (abundance ratio = 1.43, β = 0.00053, p < 0.001). In contrast, abundance was lower at low NDVI and low human-density sites than at the high NDVI and high human density reference sites (abundance ratio = 0.29, β = -1.57, p = 0.005). A significant season and urbanicity interaction indicated that rainy-season increases were substantially weaker at low NDVI and high human-density sites (β = -1.53, p < 0.001) (Figure 7).
In contrast, Armigeres abundance (vii) was not positively associated with chicken density or season. Instead, abundance was lower at both low NDVI and high human-density sites (β = -1.28, p = 0.020) and low NDVI and low human-density sites (β = -1.88, p = 0.009). Aedes abundance (viii) showed the strongest seasonal response, increasing during the rainy season (β = 1.57, p < 0.001), and was positively associated with both pig density (β = 0.054, p < 0.001) and chicken density (β = 0.00078, p < 0.001).
Overall, this indicates our previous overall abundance values are heavily influenced by Culex genus patterns. Despite this, Aedes and Armigeres still responded to some of the same environmental gradients, but their responses were weaker or qualitatively different, demonstrating substantial genus specific variation that was masked when all mosquitoes were analysed together.

3.4. Drivers of Mosquito Blood Feeding Behaviour

Of the 5,378 female mosquitoes caught, only 455 had taken a blood meal (8.7% of the total catch). 181 DBS could not be identified by PCR amplification and sequencing (39.8% of total DBS). This left 274 DBS for which the host blood meal was known. Of these the majority had fed on chickens (Gallus gallus) (n=242), followed by pigs (Sus scrofa) (n=15), humans (Homo sapiens) (n=9), dog (Canis lupus familiaris) (n=4), duck (Cairina moschata) (n=2), goat (Capra hircus) (n=1) and pigeon (Columba livia) (n=1). The vectors which had fed on chickens were Cx quinquefasciatus= 234, Cx vishnui=1 and Cx fuscocephala= 1. This was followed by human (Cx quinquefasciatus=4), pig (Cx vishnui=4, Cx quinquefasciatus=3), dog (Cx quinquefasciatus=4), duck (Cx quinquefasciatus=2), pigeon (Cx quinquefasciatus=1) and goat (Cx quinquefasciatus=1).
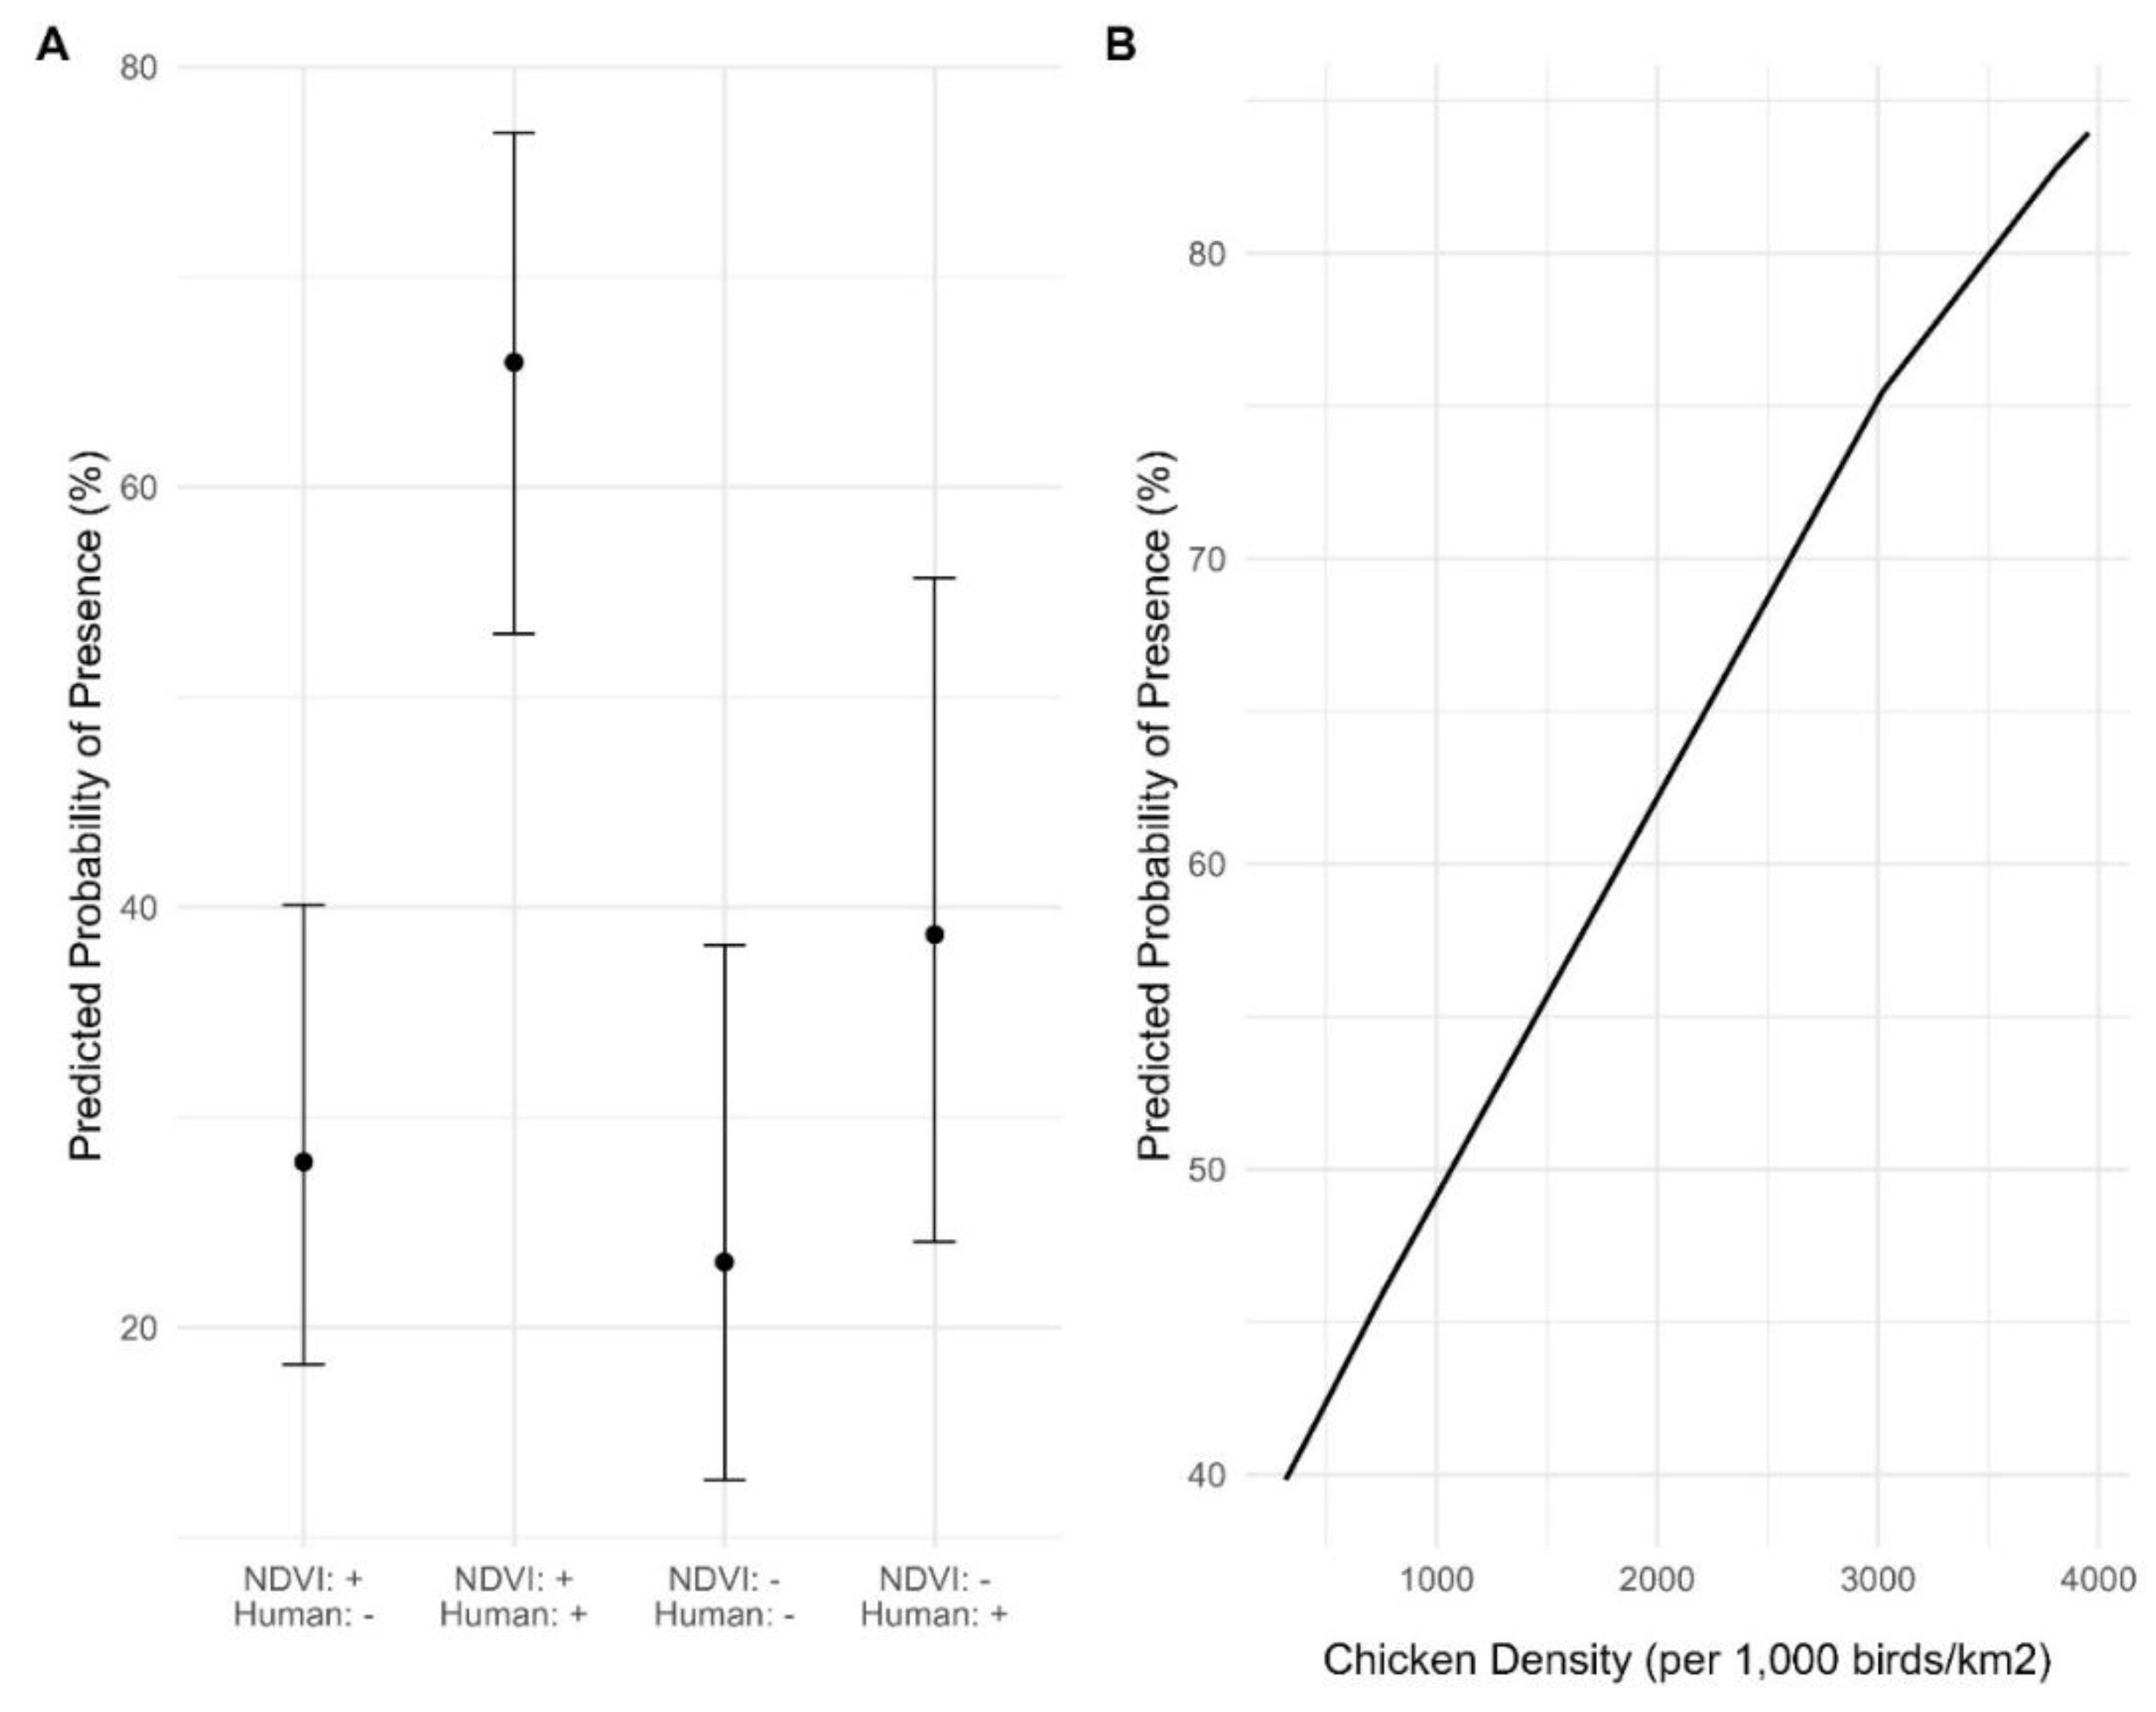
In the hurdle model (ix) the probability of detecting at least one blood fed mosquito was significantly impacted by only two variables, urbanicity and chicken density, whereas abundance was also associated with season, humidity, pig density and the interaction between season and urbanicity (Table S4). High NDVI and high human-density sites had the highest likelihood of catching blood fed mosquitoes being caught, with traps at high NDVI and low human-density sites being 80% less likely to contain a blood fed mosquito (OR = 0.20, β = -1.61, p < 0.001), low NDVI and high human-density sites were 67% less likely (OR = 0.33, β = -1.12, p = 0.003) and low NDVI and low human-density sites were 84% less likely (OR = 0.16, β = -1.86, p < 0.001) (Figure 8). Higher chicken density also increased the presence of blood fed mosquitoes with odds of presence increasing by 76% per additional 1,000 chickens km⁻² (OR = 1.76 for presence, β = -0.00057, p < 0.001) (Figure 8).
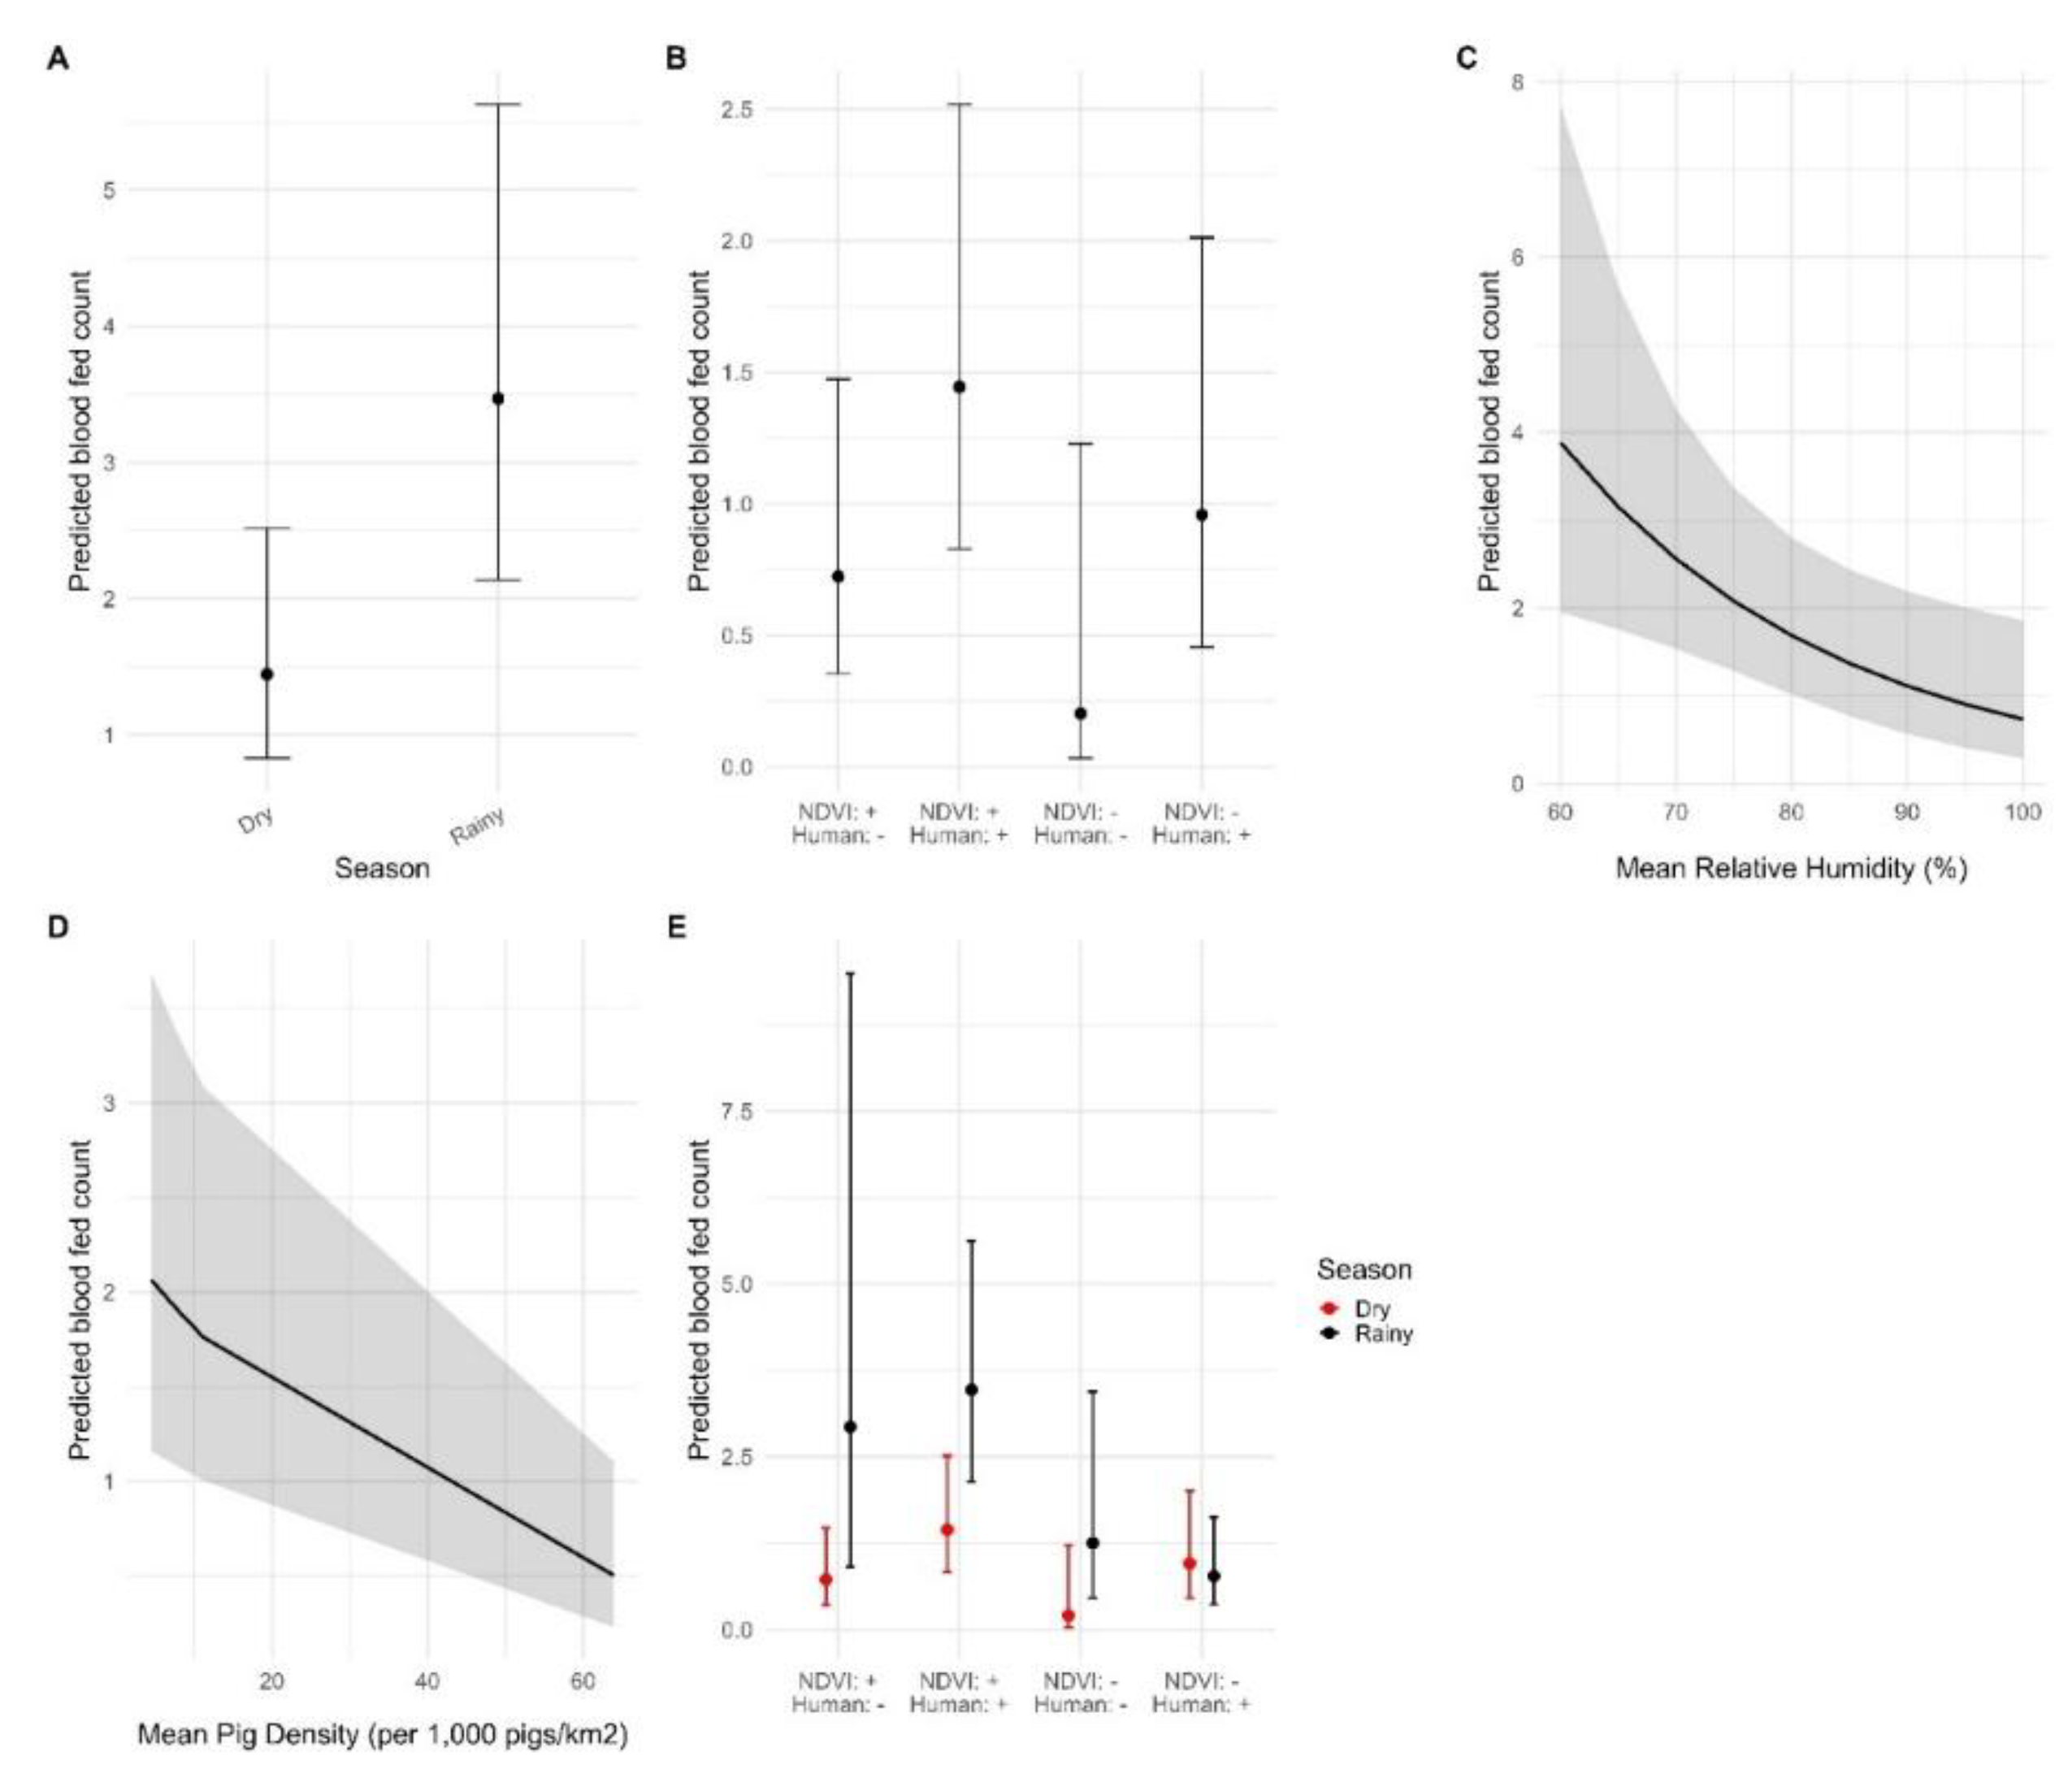
For traps which contained at least one blood fed mosquito, abundance of blood feds was higher during rainy season, increasing by 140% relative to the dry season (abundance ratio = 2.40, β = 0.88, p = 0.013). This abundance declined 4% for each 1% increase in relative humidity (abundance ratio = 0.96, β = -0.042, p = 0.011) and by 2% for each additional pig km⁻² (abundance ratio = 0.98, β = -0.024, p < 0.001) (Figure 9). Low NDVI and low human dense sites had the lowest abundance, with 86% fewer blood fed mosquitoes compared to high NDVI and high human sites (abundance ratio = 0.14, β = -1.96, p = 0.029). Again, season and urbanicity had a significant interaction with the rainy season increase in abundance weaker at low NDVI and high human-density sites (abundance ratio = 0.34, β = -1.09, p = 0.032). No other urbanicity and season interactions were observed.
Together these findings suggest that blood fed mosquitoes were more likely to be occur, and in greater numbers, during the rainy season and in highly vegetated sites with high human and chicken densities. In contrast, blood fed mosquitoes were less common and less abundant in low-NDVI environments, particularly where human density was low.

4. Discussion

Understanding mosquito community complexities and blood feeding behaviours can help infer disease transmission dynamics, and these are relatively unknown in the Philippines. This study of outdoor mosquito communities in the Philippines identified three key findings regarding mosquito ecology for Filipino JEV vectors: a) Cx quinquefasciatus was the most abundant vector across all sites and seasons, b) mosquito abundance was strongly associated with chicken abundance and chicken represented the predominant host choice for JE vector species; c) urbanicity impacted mosquito populations, increasing mosquito abundance but decreasing diversity indices.
The mosquito community composition observed in this study differs notably from that reported in several previous Philippine surveys. Most strikingly, Cx quinquefasciatus was the dominant species across study sites, irrespective of season or urbanicity, being caught in 23 out of 24 sites and comprising 48.9% of the total catch. This contrasts with studies conducted in agricultural settings, including San Jose, Tarlac, where Cx vishnui was reported as the most abundant species [23,28]. Likewise, numerous investigations of JEV ecology have identified Cx tritaeniorhynchus as the dominant vector in rice-growing regions and areas characterised by extensive livestock production, particularly pig farming [14]. The predominance of Cx quinquefasciatus and low numbers of traditionally recognised JEV vectors may reflect differences in trapping methods and sampling locations, particularly given that most collections were from residential and peri-urban environments rather than rice-growing areas. Previous studies used light, animal or human-baited trap rather than CO2 generation, with trap and bait types preferentially attracting different mosquito species [23,28]. Furthermore, many of the sampling sites in the present study were located near residential areas, workplaces and peri-urban settings rather than exclusively rice fields or intensive agricultural landscapes.
The presence of multiple medically important mosquito species further emphasises the public health relevance of these findings. Alongside the dominant Culex species, both dengue and filariasis primary vectors were detected (Aedes aegypti, Aedes albopictus and Armigeres species) [59]. However, this study found that the predominant mosquito genera was Culex, and caught multiple JEV vector species such as, Cx quinquefasciatus, Cx tritaeniorhynchus, Cx vishnui, Cx gelidus and Cx bitaeniorhynchus [22,60]. This demonstrates the widespread presence of competent arbovirus vectors throughout Region III and CAR. Importantly, Cx vishnui was second most abundance Culex species caught. This observation supports growing evidence that members of the Vishnui subgroup may contribute more substantially to local JEV transmission than historically recognised [22,61].
In our study, a total of 256 of identified DBS came from Culex JEV vectors. Of these the majority were Cx quinquefasciatus and had fed from chicken. This is also consistent with increased abundance overall being associated with increased chicken density, given the dominance of Cx quinquefasciatus in our traps. This result may reflect host availability, host preference or a combination and whilst not unexpected, the singularity in which Cx quinquefasciatus preferred chicken hosts was surprising, especially from sites like backyard farms where multiple host species were present. As previously described, JEV can be transmitted by multiple different hosts, therefore Culex biting preference can directly infer transmission dynamics. While these finding demonstrate extensive feeding on chickens, the contributions of chickens to JEV transmission in these study systems remains uncertain and requires further investigation. Previous laboratory research found chicks were capable of being amplifying hosts until 12 days of age and another found antibody against JEV in more chickens than pigs [62,63].As domestic chickens undergo a much faster growth cycle compared to pigs, this may increase suspectable individuals capable to furthering disease transmission.
However, the apparent preference of this species for chicken hosts is not consistent with a previous meta-analysis in the Indo-Malayan region, where the Philippines falls, in which Cx quinquefasciatus preferred mammal hosts [64]. The preference for Cx vishnui for pig hosts is supported by previous research in Cambodia [46]. Thus, an alternative hypothesis is that chicken density does not directly influence mosquito abundance, but instead reflects broader environmental and husbandry characteristics associated with poultry production, such as water availability, waste management, and habitat suitability, which favour mosquito populations [65]. Overall, the association between chicken density and blood fed mosquito occurrence further reinforces the importance of host availability in shaping mosquito ecology within regions at risk of VBD. Although pigs are traditionally considered the primary amplifying host of JEV, the overwhelming preference for chicken hosts observed in this study highlights the need for further research into the role of avian hosts on the transmission dynamics [66].
Across all models, urbanicity produced complex affects with sites characterised as low NDVI and high human density generally supporting higher mosquito abundances but lower community diversity. This suggests that urbanisation favours a smaller number of highly adaptable mosquito species such as Cx quinquefasciatus, whilst reducing overall diversity. These findings are also consistent with ecological flexibility of Cx quinquefasciatus, which is known to breed in both artificial and natural water sources and thrive in tropical and sub-tropical regions [67], previously survives colder temperatures in more urban environments [68] and has been previously found in more urban than rural sites [69,70]. However other studies from South-East Asia found contrasting results, such as more Culex mosquitoes in peri-urban areas [37,39]. Such findings align with global ecological pattern, that urbanisation of environments tends to reduce mosquito presence, diversity of species and promote dominance of adaptable species [71]. The opposite was reflected in blood feeding behaviour as blood fed mosquitoes were more commonly found in higher human-density sites with high NDVI. The mechanisms underlying this pattern remain unclear but may reflect differences in host availability, mosquito behaviour or trap performance across urban and rural environments. One theory is that as mosquitoes seek resting behaviour in tree branches, tree cavities and dense vegetation, blood fed mosquitoes are more specifically attracted to high NDVI sites [72,73].
Seasonal effects were also evident but depended on the degree of urbanisation. Mosquito abundance, diversity and blood feeding count increased during rainy season, consistent with previous research showcasing increased precipitation increases mosquito breeding habitats, causing population swells [33,74]. From a public health perspective, as higher mosquito densities increase the risk of contact between hosts and vectors, thus increasing risk of contracting vector-borne disease. In the Philippines Culex are main vectors for JEV and lymphatic filariasis [5,32]. As such, an increase in Culex numbers during rainy season like in our study is consistent with the observation of an increase in JEV cases in June/July [13]. However this contrasts other findings from South-East Asia, which found that increasing rainfall negatively impacted Culex larvae population abundance in urban areas, although it was attributed to reduced flight and increasing currents washing larvae downstream [75]. Collectively, these findings highlight the importance of considering both vegetation cover and human population density when evaluating mosquito populations within rapidly changing landscapes.
Several limitations should be considered when interpreting these results. First, sampling was conducted using BG-Pro traps which preferentially capture adult host-seeking mosquitoes and were only deployed nocturnally outdoors. Consequently, some mosquito groups may have been underrepresented, particularly species with different host-seeking behaviours or activity periods. This is likely reflected in the relatively low numbers of Aedes mosquitoes collected, which tend to be more active during the day and indoors [76,77]. Additionally, mosquitoes can differ in their response to CO2; for example a study found that of two closely-related Anopheles species, the more zoophilic species showed a stronger response to increasing CO2 release rates, suggesting that attraction to CO2 may vary according to host-feeding preferences [78]. Additionally yeast-baited traps have been shown to capture less Anopheles mosquitoes than cow-baited traps in Cambodia [79]. Subsequentially, as traps attracted host-seeking behaviour blood fed counts were low (only 8.7% of total catch had blood fed). This is common in vector studies, as after blood meals mosquitoes tend to rest and do not engage in host seeking behaviours, making them more difficult to trap. Using different trap types such as resting collections or gravid traps may increase this number [80]. Additionally in 39% of DBS, host species could not be identified. This could be due to a number of factors such as DNA degradation during the digestion process [81] or multi-host feeding which could interfere with Sanger sequencing [82]. Alternative methods for host identification could be mid-infrared spectroscopy [83], which analyses spectra patterns in blood rather than DNA. Consequently, blood meal analyses provided important ecological information but represent only a small subset of the total mosquito community. Second, environmental measurements were occasionally affected by logger malfunction and data loss. To address this issue, environmental variables were pooled at the regional-night level. While this allowed retention of trapping nights within the analysis, it reduced the ability to detect fine-scale environmental differences between sites. Similarly, remotely sensed estimates of NDVI, human density and livestock density may not fully capture local variation occurring within individual properties. Finally, sampling effort differed between urbanicity categories, with some site types contributing more trap nights than others. This should be considered when comparing mosquito community patterns across categories.

5. Conclusions

This study provides the most recent and comprehensive investigation of outdoor mosquito populations in Region III and the Cordillera Administrative Region of the Philippines (CAR). More than 8,000 mosquitoes were collected over four sampling periods, demonstrating the effectiveness of the trapping strategy for monitoring mosquito communities. Mosquito abundance, diversity and blood feeding activity were strongly influenced by seasonality, with rainy season conditions consistently increasing mosquito activity. Chicken density emerged as an important predictor of mosquito abundance, largely reflecting the overwhelming dominance of Cx quinquefasciatus and its affinity for avian hosts. Urbanicity also shaped mosquito communities, with highly urbanised sites supporting larger but less diverse mosquito populations.
Collectively, these findings highlight the ecological importance of rainfall, host availability and human landscape in determining mosquito population dynamics. They also demonstrate that Cx quinquefasciatus remains a dominant mosquito species across a wide range of environments in Region III and CAR. Continued surveillance of mosquito communities, particularly during the rainy season and within rapidly urbanising landscapes, will be essential for improving understanding of mosquito-borne disease risk in the Philippines. The dominance of chicken blood feeding the relation between abundance and chicken density raise important questions into the role of chickens and primary vectors in the epidemiology of JEV in the Philippines.

Supplementary Materials

The following supporting information can be downloaded at the website of this paper posted on Preprints.org.

Author Contributions

Conceptualization, ESJ, SC, FB, VJB, MV and MEM.; methodology, ESJ, SC, FB, VJB, MV and MEM.; data curation, ESJ, TAL, BA, MRT, CLZ, JF, SK AND MEM.; writing—original draft preparation, ESJ.; writing—review and editing, ESJ, TAL, SC, FB, VJB, MV and MEM.; supervision, SC, FB, VJB, MV and MEM.; funding acquisition ESJ, TAL, SC, FB, VJB, MV and MEM. All authors have read and agreed to the published version of the manuscript.

Funding

This work was funded by the University of Glasgow Integrated Infection Biology Programme from the Wellcome Trust (218518/Z/19/Z), University of Sydney-University of Glasgow Ignition Fund and the Sydney Southeast Asia Centre Collaborative Research Grant. FB was funded by Academy Medical Science Springboard Award [ref: SBF007\100094]. MV was supported by the European Research Council under the European Union’s Horizon 2020 Research and Innovation Programme (grant agreement no. 852957).

Institutional Review Board Statement

Not applicable.

Data Availability Statement

Please contact corresponding author.

Acknowledgments

We are grateful to the Philippines Department of Health and Royal Institute of Tropical Medicine and Hygiene for their continued disease surveillance efforts and support for our field collections. We wish to especially thank Sir Alexander Baday and Dr Celia Brillantes. We thank the FETPAFI administrative team for their continued support in our field collections in the Philippines. Lastly, we thank the local people of Baguio, Zambales and Tarlac who warmly welcomed us during our fieldwork.

Conflicts of Interest

The authors declare no conflicts of interest.

Abbreviations

The following abbreviations are used in this manuscript:
JEV Japanese encephalitis virus
VBD Vector-borne disease(s)
NDVI Normalised difference vegetation index
DBS Dried bloodspots
GLMM General linear mixed model
LRT Likelihood ratio test
AIC Akaike’s information criterion
VIF Variance inflation factor
OR Odds ratio
PCR Polymerase chain reaction
CO1 Cytochrome c Oxidase Subunit 1
CAR Cordillera Administrative Region

References

  1. WHO; World Health Organization. Vector-Borne Diseases. Available online: https://www.who.int/news-room/fact-sheets/detail/vector-borne-diseases (accessed on 13 May 2025).
  2. Zhang, Y.; Wang, M.; Huang, M.; Zhao, J. Innovative Strategies and Challenges Mosquito-Borne Disease Control amidst Climate Change. Front Microbiol. 2024, 15, 1488106. [Google Scholar] [CrossRef]
  3. Service, M.W.; Townson, H. The Anopheles Vector. In Essential Malariology, 4Ed ed; CRC Press, 2002. [Google Scholar]
  4. Wei, Y.-L.; Wu, Z.; Li, R.-L.; Tang, F. Review of Selected Mosquito-Borne Diseases: Arboviruses (Dengue, Chikungunya, Zika, West Nile, Japanese Encephalitis, Yellow Fever) and Parasitic Diseases (Malaria, Lymphatic Filariasis). Front Public Health 13 1712094. [CrossRef]
  5. Madhav, M.; Blasdell, K.R.; Trewin, B.; Paradkar, P.N.; López-Denman, A.J. Culex-Transmitted Diseases: Mechanisms, Impact, and Future Control Strategies Using Wolbachia. Viruses 2024, 16, 1134. [Google Scholar] [CrossRef]
  6. Andrews, C.; Longbottom, J.; Lutomiah, J.; Lord, J.S. Field Studies of Culex Mosquitoes in Tanzania and Kenya: A Systematic Review Motivated by Changing Rift Valley Fever Virus Transmission Patterns. Med. Vet. Entomol. 2025, 39, 689–700. [Google Scholar] [CrossRef]
  7. Cabral, L.K.D.; Salmos, J.R.R.; Aman, A.Y.C.L.; Salvoza, N.C.; Banson, C.J.G.C.; De Leon, J.C.M.; Balaoeg, L.E.B.; Alonzo-Dimamay, M.T.; Calpito, K.J.A.C. Biobanking of Vector-Borne Viruses in the Philippines: Basic Principles, Best Practices, and Challenges. Sci. Rep. 2026, 16, 16075. [Google Scholar] [CrossRef]
  8. NaTHNaC - Philippines. Available online: https://travelhealthpro.org.uk/country/178/philippines#Vaccine_Recommendations (accessed on 10 July 2026).
  9. Montemayor, T. DOH Introduces Vaccine vs. Japanese Encephalitis. Available online: https://www.pna.gov.ph/index.php/articles/1064981 (accessed on 31 October 2022).
  10. Moore, S.M. The Current Burden of Japanese Encephalitis and the Estimated Impacts of Vaccination: Combining Estimates of the Spatial Distribution and Transmission Intensity of a Zoonotic Pathogen. PLoS Neglected Trop. Dis. 2021, 15, e0009385. [Google Scholar] [CrossRef]
  11. Vodicka, E.; Zimmermann, M.; Lopez, A.L.; Silva, M.W.; Gorgolon, L.; Kohei, T.; Mooney, J.; Muhib, F.; Pecenka, C.; Marfin, A.A. Japanese Encephalitis Vaccination in the Philippines: A Cost-Effectiveness Analysis Comparing Alternative Delivery Strategies. Vaccine 2020, 38, 2833–2840. [Google Scholar] [CrossRef]
  12. WHO; World Health Organization. Japanese Encephalitis (JE) Reported Cases and Incidence. Available online: https://immunizationdata.who.int/global/wiise-detail-page (accessed on 10 July 2026).
  13. Lopez, A.L.; Raguindin, P.F.; Aldaba, J.G.; Avelino, F.; Sy, A.K.; Heffelfinger, J.D.; Silva, M.W.T. Epidemiology of Japanese Encephalitis in the Philippines Prior to Routine Immunization. Int. J. Infect. Dis. 2021, 102, 344–351. [Google Scholar] [CrossRef]
  14. Lopez, A.L.; Aldaba, J.G.; Jr, V.G.R.; Iii, A.O.T.; Sy, A.K.; Espino, F.E.; DeQuiroz-Castro, M.; Jee, Y.; Ducusin, M.J.; Fox, K.K. Epidemiology of Japanese Encephalitis in the Philippines: A Systematic Review. PLoS Neglected Trop. Dis. 2015, 9, e0003630. [Google Scholar] [CrossRef]
  15. Mapangdol, F.S.; Ventura, R.J.C.; Blanco, M.Z.C.; Racelis-Andrada, S.; Pamintuan, R.P.; Magpantay, R.L.; Lonogan, K.B. A Case Report of Japanese Encephalitis in Paracelis, Mountain Province, the Philippines. West. Pac. Surveill. Response J. 2024, 15, 1–6. [Google Scholar] [CrossRef]
  16. Taguba, V.J.L. PHO Calls for Heightened Vigilance amid Japanese Encephalitis Cases in Bontoc. In Philippine Information Agency; 2026. [Google Scholar]
  17. Hou, W.; Zhou, Y.; Luo, W.; Wang, L.; Kwan, M.-P.; Cook, A.R. Mapping Environmental Suitability Changes for Arbovirus Mosquitoes in Southeast Asia: 1960–2020. iScience 2024, 27. [Google Scholar] [CrossRef]
  18. Cruz, E.I.; Salazar, F.V.; Aguila, A.M.A.; Villaruel-Jagmis, M.V.; Ramos, J.; Paul, R.E. Current and Lagged Associations of Meteorological Variables and Aedes Mosquito Indices with Dengue Incidence in the Philippines. PLoS Neglected Trop. Dis. 2024, 18, e0011603. [Google Scholar] [CrossRef]
  19. Edillo, F.; Ymbong, R.R.; Bolneo, A.A.; Hernandez, R.J.; Fuentes, B.L.; Cortes, G.; Cabrera, J.; Lazaro, J.E.; Sakuntabhai, A. Temperature, Season, and Latitude Influence Development-Related Phenotypes of Philippine Aedes Aegypti (Linnaeus): Implications for Dengue Control amidst Global Warming. Parasites Vectors 2022, 15, 74. [Google Scholar] [CrossRef]
  20. Hu, W. Characterising the Spatial Dynamics of Sympatric Aedes Aegypti and Aedes Albopictus. Populations in the Philippines. Available online: https://eprints.qut.edu.au/71872/ (accessed on 10 July 2026).
  21. Edache, S.; Dixon, A.L.; Oliveira, A.R.S.; Cohnstaedt, L.W.; Mitzel, D.; Mire, C.E.; Cernicchiaro, N. Mosquito Vector Competence for Japanese Encephalitis Virus: A Systematic Review and Meta-Analysis Update. Parasit. Vectors 2025, 18, 191. [Google Scholar] [CrossRef]
  22. Auerswald, H.; Maquart, P.-O.; Chevalier, V.; Boyer, S. Mosquito Vector Competence for Japanese Encephalitis Virus. Viruses 2021, 13, 1154. [Google Scholar] [CrossRef]
  23. Aure, W.E.; Sayama, Y.; Saito-Obata, M.; Salazar, N.P.; Malbas, F.F.; Galang, H.O.; Imamura, T.; Zuasula, C.L.; Oshitani, H. Japanese Encephalitis Virus Genotype III from Mosquitoes in Tarlac, Philippines. IJID Reg. 2022, 4, 59–65. [Google Scholar] [CrossRef]
  24. Trosper, J.H.; Ksiazek, T.G.; Cross, J.H.; Basaca-Sevilla, V. Isolation of Japanese Encephalitis Virus from the Republic of the Philippines. Trans. R. Soc. Trop. Med. Hyg. 1980, 74, 292–295. [Google Scholar] [CrossRef]
  25. Ceccato, P.; Vancutsem, C.; Klaver, R.; Rowland, J.; Connor, S.J. A Vectorial Capacity Product to Monitor Changing Malaria Transmission Potential in Epidemic Regions of Africa. J. Trop. Med. 2012, 2012, 595948. [Google Scholar] [CrossRef]
  26. Kramer, L.D.; Ciota, A.T. Dissecting Vectorial Capacity for Mosquito-Borne Viruses. Curr. Opin. Virol. 2015, 15, 112–118. [Google Scholar] [CrossRef]
  27. Folly, A.J.; Dorey-Robinson, D.; Hernández-Triana, L.M.; Ackroyd, S.; Vidana, B.; Lean, F.Z.X.; Hicks, D.; Nuñez, A.; Johnson, N. Temperate Conditions Restrict Japanese Encephalitis Virus Infection to the Mid-Gut and Prevents Systemic Dissemination in Culex Pipiens Mosquitoes. Sci. Rep. 2021, 11, 6133. [Google Scholar] [CrossRef]
  28. Shultz, G.W.; Hayes, C.G. Ecology of Mosquitos (Diptera: Culicidae) at a Site Endemic with Japanese Encephalitis on Luzon, Republic of the Philippines. Southeast Asian J. Trop. Med. Public Health 1993, 24, 157–164. [Google Scholar]
  29. Kishore, S.; U, V.; Kishore Verma, S.; Kishore Verma, S.; Kishore, S.; Priya K, G. Japanese Encephalitis in India: A Comprehensive Review from Past to Present. AJPN 2024, 14. [Google Scholar] [CrossRef]
  30. Sudeep, A.B. Culex Gelidus: An Emerging Mosquito Vector with Potential to Transmit Multiple Virus Infections. J. Vector Borne Dis. 2014, 51, 251–258. [Google Scholar] [CrossRef]
  31. Flohic, G.L.; Porphyre, V.; Barbazan, P.; Gonzalez, J.-P. Review of Climate, Landscape, and Viral Genetics as Drivers of the Japanese Encephalitis Virus Ecology. PLoS Neglected Trop. Dis. 2013, 7, e2208. [Google Scholar] [CrossRef]
  32. Samy, A.M.; Elaagip, A.H.; Kenawy, M.A.; Ayres, C.F.J.; Peterson, A.T.; Soliman, D.E. Climate Change Influences on the Global Potential Distribution of the Mosquito Culex Quinquefasciatus, Vector of West Nile Virus and Lymphatic Filariasis. PLoS ONE 2016, 11, e0163863. [Google Scholar] [CrossRef]
  33. De Kruijf, H.A.M. The Relation Between Rainfall and Mosquito Populations. In Tropical Ecological Systems: Trends in Terrestrial and Aquatic Research; Golley, F.B., Medina, E., Eds.; Springer: Berlin, Heidelberg, 1975; pp. 61–65. ISBN 978-3-642-88533-4. [Google Scholar]
  34. Whittaker, C.; Winskill, P.; Sinka, M.; Pironon, S.; Massey, C.; Weiss, D.J.; Nguyen, M.; Gething, P.W.; Kumar, A.; Ghani, A.; et al. A Novel Statistical Framework for Exploring the Population Dynamics and Seasonality of Mosquito Populations. Proc. Biol. Sci. 289 20220089. [CrossRef]
  35. Mazarire, T.T.; Lobb, L.; Newete, S.W.; Munhenga, G. The Impact of Climatic Factors on Temporal Mosquito Distribution and Population Dynamics in an Area Targeted for Sterile Insect Technique Pilot Trials. Int. J. Environ. Res. Public Health 2024, 21, 558. [Google Scholar] [CrossRef]
  36. Murty, U.S.; SatyaKumar, D.V.R.; Sriram, K.; Rao, K.M.; Singh, T.G.; Arunachalam, N.; Samuel, P.P. Seasonal Prevalence of Culex Vishnui Subgroup, the Major Vectors of Japanese Encephalitis Virus in an Endemic District of Andhra Pradesh, India. J. Am. Mosq. Control Assoc. 2002, 18, 290–293. [Google Scholar]
  37. Ha, T.V.; Kim, W.; Nguyen-Tien, T.; Lindahl, J.; Nguyen-Viet, H.; Thi, N.Q.; Nguyen, H.V.; Unger, F.; Lee, H.S. Spatial Distribution of Culex Mosquito Abundance and Associated Risk Factors in Hanoi, Vietnam. PLoS Neglected Trop. Dis. 2021, 15, e0009497. [Google Scholar] [CrossRef]
  38. Erlanger, T.E.; Weiss, S.; Keiser, J.; Utzinger, J.; Wiedenmayer, K. Past, Present, and Future of Japanese Encephalitis. Emerg. Infect. Dis. 2009, 15, 1–7. [Google Scholar] [CrossRef]
  39. Krambrich, J.; Nguyen-Tien, T.; Pham-Thanh, L.; Dang-Xuan, S.; Andersson, E.; Höller, P.; Vu, D.T.; Tran, S.H.; Vu, L.T.; Akaberi, D.; et al. Study on the Temporal and Spatial Distribution of Culex Mosquitoes in Hanoi, Vietnam. Sci. Rep. 2024, 14, 16573. [Google Scholar] [CrossRef]
  40. Walsh, M.G.; Pattanaik, A.; Vyas, N.; Saxena, D.; Webb, C.; Sawleshwarkar, S.; Mukhopadhyay, C. High-Risk Landscapes of Japanese Encephalitis Virus Outbreaks in India Converge on Wetlands, Rain-Fed Agriculture, Wild Ardeidae, and Domestic Pigs and Chickens. Int. J. Epidemiol. 2022, 51, 1408–1418. [Google Scholar] [CrossRef]
  41. Thongsripong, P.; Hyman, J.M.; Kapan, D.D.; Bennett, S.N. Human–Mosquito Contact: A Missing Link in Our Understanding of Mosquito-Borne Disease Transmission Dynamics. Ann. Entomol. Soc. Am. 2021, 114, 397–414. [Google Scholar] [CrossRef]
  42. Laurent, S. Brandy Mosquito Vector Diversity and Malaria Transmission. Front. Malar. 2025, 3. [Google Scholar] [CrossRef]
  43. Simpson, E.H. Measurement of Diversity. Nature 1949, 163, 688–688. [Google Scholar] [CrossRef]
  44. Shannon, C.E. A Mathematical Theory of Communication; 1948; p. 27. [Google Scholar]
  45. Morris, E.K.; Caruso, T.; Buscot, F.; Fischer, M.; Hancock, C.; Maier, T.S.; Meiners, T.; Müller, C.; Obermaier, E.; Prati, D.; et al. Choosing and Using Diversity Indices: Insights for Ecological Applications from the German Biodiversity Exploratories. Ecol. Evol. 2014, 4, 3514–3524. [Google Scholar] [CrossRef]
  46. Boyer, S.; Durand, B.; Yean, S.; Brengues, C.; Maquart, P.-O.; Fontenille, D.; Chevalier, V. Host-Feeding Preference and Diel Activity of Mosquito Vectors of the Japanese Encephalitis Virus in Rural Cambodia. Pathogens 2021, 10, 376. [Google Scholar] [CrossRef]
  47. Laidlow, T.A.; Johnston, E.S.; Zadoks, R.N.; Walsh, M.; Viana, M.; Wiley, K.E.; Singh, B.B.; Baldini, F.; Dhanze, H.; Webb, C.; et al. Scoping Review of Japanese Encephalitis Virus Transmission Models. Transbound. Emerg. Dis. 2025, 2025, 9880670. [Google Scholar] [CrossRef]
  48. Laurel, A.G. Feeding Activities of Some Philippine Anopheles. Rev. Filip. De Med. Y Farm. 1934, 25, 286–297. [Google Scholar]
  49. Torres, E.P.; Salazar, N.P.; Belizario, V.Y.; Saul, A. Vector Abundance and Behaviour in an Area of Low Malaria Endemicity in Bataan, the Philippines. Acta Trop. 1997, 63, 209–220. [Google Scholar] [CrossRef]
  50. Hong, C.; Brookes, V.J.; Zadoks, R.N.; Webb, C.E. Citric Acid and Sodium Bicarbonate as an Alternative Carbon Dioxide Source for Mosquito Surveillance. Insects 2025, 16, 90. [Google Scholar] [CrossRef]
  51. WHO; World Health Organization. Pictorial Identification Key of Important Disease Vectors in the WHO South-East Asia Region 2025.
  52. Rattanarithikul, R.; Harrison, B.A.; Panthusiri, P.; Coleman, R.E. Illustrated Keys to the Mosquitoes of Thailand I. Background; Geographic Distribution; Lists of Genera, Subgenera, and Species; and a Key to the Genera. Southeast Asian J. Trop. Med. Public Health 2005, 36 Suppl 1, 1–80. [Google Scholar]
  53. Townzen, J.S.; Brower, A.V.Z.; Judd, D.D. Identification of Mosquito Bloodmeals Using Mitochondrial Cytochrome Oxidase Subunit I and Cytochrome b Gene Sequences. Med. Vet. Entomol. 2008, 22, 386–393. [Google Scholar] [CrossRef]
  54. Medeiros, M.C.I.; Boothe, E.C.; Roark, E.B.; Hamer, G.L. Dispersal of Male and Female Culex Quinquefasciatus and Aedes Albopictus Mosquitoes Using Stable Isotope Enrichment. PLoS Neglected Trop. Dis. 2017, 11, e0005347. [Google Scholar] [CrossRef]
  55. AppEEARS Team Application for Extracting and Exploring Analysis Ready Samples (AppEEARS). 2026.
  56. Kigozi, S.P.; Pindolia, D.K.; Smith, D.L.; Arinaitwe, E.; Katureebe, A.; Kilama, M.; Nankabirwa, J.; Lindsay, S.W.; Staedke, S.G.; Dorsey, G.; et al. Associations between Urbanicity and Malaria at Local Scales in Uganda. Malar. J. 2015, 14, 374. [Google Scholar] [CrossRef]
  57. Zuur, A.F.; Ieno, E.N.; Elphick, C.S. A Protocol for Data Exploration to Avoid Common Statistical Problems. Methods Ecol. Evol. 2010, 1, 3–14. [Google Scholar] [CrossRef]
  58. Dormann, C.F.; Elith, J.; Bacher, S.; Buchmann, C.; Carl, G.; Carré, G.; Marquéz, J.R.G.; Gruber, B.; Lafourcade, B.; Leitão, P.J.; et al. Collinearity: A Review of Methods to Deal with It and a Simulation Study Evaluating Their Performance. Ecography 2013, 36, 27–46. [Google Scholar] [CrossRef]
  59. Kristan, M.; Ahmed, F.; Susong, K.; Allel, K.; Yakob, L.; Cameron, M.; O’Hagan, J. Quantifying the Potential Relative Roles of Aedes Aegypti and Ae. Albopictus in Dengue Transmission: A Systematic Literature Review and Meta-Analysis of Dengue Virus Prevalence in Both Vectors. Int. J. Infect. Dis. 2025, 159, 108004. [Google Scholar] [CrossRef]
  60. Pearce, J.C.; Learoyd, T.P.; Langendorf, B.J.; Logan, J.G. Japanese Encephalitis: The Vectors, Ecology and Potential for Expansion. J. Travel Med. 2018, 25, S16–S26. [Google Scholar] [CrossRef]
  61. Maquart, P.-O.; Chann, L.; Boyer, S. Culex Vishnui (Diptera: Culicidae): An Overlooked Vector of Arboviruses in South-East Asia. J. Med. Entomol. 2022, 59, 1144–1153. [Google Scholar] [CrossRef]
  62. Ayu Mirah Adi, A.A.; Astawa, N.M.; Asri Damayanti, P.A.; Kardena, I.M.; Krisna Erawan, I.G.M.; Suardana, I.W.; Arta Putra, I.G.A.; Matsumoto, Y. Seroepidemiological Evidence for the Presence of Japanese Encephalitis Virus Infection in Ducks, Chickens, and Pigs, Bali-Indonesia. Bali Med. J. 2016, 5, 189. [Google Scholar] [CrossRef]
  63. Cleton, N.B.; Bosco-Lauth, A.; Page, M.J.; Bowen, R.A. Age-Related Susceptibility to Japanese Encephalitis Virus in Domestic Ducklings and Chicks. Am. J. Trop. Med. Hyg. 2014, 90, 242–246. [Google Scholar] [CrossRef]
  64. Griep, J.S.; Grant, E.; Pilgrim, J.; Riabinina, O.; Baylis, M.; Wardeh, M.; Blagrove, M.S.C. Meta-Analyses of Culex Blood-Meals Indicates Strong Regional Effect on Feeding Patterns. PLoS Neglected Trop. Dis. 2025, 19, e0012245. [Google Scholar] [CrossRef]
  65. Nguyen-Tien, T.; Bui, A.N.; Ling, J.; Tran-Hai, S.; Pham-Thanh, L.; Bui, V.N.; Dao, T.D.; Hoang, T.T.; Vu, L.T.; Tran, P.V.; et al. The Distribution and Composition of Vector Abundance in Hanoi City, Vietnam: Association with Livestock Keeping and Flavivirus Detection. Viruses 2021, 13, 2291. [Google Scholar] [CrossRef]
  66. Lord, J.S.; Gurley, E.S.; Pulliam, J.R.C. Rethinking Japanese Encephalitis Virus Transmission: A Framework for Implicating Host and Vector Species. PLoS Neglected Trop. Dis. 2015, 9, e0004074. [Google Scholar] [CrossRef]
  67. Farajollahi, A.; Fonseca, D.M.; Kramer, L.D.; Marm Kilpatrick, A. “Bird Biting” Mosquitoes and Human Disease: A Review of the Role of Culex Pipiens Complex Mosquitoes in Epidemiology. Infect. Genet. Evol. 2011, 11, 1577–1585. [Google Scholar] [CrossRef]
  68. Valdez, L.D.; Sibona, G.J.; Diaz, L.A.; Contigiani, M.S.; Condat, C.A. Effects of Rainfall on Culex Mosquito Population Dynamics. J. Theor. Biol. 2017, 421, 28–38. [Google Scholar] [CrossRef]
  69. Cardo, M.V.; Rubio, A.; Junges, M.T.; Vezzani, D.; Carbajo, A.E. Heterogeneous Distribution of Culex Pipiens, Culex Quinquefasciatus and Their Hybrids along the Urbanisation Gradient. Acta Trop. 2018, 178, 229–235. [Google Scholar] [CrossRef]
  70. Thongsripong, P.; Green, A.; Kittayapong, P.; Kapan, D.; Wilcox, B.; Bennett, S. Mosquito Vector Diversity across Habitats in Central Thailand Endemic for Dengue and Other Arthropod-Borne Diseases. PLoS Neglected Trop. Dis. 2013, 7, e2507. [Google Scholar] [CrossRef]
  71. Perrin, A.; Glaizot, O.; Christe, P. Worldwide Impacts of Landscape Anthropization on Mosquito Abundance and Diversity: A Meta-analysis. Glob. Chang Biol. 2022, 28, 6857–6871. [Google Scholar] [CrossRef]
  72. Burkett-Cadena, N.; Eubanks, M.D.D.; Unnasch, ThomasR. Preference of Female Mosquitoes for Natural and Artificial Resting Sites. J. Am. Mosq. Control Assoc. 2008, 24, 228–235. [Google Scholar] [CrossRef]
  73. Kay, B.H. Collection of Resting Adult Mosquitoes at Kowanyama, Northern Queensland and Charleville, South-Western Queensland. Aust. J. Entomol. 1983, 22, 19–24. [Google Scholar] [CrossRef]
  74. Shaman, J.; Stieglitz, M.; Stark, C.; Le Blancq, S.; Cane, M. Using a Dynamic Hydrology Model To Predict Mosquito Abundances in Flood and Swamp Water. Emerg. Infect. Dis. 2002, 8, 8–13. [Google Scholar] [CrossRef]
  75. Soh, S.; Aik, J. The Abundance of Culex Mosquito Vectors for West Nile Virus and Other Flaviviruses: A Time-Series Analysis of Rainfall and Temperature Dependence in Singapore. Sci. Total Environ. 2021, 754, 142420. [Google Scholar] [CrossRef]
  76. Jemberie, W.; Dugassa, S.; Animut, A. Biting Hour and Host Seeking Behavior of Aedes Species in Urban Settings, Metema District, Northwest Ethiopia. Trop. Med. Infect. Dis. 2025, 10, 38. [Google Scholar] [CrossRef]
  77. Animut, A.; Balkew, M.; Lindtjørn, B. Impact of Housing Condition on Indoor-Biting and Indoor-Resting Anopheles Arabiensis Density in a Highland Area, Central Ethiopia. Malar. J. 2013, 12, 393. [Google Scholar] [CrossRef]
  78. Dekker, T.; Takken, W. Differential Responses of Mosquito Sibling Species Anopheles Arabiensis and An. Quadriannulatusto Carbon Dioxide, a Man or a Calf. Med. Vet. Entomol. 1998, 12, 136–140. [Google Scholar] [CrossRef]
  79. St. Laurent, B.; Oy, K.; Miller, B.; Gasteiger, E.B.; Lee, E.; Sovannaroth, S.; Gwadz, R.W.; Anderson, J.M.; Fairhurst, R.M. Cow-Baited Tents Are Highly Effective in Sampling Diverse Anopheles Malaria Vectors in Cambodia. Malar. J. 2016, 15, 440. [Google Scholar] [CrossRef]
  80. Melgarejo-Colmenares, K.; Cardo, M.V.; Vezzani, D. Blood Feeding Habits of Mosquitoes: Hardly a Bite in South America. Parasitol. Res. 2022, 121, 1829–1852. [Google Scholar] [CrossRef]
  81. Oshaghi, M.A.; Chavshin, A.R.; Vatandoost, H.; Yaaghoobi, F.; Mohtarami, F.; Noorjah, N. Effects of Post-Ingestion and Physical Conditions on PCR Amplification of Host Blood Meal DNA in Mosquitoes. Exp. Parasitol. 2006, 112, 232–236. [Google Scholar] [CrossRef]
  82. Tchouassi, D.P.; Kisero, R.O.; Rotich, G.; Dunlap, C.; Torto, B.; Muturi, E.J. Next Generation Sequencing Improves the Resolution of Detecting Mixed Host Blood Meal Sources in Field Collected Arboviral Mosquito Vectors. Med. Vet. Entomol. 2024, 38, 407–415. [Google Scholar] [CrossRef]
  83. Mwanga, E.P.; Mchola, I.S.; Makala, F.E.; Mshani, I.H.; Siria, D.J.; Mwinyi, S.H.; Abbasi, S.; Seleman, G.; Mgaya, J.N.; Jiménez, M.G.; et al. Rapid Assessment of the Blood-Feeding Histories of Wild-Caught Malaria Mosquitoes Using Mid-Infrared Spectroscopy and Machine Learning. Malar. J. 2024, 23, 86. [Google Scholar] [CrossRef]
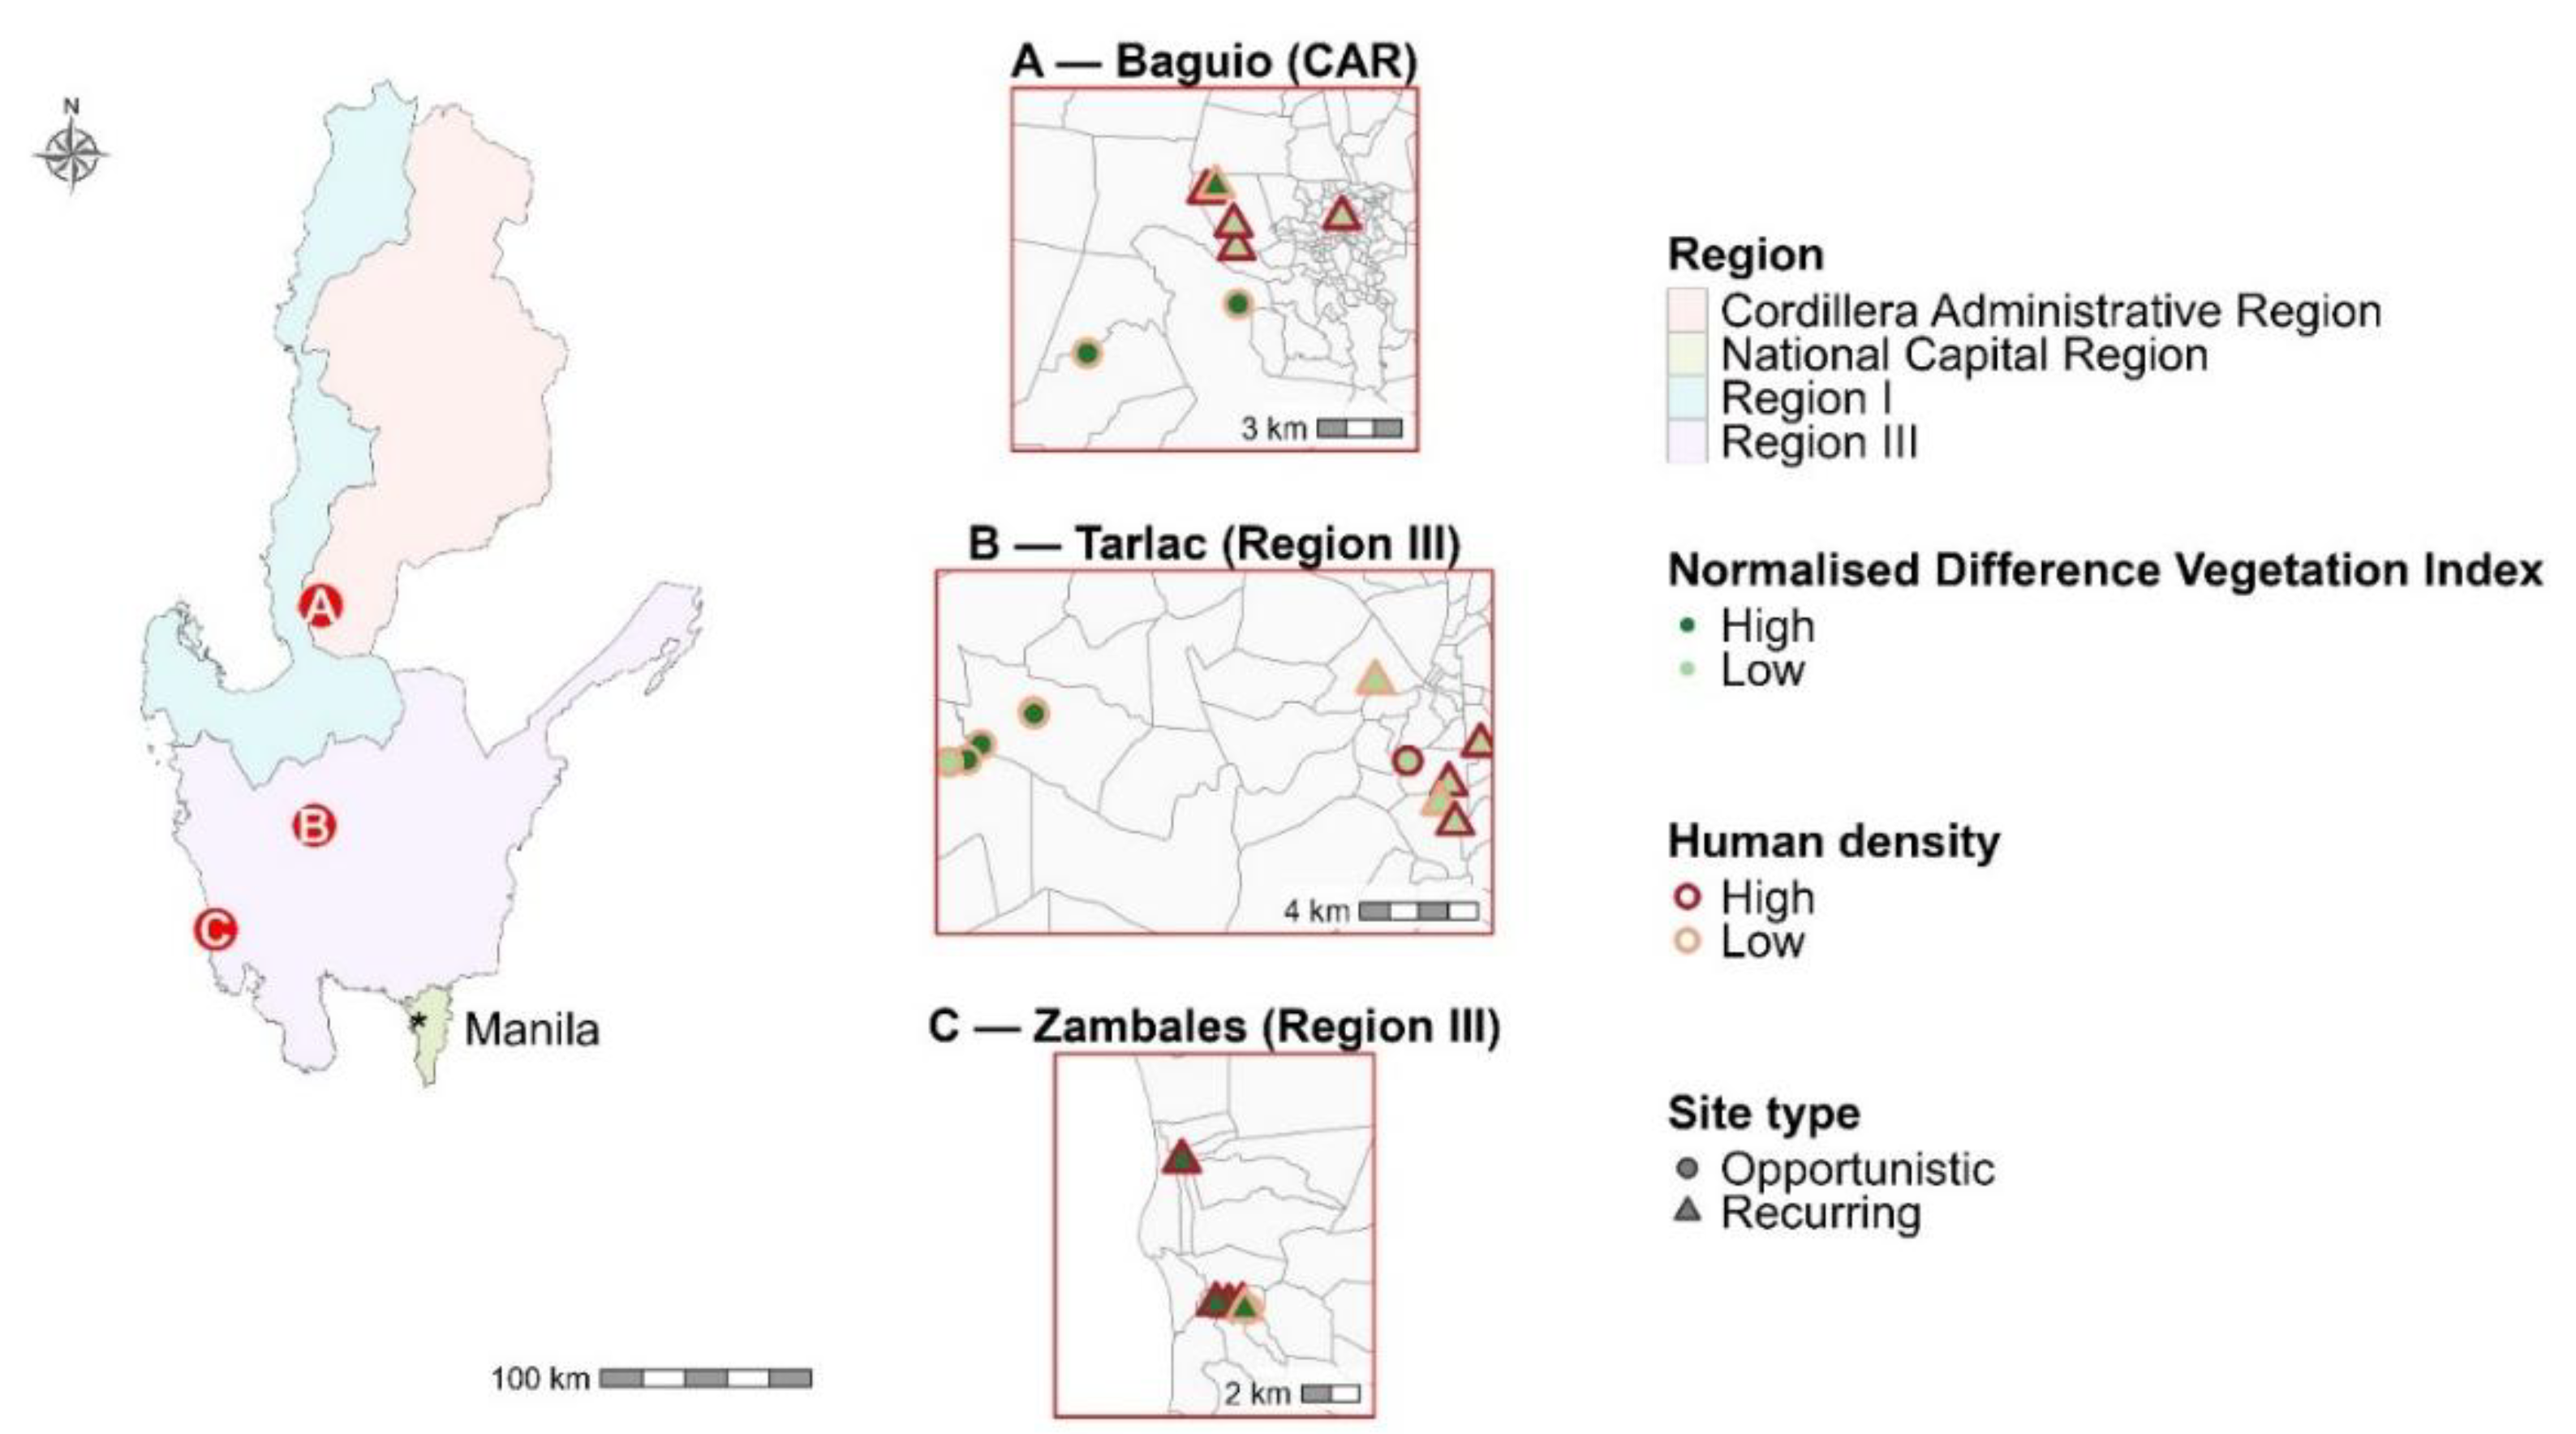
Figure 1. Map of study sites. (Left) Map of the Luzon area coloured by region. Red dots A-C represent study site provinces. Black asterisk marks Manila. (Right) Sampling sites within (A) Baguio, (B) Tarlac and (C) Zambales. Sites are classified as: dark green=high NDVI sites, light green=low NDVI, dark red border=high human density and light red border=low human density. Triangles indicate recurring study sites and circles are opportunistic sampling sites.
Preprints 235186 g001
Figure 2. Classification of sampling sites based on the site-level Normalized Difference Vegetation Index (NDVI) and human population density (people km⁻²). Sites are grouped into four quadrants defined by the median values for NDVI (horizontal dashed line) and human density (vertical dashed line): high NDVI and low human density, high NDVI and high human density, low NDVI and low human density, and low NDVI and high human density. Point colours indicate region (Baguio = red, Tarlac = blue, Zambales = green), while point size is proportional to sampling effort (number of trap nights).
Preprints 235186 g002
Figure 3. Mean diversity indices across urbanicity index. Panels show sites with (A) high NDVI and low human density, (B) high NDVI and high human density, (C) low NDVI and low human density, and (D) low NDVI and high human density. Grey points represent individual trap-night observations and red bars represent the mean value of each diversity index.
Preprints 235186 g003
Figure 4. Odds ratios (± 95% confidence intervals) from the binomial GLMM examining factors associated with the probability of capturing multiple mosquito species within a trap. Odds ratios greater than 1 indicate an increased likelihood of a multispecies catch, whereas odds ratios less than 1 indicate a decreased likelihood relative to the reference category. The vertical dashed line indicates an odds ratio of 1 (no effect).
Preprints 235186 g004
Figure 5. Predicted mosquito community diversity across the retained explanatory variables from the conditional diversity models. (A) Predicted Shannon diversity, Simpson diversity and Pielou’s evenness in multispecies traps during dry and rainy season. (B) Predicted diversity indices across urbanicity categories defined by NDVI and human population density.
Preprints 235186 g005
Figure 6. Predicted mosquito abundance (mosquitoes per trap) from GLMM model. Predicted abundance by (A) season (B) across urbanicity categories and season (C) and chicken density. Points and lines represent model predictions, whilst shaded ribbons and error bars indicate 95% confidence intervals.
Preprints 235186 g006
Figure 7. Odds ratios (±95% confidence intervals) from the combined genus presence model showing the effects of chicken density, maximum temperature, season and urbanicity on the probability of occurrence of Aedes, Armigeres and Culex mosquitoes. Odds ratios greater than 1 indicate an increased probability of occurrence relative to low chicken density, dry season and high NDVI and high human dense sites. Dashed vertical lines indicate no effect (odds ratio = 1).
Preprints 235186 g007
Figure 8. Predicted probability of blood fed mosquito presence in relation to; (A) Predicted probability across four NDVI-human density categories: high NDVI and low human-density, high NDVI and high human-density, low NDVI and low human-density, and low NDVI and high human-density. (B) Predicted probability of presence in relation to chicken density (birds km⁻²). Points represent predicted probability means and error bars indicate 95% confidence intervals.
Preprints 235186 g008
Figure 9. Predicted abundance of blood fed mosquitoes when found from the conditional component of the hurdle model. Predicted blood fed abundance by (A) season (B) across urbanicity categories (C) relative humidity (D) pig density E) season and urbanicity. Points and lines represent model predictions, whilst shaded ribbons and error bars indicate 95% confidence intervals.
Preprints 235186 g009
Table 1. Summary of mosquito collections conducted across rainy and dry seasons between August 2024 and February 2026. A total of 8,595 mosquitoes were collected from 61 sampling sites using 140 traps deployed across four collection periods.
Collection Period Season Number of sites Number of traps deployed Total mosquitoes captured Total male mosquitoes captured Total female mosquitoes captured Three most common mosquito species caught
August 2024 Rainy 15 32 1521 593 1018 Culex quinquefasciatus, Aedes vexans, Culex unknown
February 2025 Dry 18 35 3241 1183 2083 Culex quinquefasciatus, Armigeres spp., Culex vishnui
August and October 2025 Rainy 18 46 2177 603 1518 Culex quinquefasciatus, Armigeres spp., Culex vishnui
February 2026 Dry 10 21 1521 762 759 Culex quinquefasciatus, Armigeres spp., Culex vishnui
Table 2. Total trapping nights across urbanicity categories, in Baguio (CAR), Tarlac (Region III), and Zambales (Region III).
Urbanicity Measure Region Total trapping nights
High NDVI and High Human density Zambales (Region III) 74
High NDVI and Low Human density Tarlac (Region III) 36
Zambales (Region III) 13
Baguio (CAR) 15
High NDVI and High Human Density Tarlac (Region III) 41
Baguio (CAR) 48
Low NDVI and High Human Density Tarlac (Region III) 27
Zambales (Region III) 3
Table 3. Number of female mosquitoes caught belonging to the four most common genus. Mosquitoes were collected from three provinces within the Philippines.
Genus August 2024 February 2025 August 2025 October 2025 February 2026 Total number caught
Culex 719 1972 1170 104 598 4563
Aedes 166 22 110 19 24 341
Armigeres 31 51 74 19 106 281
Anopheles 21 3 16 0 27 67
Disclaimer/Publisher’s Note: The statements, opinions and data contained in all publications are solely those of the individual author(s) and contributor(s) and not of MDPI and/or the editor(s). MDPI and/or the editor(s) disclaim responsibility for any injury to people or property resulting from any ideas, methods, instructions or products referred to in the content.
Copyright: This open access article is published under a Creative Commons CC BY 4.0 license, which permit the free download, distribution, and reuse, provided that the author and preprint are cited in any reuse.