

Submitted:
25 September 2026
Posted:
28 September 2026
You are already at the latest version
Abstract
Chemical terrorism poses a persistent global security challenge despite its relatively low frequency. Despite growing research on chemical terrorism, there is inadequate information concerning the geographical evolution of the phenomenon. This study examined the spatio-temporal patterns and hot spots of global chemical terrorism incidents and the association between different operational characteristics recorded in the Global Terrorism Database from 1970 to mid-2021. A total of 357 confirmed chemical terrorism incidents were identified across 63 countries. Temporal analysis showed an increasing trend in incidents and casualties over time. Comparison of the standard deviational ellipses showed an eastward and slight northward shift in the spatial distribution after 2001, with the 2002–2020 distribution becoming more concentrated around the Middle East and South/Southwest Asia. Emerging Hot Spot Analysis identified statistically significant increasing trends in parts of the Middle East and South/Southwest Asia, especially around Iraq, Afghanistan, Pakistan, and neighboring areas. This trend underscores the need for targeted attention to enhanced cross-border intelligence and information sharing, strict control over the production and legitimate use of toxic chemicals and strengthened emergency-response capacity in these regions.
Keywords:
chemical terrorism
; emerging hotspot
; high impact analysis
; global terrorism database
; middle east
; South Asia
1. Introduction
Terrorism has emerged as a major national and global security concern that poses a threat to national sovereignty [1,2]. It has occurred across nearly all regions of the world since the late twentieth and early twenty-first centuries [3]. These incidents cause substantial loss of life and property, leading to public fear and social unrest [4]. It commonly involves the intentional use or threat of violence and fear by non-state actors to coerce a community or government in pursuit of political, ideological, religious, economic, or social goals [5,6]. The tactical short-run goals of terrorism include attracting publicity and media attention, destabilizing political systems, and disrupting economic activity [7,8].
Terrorism is associated with a range of factors, including economic hardship, modernization pressures, institutional order, political shifts, identity crises, global influences, and contagion [8]. Diverse techniques are employed to destabilize economic and political systems, including assassination, armed assault, bombing, explosions, infrastructure sabotage, hijacking, hostage-taking, and unarmed aggression [9]. Even if the immediate costs of terrorism have seemed to be marginal, its indirect long-term political and economic effects can be substantial. For instance, terrorism can lead to governmental instability [8,10]. Weaknesses in disaster response management linked to policy, actors, operations, and technology can cause delays, poor coordination, and ineffective responses, increasing casualties and deaths [11].
However, studies on terrorism have profoundly emphasized attack trends, target selection, and spatial-temporal variation, highlighting that terrorist groups employ various methods and targets, and violence against civilians varies across locations and time [12,13]. For instance, the Global Terrorism Database (GTD) is an event-based database developed by the National Consortium for the Study of Terrorism and Responses at the University of Maryland. It records more than 200,000 domestic and international terrorist incidents. The database includes information on the date, location, attack type, target type, weapon type, and casualties [14]. According to GTD, a terrorist attack refers to the threatened or actual use of illegal force and violence by a non-state actor to achieve a political, economic, religious, or social goal through fear, coercion, or intimidation [5]. Because of its broad temporal coverage, standardized event-level structure, and consistent coding scheme, the GTD has been widely used in terrorism research, including studies of incident fatality rates and regional patterns [15], chemical, biological, radiological, and chemical-terrorism trends [16,17], determinants and causes of terrorism [8,18], domestic and transnational terrorism dynamics [19], group-level escalation behavior [20], weapon and attack patterns [21], target selection analysis [22,23], impact analysis [2], specific weapon type analysis [24,25], hotspot analysis (Li et al., 2021), fatality severity [27], preparedness and training needs [28,29].
The GTD classifies incidents into 13 weapon categories: biological agents, chemicals, explosives/bombs/dynamite, fake weapons, firearms, incendiary devices, melee weapons, nuclear weapons, radiological agents, sabotage equipment, vehicles, other weapons, and unknown weapons [5]. Among these, Chemical agents have dual-use characteristics and may be employed for legitimate industrial, agricultural, research, medical, pharmaceutical, protective, certain non-chemical military, and law-enforcement purposes, including domestic riot control, when their types and quantities are consistent with those purposes [30]. In recent years, terrorist groups have used toxic industrial chemicals as well as classical chemical warfare agents to attack general populations [31].
Although relatively rare, chemical terrorist attacks have become more frequent over time and have the potential to cause severe casualties [4,31]. The GTD defines a chemical weapon as a toxic chemical contained within a delivery system and dispersed as a liquid, vapor, or aerosol, including through explosive devices [24]. According to U.S. Department of Homeland Security statistics, 239 (56%) of 423 recorded nuclear, biological, and chemical terrorist incidents worldwide from 1950 to 2005 involved chemical agents [4]. [28] reported that the average annual number of chemical terrorism attacks increased from 5.1 during 1970-2001 to 15.6 during 2001–2017. [24] observed that chemical terrorism occurrences resulted in an average of 51 injuries and 7 fatalities per incident. [21] expanded their study to 2018, revealing 347 terrorism-related chemical incidents from 1970 to 2018, which caused 921 deaths and 13,361 nonfatal injuries. On March 16, 1988, Saddam Hussein’s forces attacked the Kurdish village with mustard gas and nerve agents, killing about 5,000 civilians [32,33,34,35]. Aum Shinrikyo released sarin in the Tokyo subway attack on March 20, 1995, causing 13 deaths and 6,226 injuries [25,31,36,37,38]. Between March 2011 and April 2017, at least 1,206 people died in chemical attacks in non-state-controlled parts of Syria, 97.6% of whom were civilians [28,39]. The Ghouta attack on 21 August 2013 was the deadliest chemical attack in the Syrian War, killing 897 civilians, including 30% women [39]. Moreover, the Khan Shaykhun chemical attack on April 4, 2017, killed at least 74 people, injured more than 557, and forced over 4.5 million Syrians to flee their homeland [40].
Although chemical terrorism has been widely documented, substantial research gaps remain. Existing studies using data from the Global Terrorism Database have primarily focused on descriptive characteristics of terrorist incidents, including incidence rates, types of chemicals used, casualties, spatial distribution, target types, attack success rates, and temporal patterns [17,24,28]. However, limited attention has been paid to integrating long-term temporal trends with spatial analytical approaches to assess chemical attacks’ severity patterns, geographic transitions, emerging hot spots, and factors associated with attack outcomes. This study provides a spatio-temporal analysis of chemical terrorism incidents recorded in the Global Terrorism Database from 1970 to 2021. The study examines trends in incident occurrence, fatalities, and injuries; characterizes the spatial distribution of incidents and their severity; identifies spatial shifts and the emergence of hot spots; and quantifies operational characteristics associated with attack success. This integrated approach provides a more comprehensive understanding of the evolution, severity, and geographic dynamics of chemical terrorism over time.
2. Materials and Methods
2.1. Data Source
The Global Terrorism Database (GTD) is an open-source database containing around 214,600 global terrorism incidents that occurred in the period from 1970 to mid-2021 (except 1993). The GTD is maintained by the National Consortium for the Study of Terrorism and Responses to Terrorism (START) at the University of Maryland and is part of the US Department of Homeland Security Center of Excellence [29]. It is funded by Homeland Security [5] to collect, maintain, and annually publish the relevant information on terrorism attacks worldwide [2]. It was developed to increase understanding of the characteristics of violence for prevention and effective response. The consortium evaluates media reports to verify if an incident meets the pre-specified eligibility standard [24]. An extensive description of their origin and the data collection methodology can be found in the GTD codebook, which is available on the START website [41].
2.2. Data Preparation
This study used incident-level data from the Global Terrorism Database (GTD) to examine global patterns of chemical terrorism between 1970 and mid-2021. The GTD provides detailed information on terrorist incidents, including their geographic location, perpetrators, target and weapon types, casualties, nationality, region, sources, and other operational characteristics.
Chemical terrorism incidents were identified through a multistage filtering and verification procedure. First, incidents classified as involving chemical weapons under the primary weapon-type variable (weaptype1) were extracted, yielding 351 records. To identify potentially misclassified or additionally relevant incidents, records classified as chemical attacks under secondary weapon-type variables (weaptype2, weaptype3, and weaptype4) were also examined. For incidents involving multiple weapon types, an event was included only when the chemical agent directly contributed to the attack’s principal effects or casualties. Incidents in which chemical substances were present as secondary but did not play an operationally significant role were excluded. After the verification process, six additional incidents were added as chemical terrorism events. The final event-based dataset therefore comprised 357 confirmed incidents across 63 countries.
2.3. Analytical Framework
2.3.1. Temporal Analysis
Temporal patterns of chemical terrorism incidents were examined using the full dataset of 357 incidents. Annual incident counts were calculated for each year from 1970 to mid-2021, with 1993 having missing data. Linear regression was used to model trends in annual incident frequency from 1970 to 2020 and for two separate periods: 1970–1992 and 1994–2020. The analysis stopped at 2020 because data were only available through mid-2021. For each regression model, the slope, coefficient of determination (R²), and p-value were calculated to assess the direction, strength, and statistical significance of temporal trends.
2.3.2. Statistical Analysis
Statistical analyses were conducted in Python using the pandas, SciPy, and statsmodels libraries. Attack success was defined according to the success variable in the Global Terrorism Database and was coded as successful or unsuccessful. Descriptive statistics were used to summarize attack outcomes and operational characteristics. Associations between attack success and target type and between attack success and geographic region were examined using contingency tables and Pearson’s chi-square tests. The association between geographic region and target type was also assessed using a Pearson’s chi-square test. Expected cell frequencies were examined to assess the assumptions of the chi-square test. Perpetrator effectiveness was evaluated by calculating the number and proportion of successful incidents attributed to each perpetrator group. All statistical tests were two-tailed, and statistical significance was set at p < 0.05.
2.3.3. Country-Based Severity Assessment
Country-level impact was evaluated by aggregating incidents across 63 countries using the complete dataset of 357 incidents. To capture both the frequency and severity of attacks, a weighted severity index was constructed following a methodology similar to GTI-IS, modified from [2]:
Severity = (Incident Frequency×1.0) + (Fatalities×3.0) + (Injuries×1)
This weighting scheme assigns greater importance to fatalities while still incorporating injuries and incident frequency. Countries were subsequently ranked according to their calculated severity scores.
2.3.4. High-Impact Attack Identification (HIA)
High-impact attacks (HIA) were identified using an iterative outlier detection method applied to casualty-related variables, specifically fatalities (nkill) and injuries (nwound). This approach aimed to detect incidents with unusually high casualties compared to the overall distribution of events. Outliers were determined using the interquartile range (IQR) method [2].
Where:
Q1 represents the first quartile (25th percentile)
Q3 represents the third quartile (75th percentile)
The upper threshold for identifying high-impact events was calculated as:
Any incident with a casualty value exceeding this threshold was classified as an outlier:
Here, xi denotes the casualty value for incident i.
2.3.5. Spatial Pattern Analysis
Spatial analyses were conducted using the 357 incidents with geographic coordinates. Each incident was represented as a spatial point using its latitude and longitude coordinates.
a) Central Tendency
Spatial central tendency was analyzed in ArcGIS Pro using the Mean Center and Median Center tools in the Spatial Statistics Tools from the Measuring Geographic Distributions toolbox, where the Mean Center calculates the average x- and y-coordinate location of all incident points, and the Median Center identifies the location that minimizes the total distance to all incidents. The dataset included 357 chemical terrorism incidents represented as point locations. Mean Center analysis was performed for the full study period (1970–2021), pre-2001, and post-2001 periods. Median Center analysis was conducted for the full dataset because it is less affected by extreme or geographically distant incidents and provides a robust measure of the central location of the distribution.
b) Standard Deviational Ellipse Analysis
Spatial dispersion and directional trends were analyzed using the Directional Distribution (Standard Deviational Ellipse) tool in ArcGIS Pro. The incident point feature class was projected into an appropriate coordinate system, and separate datasets were created for the full study period (1970–2021), the pre-2001 period, and the post-2001 period using attribute selections. For each dataset, the Directional Distribution tool within the Spatial Statistics Tools for Measuring Geographic Distributions was applied to the incident locations without using a weighting field.
One-standard-deviation ellipses were generated for each period, providing information on the geographic center, major and minor axes, spatial dispersion, and dominant directional trend. The resulting ellipses were mapped and compared by location, size, and orientation to assess changes in the concentration, extent, and directional distribution of chemical terrorism incidents over time.
c) Nearest Neighbor Analysis
Spatial clustering was assessed in ArcGIS Pro using the Average Nearest Neighbor tool located within the Analyzing Patterns toolbox under Spatial Statistics Tools. The 357 incident points were used as the input feature class, and Euclidean distance was applied. The tool calculated the observed and expected mean nearest-neighbor distances, Nearest Neighbor Index, z-score, and p-value. An index below 1 indicated clustering, whereas an index above 1 indicated dispersion.
d) Ripley’s K and L-Function
Clustering across multiple spatial scales was examined in ArcGIS Pro using the Multi-Distance Spatial Cluster Analysis (Ripley’s K Function) tool. The 357 incident points were analyzed using 10 distance bands, a distance increment of 250 km, 999 permutations, and the minimum enclosing rectangle as the study-area method. ArcGIS Pro generated the final distance bands from approximately 834.97 km to 8,349.75 km based on the spatial extent of the input features and study area. No weight field was applied. A confidence envelope was generated using 999 permutations to evaluate whether the observed spatial pattern differed significantly from complete spatial randomness. Clustering was evaluated by comparing the observed L-function values with the expected values and confidence envelope.
2.3.6. Emerging Hotspot Analysis
Spatio-temporal patterns of chemical terrorism incidents were examined in ArcGIS Pro using the Space Time Pattern Mining toolbox. The incident points were first projected into a meter-based coordinate system and aggregated into a space–time cube using the Create Space Time Cube by Aggregating Points tool, with 250 km × 250 km spatial bins and 3-year temporal intervals. Incident counts were summarized for each spatial bin and time step, producing a structured space–time dataset for subsequent analysis. The resulting space–time cube was then analyzed using the Emerging Hot Spot Analysis tool. The Getis–Ord Gi* statistic identified statistically significant hot and cold spots for each time step, while the Mann–Kendall trend test evaluated changes in clustering intensity through time. Based on these results, each spatial bin was classified into an emerging hot- or cold-spot category, such as new, consecutive, historical, intensifying, diminishing, or no pattern detected. As GTD data were unavailable for 1993, Optimized Hot Spot Analysis was conducted as a supplementary sensitivity analysis to assess whether the principal spatial concentrations were broadly consistent when the temporal dimension was excluded.
3. Results
3.1. Temporal Trends of Chemical Terrorism
A total of 357 chemical terrorism incidents were recorded globally between 1970 and mid-2021. The linear trend analysis covered 1970–2020, with 1993 treated as missing. Ordinary Least Squares regression indicated a positive and statistically significant overall trend (β = 0.290 incidents per year, p < 0.001, R² = 0.370), suggesting a gradual increase in chemical terrorism incidents. The moderate R² value indicates that time explains part of the variation, while other factors likely contributed to annual fluctuations. The trend during 1970–1992 was small and not statistically significant (β = 0.052, p = 0.435, R² = 0.029). In contrast, a statistically significant increase was observed during 1994–2020 (β = 0.397, p = 0.042, R² = 0.155), indicating that the overall upward trend was primarily driven by the later period. The highest annual frequency was observed in 2016, with 32 incidents, followed by 2017 with 28 incidents and 2015 with 23 incidents. These peaks occurred within a short period, indicating a distinct surge in chemical terrorism activity during the mid-2010s (Figure 1).
3.2. Association between Operational Characteristics
3.2.1. Target Type and Attack Success
A chi-square test indicated a statistically significant association between target type and attack success (χ² = 73.34, p < 0.001). Higher success rates were observed for attacks targeting private citizens and property (92.6%), police (93.5%), and military personnel or facilities (84.2%), including 88 successful attacks against private citizens and property, 29 against police, and 32 against military targets. In contrast, attacks targeting general government institutions had a lower success rate, with 19 successful and 18 unsuccessful attacks. These findings indicate that attack success varied significantly across target categories.
3.2.2. Regional Variation in Attack Success
A statistically significant association was also observed between geographic region and attack success (χ² = 64.03, p < 0.001). Higher success rates were recorded in South Asia (91.5%) and the Middle East and North Africa (89.3%), with 86 and 75 successful attacks, respectively. Lower success rates were observed in Australasia and Oceania (20.0%) and Southeast Asia (45.5%); in Australasia and Oceania, only 2 attacks succeeded compared with 8 that failed. These findings indicate substantial regional variation in attack outcomes, although the analysis does not establish the specific contextual factors responsible for these differences.
3.2.3. Perpetrator Group Effectiveness
Attack success rates varied across perpetrator groups. Among groups, the Islamic State of Iraq and the Levant and the Arab Revolutionary Army recorded success rates of 100%, with 41 and 8 successful attacks, respectively. The Taliban recorded a success rate of 96.4%, with 27 of 28 attacks classified as successful. In comparison, incidents attributed to unknown perpetrators had a success rate of approximately 71%, with 127 successful attacks among 178 incidents. These descriptive findings demonstrate variation in recorded success rates across perpetrator categories but do not independently establish the organizational factors responsible for that variation.
3.2.4. Regional Targeting Patterns
A statistically significant association was identified between geographic region and target type (χ² = 625.39, p < 0.001), indicating that the distribution of targeted categories differed across regions. In South Asia, attacks frequently targeted educational institutions and private citizens and property, with 39 and 24 incidents, respectively. In the Middle East and North Africa, military targets and private citizens and property accounted for 24 and 41 incidents, respectively. In Western Europe, attacks more frequently involved businesses and food, water, or infrastructure systems, with 7 and 9 incidents, respectively. These findings demonstrate distinct regional differences in target selection; however, further analysis would be required to determine the strategic or operational factors underlying these patterns.
3.3. Trends in Fatalities and Injuries
Analysis of casualty data revealed distinct temporal patterns in fatalities and injuries associated with chemical terrorism incidents. Total global fatalities were 703, and total global injuries were 14,534. Trend analyses covered 1970–2020, excluded 1993 because of missing data, and did not include the mid-2021 observations. Fatalities exhibited a positive but not statistically significant linear trend over time (β = 0.521 persons per year, p = 0.088, R² = 0.060). The low R² value indicates substantial year-to-year variability in fatality counts. The highest number of deaths was recorded in 2000 (200 fatalities), followed by 1999 (67 fatalities) and mid-2021 (60 fatalities), indicating that extreme fatality events were sporadic rather than consistently increasing. Similarly, injuries showed a positive but not statistically significant linear trend (β = 11.584 persons per year, p = 0.198, R² = 0.034). The largest injury totals occurred in 1995 (6,251 injuries), followed by 2016 (2,164 injuries) and 2012 (1,183 injuries), reflecting the occurrence of sporadic, large-scale incidents (Figure 2a and Figure 2b).
3.4. Country-Level Distribution of Incidents, Fatalities, and Injuries
Country-level analysis reveals substantial variation in the distribution of chemical terrorism incidents, fatalities, and injuries across the 63 affected countries. A small number of countries account for a disproportionately large share of both incidents and human casualties, indicating an uneven global pattern. In terms of incident frequency, Afghanistan records the highest number of events (67 incidents), followed by Iraq (52 incidents) and the United States (28 incidents). These countries represent the primary hotspots of chemical terrorism activity, reflecting sustained exposure over time. A different pattern is observed when examining fatalities. Uganda reports the highest number of deaths (200 fatalities), followed by Iraq (118 fatalities) and Colombia (72 fatalities). Uganda’s position is largely driven by a single high-fatality event, whereas Iraq and Colombia reflect more consistent lethal impacts across multiple incidents. In contrast, injuries are most heavily concentrated in Japan, which records the highest number of wounded individuals (6,746), followed by Afghanistan (3,607) and Iraq (2,130). The exceptionally high injury count in Japan is associated with a major high-casualty event, while Afghanistan and Iraq again demonstrate both high incident frequency and substantial human impact. (Figure 3, Figure 4 and Figure 5) (Supplementary Tables S1 and S2)
3.5. Identification of High-Impact Incidents
High-impact attacks (HIAs) were identified using an iterative interquartile range (IQR) outlier detection approach applied separately to fatalities (nkill) and injuries (nwound). The casualty distributions are highly right-skewed, indicating the presence of extreme events. For fatalities, the dataset (n = 357) shows a low central tendency (mean = 1.97; median = 0), with a maximum of 200 deaths. Initial IQR-based filtering produced an upper bound of 0, identifying 72 outliers. To refine detection, iterative outlier removal was applied, yielding successive thresholds of 33.76, 20.48, and 14.04 deaths. After convergence, 12 events were classified as high-impact based on fatalities. For injuries, the distribution is similarly skewed (mean = 40.71; median = 1; maximum = 5500). Iterative outlier filtering produced thresholds of 446.80, 250.00, and 200.00 injuries, resulting in the identification of 9 high-impact events. These HIAs represent a small fraction of total incidents but account for a disproportionate share of casualties. The most extreme fatality event occurred in Uganda (200 deaths, 2000), followed by Colombia (65 deaths, 1999) and Yemen (45 deaths, 2021). In contrast, injury-based HIAs are dominated by large-scale events in Japan (Tokyo, 1995: 5500 injuries; Yokohama, 1995: 671; Matsumoto, 1994: 500), along with major incidents in Iraq and Afghanistan. (Supplementary Tables S3 and S4)
3.6. Spatial Pattern Analysis
The mean center and standard deviational ellipse analyses were conducted for three time periods: before 2001, after 2001, and the full study period from 1970 to 2021. These analyses were used to examine both the central tendency and directional dispersion of the spatial distribution over time. (Figure 6). The overall mean center for 1970–2021 is located near Egypt and the eastern Mediterranean region at approximately 27.96°N, 32.66°E. The median center for 1970–2021 is located farther west in North Africa at approximately 33.20°N, 4.32°E. Because the median center is less affected by extreme outliers, this suggests that the central location of the dataset is influenced by the broad spread of incidents across North Africa, Europe, and the Middle East. When comparing the two time periods, there is a noticeable eastward shift. The mean center before 2001 is located in North Africa at approximately 27.25°N, 7.99°E, while the mean center after 2001 shifts eastward toward the Iraq–Iran region at approximately 28.33°N, 45.30°E. This shift suggests that chemical terrorism incidents after 2001 became more concentrated in the Middle East and nearby parts of South Asia.
For the full period 1970–2021, the ellipse is centered at approximately 27.965° N, 32.655° E, with an X standard distance of 9,825.02 km and a Y standard distance of 3,252.04 km, indicating a broad east–west pattern extending from the Americas through Europe, Africa, and Asia. The pre-2001 ellipse is the largest, with an X standard distance of 11,645.40 km, a Y standard distance of 3,799.38 km, and an area of 138,993,749.37 km², suggesting that earlier events were more widely dispersed across the Atlantic, Europe, Africa, and Asia. After 2001, the ellipse decreases in size, with an X standard distance of 8,095.55 km, a Y standard distance of 2,800.87 km, and an area of 71,230,737.59 km², showing a more concentrated distribution around Europe, North Africa, the Middle East, and South Asia, particularly near the India–Pakistan-Afghanistan region. Overall, the pattern shifted from a wider pre-2001 distribution across the Americas, Europe, Africa, and Asia to a more concentrated post-2001 cluster across Europe, North Africa, the Middle East, and South Asia.
The Average Nearest Neighbor analysis indicates a statistically significant clustered spatial pattern of chemical terrorism incidents. The observed mean distance between incidents was 136,088.87 m, which is substantially lower than the expected mean distance of 508,524.75 m under a random spatial distribution. This produced a Nearest Neighbor Ratio of 0.2676, indicating that incidents are much closer together than would be expected by chance. The strongly negative z-score (-26.47) and p-value (<0.001) further confirm that the observed clustering is statistically significant. Therefore, the results suggest that chemical terrorism incidents are not randomly distributed but are highly concentrated in specific geographic areas.
The Multi-Distance Spatial Cluster Analysis demonstrated statistically significant clustering of chemical terrorism incidents across all evaluated distance bands, ranging from approximately 834.97 km to 8,349.75 km. At every distance, the observed L(d) values exceeded the upper confidence envelope, indicating a significant departure from complete spatial randomness. The strongest clustering was observed at the first distance band of approximately 834.97 km, where the observed L(d) value reached 3,338,933.37, substantially exceeding the maximum confidence value of 909,307.80. This finding indicates pronounced clustering at the regional scale, with incidents concentrated within geographically proximate areas. Although the difference between the observed and expected values decreased as distance increased, the observed L(d) values remained above the upper confidence envelope up to approximately 8,349.75 km. Therefore, chemical terrorism incidents were not randomly or evenly distributed worldwide but exhibited significant spatial concentration at both regional and broader transcontinental scales.
3.7. Emerging Hotspot of Chemical Terrorism
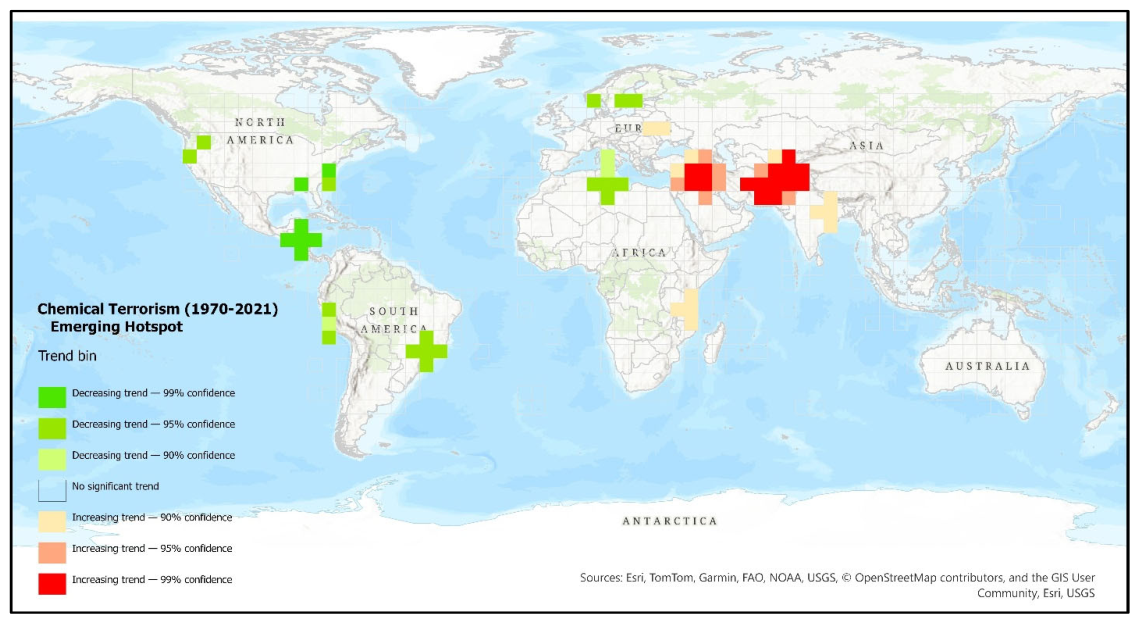
The Emerging Hot Spot Analysis, conducted using 250 km spatial bins and 3-year temporal intervals, showed that most spatial locations were classified as No Pattern Detected, indicating that most analyzed areas did not exhibit a statistically significant emerging hot or cold-spot pattern during 1970–2021. The main hot-spot patterns were concentrated in two regions: the Middle East, centered broadly on Iraq and adjacent areas, and South/Southwest Asia, particularly the Afghanistan-Pakistan region. The significant locations were classified as consecutive hot spots, indicating an uninterrupted sequence of statistically significant hot-spot conditions during the most recent time intervals.
The trend-bin results further showed statistically significant increasing trends in these regions. The strongest increasing trends were observed in the Afghanistan-Pakistan region and the Middle East, with several bins significant at the 95% and 99% confidence levels. Additional increasing trends at the 90% confidence level were observed in scattered areas of Europe, eastern Africa, and South Asia. In contrast, statistically significant decreasing trends were observed in scattered parts of North America, Central America, South America, Europe, and North Africa. Overall, the results indicate that consecutive hot spots and the strongest upward trends were concentrated primarily in the Middle East and the Afghanistan—Pakistan region, whereas decreasing trends were more geographically dispersed (Figure 7 and Figure 8).
As GTD records were unavailable for 1993, Optimized Hot Spot Analysis was conducted as a supplementary spatial-only sensitivity analysis to assess whether the hot-spot pattern remained robust despite the temporal gap. The results showed statistically significant hot spots mainly in the Middle East and South/Southwest Asia, particularly around Iraq, Afghanistan, Pakistan, and neighboring areas. Most other regions were not significant. These findings supported the Emerging Hot Spot Analysis by confirming that the main spatial concentrations remained consistent when the temporal dimension was excluded (Supplementary Figure S1).
4. Discussion
Although chemical terrorism remained rare in the broader terrorism context, our study found a statistically significant increase in the frequency of these incidents over the period. Similarly, a previous study identified 292 (0.19%) chemical terrorism incidents of all GTD events between 1970 and 2015 [24]. Additionally, another study reported that chemical attacks constituted 0.21% of GTD incidents from 1970 to 2017 [28], while their mean annual frequency increased from 6.0 in 1970–2011 to 24.9 in 2011–2017, possibly due to conflicts in Afghanistan (2012, 2015) and Syria and Iraq (2016). Consistent with our findings, another study found that chemical incidents increased sharply after 2011 and peaked at 32 in 2016, and then declined to 3 to 5 cases annually by 2020–2021. Although COVID-19 restrictions may have contributed, the decline had already started before the pandemic [17]. Despite their rarity, these incidents can have disproportionate human, psychological, and public health consequences [31]. For instance, public perception may enhance the social and psychological consequences of terrorist attacks for achieving political or ideological goals, leading to fear, which is disproportionate to the actual risk of harm [42]. For timely prevention and response, governments should enact chemical-security legislation, implement integrated early-warning policies, and fund research to develop and validate predictive risk models. Moreover, preparedness should prioritize private citizens and educational institutions, strengthen blast-injury response, train responders to manage choking agents, vesicants, and caustics, and incorporate mental health support and psychological first aid to address the short- and long-term impacts of traumatic incidents.
Additionally, our study found that the attack success rate was significantly associated with target type, and attacks targeting private citizens and property were successful in most cases. Civilian and educational sites may be easier to attack because they are open and lightly protected. Their visibility may also increase publicity and fear (Li, 2005). Moreover, terrorist operational success largely depends on terrorist resources and target vulnerability, while successful negotiations depend on the relative strengths of the terrorist actors and bargaining position [44]. Stakeholders’ responses should remain targeted and proportionate to avoid strengthening violent groups [45,46]. However, we found that perpetrator group effectiveness varied descriptively, and attacks by unknown perpetrators were about half of all attacks, and about three-fourths of these were classified as successful. Unknown groups refer to the attribution and data limitation of insufficient evidence linking terrorist groups or individuals. The Syrian civil war and the rise of the Islamic State of Iraq and the Levant (ISIL) have both contributed to regional instability and increased the operational space for extremist groups [47,48,49]. Terrorist groups in Iraq and Syria reportedly used chlorine, sulfur mustard, and other toxic agents, demonstrating tactical adaptation and the exploitation of weak regulatory and security systems [47,49,50]. Moreover, persistent terrorist violence in Iraq stems from the institutional collapse, sectarian polarization, and insurgency that followed the 2003 Iraq War, including the rise of Al-Qaeda-linked groups [51,52]. Conflict environments have enabled armed groups to acquire toxic industrial chemicals and incorporate chemical agents into insurgent and terrorist operations [28,31]. Both the EU and the United States must cooperate with Asian and African countries on matters of security while respecting the sovereignty and territorial integrity of these states. Such cooperation can contribute to mitigating transnational threats and advancing regional and international peace and stability [53].
Furthermore, incident frequency, fatalities, and injuries varied across countries in our study. However, after 2001, the spatial pattern shifted eastward and concentrated around the Afghanistan–Pakistan region. Terrorism has become increasingly concentrated in conflict-affected regions, especially MENA, which accounted for 36.1% of global attacks and 49.3% of terrorism-related deaths during 2002–2018, largely driven by civil conflict [19,54]. The concentration of incidents in Afghanistan and Pakistan may reflect decades of armed conflict and political instability that weakened Afghan state institutions and governance [55]. The porous and mountainous Afghanistan–Pakistan border also facilitated militant movement and logistical support in areas with limited state control [56]. These findings highlight the need for stronger cross-border cooperation, intelligence sharing, border governance, and institutional capacity to reduce chemical-terrorism risks in the region. Moreover, there is an urgent need for country-specific preparedness, including chemical-event surveillance, hospital surge capacity, decontamination, and mass-casualty response training.
Our study found that there are significant regional differences in chemical attacks, with the highest success rates in South Asia, the Middle East, and North Africa. Similarly, Demir and colleagues found that region and target or victim type were significant predictors of successful terrorist incidents [57]. Weak state capacity also creates operational opportunities for terrorist groups [58]. Also, the threat of CBRN attacks has escalated in recent years because of advancements in technology and terrorist willingness to utilize unconventional weaponry [59]. In South Asia, terrorist attacks are linked to political instability, ethnic conflict, sectarian violence, extremism, and insurgency [60]. However, in MENA, terrorism reflects a lack of political, educational, and financial ability and vulnerability towards demographic factors [61]. MENA governments should strengthen CBRN planning, training, and regional cooperation [62]. Prolonged conflict in Syria and Iraq enabled terrorist groups, particularly the Islamic State, to develop and deploy chemical agents [31,47]. However, the Tokyo subway sarin attack is an example of an event that raised public awareness of the threat of chemical terrorism in non-active war zones, reporting 13 deaths and 6,226 injuries along with long-term physical and psychological effects among survivors [25,36,37]. These incidents underscore the need for policies that strengthen chemical security in non-conflict settings through enhanced surveillance, preparedness, and rapid response mechanisms in civilian spaces, while also incorporating long-term psychological support for survivors, for whom exposure to chemical attacks is often an unexpected and profoundly traumatic experience.
This study has several limitations. First, the dataset primarily relies on media reports, which may contain inaccuracies and reporting biases. GTD documentation may also be affected by restricted reporting, limited independent corroboration, and insufficient transparency in some government sources, resulting in selection bias, underreporting, and unverified incident details. The absence of data for 1993 also creates a gap in the temporal analysis. In addition, the GTD includes only attacks committed by sub-national actors, thereby including non-state organizations while excluding state actors such as national governments. Second, information on specific incidents is sometimes limited and varies in quality, with possible coding errors, missing spatial data, incomplete perpetrator and casualty information, and changes in data-collection methods over time that may influence the spatial and temporal findings. Finally, due to data limitations, the study did not examine seasonal effects across regional contexts, including differences between summer and winter in the Northern and Southern Hemispheres.
5. Conclusions
Overall, this study investigated the spatio-temporal patterns, severity, and operational characteristics of global chemical terrorism incidents recorded in the Global Terrorism Database between 1970 and mid-2021. The findings suggested increasing concentrations in South Asia and the Middle East, particularly in conflict-affected areas, while declining trends were observed in parts of the Americas, Europe, and North Africa. Hotspot regions require targeted surveillance, intelligence sharing, infrastructure protection, and strengthened emergency-response capacity, whereas non-hotspot regions should maintain preventive monitoring to detect emerging threats. Governments should enforce strict controls over the production, storage, transport, and legitimate use of toxic chemicals. Stronger perpetrator-identification systems, cross-border investigations, and enforcement of national and international counter-terrorism laws are also essential.
Supplementary Materials
The following supporting information can be downloaded at the website of this paper posted on Preprints.org. Data are available from the Global Terrorism Database (GTD), maintained by START, University of Maryland. Supplementary materials are provided with this article.
Author Contributions
Conceptualization, G.R. and M.L.; methodology, G.R., M.I.T., and M.L.; data curation, G.R. and M.I.T.; formal analysis, G.R. and M.I.T.; investigation, G.R. and M.I.T.; validation, G.R.; visualization, G.R.; writing—original draft preparation, G.R. and M.I.T.; writing—review and editing, G.R. and M.L.; supervision, M.L. All authors have read and agreed to the published version of the manuscript.
Funding
This research did not receive any specific grant from funding agencies in the public, commercial, or not-for-profit sectors.
Acknowledgments
The authors acknowledge the use of Grammarly and Quillbot for language editing, writing improvement, and refinement of academic wording. All analyses, interpretations, and final decisions regarding the content of the manuscript remain the responsibility of the authors.
Conflicts of Interest
The authors declare that they have no conflicts of interest to report.
References
- Feinberg, M. Emerging Voices: ‘Sovereignty in the Age of Global Terrorism’ What Is the Role of International Organizations? 2016. [Google Scholar] [PubMed]
- Singh, P.P.; Philip, D. Modelling & Analysis of High Impact Terrorist Attacks in India & Its Neighbors. IJGI 2023, 12, 162. [Google Scholar] [CrossRef]
- Sun, C.; Abbas, H.S.M.; Xu, X.; Abbas, S. The Impact of Socio-Economic and Fractionalization Determinants on Terrorism in ESNA. Socio-Econ. Plan. Sci. 2022, 79, 101138. [Google Scholar] [CrossRef]
- Zhu, R.; Hu, X.; Li, X.; Ye, H.; Jia, N. Modeling and Risk Analysis of Chemical Terrorist Attacks: A Bayesian Network Method. IJERPH 2020, 17, 2051. [Google Scholar] [CrossRef] [PubMed]
- START START GTD Codebook. 2020.
- Battikh, J.Y.; Bodolica, V.; Wood, M.O. Disasters Triggered by Natural Hazards and Terrorism: A Bibliometric Network Analysis into the Intellectual Structure of a Cross-Disciplinary Research Field. Int. J. Disaster Risk Reduct. 2022, 77, 103045. [Google Scholar] [CrossRef]
- Tavares, J. The Open Society Assesses Its Enemies: Shocks, Disasters and Terrorist Attacks. J. Monet. Econ. 2004, 51, 1039–1070. [Google Scholar] [CrossRef]
- Krieger, T.; Meierrieks, D. What Causes Terrorism? Public Choice 2011, 147, 3–27. [Google Scholar] [CrossRef]
- Zhang, J.; Zhuang, J. Modeling a Multi-Target Attacker-Defender Game with Multiple Attack Types. Reliab. Eng. Syst. Saf. 2019, 185, 465–475. [Google Scholar] [CrossRef]
- Gassebner, M.; Jong-A-Pin, R.; Mierau, J.O. Terrorism and Electoral Accountability: One Strike, You’re out! 2008, 126–129. [Google Scholar]
- Al-Dahash, H.; Kulatunga, U.; Thayaparan, M. Weaknesses during the Disaster Response Management Resulting from War Operations and Terrorism in Iraq. Int. J. Disaster Risk Reduct. 2019, 34, 295–304. [Google Scholar] [CrossRef]
- Santifort, C.; Sandler, T.; Brandt, P.T. Terrorist Attack and Target Diversity. J. Peace Res. 2013, 50, 75–90. [Google Scholar] [CrossRef]
- Welsh, B. Your Space or Mine? Competition, Control, and the Spatial Profile of Militant Violence against Civilians. J. Peace Res. 2023, 60, 557–572. [Google Scholar] [CrossRef]
- LaFree, G.; Dugan, L. Introducing the Global Terrorism Database. Terror. Political Violence 2007, 19, 181–204. [Google Scholar] [CrossRef]
- Borooah, V.K. Terrorist Incidents in India, 1998–2004: A Quantitative Analysis of Fatality Rates. Terror. Political Violence 2009, 21, 476–498. [Google Scholar] [CrossRef]
- Aydin, B. Global Characteristics of Chemical, Biological, and Radiological Poison Use in Terrorist Attacks. Prehospital Disaster Med. 2020, 35, 260–266. [Google Scholar] [CrossRef] [PubMed]
- Castro-Delgado, R.; Campillo Palma, F.; Fernández-Arce, L.; Uddin, H.; Fernández-Somoano, A. Changing Patterns in Chemical Terrorism 1970–2021. Front. Public Health 2025, 13, 1689809. [Google Scholar] [CrossRef] [PubMed]
- Freytag, A.; Krüger, J.J.; Meierrieks, D.; Schneider, F. The Origins of Terrorism: Cross-Country Estimates of Socio-Economic Determinants of Terrorism. Eur. J. Political Econ. 2011, 27, S5–S16. [Google Scholar] [CrossRef]
- Enders, W.; Sandler, T.; Gaibulloev, K. Domestic versus Transnational Terrorism: Data, Decomposition, and Dynamics. J. Peace Res. 2011, 48, 319–337. [Google Scholar] [CrossRef]
- Martens, M. Chemical, Biological, Radiological and Nuclear Terrorism: The Rise of DAESH and Future Challenges; NATO Parliamentary Assembly, Science and Technology Committee; 2016.
- Tin, D.; Hertelendy, A.J.; Hart, A.; Ciottone, G.R. 50 Years of Mass-Fatality Terrorist Attacks: A Retrospective Study of Target Demographics, Modalities, and Injury Patterns to Better Inform Future Counter-Terrorism Medicine Preparedness and Response. Prehospital Disaster Med. 2021, 36, 531–535. [Google Scholar] [CrossRef] [PubMed]
- Asal, V.H.; Rethemeyer, R.K.; Anderson, I.; Stein, A.; Rizzo, J.; Rozea, M. The Softest of Targets: A Study on Terrorist Target Selection. J. Appl. Secur. Res. 2009, 4, 258–278. [Google Scholar] [CrossRef]
- Polo, S.M.T. The Quality of Terrorist Violence: Explaining the Logic of Terrorist Target Choice. J. Peace Res. 2020, 57, 235–250. [Google Scholar] [CrossRef]
- Santos, C.; El Zahran, T.; Weiland, J.; Anwar, M.; Schier, J. Characterizing Chemical Terrorism Incidents Collected by the Global Terrorism Database, 1970-2015. Prehospital Disaster Med. 2019, 34, 385–392. [Google Scholar] [CrossRef] [PubMed]
- Zhu, R.; Hu, X.; Li, X.; Ye, H. A Personalized and Practical Method for Analyzing the Risk of Chemical Terrorist Attacks. IEEE Access 2020, 8, 81711–81723. [Google Scholar] [CrossRef]
- Li, Z.; Li, X.; Dong, C.; Guo, F.; Zhang, F.; Zhang, Q. Quantitative Analysis of Global Terrorist Attacks Based on the Global Terrorism Database. Sustainability 2021, 13, 7598. [Google Scholar] [CrossRef]
- Tschantret, J. Honor and Terrorism: Cultural Origins of the Severity of Terrorist Attacks. Soc. Sci. Q. 2019, 101, 325–345. [Google Scholar] [CrossRef]
- DeLuca, M.A.; Chai, P.R.; Goralnick, E.; Erickson, T.B. Five Decades of Global Chemical Terror Attacks: Data Analysis to Inform Training and Preparedness. Disaster Med. Public Health Prep. 2021, 15, 750–761. [Google Scholar] [CrossRef] [PubMed]
- De Cauwer, H.; Barten, D.G.; Tin, D.; Mortelmans, L.J.; Lesaffre, B.; Somville, F.; Ciottone, G.R. Terrorist Attacks Against COVID-19-Related Targets during the Pandemic Year 2020: A Review of 165 Incidents in the Global Terrorism Database. Prehospital Disaster Med. 2023, 38, 41–47. [Google Scholar] [CrossRef] [PubMed]
- ICRC International Humanitarian Law Databases; 1993. [CrossRef] [PubMed]
- Emmett, S.R.; Blain, P.G. Chemical Terrorism. Medicine 2020, 48, 182–184. [Google Scholar] [CrossRef]
- Balali-Mood, M.; Shariat, M. Treatment of Organophosphate Poisoning. Experience of Nerve Agents and Acute Pesticide Poisoning on the Effects of Oximes. J. Physiol.-Paris 1998, 92, 375–378. [Google Scholar] [CrossRef] [PubMed]
- Moshiri, M.; Darchini-Maragheh, E.; Balali-Mood, M. Advances in Toxicology and Medical Treatment of Chemical Warfare Nerve Agents. DARU J. Pharm. Sci. 2012, 20, 81. [Google Scholar] [CrossRef] [PubMed]
- Murray, W.; Woods, K.M. The Iran–Iraq War: A Military and Strategic History; Cambridge University Press, 2014; pp. 332–334. [Google Scholar]
- Huber, C. A War of Frustration: Saddam Hussein’s Use of Nerve Gas on Civilians at Halabja (1988) and the American Response; JMU Scholarly Commons, 2019. [Google Scholar]
- Okumura, T.; Takasu, N.; Ishimatsu, S.; Miyanoki, S.; Mitsuhashi, A.; Kumada, K.; Tanaka, K.; Hinohara, S. Report on 640 Victims of the Tokyo Subway Sarin Attack. Ann. Emerg. Med. 1996, 28, 129–135. [Google Scholar] [CrossRef] [PubMed]
- Sugiyama, A.; Matsuoka, T.; Sakamune, K.; Akita, T.; Makita, R.; Kimura, S.; Kuroiwa, Y.; Nagao, M.; Tanaka, J. The Tokyo Subway Sarin Attack Has Long-Term Effects on Survivors: A 10-Year Study Started 5 Years after the Terrorist Incident. PLoS ONE 2020, 15, e0234967. [Google Scholar] [CrossRef] [PubMed]
- Carbon, D.; Arnold, A.; Görgen, T.; Wüller, C. Crisis Communication in CBRNe Preparedness and Response: Considering the Needs of Vulnerable People. Int. J. Disaster Risk Reduct. 2022, 79, 103187. [Google Scholar] [CrossRef]
- Rodriguez-Llanes, J.M.; Guha-Sapir, D.; Schlüter, B.-S.; Hicks, M.H.-R. Epidemiological Findings of Major Chemical Attacks in the Syrian War Are Consistent with Civilian Targeting: A Short Report. Confl. Health 2018, 12, 16. [Google Scholar] [CrossRef] [PubMed]
- Bashir, S.; Bano, S.; Shueb, S.; Gul, S.; Mir, A.A.; Ashraf, R.; Shakeela; Noor, N. Twitter Chirps for Syrian People: Sentiment Analysis of Tweets Related to Syria Chemical Attack. Int. J. Disaster Risk Reduct. 2021, 62, 102397. [Google Scholar] [CrossRef]
- START National Consortium for the Study of Terrorism and Responses to Terrorism (START), 2022.
- Kantorowicz, J.; Kantorowicz-Reznichenko, E.; De Vries, G. Public Perception of Terrorism Attacks: A Conjoint Experiment. J. Peace Res. 2025, 62, 310–327. [Google Scholar] [CrossRef]
- Li, Q. Does Democracy Promote or Reduce Transnational Terrorist Incidents? J. Confl. Resolut. 2005, 49, 278–297. [Google Scholar] [CrossRef]
- Gaibulloev, K.; Sandler, T. Hostage Taking: Determinants of Terrorist Logistical and Negotiation Success. J. Peace Res. 2009, 46, 739–756. [Google Scholar] [CrossRef]
- Lake, D.A. Rational Extremism: Understanding Terrorism in the Twenty-First Century. Dialogue IO 2002, 1, 15–28. [Google Scholar] [CrossRef]
- Carter, D. The Compellence Dilemma: International Disputes with Violent Groups. SSRN J. 2010. [Google Scholar] [CrossRef]
- Strack, C. The Evolution of the Islamic State’s Chemical Weapons Efforts. CTC Sentin. 2017, 10, 13. [Google Scholar]
- HRW, H.R.W. Syria: A Year on, Chemical Weapons Attacks Persist; Human Rights Watch, 2018. [Google Scholar]
- Brooks, J.; Erickson, T.B.; Kayden, S.; Ruiz, R.; Wilkinson, S.; Burkle, F.M. Responding to Chemical Weapons Violations in Syria: Legal, Health, and Humanitarian Recommendations. Confl. Health 2018, 12, 12. [Google Scholar] [CrossRef] [PubMed]
- Schmitt, E. ISIS Used Chemical Arms at Least 52 Times in Syria and Iraq, Report Says. The New York Times, 2016.
- Medina, R.M.; Siebeneck, L.K.; Hepner, G.F. A Geographic Information Systems (GIS) Analysis of Spatiotemporal Patterns of Terrorist Incidents in Iraq 2004–2009. Stud. Confl. Terror. 2011, 34, 862–882. [Google Scholar] [CrossRef]
- Hammood, S.H.; Hassan, Z.F. The Stability of the Political System and Its Impact on Mechanisms to Combat Extremism and Terrorism—Iraq after 2003 Is an Example. Kufa_art 2025, 1, 306–324. [Google Scholar] [CrossRef]
- Abbas, H.S.M.; Xu, X. Topical Dynamics of Terrorism from a Global Perspective and a Call for Action on Global Risk. Int. J. Disaster Risk Reduct. 2024, 110, 104659. [Google Scholar] [CrossRef]
- Kim, W.; Sandler, T. Middle East and North Africa: Terrorism and Conflicts. Glob. Policy 2020, 11, 424–438. [Google Scholar] [CrossRef]
- Schamiloglu, U. Afghanistan’s Endless War: State Failure, Regional Politics, and the Rise of the Taliban. By Larry P. Goodson. Seattle: University of Washington Press, 2001. 264 Pp. $35.00 (Cloth); $22.50 (Paper). J. Asian Stud. 2002, 61, 242–243. [Google Scholar] [CrossRef]
- Shroder, J. Afghanistan’s Development and Functionality: Renewing a Collapsed State. GeoJournal 2007, 70, 91–107. [Google Scholar] [CrossRef]
- Demir, M.; Guler, A.; Ozer, M. Predictors of Successful Terrorism Incidents. Behav. Sci. Terror. Political Aggress. 2024, 16, 482–510. [Google Scholar] [CrossRef]
- De La Calle, L.; Sánchez-Cuenca, I. Rebels without a Territory: An Analysis of Nonterritorial Conflicts in the World, 1970–1997. J. Confl. Resolut. 2012, 56, 580–603. [Google Scholar] [CrossRef]
- Carter, H.; Drury, J.; Amlôt, R. Recommendations for Improving Public Engagement with Pre-Incident Information Materials for Initial Response to a Chemical, Biological, Radiological or Nuclear (CBRN) Incident: A Systematic Review. Int. J. Disaster Risk Reduct. 2020, 51, 101796. [Google Scholar] [CrossRef]
- Chakma, A. Does State Repression Stimulate Terrorism? A Panel Data Analysis on South Asia. J. Polic. Intell. Count. Terror. 2022, 17, 200–217. [Google Scholar] [CrossRef]
- Aroussi, Z.; Hamdaoui, M.; Smida, M. Determinants of Terrorism in the MENA Region: A Bayesian Model Averaging Based Approach. JEA 2024, 3, 37–48. [Google Scholar] [CrossRef]
- Farhat, H.; Alinier, G.; Helou, M.; Galatis, I.; Bajow, N.; Jose, D.; Jouini, S.; Sezigen, S.; Hafi, S.; Mccabe, S.; et al. Perspectives on Preparedness for Chemical, Biological, Radiological, and Nuclear Threats in the Middle East and North Africa Region: Application of Artificial Intelligence Techniques. Health Secur. 2024, 22, 190–202. [Google Scholar] [CrossRef] [PubMed]
Figure 1.
Temporal Analysis of Annual Chemical Terrorism (1970- mid 2021).
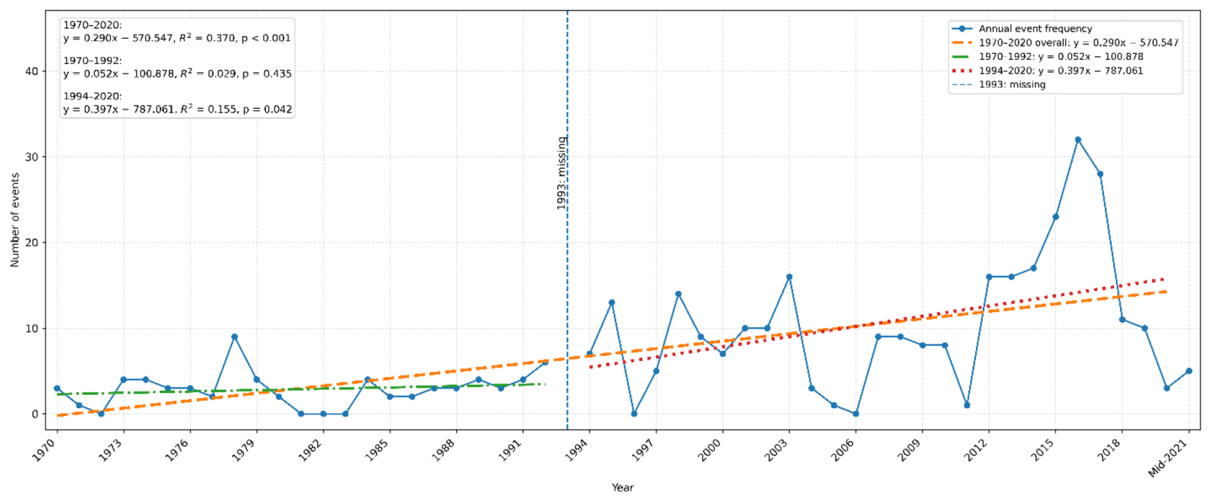
Figure 2.
(a): Temporal Analysis of Annual Fatalities of Chemical Terrorism (1970- mid 2021).
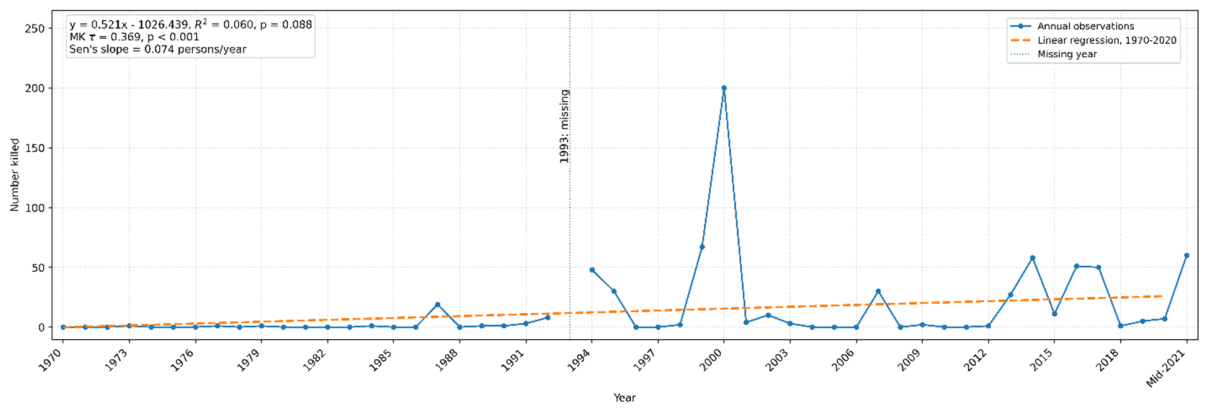
Figure 2.
(b): Temporal Analysis of Annual Injuries of Chemical Terrorism (1970- mid 2021).
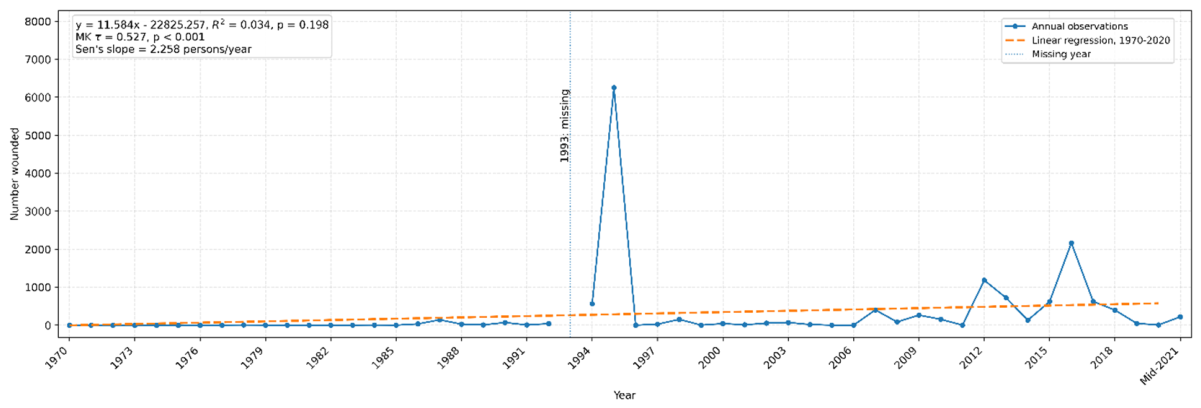
Figure 3.
Global Frequency of Chemical Terrorism Incidents, 1970- mid 2021.
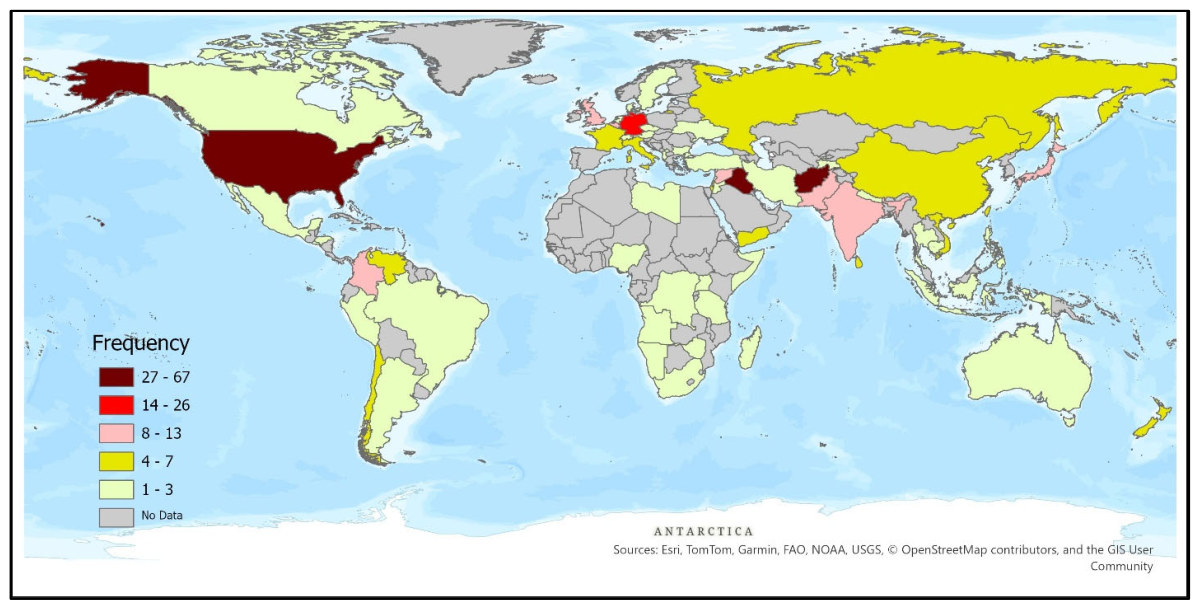
Figure 4.
Global Distribution of Fatalities from Chemical Terrorism Incidents, 1970- mid 2021.
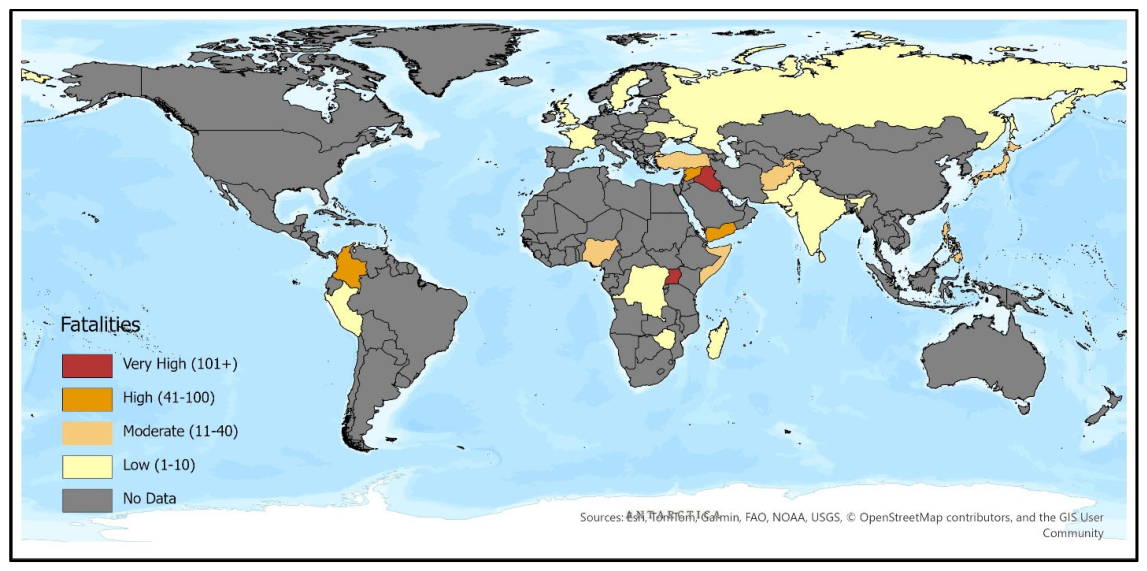
Figure 5.
Global Distribution of Injuries from Chemical Terrorism Incidents, 1970–2021.
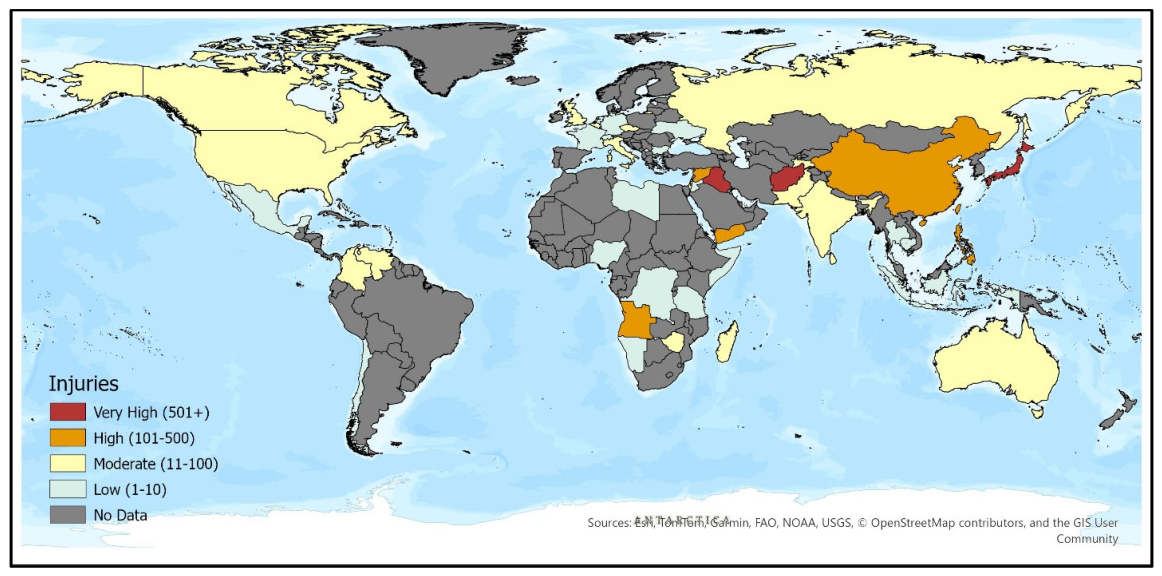
Figure 6.
Mean Centers of Chemical Terrorism Incidents, 1970–2021.
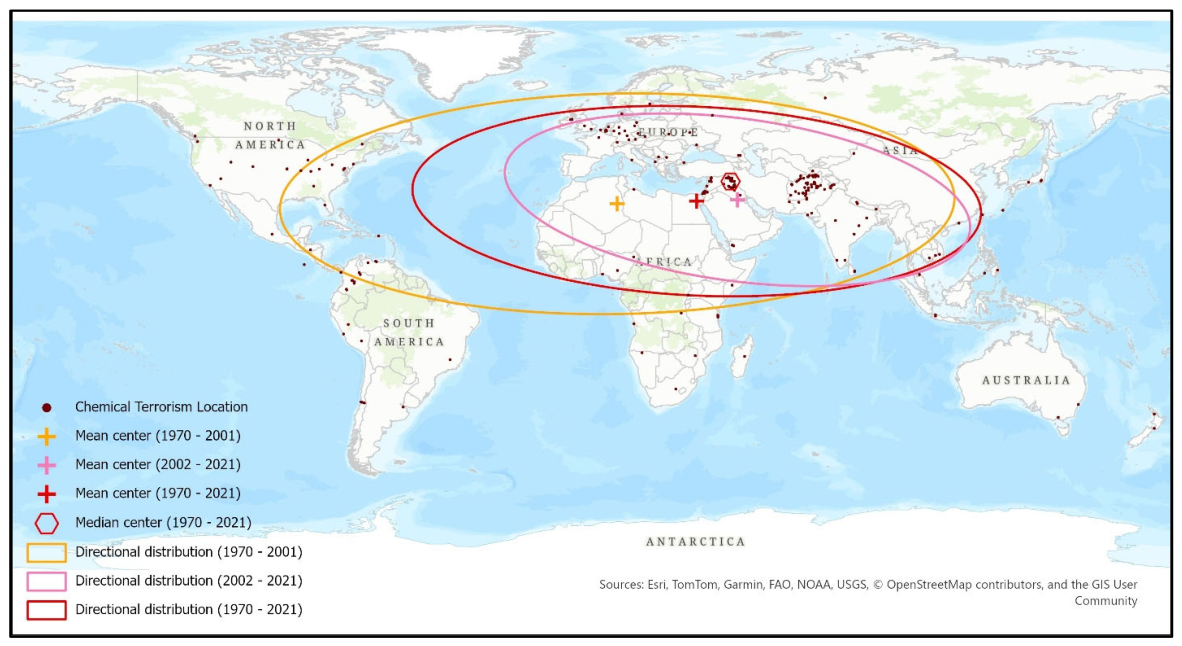
Figure 7.
Emerging Hot Spot Analysis of Chemical Terrorism Incidents, 1970–2021.
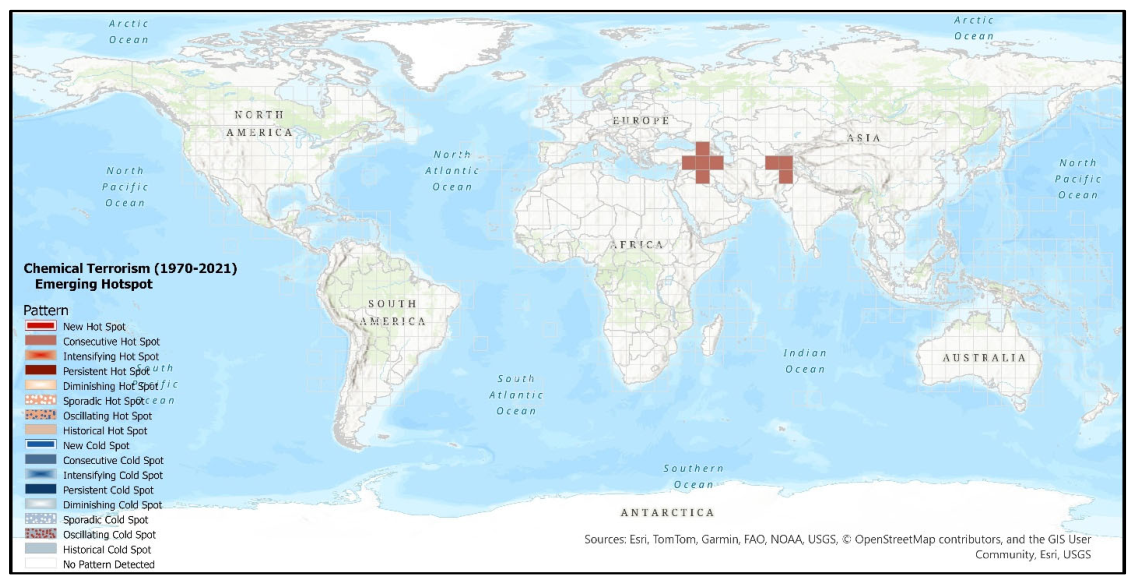
Figure 8.
Trend Bin Count of Emerging Chemical Terrorism Hot Spots, 1970–2021.
Disclaimer/Publisher’s Note: The statements, opinions and data contained in all publications are solely those of the individual author(s) and contributor(s) and not of MDPI and/or the editor(s). MDPI and/or the editor(s) disclaim responsibility for any injury to people or property resulting from any ideas, methods, instructions or products referred to in the content. |
© 2026 by the authors. Licensee MDPI, Basel, Switzerland. This article is an open access article distributed under the terms and conditions of the Creative Commons Attribution (CC BY) license (http://creativecommons.org/licenses/by/4.0/).
Copyright: This open access article is published under a Creative Commons CC BY 4.0 license, which permit the free download, distribution, and reuse, provided that the author and preprint are cited in any reuse.