

Submitted:
24 September 2026
Posted:
25 September 2026
You are already at the latest version
Abstract
Atmospheric turbulence is a major hazard for commercial flight operations. As a result, reliable and easily interpretable meteorological forecast data for this hazard is paramount to the safety of aircraft, crew and passengers. To meet this requirement, Deutscher Wetterdienst (DWD) has further improved their forecast products by blending the traditional deterministic numerical weather prediction of the Eddy-Dissipation-Parameter (EDP) with the probabilistic forecast to exceed the severe turbulence threshold of the EDP from its operational ensemble prediction system (EPS). Building on those results and inspired by an agile co-design approach with key users, a turbulence advisory was conceived which condenses three-dimensional spatial information into two dimensions in order to further support situational awareness and complement traditional aeronautical meteorological charts. In this technical note, the necessity for products of this kind is motivated and their design and specifications are briefly explained.
Keywords:
turbulence
; aeronautical meteorology
; situational awareness
; probabilistic forecasting
; decision making
1. Introduction
Convection and lightning strikes associated with thunderstorms and turbulence generated by mountain waves (mountain wave turbulence, MWT), wind shear (clear air turbulence, CAT) as well as convectively induced turbulence (CIT) are the most significant meteorological hazards for aviation [1,2]. They pose potentially high risks to aircraft as well as to crew and passengers due to lightning strikes and structural damage to the airframe. Short-term avoidance leads to rerouting and increased fuel consumption. As a result, multiple discussions with our key customers like Deutsche Lufthansa, Deutsche Flugsicherung (DFS) and Eurocontrol's Maastricht Upper Area Control (MUAC) have reliably led to requirements with the highest priority concerning the accurate and timely prediction and warning of these phenomena for users among the commercial airlines industry like pilots, dispatchers and air traffic controllers to mitigate these risks and minimize operational impact. This is becoming increasingly important as research shows that climate change will only result in an increase in turbulence [3,4].
Thus, numerous attempts to forecast meteorological variables associated to those hazards have been made and many meteorological service providers offer products to aviation users. In the case of thunderstorms these services usually comprise nowcasting systems based on radar, satellite and lightning data to forecast the very short-term movement of existing convective cells by utilizing reflectivities, brightness temperatures and lightning strike information. Numerical weather prediction based forecast variables associated with convection like CAPE (Convectively Available Potential Energy), or the lightning potential index (LPI), rain rates or synthetic radar images are utilized for longer lead times extending beyond the 1-2h nowcasting scale for up to several hours and even days [5].
For the model-based prediction of en-route turbulence at cruising altitude, the common forecast variable is the Eddy-Dissipation-Rate (EDR) or the directly related Eddy-Dissipation-Parameter which derive from the prognostic equation of the turbulent kinetic energy (TKE). The TKE describes the spatial and temporal energy propagation associated with turbulence from large to small scales toward heat. EDP is directly related to TKE which in turn is objectively proportional to turbulence intensity. Turbulence nowcasting has historically been less successful as the sole application of remote sensing based methods has fallen short of reliably capturing turbulence patterns [6]. However, in recent years a significant increase of interest in turbulence nowcasting due to EDR-measurement programs originating from the private sector [7], and the utilization of those data additionally to the remote sensing to artificial intelligence driven algorithms [8,9].
At Deutscher Wetterdienst (DWD), numerical weather prediction (NWP)-based deterministic forecasting of the EDP has been in operational use for more than ten years [10]. In case of the global model this means a 3D EDP forecast is computed based on the ICOsahedral Nonhydrostatic (ICON)-Global NWP model four times a day (00, 06, 12 and 18 UTC) with 0.125 deg. horizontal resolution and 1000ft (10FL) vertical resolution between FL100 and FL450 for up 36h in the future and with 1h forecast increments. The counterpart with European coverage provided by ICON-EU has a higher hor. resolution of 0.0625 degrees and extends out to 48h. The other parameters are identical with the global dataset. From this gridded data polygons, which enclose corresponding severity areas, are derived by evaluating thresholds for EDP values of light (EDP>0.1 m^(2/3) per s), moderate (EDP>0.2 m^(2/3) per s), severe (EDP>0.34 m^(2/3) per s) and severe+/extreme (EDP>0.45 m^(2/3) per s) turbulence in each vertical layer. These severity thresholds are based on values published by the International Civil Aviation Organization (ICAO) [11]. For severe turbulence that threshold would be 0.45 m^(2/3) per s. However, as other authors have noted, when comparing the frequency of occurrence for severe turbulence defined by those thresholds with the in-flight experiences of pilots, the impression persist that the thresholds are too high as the majority of events regarded as severe by pilots falls actually in the range between 0.34 m^(2/3) per s and 0.45 m^(2/3) per s [12]. A modification of the ICAO thresholds has previously been suggested in studies carried out by the National Center for Atmospheric Research (NCAR) as early as 2014 as can be gathered from [13]. As a result, after careful consideration and in close coordination with key users, the figures used for this product development have been lowered as stated above. In case of the European product, another intermediate severity of EDP>0.27 m^(2/3) per s (mod/severe) is added particularly to support MUAC's decision making. Both variants have seen extensive application at controller working positions of Air Navigation Service Providers (ANSPs) as well as in electronic flight bags (EFBs) for pilots at the flight decks of several international airlines. However, recently two new user requirements have become prominent. The first one is owing to the desire to attribute a probability of occurrence to the data as a measure of forecast quality while the second one relates to the simplification of the highly complex multidimensional global output in order to make it more accessible and actionable for users.
The scope and intention of the following article is to explain the design of the resulting products and the motivation to do so. It does not deal with the quality of the turbulence forecast itself, for example with respect to measurements or other competing forecast products. The figures are illustrating the separate components and the results as well as the different design steps.
In the following section 2 “Materials and Methods”, a short description of the probabilistic turbulence parameter forming the basis for the novel products is given. The design and motivation of these products is discussed in section 3 “Results” and the various computational steps are visually highlighted. This is followed by section 4 “Discussion” which presents the ability of the products to compress information content and the associated computational cost before underlining some limitations of the products. Finally, section 5 “Conclusions” deals with preliminary user feedback and further plans to apply the presented concept to other meteorological hazards. There is a list of abbreviations at the end of the text.
2. Materials and Methods
Parallel to the deterministic EDP, a probabilistic EDP (EDP probabilistic, EDPP) giving the probability to exceed the severe turbulence threshold of 0.34 m^(2/3) per s had been calculated globally from DWD's 40 member ensemble prediction system (EPS) ICON-EPS for several years [14]. EDPP has a horizontal resolution of 0.25 degrees and ranges in the vertical from FL100 to FL450 in steps of 10FL. A new forecast is provided every 6 hours for up to 36 hours in the future with 1h increments. This grid data is categorized for 3 levels of probability of occurrence of severe turbulence (10-24% (less likely), 25-39% (likely) and >=40% (very likely) and representative polygons are produced. See Figure 1 for an example of a turbulence structure over Spain described by those three aforementioned probabilistic thresholds. However, in discussions with the end user community, mostly pilots of the Lufthansa Group, it became clear that EDPP had never seen the same level of acceptance as isolated product compared to the deterministic EDP. This can be explained by its somewhat unconventional probabilistic nature, compared to traditional deterministic products to which end-users are more accustomed to, which makes it harder to understand and apply in typical user scenarios. Thus, the concrete user requirement was to provide a reliable estimate about the quality of the forecast without introducing an additional completely new product and without overly changing the familiar existing information of the turbulence polygons. This would also decrease the need for adaptation in interpretation and extensive new user training.
3. Results
3.1. EDP2.0
As a result, EDP and EDPP were blended into a new combined product. This new EDP2.0 combines the essential advantages of both sources of information. In order to reduce the computational burden associated with processing the involved large amounts of gridded data to combine both products directly, the intersection of all severe deterministic polygons with the EDPP probability polygons is computed and the highest matching value is assigned to the resulting intersection, see Figure 2 and Figure 3. The moderate and extreme polygons remain purely deterministic. Thus, de-facto a hybrid product is created which allows the user to quantify the probability to encounter severe turbulence along the flight path. The severe stage was chosen for this additional processing step as it is usually this severity which entails operationally consequences by pilots and dispatchers by adjusting the flight trajectory in order to avoid turbulence areas. The probability is categorized in three stages. One way to visually discriminate the categories is by the line style of the polygon, as is displayed by DWD's own future briefing portal, see Figure 4. The resulting product, has the same specifications as the underlying purely deterministic original EDP, see above.
3.2. Turbulence Advisory (TURADORY)
Although EDP2.0, the latest version of EDP product, improves the applicability of the information in general, at the same time it also increases complexity as an additional dimension is added in form of the probability. This means the amount of data to transmit and process is further increased which can be disadvantageous to in-flight updates of EFBs. Based on those principal characteristics, user feedback had underlined several actual points of criticism of the current DWD products and potential chances to supplement other sources of turbulence information as well. Firstly, with the multidimensional turbulence data, the user needs to review and analyze the data with great scrutiny to extract relevant information. This can be challenging, especially when done manually with little time. Additionally, discussions with end-users who have limited computer resources and access to dedicated high-performance visualization systems highlighted that these customers might struggle to timely process and display multidimensional information like EDP2.0 or EDPP. Finally, traditional fixed time charts like significant weather charts have usually shortfalls like a shorter forecast validity and smaller temporal resolution of the forecast as they are produced every six hours (00, 06, 12 and 18 UTC) for +24 hours. Other products like official manually produced turbulence SIGMETS have only limited maximum validity of only a few hours, usually 4h, and can also only be issued few hours in advance of the expected event, also usually 4h. Moreover, due to the general nature of the latter to be representative for extended periods of time the horizontal extend often exaggerates the actual horizontal coverage of the phenomena. Thus, the goal was to provide an automatic product which condenses information spatially to a reasonable extend to serve a quick overview of the turbulence situation across larger domains and which can keep up with the technical and scientific advances of numerical weather prediction. Therefore, based on the EDPP, a TURbulence ADvisORY (TURADORY) has been developed. Consequently, TURADORY is intended to supplement existing manually generated ICAO-regulated products like significant weather charts and turbulence SIGMETs by providing spatially and temporally higher resolved automatic data. Users are provided a large-scale overview before being able to drill down to a specific location or flight trajectory by applying EDPP and EDP2.0. Extending beyond this use case centered on a manual application of the data would be the direct implementation of TURADORY in flight planning software of the airline's dispatch. This is also relevant in the context of very recent research [15], which reveals that elaborate 3D visualizations of aeronautical weather data do not lead to better situational awareness among commercial pilots when compared to classical 2D representations.
The product is generated by computing the 2D projection of the 3D turbulence structure of the vertically resolved EDPP polygons for the above given three probabilities between FL180 to FL450 onto the surface of the earth, see Figure 5 and Figure 6. Please note, that the grayscale on the horizontal plane in Figure 5 is simply an effect of the vertical aggregation of the individual polygon projections and conveys no further information. This step is followed by a grouping of the resulting "shadows" if they are closer than a configurable threshold based on model resolution. Subsequently, shadows with an area below an equally resolution dependent limit are eliminated. Finally, a concave hull is generated to envelope the remaining areas in order to describe the final expanse of the turbulence area, see Figure 7.
In order to conserve a reasonable amount of data which provides at the same time intuitive information about the horizontal and vertical turbulence distribution originally present, several spatial measures are computed and added to each of the resulting polygons as metadata. Firstly, the area fraction which was occupied by severe turbulence in each flight level for each probability is given as one of four categories (locally <25%, isolated 25%-49%, occasional 50%-74%, frequent 75%-100%). Secondly, the altitude in terms of FL is denoted where the area fraction was at a maximum together with the actual fraction. For an example of the final product see Figure 8. The accompanying metadata which forms the advisory for each polygon can be presented in two different variants. The first would be to sort the horizontal turbulence coverage for each polygon (=probability threshold) in increasing order, see Table 1, which was implemented for the production of Figure 8. The second way to present the results to the user would be to indicate the turbulence areas with decreasing altitude regardless of horizontal coverage, see Table 2, which was the result of a discussion with Lufthansa dispatch. Variant 2 has the practical advantage that the user can more intuitively identify vertical areas where there is no severe turbulence predicted or at least where it is predicted with smaller probability of occurrence and/or smaller horizontal coverage, respectively, in order to plan for a path to cross it. For the following explanations we assume a flight enroute at a typical altitude of FL350. In the example presented by Figure 8 and judging by Table 2, it would then likely be most preferable to either climb to FL370 or to descend to FL260 in order to encounter only the predicted localized spots of severe turbulence with a maximum of 10% probability of occurrence. Below FL260 there is no severe turbulence predicted at all. However, if the flight trajectory does not allow for those presumably significant changes in altitude, then an obvious interpretation of the advisory would be to avoid FL350 as there TURADORY predicts to be the location of the largest severe turbulence coverage (occasional, up to 75% coverage, actually 67% coverage due to the additional maximum attribute) with the highest probability (>40%) of occurrence and rather prefer to fly at FL330 as the lowest coverage (locally, <25%) with a maximum of 25% percent probability is predicted to prevail at that altitude. As the above example illustrates, the advisory information provides the user with essential information at a glance, which then can be refined by consulting vertically resolved products like EDP2.0 for a more detailed perspective on the turbulence situation. For comparison the official turbulence SIGMET of the Spanish national meteorological service AEMET, which is based on different data, is shown as a reference in Figure 9. In comparison to the SIGMET, no future trend in intensity and location is given in form of metadata by TURADORY, as this information is already explicitly contained in the forecast product itself, for example by employing the time slider in the appropriate visualization system, see the lower part of Figure 8. Note that this TURADORY forecast is for a 13h lead time (model run from 00 UTC, forecast shown for 13 UTC).
4. Discussion
Concerning the reduction of data, it is difficult to arrive at reliable figures as this depends largely on the global turbulence and thus weather situation. Based on a case study of global forecast data, we found the following typical orders of magnitude for the number of global polygons for the three products EDP2.0, EDPP, and TURADORY. EDP2.0 described the global turbulence situation by producing ca. 2.5 million polygons, followed by EDPP with 500.000 polygons and finally TURADORY with 5.000 polygons. This is highlighting the ability of TURADORY to significantly compress data amount which should generally hold. To put this into perspective it is worth noting that typical processing times on DWD’s supercomputer for generating the first 48 hours of ensemble results are ca. 40 minutes. To compute EDPP from this model output an additional ca. 30 minutes and for TURADORY a further additional 6 minutes are necessary. This underlines the fact that TURADORY comes at almost negligible additional computational expense.
However, the following limitations of the described approaches have to be taken into account. Ideally probabilistic and deterministic model results for generating EDP2.0 would have the same horizonal resolution. This is not yet the case, as the EPS runs at 0.25 degrees while the deterministic model has 0.125 degrees horizontal resolution leading to a less than perfect spatial match of corresponding turbulence predictions of the severe EDP and EDPP. Furthermore, the hybrid approach is only carried out for severe turbulence and no probabilistic information for moderate and extreme severity is given. It might be necessary to extend the approach to the moderate severity in order to facilitate decision making as can be gathered from MUAC’s demand for this stage. Extreme severity does not need to be treated in that context, as those areas are always avoided. Finally, no objectively measured turbulence data is presently at our disposal. Thus, it is not possible to systematically assess the forecast quality and gain insights on the actual probability of occurrence beyond case studies which have been carried out with actual turbulence encounters.
Also, both products will make use of the increase of horizontal resolution from 26km to 20km of the ICON-Global Ensemble Prediction System in the second half of 2026. For the European domain ICON-EU-EPS will see a resolution increase from 13 to 10 km while also being extended by about 450km to the south.
EDP2.0 has become operational during spring of 2026 while TURADORY is expected to follow during the second half of 2026.
As a result, TURADORY might not only be a viable product to complement traditional aeronautical meteorological charts, but could also be valuable for end users who do not enjoy high bandwidth network connections of their aircraft to download multidimensional turbulence data in-flight.
5. Conclusions
As a result of the recent improvements described above, user feedback confirms that the EPS-based turbulence forecast has significantly matured and gained in applicability to the communicated use cases of key customers. While the underlying Ensemble Predictions System as such is certainly expected to be further developed by DWD's R&D-department in light of the general advances in NWP, it is of key importance to further develop and apply the described methods to other meteorological variables representative of weather hazards. Based on the Icon CONvection forecast ICONV [5], a CONVECTORY (CONVECTion advisORY) and based on DWD's in-flight Advanced Diagnosis and Warning system for aircraft ICing Environments (ADWICE) [16], an ICORY (ICing advisORY) could be developed which further supplement existing regulated products and condenses information for improved application at ANSPs and airlines alike.
Lastly, while EDP2.0 has now successfully combined deterministic and probabilistic forecasts, it also calls for a further integration of EDR measurements in form of a turbulence nowcast, in order to work towards closing the gap between nowcasting and forecasting of turbulence.
Author Contributions
Conceptualization, A.B: and M.J., methodology, S.S., A.B., I.M. and M.J, software, A.B., S.S., validation, A.B., S.S., I.M and M.J., writing – original draft preparation, MJ, writing – review and editing, S.S., I.M., A.B. and M.J., visualization, S.S., A.B., project administration, M.J, A.B. All authors have read and agreed to the published version of the manuscript.
Funding
This research received no external funding.
Data Availability Statement
The datasets presented in this article are not available to the general public because of cost recovery regulations of the aeronautical meteorological service of Germany. Data which was specifically generated for aviation users is restricted to this user community. Consequently, all operational aeronautical meteorological products of DWD are available for download via the DWD Geoserver and/or the aviation data server for aviation users only. If not stated otherwise, all cartographic visualizations have been prepared with DWD's new WebGIS aviation briefing portal which is currently under development and will also make the data visually available to the aviation user community.
Acknowledgments
We thank numerous colleagues from Lufthansa Airlines, Swiss Airlines, Condor Airlines, Lufthansa Systems, SITA and PACE Aerospace Engineering & IT for their valuable remarks and discussions which have led to a fundamental improvement of the products. We also thank our colleague Richard Müller for the helpful remarks during the preparation of the manuscript which significantly improved the text. We would also like to thank our colleagues Sven Amend and Sabrina Wortmann for their perseverance in developing the DWD WebGIS visualization platform and for making these new products readily available in this system which has greatly assisted improvements and user consultation. Finally, we would like to thank the three anonymous reviewers, whose helpful remarks have substantially improved the paper.
Conflicts of Interest
The authors declare no conflicts of interest.
Abbreviations
The following abbreviations are used in this manuscript:
| ADWICE | Advanced Diagnosis and Warning system for aircraft ICing Environments |
| AEMET | Agencia Estatal de Meteorología |
| ANSP | Air Navigation Service Provider |
| CAPE | Convectively Available Potential Energy |
| CAT | Clear Air Turbulence |
| CIT | Convectively Induced Turbulence |
| CONVECTORY | Convection Advisory |
| DFS | Deutsche Flugsicherung |
| DWD | Deutscher Wetterdienst |
| EDP | Eddy-Dissipation-Parameter |
| EDPP | Eddy-Dissipation-Parameter Probabilistic |
| EDR | Eddy-Dissipation-Rate |
| EFB | Electronic Flight Bag |
| EPS | Ensemble Prediction System |
| FL | Flight Level |
| GIS | Geographic Information System |
| ICAO | International Civil Aviation Organization |
| ICON | ICOsahedral Nonhydrostatic |
| ICONV | ICON CONVection |
| ICORY | Icing advisory |
| LPI | Lightning Potential Index |
| MUAC | Maastricht Upper Area Control |
| MWT | Mountain Wave Turbulence |
| NCAR | National Center for Atmospheric Research |
| NWP | Numerical Weather Prediction |
| R&D | Research and Development |
| SIGMET | Significant Meteorological information |
| TKE | Turbulent Kinetic Energy |
| TURADORY | Turbulence Advisory |
References
- Turning aviation research into safer skies. Available online: https://wmo.int/resources/meteoworld/meteoworld-april-2026/turning-aviation-research-safer-skies (accessed on 23 07 2026).
- Gultepe, I.; Sharman, R.; Williams, P.D.; et al. A Review of High Impact Weather for Aviation Meteorology. Pure Appl. Geophys. 2019, 176, 1869–1921. [Google Scholar] [CrossRef]
- Kim, S.H.; Kim, J.H.; Chun, H.Y.; et al. Global response of upper-level aviation turbulence from various sources to climate change. npj Clim. Atmos. Sci. 2023, 92, 6. [Google Scholar] [CrossRef]
- Williams, P.D.; Storer, L.N. Can a climate model successfully diagnose clear-air turbulence and its response to climate change? Q. J. R Meteorol. Soc. 2022, 148, 1424–1438. [Google Scholar] [CrossRef]
- Müller, R.; Barleben, A. Data-Driven Prediction of Severe Convection at Deutscher Wetterdienst (DWD): A Brief Overview of Recent Developments. Atmosphere 2024, 15, 499. [Google Scholar] [CrossRef]
- Barleben, A.; Haussler, S.; Müller, R.; Jerg, M. A Novel Approach for Satellite-Based Turbulence Nowcasting for Aviation. Remote Sens. 2020, 12, 2255. [Google Scholar] [CrossRef]
- IATA – Turbulence Aware Platform. Available online: https://www.iata.org/en/services/data/safety/turbulence-platform/ (accessed on 23 07 2026).
- Lee, Y.; Lee, D.-B.; Kim, J.-H. Machine learning-based turbulence intensity estimation near convective clouds in East Asia using GK-2A satellite observations. Geophys. Res. Lett. 2025, 52, e2025GL119119. [Google Scholar] [CrossRef]
- Lee, M. H. F.; Sprenger, M. Clear-air turbulence derived from in situ aircraft observation – a weather feature-based typology using ERA5 reanalysis. Weather Clim. Dynam. 2025, 6, 1583–1604. [Google Scholar] [CrossRef]
- Goecke, T.; Machulskaya, E. Aviation Turbulence Forecasting at DWD with ICON: Methodology, Case Studies, and Verification. Mon. Wea. Rev. 2021, 149, 2115–2130. [Google Scholar] [CrossRef]
- International Civil Aviation Organization (ICAO). Annex 3: Meteorological Service for International Air Navigation. 2025. [Google Scholar] [CrossRef]
- Shao, J.; Li, Y.; Leung, Y.Y.; Yu, Z.; Wu, K.; Gu, W.; Bai, Y.; Chan, P.-W.; Zhuang, Z. A Comparative Study of Pilot Reports and In Situ EDR Measurements of Aircraft Turbulence. Atmosphere 2025, 16, 1414. [Google Scholar] [CrossRef]
- Sharman, R.; Cornman, L.B.; Meymaris, G.; Pearson, J.; Farrar, T. Description and Derived Climatologies of Automated In Situ Eddy-Dissipation-Rate Reports of Atmospheric Turbulence. J. Appl. Meteorol. Climatol. 2014, 53, 1416–1432. [Google Scholar] [CrossRef]
- Zängl, G.; Reinert, D.; Rípodas, P.; Baldauf, M. The ICON (ICOsahedral Non-hydrostatic) modelling framework of DWD and MPI-M: Description of the non-hydrostatic dynamical core. Q.J.R. Meteorol. Soc. 2015, 141, 563–579. [Google Scholar] [CrossRef]
- Sarbach, A.; Kwok, T. C. K.; Kiefer, P.; Raubal, M. 2D versus 3D aviation weather visualisations. Ergonomics 2025, 68, 1939–1952. [Google Scholar] [CrossRef] [PubMed]
- Kalinka, F.; Roloff, K.; Tendel, J.; Hauf, T. The In-flight icing warning system ADWICE for European airspace. Current structure, recent improvements and verification results. Meteorol. Z. 2017, 26, 441–455. [Google Scholar] [CrossRef]
Figure 1.
EDPP example over the Iberian Peninsula.
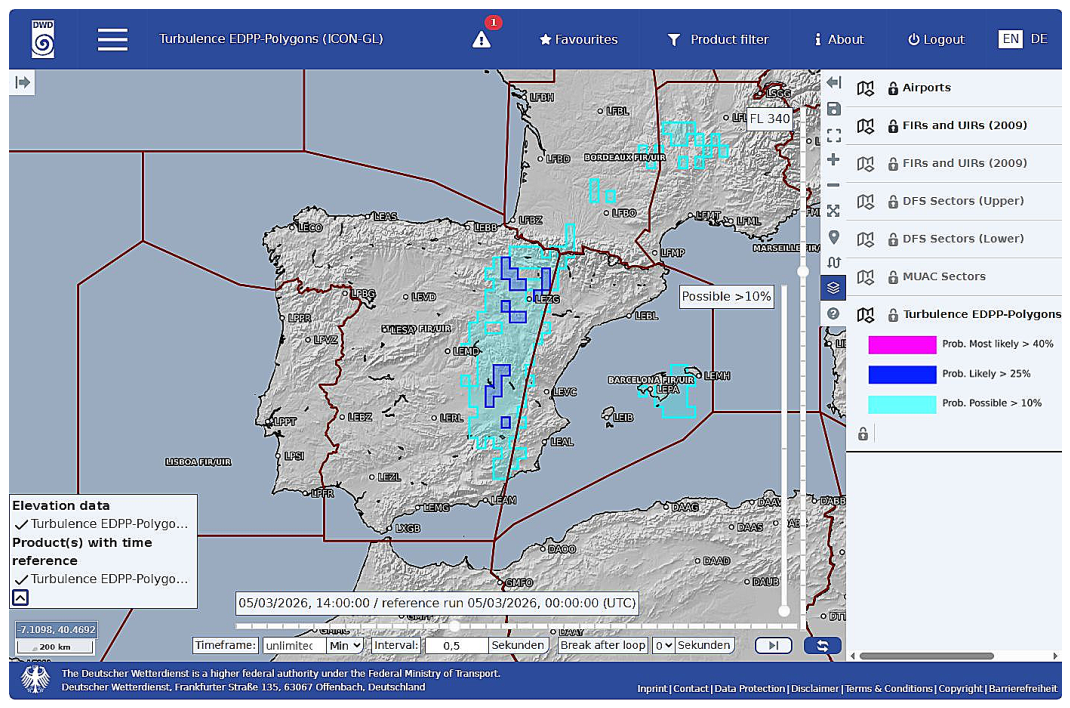
Figure 2.
Deterministic EDP as heatmap and EDPP (probability of exceeding the severe turbulence threshold) depicted as contours to highlight the selection of the intersection. Extracted from the NinJo meteorological workstation.
Figure 2.
Deterministic EDP as heatmap and EDPP (probability of exceeding the severe turbulence threshold) depicted as contours to highlight the selection of the intersection. Extracted from the NinJo meteorological workstation.
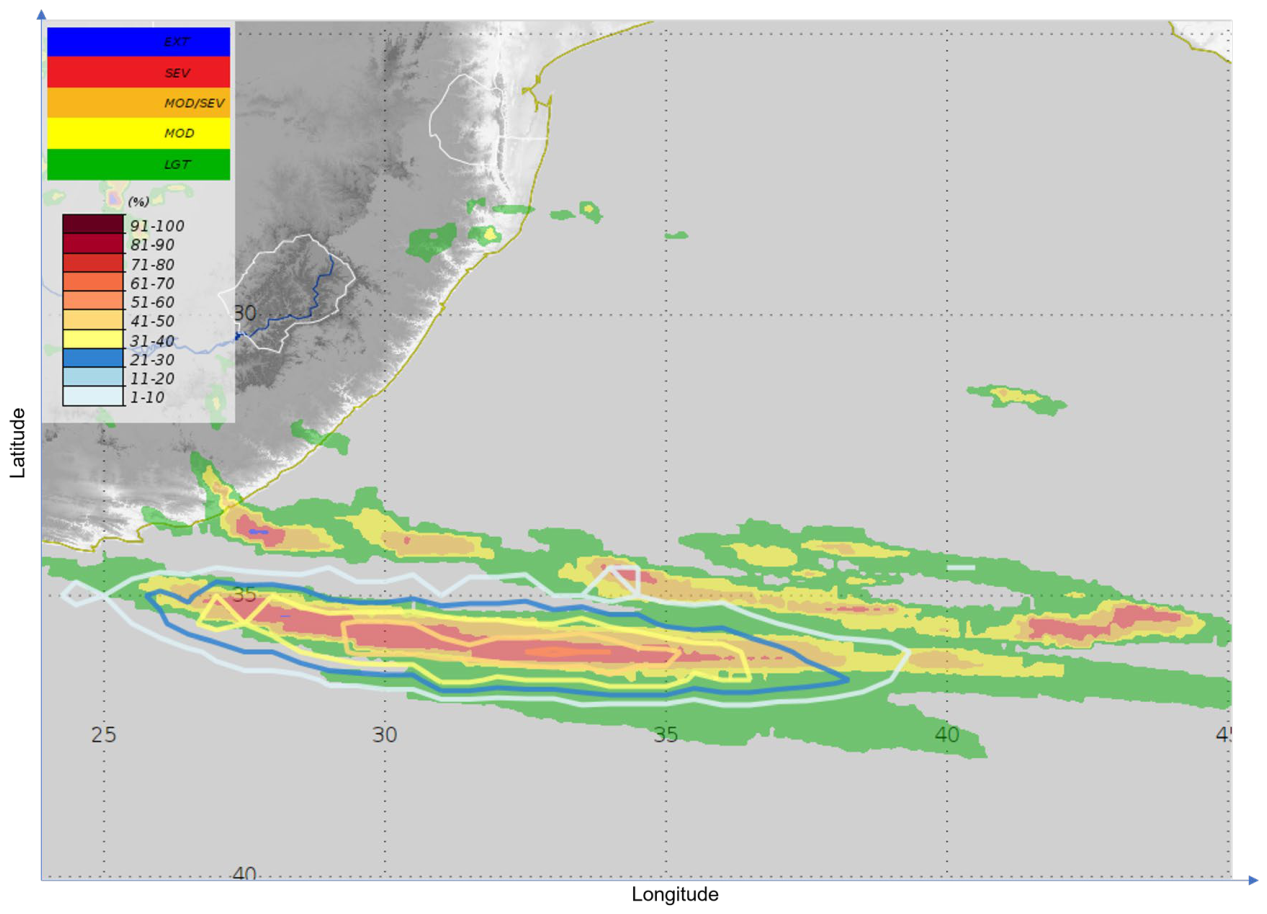
Figure 3.
Resulting EDP2.0 from the intersection depicted in previous Figure 2. Extracted from the NinJo meteorological workstation.
Figure 3.
Resulting EDP2.0 from the intersection depicted in previous Figure 2. Extracted from the NinJo meteorological workstation.
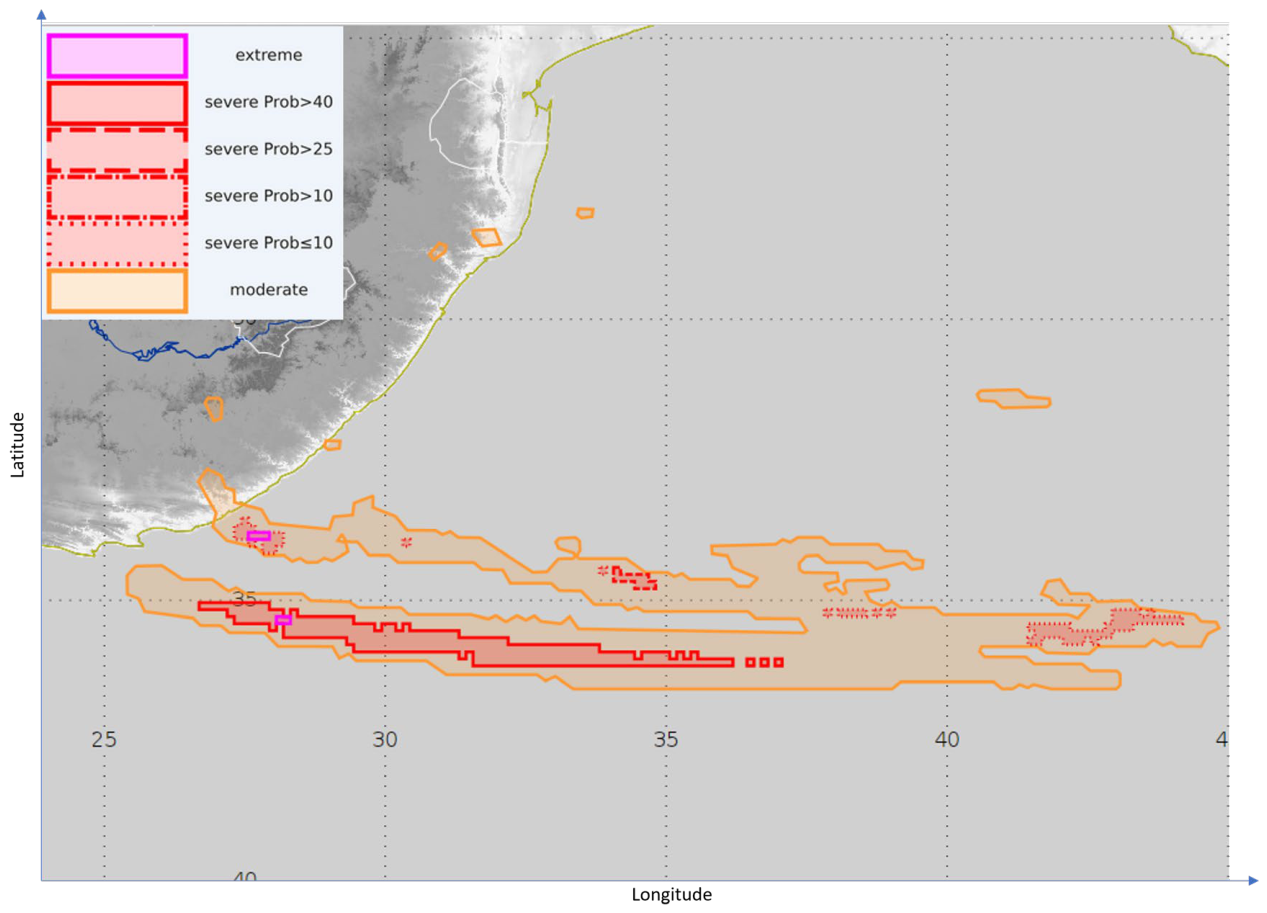
Figure 4.
EDP2.0 derived from EDPP and deterministic EDP-product.
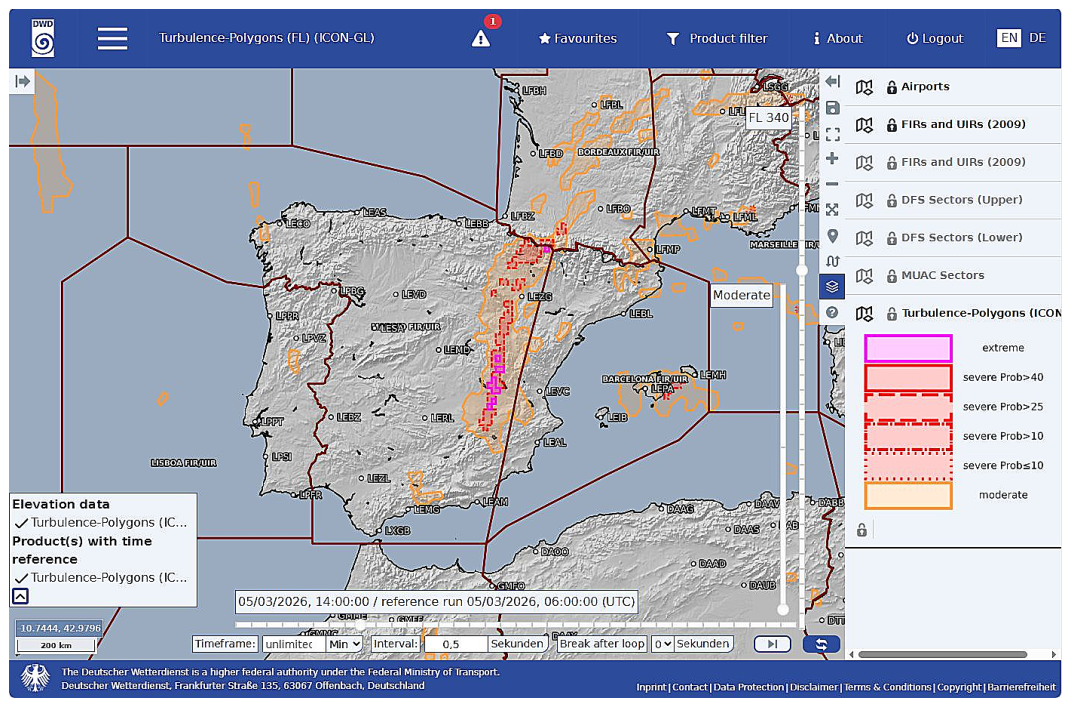
Figure 5.
Vertical aggregation of turbulence information in FL levels from 3D to 2D by projecting it onto the ground. The grayscale of the projection is only a visual effect and contains no additional information.
Figure 5.
Vertical aggregation of turbulence information in FL levels from 3D to 2D by projecting it onto the ground. The grayscale of the projection is only a visual effect and contains no additional information.
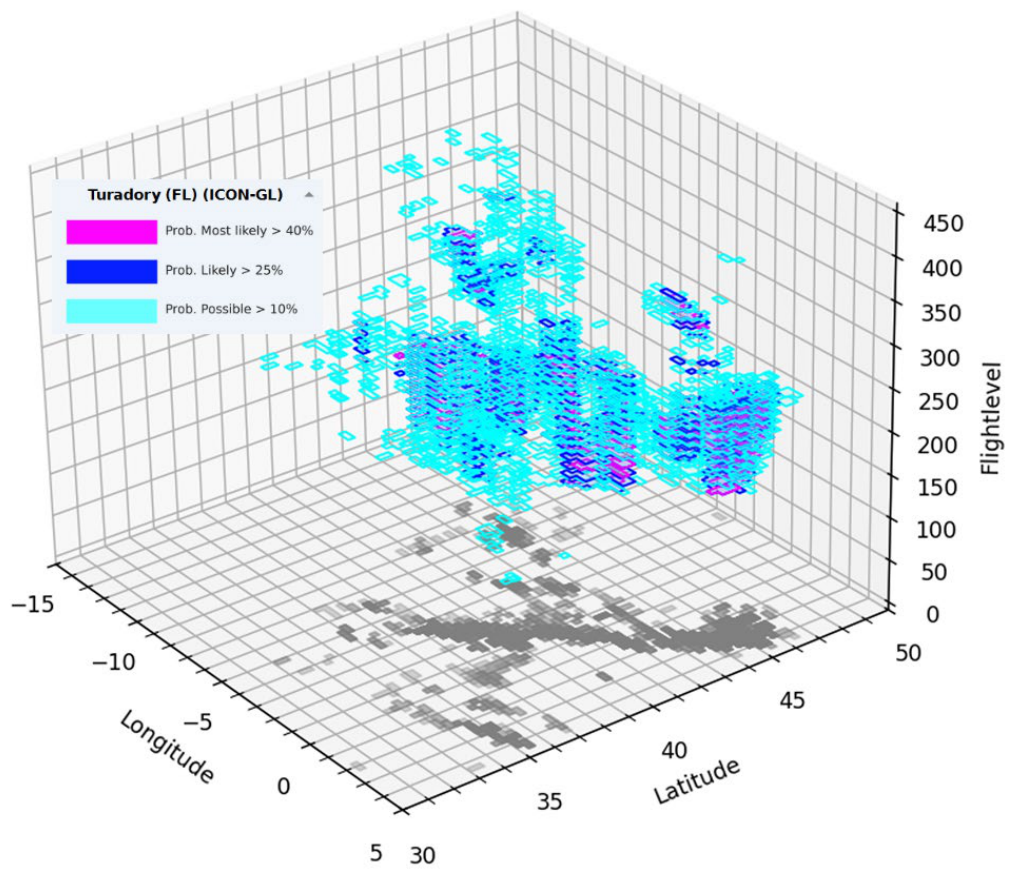
Figure 6.
Projection in 2D space derived from the vertical aggregation.
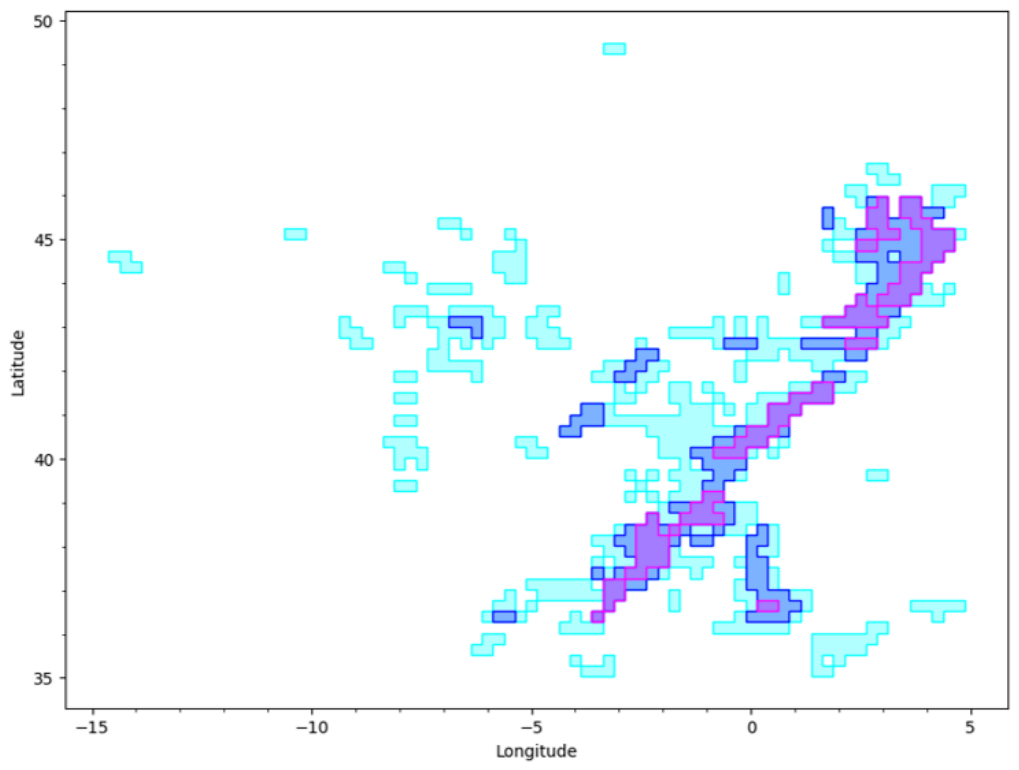
Figure 7.
Grouping and concave hull based on the individual 2D polygons.
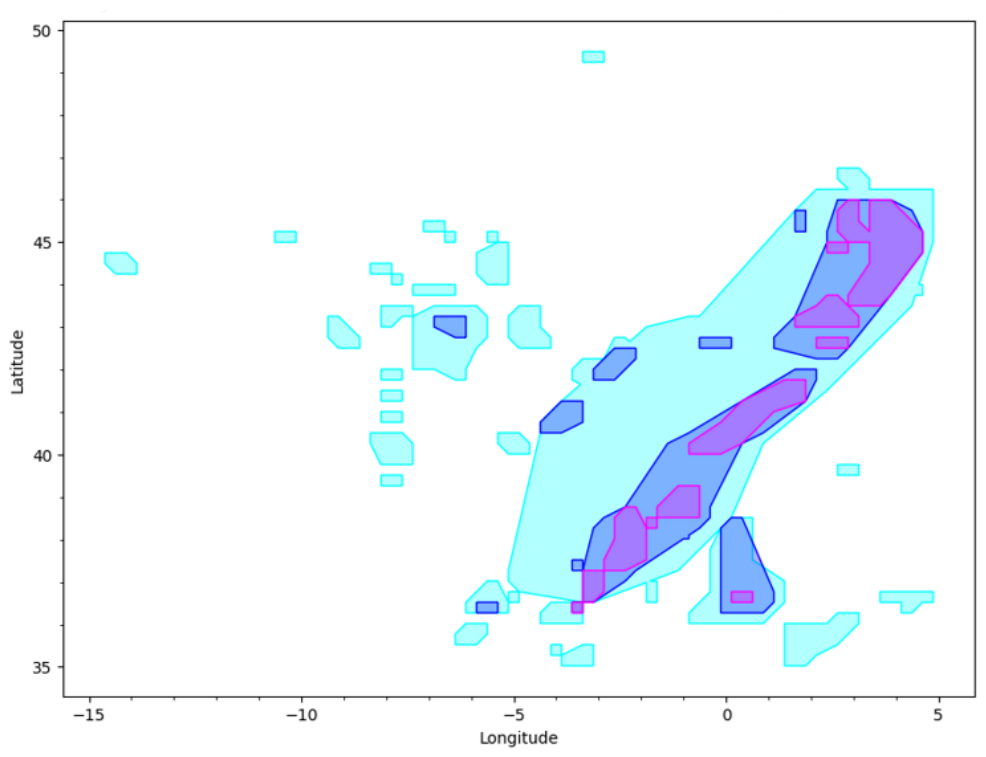
Figure 8.
Final product TURADORY. Red arrow pointing from textbox to selected polygon. Advisory metadata is presented in the order of increasing turbulence coverage, see Table 1.
Figure 8.
Final product TURADORY. Red arrow pointing from textbox to selected polygon. Advisory metadata is presented in the order of increasing turbulence coverage, see Table 1.
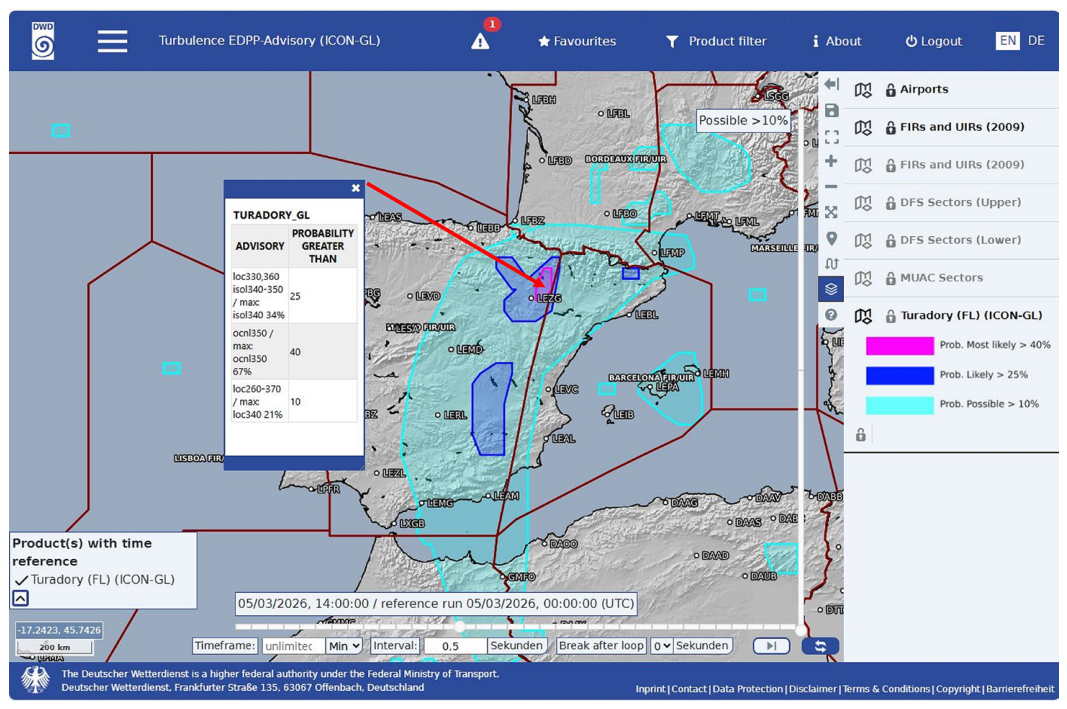
Figure 9.
Official turbulence SIGMET as reference. Green arrow pointing from textbox to selected turbulence SIGMET.
Figure 9.
Official turbulence SIGMET as reference. Green arrow pointing from textbox to selected turbulence SIGMET.
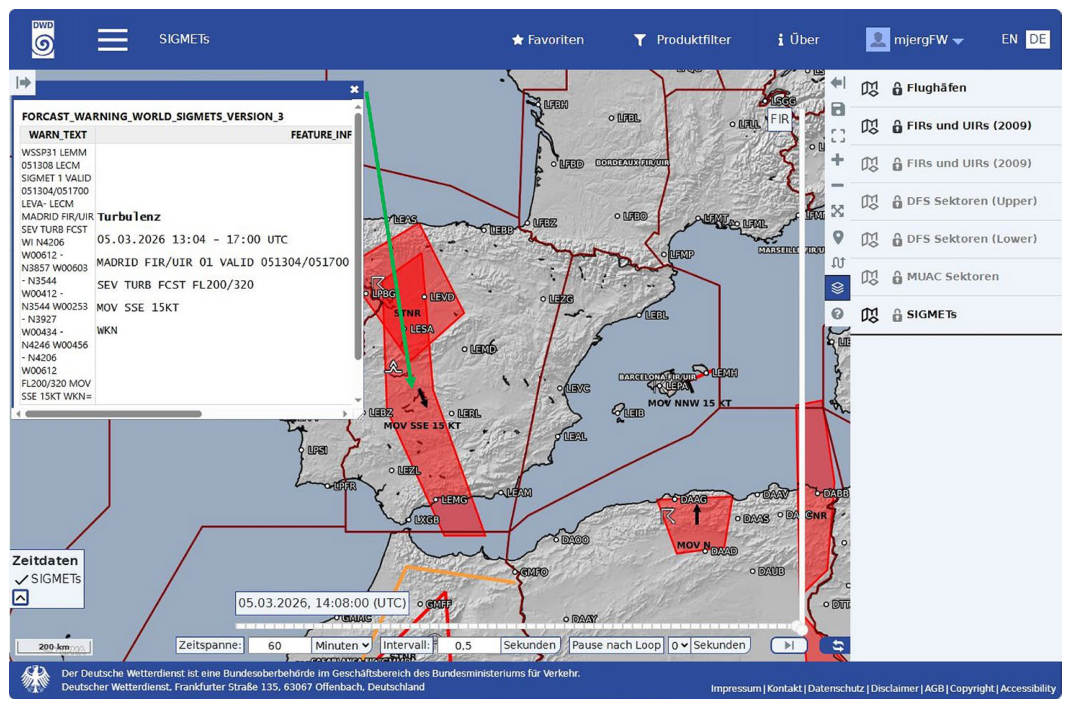

Table 1.
Presentation of TURADORY metadata variant 1 as shown in Figure 8: Increasing coverage.
Table 1.
Presentation of TURADORY metadata variant 1 as shown in Figure 8: Increasing coverage.
| Probability Threshold in % | Metadata sorted by increasing turbulence coverage1 | |
|---|---|---|
| 10 | loc260-370 / max: loc340 21% | |
| 25 | loc330,360 isol340-350 / max: isol340 34% | |
| 40 | ocnl350 / max: ocnl350 67% |
1 loc: locally(<25%), isol: isolated(25%-49%), ocnl: occasional(50%-74%), freq: frequent(75%-100%).
Table 2.
Presentation of TURADORY metadata variant 2: Decreasing altitude.
| Probability Threshold in % | Metadata sorted by decreasing altitude | |
|---|---|---|
| 10 | loc370-260 / max: loc340 21% | |
| 25 | loc360 isol350-340 loc330 / max: isol340 34% | |
| 40 | ocnl350 / max: ocnl350 67% |
Disclaimer/Publisher’s Note: The statements, opinions and data contained in all publications are solely those of the individual author(s) and contributor(s) and not of MDPI and/or the editor(s). MDPI and/or the editor(s) disclaim responsibility for any injury to people or property resulting from any ideas, methods, instructions or products referred to in the content. |
© 2026 by the authors. Licensee MDPI, Basel, Switzerland. This article is an open access article distributed under the terms and conditions of the Creative Commons Attribution (CC BY) license (http://creativecommons.org/licenses/by/4.0/).
Copyright: This open access article is published under a Creative Commons CC BY 4.0 license, which permit the free download, distribution, and reuse, provided that the author and preprint are cited in any reuse.