

Submitted:
24 September 2026
Posted:
25 September 2026
You are already at the latest version
Abstract
Medicinal quality of Scutellaria baicalensis Georgi is decided by baicalin and wogonoside in root. In arid and semi-arid regions this crop is grown, salinized soils constrain establishment but reshape specialized metabolism. We used field density trials, salt-stress experiments, UPLC-MS/MS and time-series RNA-seq to ask whether agronomic practices and salt-induced transcriptional changes alter root flavone content. Planting density showed a clear yield-quality trade-off: higher density increased belowground biomass per unit area but reduced individual root growth and flavone content, with 100,000 plants mu-1 providing a practical balance between population yield and root quality under the tested Xinjiang field conditions. In established seedlings, 0.5% NaCl caused no visible damage over 24 h and specifically raised baicalin and baicalein at 12 h, while wogonin-type flavones remained nearly unchanged. Time-series RNA-seq identified thousands of differentially expressed genes between 2 and 24 h. WGCNA identified a turquoise module that was overrepresented with genes for carbohydrate metabolism and cytoskeletal/microtubule processes. Salt-responsive NAC, MYB and WRKY transcription factors co-expressed with core structural genes (PAL, 4CL, CHS, CHI); one candidate, SbNAC076, was up-regulated mainly at 24 h after the metabolite peak, consistent with a role in sustaining rather than triggering accumulation. These findings outline the temporal dynamics of salt-induced branch-selective flavone accumulation and suggest candidate regulators for functional validation, with implications for quality-focused cultivation on saline marginal lands.
Keywords:
Scutellaria baicalensis
; baicalin
; wogonoside
; 4’-deoxyflavones
; salt stress
; planting density
; transcriptome
; WGCNA
; NAC transcription factors
1. Introduction
Scutellaria baicalensis Georgi (Huang-Qin) owes its medicinal value to dried roots that accumulate high levels of bioactive 4’-deoxyflavones [1,2]. The major root flavones—baicalin, baicalein, wogonoside, and wogonin—lack a 4′-hydroxyl group on the B-ring [3,4,5,6,7,8] (reviewed in [9,10,11,12]). A root-specific branch of the flavone pathway, which depends on SbCHS-2, SbFNSII-2, SbF6H, SbF8H [13], and downstream glycosyltransferases [14], produces these compounds [3,4,15,16,17] and defines the medicinal quality of the species. Salinity strikes broad transcriptional or metabolic reprogramming, weaves stress signaling into primary/secondary metabolism [18], How soil salinity as common constraint in major production areas affects this pathway is not well understood.
Xinjiang offers abundant sunlight favor medicinal-plant cultivation, salinized soils frequently influence crop establishment might alter bioactive constituent profiles [19], so an important hypothesis at the agricultural and physiological mechanism level derived from this environment. moderate, short-term salt stress is utilized to promote the accumulation of flavonoids in established plants. Abiotic stress elicit secondary metabolite accumulation in many medicinal species [20,21,22,23], but in these stresses combined effect of planting density and salt stress on flavone levels in S. baicalensis has not thoroughly examined [24,25,26,27]. In our field density trial and parallel time-course (2, 6, 12, 24 h) salt treatment, Root flavones quantified by UPLC-MS/MS method and transcriptomes profiled by RNA-seq technology [28]. The density trial tested crowding affects root yield and flavone content in salt experiment, flavone biosynthesis track over time to identify regulatory genes and pathways of the response. Baicalin, wogonoside, related root flavones largely determine medicinal value of S. baicalensis [29], so understanding how environmental factors shape their accumulation matters for basic research and breeding [30]. We traced the time course of salt induced flavone accumulation and identified candidate transcription factors prove useful for cultivating this species on salt land by integrating density and transcriptome datasets.
2. Results
2.1. Planting Density Influences Relationship Between the Yield and Quality of Flavonoids
At 50000 plants·mu-1, individual plants were largest and bore the most leaves, the canopy not close fully. At 150000 plants·mu-1, canopy closed early, root biomass and baicalin concentration fell. High density intensified intraspecific competition causes stem elongation, leaf overlap, senescence of lower leaves, reduced light transmittance. 100000 plants·mu-1 achieved most balanced stand structure and coordinated development. (Figure 1A). The underground biomass density is relatively high, but the root length, root diameter, flavonoid content are all reduced. (Figure 1B-D). Root length and rhizome diameter were both diminished under the highest density, indicating that crowding constrained individual root development. Baicalin, wogonoside, baicalein, and wogonin were highest in roots from the lowest density and decreased progressively as density rose. High-density planting improved unit-area biomass but diluted individual-root quality, trade-off rather than a simple positive relationship between biomass and medicinal quality.
Density reshapes the balance between population yield and root flavone accumulation. The medium density did not maximize individual-root flavone content but provided a practical compromise between biomass production and quality-related constituents. This field-scale plasticity sets the stage for the salt-stress experiments that follow, which dissect candidate regulatory mechanisms of flavone accumulation under a controlled abiotic stimulus. The density experiment should be interpreted as an agronomic context for quality plasticity, not as direct mechanistic evidence for the salt-response pathway (Supplementary Table S1).
2.2. Moderate NaCl Stress Induces Baicalein-Branch Flavone Accumulation in Established Seedlings
NaCl treatments were first screened for seed-germination tolerance. Germination parameters rose slightly at 0.1% NaCl, then dropped as concentration increased. At 0.1% NaCl, germination percentage and germination potential reached approximately 60.0% and 50.0%, respectively, compared with 49.0% and 38.0% in the control. Low salinity (0–0.2% NaCl) caused no marked inhibition, whereas concentrations of 0.3% NaCl and above progressively suppressed germination. At 0.5% NaCl, germination percentage fell to 9.3%, germination potential to 7.0%, and germination index to 0.4 (Figure 2A). Consequently, 0.5% NaCl marks the upper germination-tolerance boundary rather than a favorable germination condition.
Seedling responses diverged from seed responses. After 15 days, plants under 0.5% NaCl appeared similar to controls, but 0.6% NaCl caused chlorosis, wilting, and stunting (Figure 2B). We therefore selected 0.5% NaCl as a moderate, short-term stress level for transcriptome analysis; 0.6% NaCl exceeded the tolerance range for sustained growth.
Targeted flavone quantification showed that salt stress strongly affected root metabolite accumulation (Figure 2C). Baicalein-branch flavones displayed the strongest response. Baicalin and baicalein rose steadily and peaked synchronously at 12 h, reaching 6.60 and 3.81 mg·g-1, respectively. Relative to time-matched controls, baicalin was 9.21-fold higher and baicalein 4.39-fold higher. Wogonoside and wogonin showed weaker responses and different concentration/time optima. At 6 h all four flavones dropped to 16–44% of control values, consistent with an early suppression before the 12 h increase. Because 0.5% NaCl produced a robust baicalin/baicalein induction while remaining tolerable for established seedlings over the short term, roots collected at 2, 6, 12, and 24 h under this condition were used for transcriptome sequencing.
2.3. Time-Series RNA-Seq Reveals Progressive Transcriptomic Reprogramming Under 0.5% NaCl
Root transcriptomes of the salt-treated group (HQ; 0.5% NaCl) and time-matched controls (CK) were sequenced at 2, 6, 12, and 24 h. Differential expression analysis revealed 2422, 1989, 2940, and 6 838 DEGs at these time points (Figure 2D). The 24 h count rose to roughly 2.5 times the 12 h number, signaling a major transcriptional shift. Down-regulated DEGs outnumbered up-regulated ones at every time point, suggesting broad suppression of basal cellular processes under prolonged salinity [31].
PCA separated salt-treated from control samples along PC1 (35.6% variance), PC2 (10.37% variance) further revealed a time-dependent separation, with the 24 h treated group clearly diverging from earlier time points (Figure 3A). Moreover, sample distribution along the PC2 axis reflected a clear time-dependent trajectory, with the 24 h treated group conspicuously diverging from earlier time points. Of all DEGs, 4,412 were unique to the 24-h contrast, while only 136 appeared at all four time points (Figure 3D). Thus, the later time points contribute most of the transcriptomic change, not just an early response [31].
We used WGCNA to find modules linked to flavone content (details in Section 2.4); here we describe enrichment rather than total flavonoid correlations. KEGG enrichment analysis [32] of this module highlighted prominent roles for carbohydrate metabolism, followed by lipid metabolism, amino acid metabolism, biosynthesis of other secondary metabolites, membrane transport, signal transduction, and environmental adaptation (Figure 3B). These annotations support a stress-to-metabolism shift, in which salinity orchestrates nutrient reallocation, hormonal such as zeatin signaling, and activation of specialized metabolic routes.
Transcriptomic data show 0.5% NaCl activates distinct stress-responsive and specialized metabolic programs in roots. The coordinated upregulation of PAL, 4CL, CHS, CHI provides plausible transcriptional basis for enhanced baicalin and baicalein accumulation, temporal repression at 24 h for structural genes suggests activation restrict to tightly controlled window. Distinct from broader, late-stage adaptive reprogramming responses.
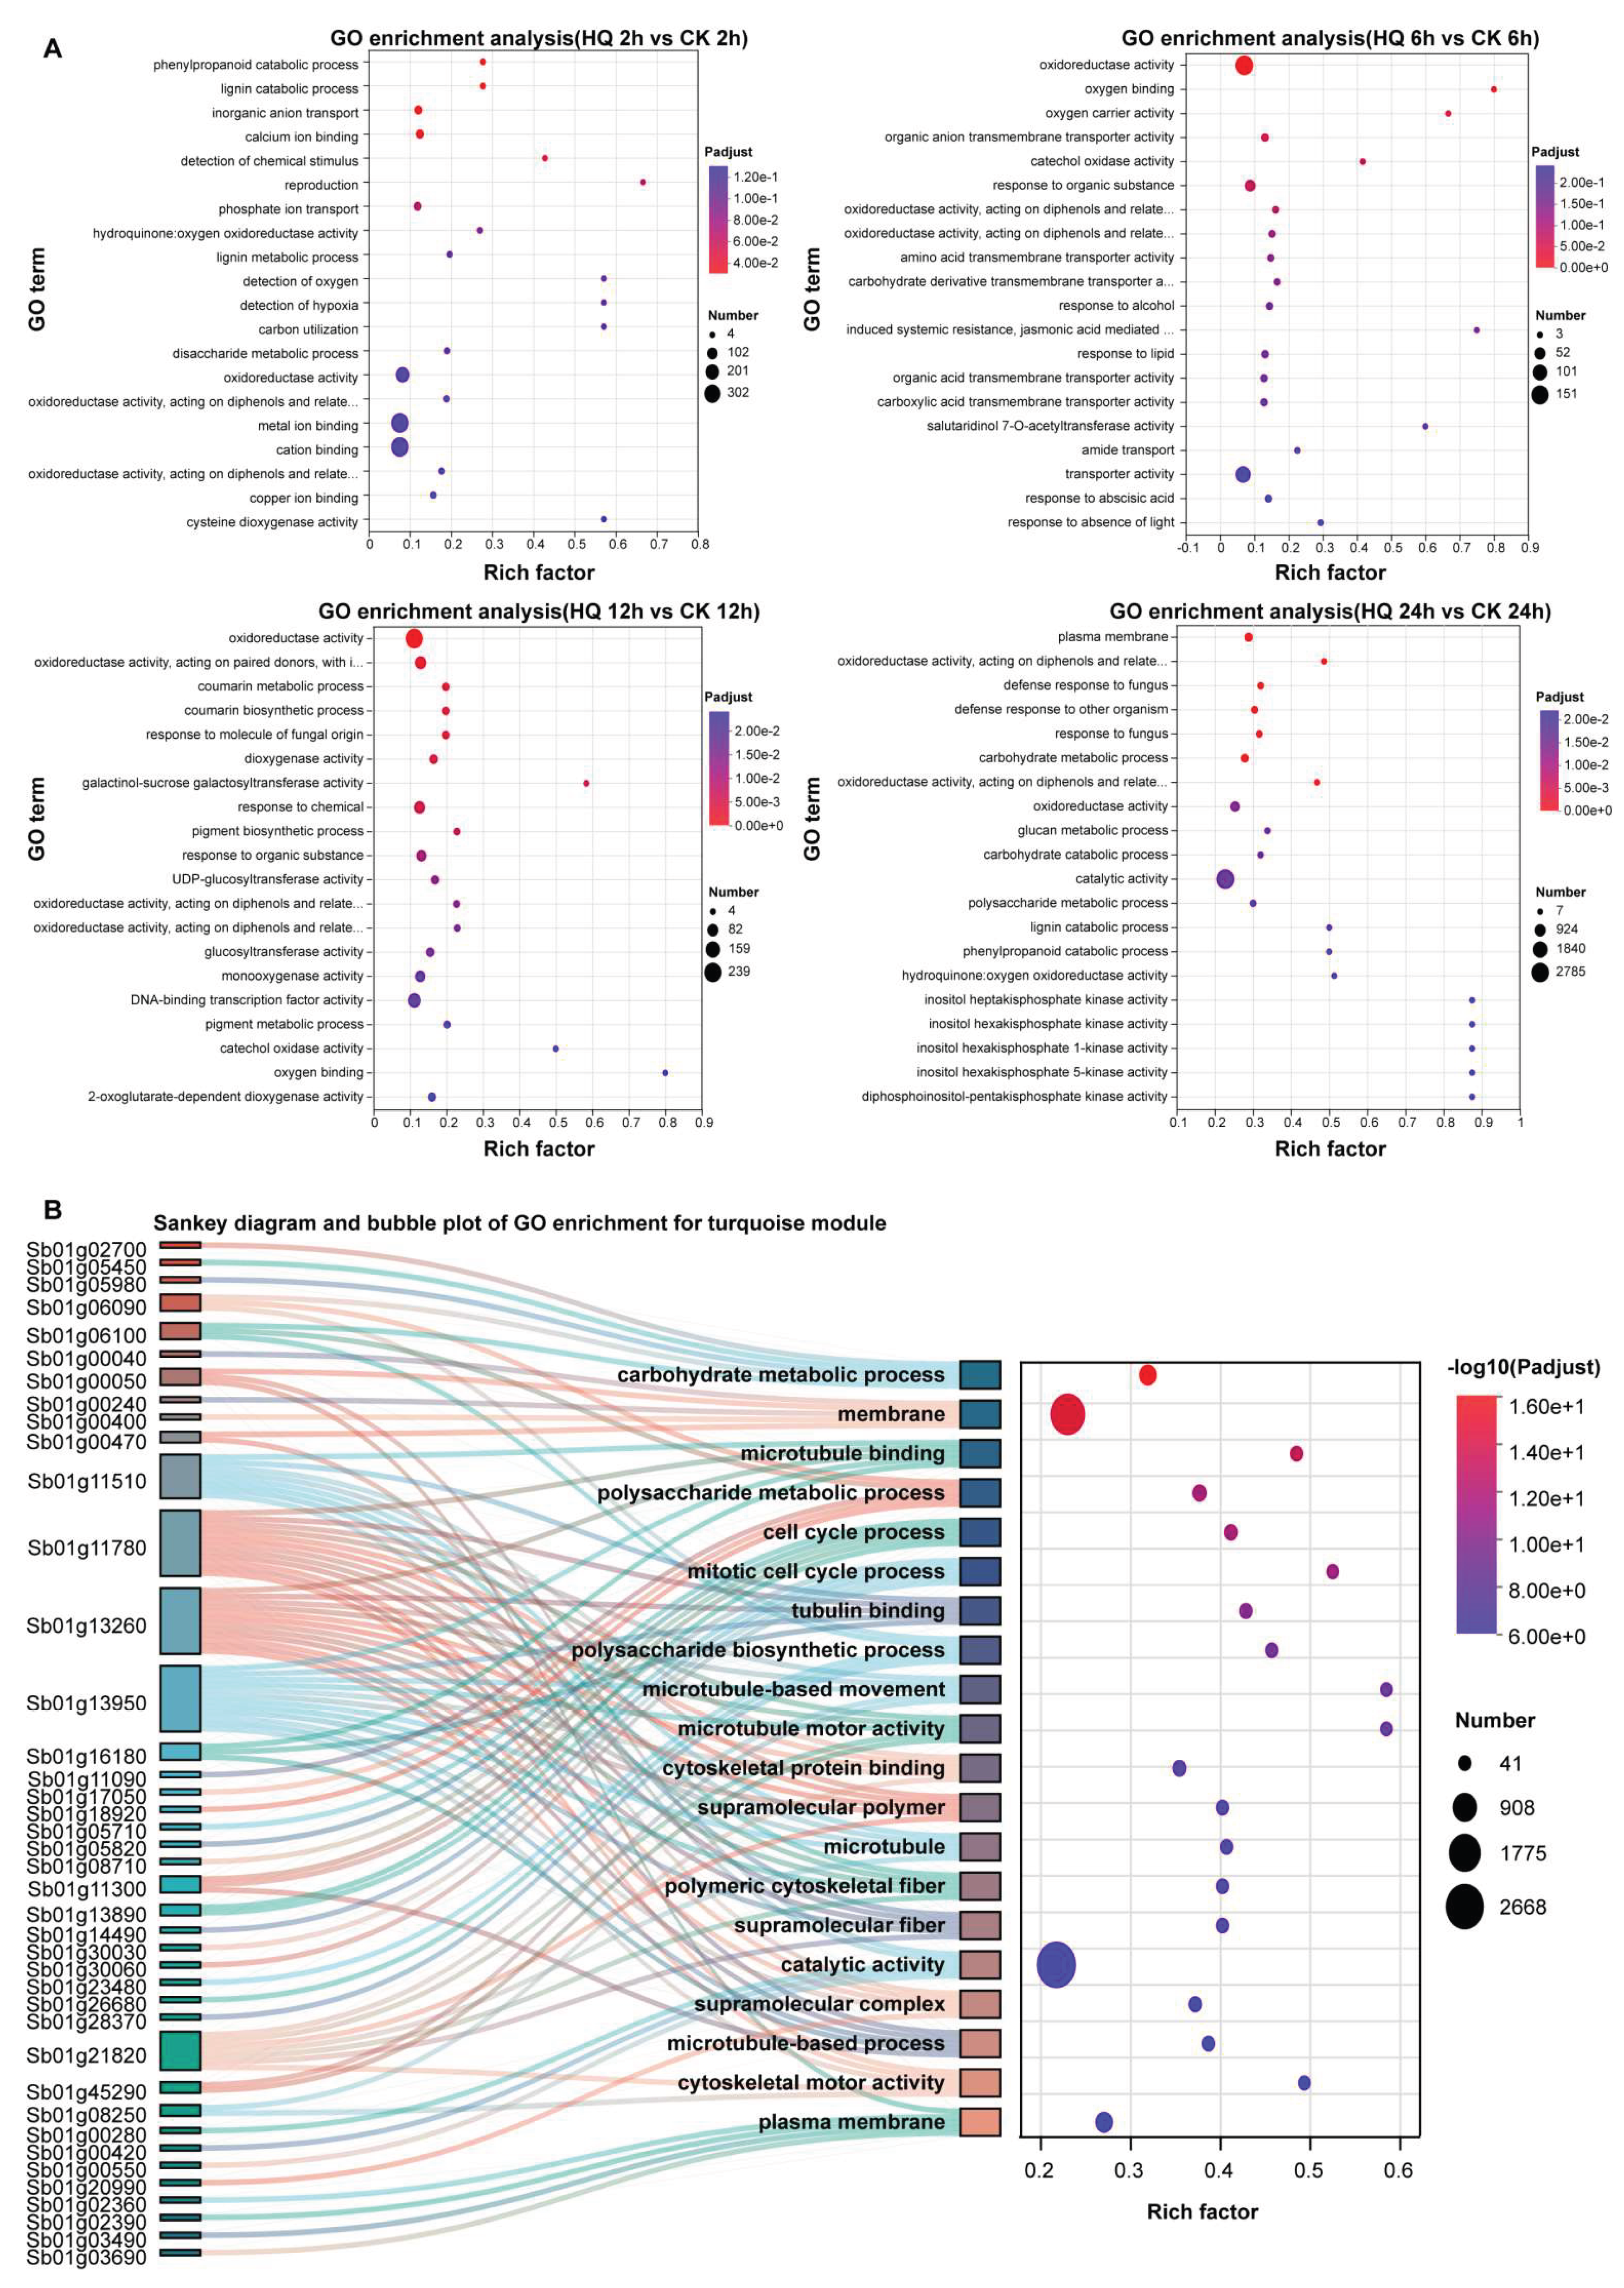
GO enrichment of DEGs from each time point (Figure 4A), across all sampling times, oxidoreductase activity (GO:0016491) consistently enriched. This observation is biologically consistent with the biosynthesis of S. baicalensis flavonoids, which involves extensive redox reactions, particularly those catalyzed by cytochrome P450 monooxygenases and 2-oxoglutarate-dependent dioxygenases during the oxidative modification of the flavonoid backbone. Furthermore, early-stage GO terms were predominantly enriched in phenylpropanoid catabolic process and lignin catabolic process (at 2 h), while later stages (6 h and 24 h) showed a transition toward defense response to fungus, response to oxidative stress, and lipid transport. Early GO terms (2 h) were linked to phenylpropanoid catabolism, while later terms (6–24 h) shifted toward oxidative stress and lipid transport. We also analyzed GO terms in the turquoise module, genes within this module were significantly enriched in terms related to carbohydrate metabolic process, polysaccharide metabolic process, catalytic activity, as well as a highly distinctive suite of cellular structural and motility components, including microtubule binding, microtubule motor activity, microtubule-based movement, and cytoskeletal protein binding (Figure 4B).The co-enrichment of microtubule-associated terms with carbohydrate metabolism in the turquoise module points to a metabolic channeling mechanism, in which cytoskeletal dynamics may spatially organize precursors and enzymes for efficient flavone production [33]. Flavonoid synthesis depends on metabolons—multienzyme complexes that cluster at the endoplasmic reticulum or in the cytosol—and their positioning depends on the cytoskeleton, microtubules and actin filaments in particular. Co-expression of cytoskeletal motor proteins with polysaccharide metabolic enzymes further suggests that the cytoskeleton moves precursors, cofactors, and biosynthetic enzymes to appropriate intracellular compartments, channeling carbon from primary carbohydrate metabolism into flavonoid synthesis. The turquoise module thus appears to couple cytoskeletal dynamics to primary metabolism during flavone production, though direct experimental evidence for this hypothesis is lacking.
2.4. WGCNA Identifies a Turquoise Module Enriched in Flavonoid-Pathway Genes
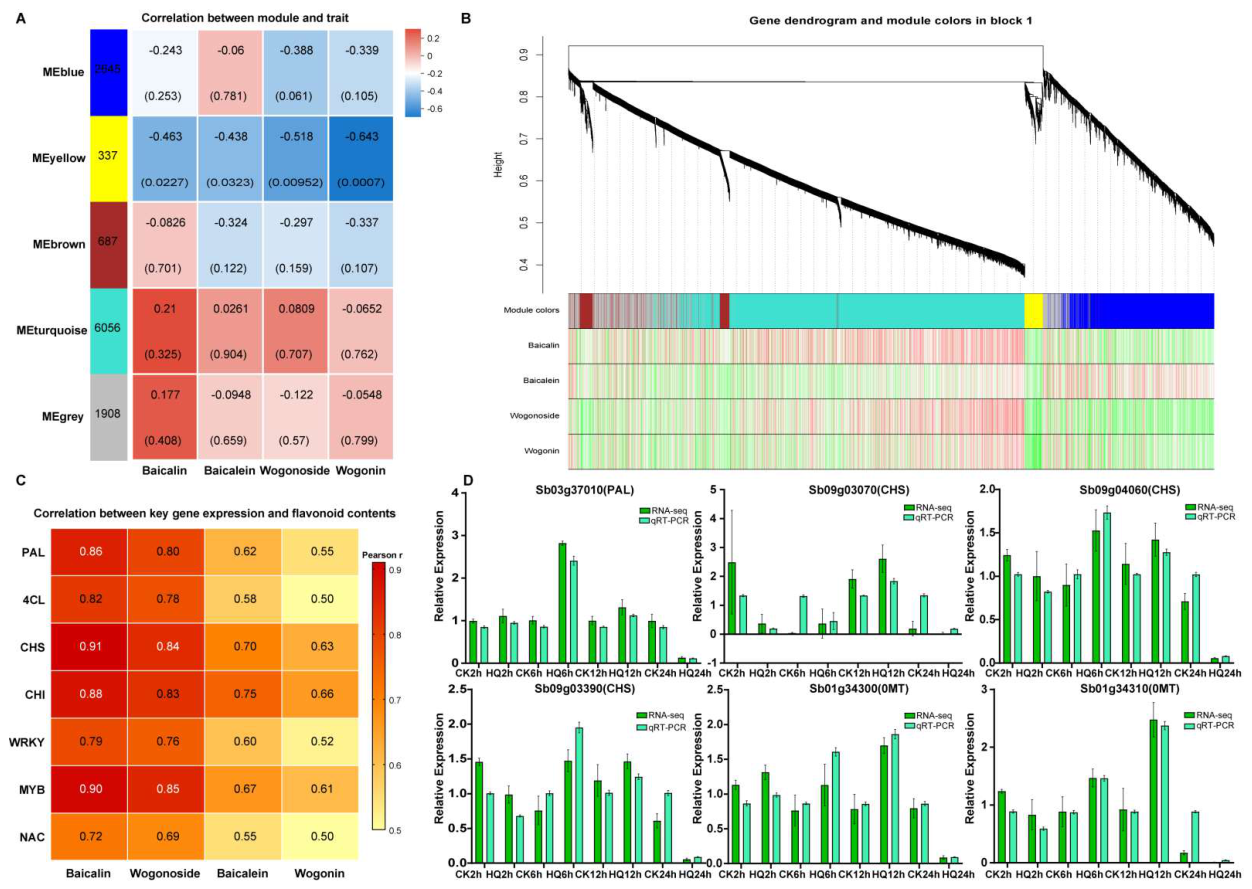
WGCNA yielded a turquoise module (6056 genes) enriched for carbohydrate and phenylpropanoid genes. Its eigengene correlated weakly with baicalin and wogonoside, while a yellow module correlated negatively with wogonin (Figure 6A; |r| ≤ 0.43). KEGG analysis (Figure 5A) showed enrichment of DEGs in phenylpropanoid and flavonoid pathways, especially at 2 h and 6 h [3,34], as evidenced by high rich factors and small adjusted P-values. This rapid enrichment indicates strong activation of flavonoid biosynthesis in S. baicalensis roots by HQ treatment.
Genes in the turquoise module mapped to phenylpropanoid biosynthesis and to several primary metabolic pathways, including starch and sucrose metabolism, glycolysis/gluconeogenesis, and amino sugar and nucleotide sugar metabolism (Figure 5B). Hub genes such as Sb05g14910 probably connect primary carbon metabolism with phenylpropanoid production [35]. Flavonoid synthesis draws phosphoenolpyruvate and erythrose-4-phosphate from glycolysis via the shikimate pathway [3,35]. Co-enrichment of glycolytic and sugar metabolism genes with phenylpropanoid genes argues for integrated carbon channeling. Flavonoid accumulation appears closely linked to, and energetically supported by, adjustments in primary carbohydrate metabolism.
KEGG enrichment of the turquoise module included phenylpropanoid and flavonoid biosynthesis, confirming that flavone-associated genes were organized into a metabolite-related co-expression module. Within the available annotation, ten candidate biosynthetic genes were identified in this module: three PAL, one 4CL, four CHS, and two CHI. qRT-PCR validation of six selected genes supported the reliability of the RNA-seq expression trends.
2.5. Candidate Flavonoid Pathway Genes and Regulatory Correlations
WGCNA was used to find modules associated with the four major flavones [36,37,38,39]. A hierarchical clustering tree based on the topological overlap matrix defined modules by color (Figure 6B). MEyellow correlated negatively with wogonin (Figure 6A), so this module may suppress wogonin accumulation; MEturquoise showed a weak positive correlation with baicalin and wogonoside. Spearman correlations were then calculated between structural genes (PAL, 4CL, CHS, CHI), transcription factors (WRKY, MYB, NAC), and the four flavones (Figure 6C). Predicted transcription factor–target gene interactions are listed in Supplementary Table S3. CHS and CHI correlated most strongly with baicalin. TF regulation is examined in Section 2.6. qRT-PCR of six genes (Figure 6D) matched the RNA-seq data at every time point and treatment, confirming the transient up-regulation of PAL and CHS at 6 h.
2.6. Transcription Factors as Candidate Flavonoid Regulating Factors
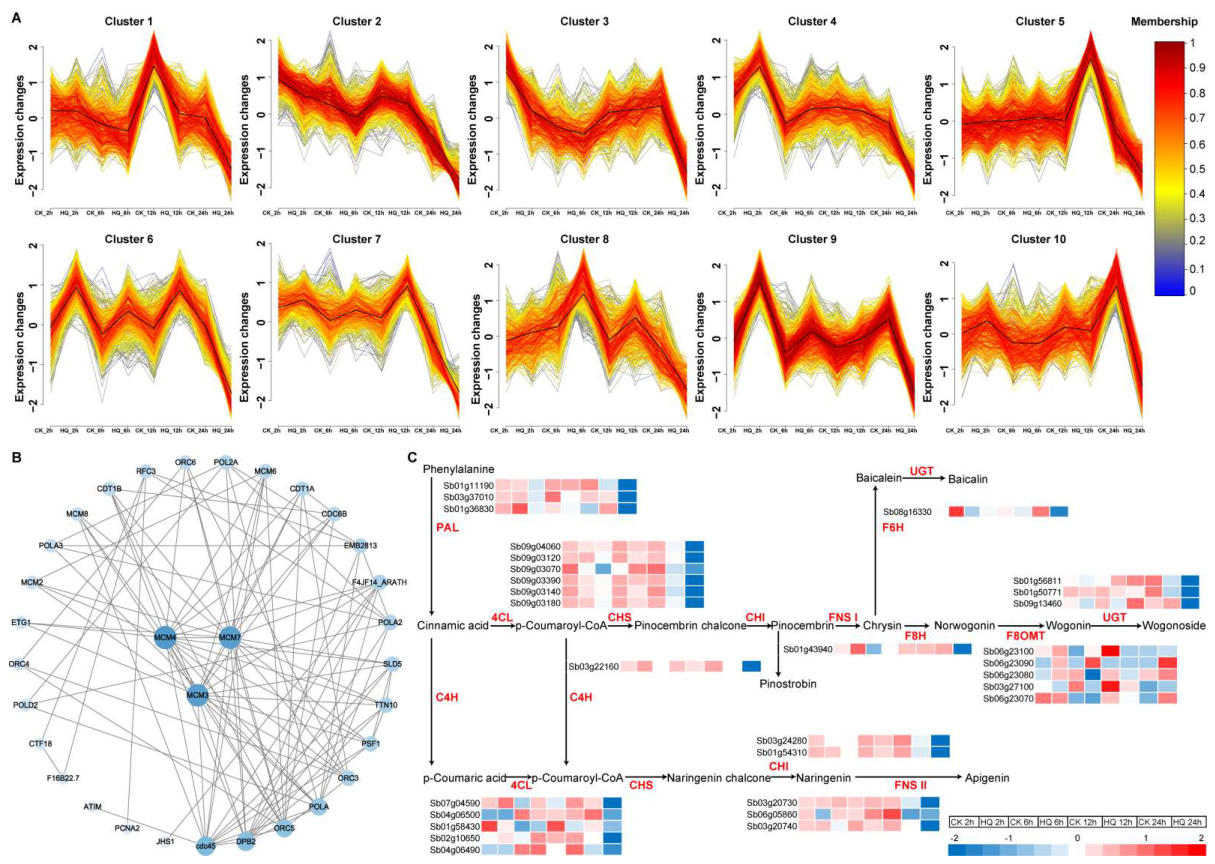
Pathway mapping (Supplementary Figure S6) showed changes in central carbon and amino acid metabolism consistent with the KEGG results. Glycolysis, TCA cycle, amino acid metabolism were most affected, reflecting changes in energy production and carbon flow. Amino acid metabolism has enrichment in the biosynthesis and degradation of branched-chain and aromatic amino acids.It is processes central to protein synthesis and nitrogen balance. Nucleotide metabolism also changed, altered DNA/RNA synthesis and cell proliferation, lipid metabolism and cofactor/vitamin metabolism also shifted. This mode indicates salt treatment rewires carbohydrate, amino acid, lipid, nucleotide pathways. Mfuzz grouped 5000 DEGs into ten temporal time series mode (Figure 7A). Cluster 5 peaked early at 2 h; 2 and 4 at 12 h; 1 and 3 fell over time, implies early signaling, mid-phase activation, late remodeling [39]. Hierarchical clustering of phenylpropanoid and flavonoid structural genes (PAL, 4CL, CHS, CHI, FNS, OMT, UBGAT) uncovered temporal order (Figure 7B). Sb03g37010 (PAL) and Sb09g03180 (CHS) strongly up-regulated at 6 h and 12 h under HQ treatment, most other structural genes were down by 24 h. This timing point with the 6-12 h metabolic activation window, indicating flavonoid accumulation the same as active defense at specific times.
Figure 5.
KEGG pathway enrichment analysis of differentially expressed genes (DEGs) and the turquoise co-expression module in Scutellaria baicalensis. (A) Bubble plots showing KEGG enrichment of DEGs between HQ and CK groups at 2, 6, 12, and 24 h. Rich factor, bubble size, and color represent the ratio of enriched DEGs to annotated genes, number of DEGs, and adjusted P-value, respectively. (B) Sankey diagram (left) linking hub genes from the turquoise module (WGCNA) to enriched KEGG pathways, and bubble plot (right) of the enrichment results. Rich factor, bubble size, and color indicate the gene ratio, gene number, and −log10 (P-value), respectively.
Figure 5.
KEGG pathway enrichment analysis of differentially expressed genes (DEGs) and the turquoise co-expression module in Scutellaria baicalensis. (A) Bubble plots showing KEGG enrichment of DEGs between HQ and CK groups at 2, 6, 12, and 24 h. Rich factor, bubble size, and color represent the ratio of enriched DEGs to annotated genes, number of DEGs, and adjusted P-value, respectively. (B) Sankey diagram (left) linking hub genes from the turquoise module (WGCNA) to enriched KEGG pathways, and bubble plot (right) of the enrichment results. Rich factor, bubble size, and color indicate the gene ratio, gene number, and −log10 (P-value), respectively.
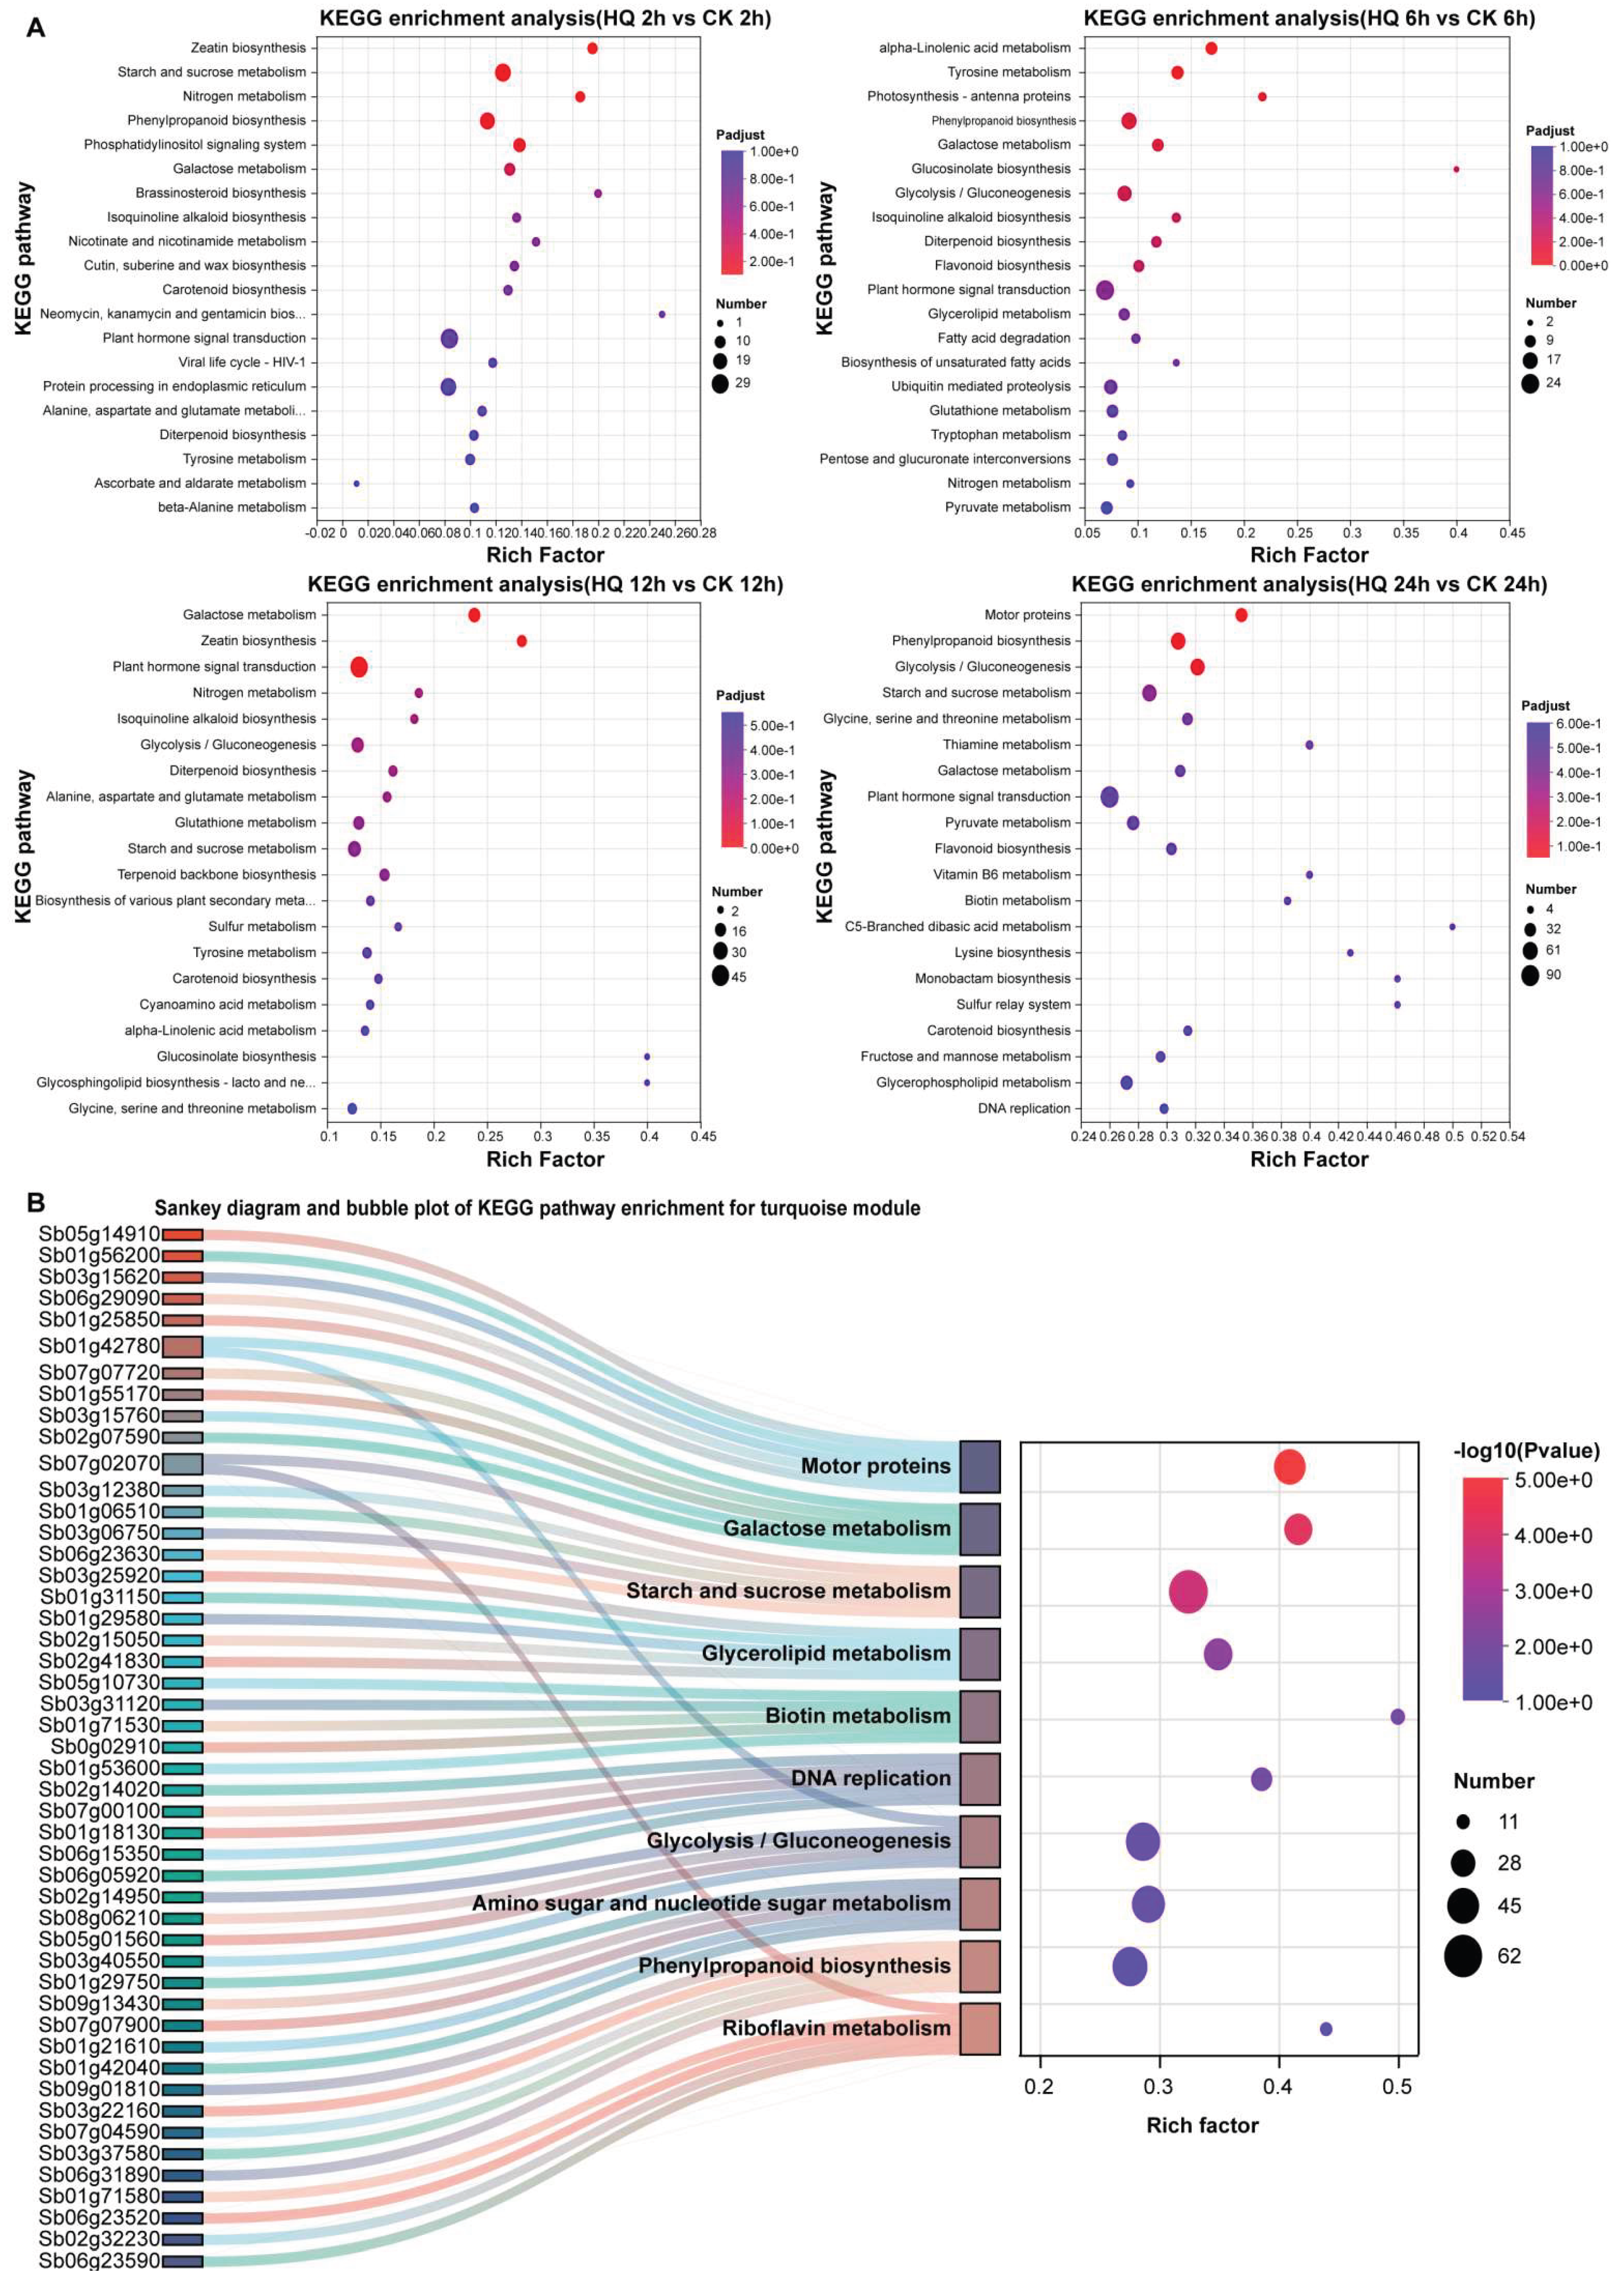
Figure 6.
Weighted gene co-expression network analysis (WGCNA) and expression validation of key genes involved in the flavonoid biosynthetic pathway in Scutellaria baicalensis. (A) Heatmap of module-trait correlations. Rows represent co-expression modules identified by WGCNA, and columns denote the four main flavonoids. Spearman correlation coefficients and corresponding P-values (in parentheses) are displayed in each cell. (B) Gene dendrogram and module color assignments. The color bands beneath the dendrogram represent distinct co-expression modules, and the bottom heatmap shows the accumulation profiles of the four flavonoids across samples. (C) Spearman correlation heatmap between the expression of key genes, structural enzymes, transcription factors and flavonoid contents. The gradient from yellow to red indicates increasing positive correlation. (D) Relative expression levels of six candidate genes. Bar charts compare RNA-seq and qRT-PCR data in control (CK) and treatment (HQ) groups across different time points, Data presented as mean ± SD.
Figure 6.
Weighted gene co-expression network analysis (WGCNA) and expression validation of key genes involved in the flavonoid biosynthetic pathway in Scutellaria baicalensis. (A) Heatmap of module-trait correlations. Rows represent co-expression modules identified by WGCNA, and columns denote the four main flavonoids. Spearman correlation coefficients and corresponding P-values (in parentheses) are displayed in each cell. (B) Gene dendrogram and module color assignments. The color bands beneath the dendrogram represent distinct co-expression modules, and the bottom heatmap shows the accumulation profiles of the four flavonoids across samples. (C) Spearman correlation heatmap between the expression of key genes, structural enzymes, transcription factors and flavonoid contents. The gradient from yellow to red indicates increasing positive correlation. (D) Relative expression levels of six candidate genes. Bar charts compare RNA-seq and qRT-PCR data in control (CK) and treatment (HQ) groups across different time points, Data presented as mean ± SD.
We identified 2 024 TF transcripts across 52 families. The most abundant were MYB, MYB_related, bHLH, ERF, NAC, WRKY, bZIP, C3H, GRAS, and HB-other, with MYB, NAC, and WRKY at the top—as expected for families with established roles in stress and secondary metabolism [35,40,41,42]. In a TF, structural gene, metabolite co-expression network (Figure 7B), WRKY (Sb03g41350), MYB (Sb04g02150), and NAC (SbNAC86) showed strong connections to PAL, 4CL, CHS, CHI, and to baicalin and baicalein [40,43]. These TFs are candidate regulators, but direct promoter binding and genetic validation are still required [35,44].A working model is shown in Supplementary Figure S5. Optimal plant density keeps roots in a responsive state. Mild salt stress then triggers a transcriptional response that peaks at 12 h (Figure 7A) and involves MYB, WRKY, and NAC TFs; these up-regulate PAL, 4CL, CHS, and CHI [40,43,45], and baicalin rises 9.21-fold while baicalein rises 4.39-fold [19]. Moderate NaCl treatment has similarly enhanced baicalin and baicalein production in hairy root cultures [46].
Figure 7.
Temporal expression clustering analysis, interaction networks, flavonoid biosynthetic pathways of related genes. (A) Mfuzz clustering of temporal expression profiles. X-axis, time points; Y-axis, expression levels. Color scale, membership values. Warmer colors denote higher importance. (B) Gene interaction network. Nodes, genes; edges, functional associations. (C) Flavonoid biosynthesis pathway. Enzymes are highlighted in red. Heatmaps display fold changes of corresponding genes/metabolites across indicated comparisons. Red denotes upregulation and blue downregulation.
Figure 7.
Temporal expression clustering analysis, interaction networks, flavonoid biosynthetic pathways of related genes. (A) Mfuzz clustering of temporal expression profiles. X-axis, time points; Y-axis, expression levels. Color scale, membership values. Warmer colors denote higher importance. (B) Gene interaction network. Nodes, genes; edges, functional associations. (C) Flavonoid biosynthesis pathway. Enzymes are highlighted in red. Heatmaps display fold changes of corresponding genes/metabolites across indicated comparisons. Red denotes upregulation and blue downregulation.
2.7. Salt-Responsive Members of the SbNAC Family
Genome-wide transcription-factor family statistics for the S. baicalensis genome are summarized in the Supplementary Material. The MYB family was the largest (162 members), consistent with its well-established role in flavonoid regulation; the NAC family comprised 89 members. To identify salt-responsive candidate regulators of the flavone response, we profiled SbNAC expression across the salt-stress time course. Of the 48 SbNAC genes examined, 35 were differentially expressed under 0.5% NaCl, predominantly at 24 h. SbNAC65, SbNAC30, and SbNAC22 showed the strongest late induction, whereas SbNAC2 and SbNAC51 were most strongly repressed (Supplementary Table S4). Together with salt-responsive MYB and WRKY members, these late-induced SbNACs are nominated as candidate regulators of the sustained phase of flavone accumulation, to be tested functionally. Detailed phylogeny, conserved motifs, domain architecture, and chromosomal distribution are provided in Supplementary Figure S1.
3. Discussion
3.1. Density and Salinity Operate Through Independent Pathways
Density changed root flavone content through resource competition, not stress signaling. Raising density from 50000 to 150000 plants/mu shortened and thinned individual roots and lowered all four flavones, even as it raised biomass per unit area. That inverse relationship is a classic yield-quality trade-off [47,48], similar to what has been reported in Panax notoginseng [48], though the exact magnitude varies by species and organ. 100000 plants/mu results in the most uniform plant population distribution, achieves optimal balance of biomass and flavonoid content. Density changes light capture and source-sink balance, salt influences ionic and osmotic stress opposing effects on flavonoid content, this occurs through distinct mechanistic pathways.
Salt stress raised concentrations of baicalin and baicalein in established seedlings, the same 0.5% NaCl almost completely inhibits seed germination, sharply elevated baicalin and baicalein at 12 h (Figure 2C). All flavonoid compounds showed a transient decrease to 16-44% of the control group levels after 6 h, reflect a brief period of metabolic consumption or resource redistribution prior to the observed rebound in concentrations. [31]. Dose blocking germination can boost metabolites in seedlings fits a hormetic pattern [49,50], effect was branch-selective: baicalein branch increased but wogonin branch did not, suggests regulation at branch point favors baicalein branch [3]. We did not measure pathway intermediates or flux, so exact branch point remains unclear. Tests across salinity levels, growth stages should in need before any agronomic recommendations can be made in future.
3.2. Transcriptional Dynamics Combine Primary Metabolism with Flavone Production
The RNA-seq time-series analysis conducted under 0.5% Nacl conditions revealed a transcriptional response pattern characterized by progressive and time-dependent features. DEG counts climbed from 2422 at 2 h to 6 838 at 24 h (Figure 2D). PCA separated treated from control samples along PC1 and PC2 resolved a time-dependent trajectory, with the 24 h group standing apart (Figure 3A). Early (2-6 h) and late (24 h) responses thus appear qualitatively different, latter encompassing broad shifts in metabolism, transport, defense [51]. Similar time dependent transcriptional remodeling under salinity has documented in cotton [52], indicating the progressive nature of the salt response conserved across diverse plant taxa. WGCNA yielded turquoise module of 6056 genes heavily enriched in carbohydrate, phenylpropanoid, flavonoid pathways (Figure 5B), weakly correlated with baicalin and wogonoside (Figure 6A). Within this module, core structural genes were up-regulated at 2 h and 6 h, sharply repressed by 24 h (Figure 7C). This early pulse of biosynthetic transcripts matches with the 6-12 h accumulation phase, providing mechanistic framework for elevated baicalin and baicalein [40,43]. Subsequent repression at 24 h is consistent with a tightly gated activation window, perhaps avoid over-accumulation or channel resources into longer-term adaptation, qRT-PCR for selected genes confirmed the RNA-seq trends (Figure 6D).
The blue and green modules showed significant enrichment of GO terms related to microtubules, appeared alongside genes involved in starch and sucrose metabolism and genes associated with glycolysis. (Figure 4B). One possibility is cytoskeletal dynamics facilitate metabolic channeling by physically organizing enzymes and precursors, steering carbon from primary metabolism toward flavone synthesis [33]. KEGG enrichment highlighted hormone signaling, zeatin biosynthesis, amino-sugar metabolism, implying coordinated carbon , nitrogen reallocation [31]. Transcriptomic data are correlative, however, and direct measurements of sugars, organic acids, hormones, and enzyme activities would be needed to substantiate these interpretations.
A methodological limitation should be acknowledged. The structural genes we mapped belong to the general phenylpropanoid/flavonoid pathway. The root-specific 4′-deoxyflavone branch genes—SbCHS-2, SbFNSII-2, SbF6H, and SbF8H [4,16]—could not be unequivocally resolved because of paralog complexity and annotation limits. Although we observed salt-induced transcriptional activation of the broader pathway, the branch-specific metabolite shift (baicalein versus wogonin) cannot be directly assigned to differential expression of these particular branch genes from our RNA-seq data alone [16]. Isoform-specific qPCR or targeted resequencing would be needed to settle this point.
3.3. Late Induced NACs are More Likely Sustainers Than Triggers—A Provisional Model
Among 52 transcription factor families, MYB, NAC, and WRKY dominated, matching their established roles in stress and secondary metabolism [35,40,42]. Of the 48 SbNAC genes profiled, 35 responded to 0.5% NaCl (FDR < 0.05), most being up-regulated at 24 h and a few repressed (SbNAC2, SbNAC51) (Supplementary Table S4). This late induction—well after the 12 h metabolite peak—implies that these NACs participate in sustaining or modulating later phases rather than triggering the initial surge [53,54]. In co-expression network (Figure 7C), certain WRKY (Sb03g41350), MYB (Sb04g02150), NAC (Sb08g17730 designated SbNAC86) members showed connections with PAL, 4CL, CHS, CHI, baicalin/baicalein contents. These correlations nominate them as candidates but could not demonstrate direct regulation. This promoters are directly bound and functionally relevant [43] or not still needs testing. Mfuzz clusters (Figure 7A) and metabolite profiles outline early signaling at 2-6 h, transient rise of core structural genes and peak baicalin/baicalein at 12 h, followed by a decline in structural genes at 24 h, many TFs are up-regulated. These late-acting transcription factors can attenuate the initial response and redirect carbon flux toward recovery pathways, thereby potentially systematically preparing the organism for subsequent metabolic waves. Late induction of NACs contribute to adjusting or sustaining the new metabolic balance, rather than initiating the flavonoid burst. SbNAC65, SbNAC30, SbNAC22 strongly induced only at 24 h after the metabolite peak, generating overexpression lines and measuring flavones at 36-72 h would clarify sustain or attenuate the baicalein-branch accumulation. Trait correlations the weak module further imply network more complex than our current data can resolve.
4. Materials and Methods
4.1. Plant Materials and Field-Density Experiment
Seeds of S. baicalensis were from experimental field station of Shihezi University. This field trial was conducted in accordance with local standard cultivation practices. In April, sowing seeds in nursery bed and one-month old seedlings transplanted to the field. one-month old seedlings were transplanted to the field at three densities: 50000, 100000, 150000 plants·mu-1 (1 mu ≈ 666.7 m2). The row spacing is 30 cm, plant spacing within each row is adjusted according to the planting density. This experiment employed a randomized complete block design with three replicates; each experimental plot measured 10 m in length and 3 m in width.Irrigation, weed management, and pest and disease control measures were uniformly implemented across all experimental plots; the crops were harvested one year after planting (October). The underground biomass per square meter was recorded, Root length and rhizome diameter were measured using a vernier caliper. All samples were collected using the biological replicate method rapidly frozen in liquid nitrogen, stored at −80 °C in freezer for subsequent analysis.
4.2. Salt Stress Treatment
For the seed germination experiment, 50 seeds were taken from each treatment group, treated with 75% ethanol for 30 seconds, 2% sodium hypochlorite for 10 minutes, rinsed three times with distilled water, and placed on filter paper soaked in sodium chloride solution (0, 0.1%, 0.2%, 0.3%, 0.4%, 0.5%, w/v), incubated them at 25 °C in dark. Calculate the germination rate, germination potential, and germination index in accordance with the Standard Operating Procedures. Irrigating established plants with 0.3-0.6% NaCl solutions, roots were collected at 2, 6, 12, 24 h after treatment. 0.5% NaCl treatment selected for transcriptome analysis for strongly inducing baicalin and baicalein. Growing seeds in plastic pots at 25 cm diameter with 2:1 mixture of garden soil and vermiculite. Each treatment had three independent biological replicates, Seedlings were 45 days old at treatment initiation. The morphological images of seedlings in Figure 2B using BioRender (https://biorender.com; accessed on 5 July 2026) [60].
4.3. Quantification of Root Flavones
We qualifying baicalin, wogonoside, baicalein, wogonin by ultra-performance liquid chromatography-tandem mass spectrometry (UPLC-MS/MS) using authenticated standards. Chromatographic separation performed on an ACQUITY UPLC BEH C18 column (1.7 μm, 2.1 × 50 mm, Waters, USA) at 30 °C. Mobile phases were (A) 0.1% formic acid in water and (B) acetonitrile, with gradient elution at 0.3 mL·min-1. Performing mass spectrometry in negative electrospray ionization mode with multiple reaction monitoring. The MRM transitions were baicalin m/z 445.1 → 269.1, wogonoside m/z 459.1 → 283.1, baicalein m/z 269.0 → 169.0, and wogonin m/z 283.1 → 268.1 (Supplementary Table S5). Construct a standard calibration curve by plotting the relationship between peak area and concentration (coefficient of determination> 0.999). Representative total-ion chromatograms of the four reference standards show in Supplementary Figure S4. Extract 0.5 g of dried root powder for 30 minutes using 10 mL of 70% methanol under ultrasonic treatment conditions. The extract was filtered through a 0.22 μm membrane before injection. Recovery rates ranged from 95.2% to 103.7%, and limits of detection were 0.05–0.2 μg/mL.
4.4. RNA Extraction, Library Construction and Sequencing
Total RNA was extracted from 0.5% NaCl-treated and time-matched control roots at 2, 6, 12, and 24 h using the RNAprep Pure Plant Kit (Tiangen, Beijing, China) following the manufacturer’s protocol. RNA integrity, purity, and concentration were assessed with an Agilent 2100 Bioanalyzer, and only samples with RIN ≥ 8.0 were used for library construction. cDNA libraries were prepared using the NEBNext Ultra RNA Library Prep Kit and sequenced on an Illumina platform with paired-end 150-bp reads. Three biological replicates were used per condition. Sequencing was performed on an Illumina NovaSeq 6000 platform (BGI Genomics, Shenzhen, China). Each sample generated approximately 12 Gb of clean data with Q30 > 92% and mapping rates > 85% (Supplementary Table S6). Detailed quality-control and mapping statistics for all samples are provided in Supplementary Table S2.
4.5. Transcriptome Analysis
Raw reads were filtered using fastp [51] to remove adapters and low-quality reads. Clean reads were mapped to the S. baicalensis reference genome (ASM835377v2 [16]; Genome Warehouse: GWHAOTC00000000) using HISAT2 [55,56], and expression levels were quantified as TPM using RSEM [57]. Differential expression between salt-treated and time-matched control samples was analyzed with DESeq2 [58] using |log₂ fold change| ≥ 1 and adjusted P-value (FDR) < 0.05. GO and KEGG enrichment analyses were performed with clusterProfiler [59]. WGCNA [37,48] was used to identify modules correlated with baicalin, wogonoside, baicalein, wogonin, and total flavonoid content. For WGCNA, a signed co-expression network was constructed with a soft-thresholding power of β = 4. Modules were defined by hierarchical clustering based on the topological overlap matrix, with a minimum module size of 30 genes and a merge cut height of 0.25 for combining similar modules. Before network construction, genes with a coefficient of variation (CV) below 0.1 were filtered out. Module eigengenes were calculated and correlated with the contents of baicalin, wogonoside, baicalein, and wogonin using Spearman’s rank correlation. Genes with module membership ≥ 0.3 were retained for subsequent module interpretation. Transcription factor families were classified using PlantTFDB [34] annotations. DESeq2 v1.30, WGCNA v1.70, and clusterProfiler v4.0 were used. The reference genome annotation (ASM835377v2) and PlantTFDB v5.0 were applied for transcription factor classification [28].
4.6. Candidate Gene Annotation
Candidate pathway genes were assigned according to the reference genome annotation and, where possible, by homology to functionally characterized S. baicalensis flavone-biosynthetic enzymes. Because several enzyme families contain multiple paralogues with different branch specificities, the distinction between general flavonoid genes and root-specific 4′-deoxyflavone genes was treated cautiously. Definitive assignment of salt-responsive genes to SbCHS-2, SbFNSII-2, SbF6H, SbF8H, SbUBGAT, or SbPFOMT orthologues should be further confirmed using sequence identity, coverage, phylogeny, and functional evidence.
4.7. qRT-PCR Validation
To validate the RNA-seq data, six differentially expressed genes (one PAL, three CHS, and two OMT genes) were selected from the flavonoid-related pathway. Primers were designed using Primer Premier 5.0 and are listed in Supplementary Table S7. Total RNA (1 μg) was reverse-transcribed into cDNA using the PrimeScript RT Reagent Kit (Takara, Japan). qRT-PCR was performed on a Roche LightCycler 480 system using SYBR Green I Master Mix. The S. baicalensis 18S rRNA gene was used as the internal reference according to previous studies. Relative expression was calculated using the 2⁻ΔΔCt method [61]. Three biological replicates and technical replicates were used.
4.8. Statistical Analysis
Quantitative data are presented as mean ± standard deviation (SD). Statistical significance among multiple groups was assessed by one-way ANOVA followed by Tukey’s HSD test [62] using GraphPad Prism. Different lowercase letters indicate significant differences at P < 0.05. For RNA-seq data, differential expression thresholds were |log₂ fold change| ≥ 1 and adjusted P-value (FDR) < 0.05.
5. Conclusions
High planting density and moderate salinity stress changed the accumulation mode of flavonoids through different mechanisms, planting density induced accept or reject between yield and quality, partially mitigated under moderate planting densities. Though, 0.5% sodium chloride treatment selectively promoted accumulation of baicalein branches in established seedlings. Transcriptomic data indicate that this metabolic response occurs during a brief period in the early stages, involves the transient upregulation of core phenylpropanoid metabolism genes within the turquoise co-expression module couples cytoskeletal dynamics with carbohydrate metabolism, possible role of this coupling could be channel carbon from primary metabolism into flavone biosynthesis. Late induced NAC transcription factors appear to sustain the accumulated state rather than trigger the initial burst, provides a valuable reference for future related research.
Supplementary Materials
The following supporting information can be downloaded at the website of this paper posted on Preprints.org.
Author Contributions
Conceptualization, Z.L., C.Z.; methodology, Z.L., K.Z., C.Z.; software, M.W., K.Z., T.Z.; validation, D.M., Y.Z.; formal analysis, Z.L., D.M.; investigation, Y.Z., C.Z., D.M., T.Z.; resources, H.Y.; data curation, Z.L., T.Z., K.Z.; writing—original draft preparation, Z.L., H.Y., Y.Z.; writing—review and editing, H.Y.; supervision, H.Y., M.W.; project administration, M.W.; funding acquisition, H.Y.. All authors have read and agreed to the published version of the manuscript.
Funding
This research was funded by the National Natural Science Foundation of China (grant numbers 32260083 and 82560747), the Shihezi University High-level Talent Research Startup Project (grant number RCZK202595), the Central Fund for Local Science and Technology Development (grant number 2026YD025), the Science and Technology Special Project (grant number 2025CC007), the Financial Science and Technology Plan of Tumushuke City (grant number KY2025JBGS03), the Key Field Projects of the Guangdong Province Key Construction Discipline Research Capacity Enhancement Project (grant number 2024ZDJS139), and the Key Field Science and Technology Research Project under the Financial Science and Technology Plan of Shihezi City (grant number 2026NY05).
Institutional Review Board Statement
Not applicable.
Informed Consent Statement
Not applicable.
Data Availability Statement
The metabolite and agronomic datasets supporting the figures are provided in Supplementary Figure S1–S6 and Supplementary Table S1–S7. The S. baicalensis reference genome assembly (ASM835377v2 [6]) used in this study is available from the Genome Warehouse (GWH) under accession GWHAOTC00000000.
Acknowledgments
We thank the staff of the Experimental Field of Shihezi University for assistance with field experiments and the sequencing service provider for library preparation and sequencing.
Conflicts of Interest
The authors declare no conflicts of interest.
Abbreviations
The following abbreviations are used in this manuscript:
| cDNA | Complementary DNA |
| CHI | Chalcone isomerase |
| CHS | Chalcone synthase |
| GO | Gene ontology |
| 4CL | 4-coumaroyl-CoA ligase |
| KEGG | Kyoto encyclopedia of genes and genomes |
| mRNA | Messenger RNA |
| PAL | Phenylalanine ammonia lyase |
| PCR | Polymerase chain reaction |
| qRT-PCR | Real-time quantitative PCR |
| RNA | Ribonucleic acid |
| WGCNA | Weighted Gene Co-expression Network Analysis |
| ANOVA | Analysis of variance |
| BLAST | Basic Local Alignment Search Tool |
| CK | Control (non-stressed samples) |
| DEG | Differentially expressed gene |
| FDR | False discovery rate |
| HQ | 0.5% NaCl-treated group |
| MRM | Multiple reaction monitoring |
| NCBI | National Center for Biotechnology Information |
| PCA | Principal component analysis |
| ROS | Reactive oxygen species |
| SD | Standard deviation |
| SRA | Sequence Read Archive |
| TF | Transcription factor |
| UPLC-MS/MS | Ultra-performance liquid chromatography-tandem mass spectrometry |
References
- Cole, I.B.; Cao, J.; Alan, A.R.; Saxena, P.K.; Murch, S.J. Comparisons of Scutellaria baicalensis, Scutellaria lateriflora and Scutellaria racemosa: Genome size, antioxidant potential and phytochemistry. Planta Med. 2008, 74, 474–481. [Google Scholar] [CrossRef] [PubMed]
- Hu, Z.; Guan, Y.; Hu, W.; Xu, Z.; Ishfaq, M. An overview of pharmacological activities of baicalin and its aglycone baicalein: New insights into molecular mechanisms and signaling pathways. Iran. J. Basic Med. Sci. 2022, 25, 14–26. [Google Scholar] [CrossRef] [PubMed]
- Zhao, Q.; Zhang, Y.; Wang, G.; Hill, L.; Weng, J.-K.; Chen, X.-Y.; Xue, H.; Martin, C. A specialized flavone biosynthetic pathway has evolved in the medicinal plant Scutellaria baicalensis. Sci. Adv. 2016, 2, e1501780. [Google Scholar] [CrossRef] [PubMed]
- Zhao, Q.; Cui, M.-Y.; Levsh, O.; Yang, D.; Liu, J.; Li, J.; Hill, L.; Yang, L.; Hu, Y.; Weng, J.-K.; et al. Two CYP82D enzymes function as flavone hydroxylases in the biosynthesis of root-specific 4′-deoxyflavones in Scutellaria baicalensis. Mol. Plant 2018, 11, 135–148. [Google Scholar] [CrossRef] [PubMed]
- Wang, Z.-L.; Wang, S.; Kuang, Y.; Hu, Z.-M.; Qiao, X.; Ye, M. A comprehensive review on phytochemistry, pharmacology, and flavonoid biosynthesis of Scutellaria baicalensis. Pharm. Biol. 2018, 56, 465–484. [Google Scholar] [CrossRef] [PubMed]
- Shang, X.; He, X.; He, X.; Li, M.; Zhang, R.; Fan, P.; Zhang, Q.; Jia, Z. The genus Scutellaria: An ethnopharmacological and phytochemical review. J. Ethnopharmacol. 2010, 128, 279–313. [Google Scholar] [CrossRef] [PubMed]
- Paton, A. A global taxonomic investigation of Scutellaria (Labiatae). Kew Bull. 1990, 45, 399–450. [Google Scholar] [CrossRef]
- Renda, G.; Şöhretoğlu, D. Wogonin: Advances on resources, biosynthetic pathway, bioavailability, bioactivity, and pharmacology. In Handbook of Dietary Flavonoids; Xiao, J., Ed.; Springer: Cham, Switzerland, 2023; pp. 1–19. [Google Scholar] [CrossRef]
- Zhao, T.; Tang, H.; Xie, L.; Zheng, Y.; Ma, Z.; Sun, Q.; Li, X. Scutellaria baicalensis Georgi. (Lamiaceae): A review of its traditional uses, botany, phytochemistry, pharmacology and toxicology. J. Pharm. Pharmacol. 2019, 71, 1353–1369. [Google Scholar] [CrossRef] [PubMed]
- Ma, W.; Liu, T.; Ogaji, O.D.; Li, J.; Du, K.; Chang, Y. Recent advances in Scutellariae Radix: A comprehensive review on ethnobotanical uses, processing, phytochemistry, pharmacological effects, quality control and influence factors of biosynthesis. Heliyon 2024, 10, e36146. [Google Scholar] [CrossRef] [PubMed]
- Zhao, Q.; Chen, X.-Y.; Martin, C. Scutellaria baicalensis, the golden herb from the garden of Chinese medicinal plants. Sci. Bull. 2016, 61, 1391–1398. [Google Scholar] [CrossRef] [PubMed]
- Guo, M.; Lv, H.; Chen, H.; Dong, S.; Zhang, J.; Liu, W.; He, L.; Ma, Y.; Yu, H.; Chen, S.; et al. Strategies on biosynthesis and production of bioactive compounds in medicinal plants. Chin. Herb. Med. 2024, 16, 13–26. [Google Scholar] [CrossRef] [PubMed]
- Zhu, S.; Cui, M.; Zhao, Q. Characterization of the 2ODD genes of DOXC subfamily and its members involved in flavonoids biosynthesis in Scutellaria baicalensis. BMC Plant Biol. 2024, 24, 804. [Google Scholar] [CrossRef] [PubMed]
- Wang, Z.; Du, X.; Ye, G.; Wang, H.; Liu, Y.; Liu, C.; Li, F.; Ågren, H.; Zhou, Y.; Li, J.; et al. Functional characterization, structural basis, and protein engineering of a rare flavonoid 2′-O-glycosyltransferase from Scutellaria baicalensis. Acta Pharm. Sin. B 2024, 14, 3746–3759. [Google Scholar] [CrossRef] [PubMed]
- Pei, T.; Yan, M.; Li, T.; Li, X.; Yin, Y.; Cui, M.; Fang, Y.; Liu, J.; Kong, Y.; Xu, P.; et al. Characterization of UDP-glycosyltransferase family members reveals how major flavonoid glycoside accumulates in the roots of Scutellaria baicalensis. BMC Genom. 2022, 23, 169. [Google Scholar] [CrossRef] [PubMed]
- Zhao, Q.; Yang, J.; Cui, M.-Y.; Liu, J.; Fang, Y.; Yan, M.; Qiu, W.; Shang, H.; Xu, Z.; Yidiresi, R.; et al. The reference genome sequence of Scutellaria baicalensis provides insights into the evolution of wogonin biosynthesis. Mol. Plant 2019, 12, 935–950. [Google Scholar] [CrossRef] [PubMed]
- Pei, T.; Yan, M.; Huang, Y.; Wei, Y.; Martin, C.; Zhao, Q. Specific flavonoids and their biosynthetic pathway in Scutellaria baicalensis. Front. Plant Sci. 2022, 13, 866282. [Google Scholar] [CrossRef] [PubMed]
- Zhang, H.; Zhu, J.; Gong, Z.; Zhu, J.-K. Abiotic stress responses in plants. Nat. Rev. Genet. 2022, 23, 104–119. [Google Scholar] [CrossRef] [PubMed]
- Ślusarczyk, S.; Grzelka, K.; Jaśpińska, J.; Pawlikowska-Bartosz, A.; Pecio, Ł.; Stafiniak, M.; Rahimmalek, M.; Słupski, W.; Cieślak, A.; Matkowski, A. Changes in growth and metabolic profile of Scutellaria baicalensis Georgi in response to sodium chloride. Biology 2024, 13, 1058. [Google Scholar] [CrossRef] [PubMed]
- Yang, L.; Wen, K.S.; Ruan, X.; Zhao, Y.X.; Wei, F.; Wang, Q. Response of plant secondary metabolites to environmental factors. Molecules 2018, 23, 762. [Google Scholar] [CrossRef] [PubMed]
- Jan, R.; Asaf, S.; Numan, M.; Lubna; Kim, K.-M. Plant secondary metabolite biosynthesis and transcriptional regulation in response to biotic and abiotic stress conditions. Agronomy 2021, 11, 968. [Google Scholar] [CrossRef]
- Nazari, M.; Ghasemi-Soloklui, A.A.; Kordrostami, M.; Abdel Latef, A.A.H. Deciphering the response of medicinal plants to abiotic stressors: A focus on drought and salinity. Plant Stress 2023, 10, 100255. [Google Scholar] [CrossRef]
- Mahajan, M.; Pal, P.K. Drought and salinity stress in medicinal and aromatic plants: Physiological response, adaptive mechanism, management/amelioration strategies, and an opportunity for production of bioactive compounds. Adv. Agron. 2023, 182, 221–273. [Google Scholar] [CrossRef]
- Li, P.; Ren, G.; Wu, F.; Chen, J.; Jiang, D.; Liu, C. Root-specific flavones and critical enzyme genes involved in their synthesis changes due to drought stress on Scutellaria baicalensis. Front. Ecol. Evol. 2023, 11, 1113823. [Google Scholar] [CrossRef]
- Cheng, L.; Han, M.; Yang, L.-M.; Li, Y.; Sun, Z.; Zhang, T. Changes in the physiological characteristics and baicalin biosynthesis metabolism of Scutellaria baicalensis Georgi under drought stress. Ind. Crops Prod. 2018, 122, 473–482. [Google Scholar] [CrossRef]
- Yang, Z.-C.; Yuan, Y.; Chen, M.; Shuai, L.-F.; Xiao, Q.; Lin, S.-F. Effects of PEG stress on flavonoids accumulation and related gene expression in suspension of Scutellaria baicalensis. China J. Chin. Mater. Med. 2011, 36, 2157–2161. [Google Scholar] [CrossRef]
- Zhang, T.; Zhang, C.; Wang, W.; Hu, S.; Tian, Q.; Li, Y.; Cui, L.; Li, L.; Wang, Z.; Cao, X.; et al. Effects of drought stress on the secondary metabolism of Scutellaria baicalensis Georgi and the function of SbWRKY34 in drought resistance. Plant Physiol. Biochem. 2025, 219, 109362. [Google Scholar] [CrossRef] [PubMed]
- Conesa, A.; Madrigal, P.; Tarazona, S.; Gomez-Cabrero, D.; Cervera, A.; McPherson, A.; Szczesniak, M.W.; Gaffney, D.J.; Elo, L.L.; Zhang, X.; et al. A survey of best practices for RNA-seq data analysis. Genome Biol. 2016, 17, 13. [Google Scholar] [CrossRef] [PubMed]
- Guo, D.; Zhu, Z.; Wang, Z.; Feng, F.; Cao, Q.; Xia, Z.; Jia, X.; Lv, D.; Han, T.; Chen, X. Multi-omics landscape to decrypt the distinct flavonoid biosynthesis of Scutellaria baicalensis across multiple tissues. Hortic. Res. 2024, 11, uhad258. [Google Scholar] [CrossRef] [PubMed]
- Jiang, Y.; Zhu, C.; Wang, S.; Wang, F.; Sun, Z. Identification of three cultivated varieties of Scutellaria baicalensis using the complete chloroplast genome as a super-barcode. Sci. Rep. 2023, 13, 5602. [Google Scholar] [CrossRef] [PubMed]
- Van Zelm, E.; Zhang, Y.; Testerink, C. Salt tolerance mechanisms of plants. Annu. Rev. Plant Biol. 2020, 71, 403–433. [Google Scholar] [CrossRef] [PubMed]
- Kanehisa, M.; Goto, S. KEGG: Kyoto Encyclopedia of Genes and Genomes. Nucleic Acids Res. 2000, 28, 27–30. [Google Scholar] [CrossRef]
- Winkel, B.S.J. Metabolic channeling in plants. Annu. Rev. Plant Biol. 2004, 55, 85–107. [Google Scholar] [CrossRef] [PubMed]
- Jin, J.; Tian, F.; Yang, D.-C.; Meng, Y.-Q.; Kong, L.; Luo, J.; Gao, G. PlantTFDB 4.0: Toward a central hub for transcription factors and regulatory interactions in plants. Nucleic Acids Res. 2017, 45, D1040–D1045. [Google Scholar] [CrossRef] [PubMed]
- Deng, Y.; Lu, S. Biosynthesis and regulation of phenylpropanoids in plants. Crit. Rev. Plant Sci. 2017, 36, 257–290. [Google Scholar] [CrossRef]
- Langfelder, P.; Horvath, S. WGCNA: An R package for weighted correlation network analysis. BMC Bioinform. 2008, 9, 559. [Google Scholar] [CrossRef] [PubMed]
- Zhang, B.; Horvath, S. A general framework for weighted gene co-expression network analysis. Stat. Appl. Genet. Mol. Biol. 2005, 4, 17. [Google Scholar] [CrossRef] [PubMed]
- Azam, M.; Zhang, S.; Li, J.; Ahsan, M.; Agyenim-Boateng, K.G.; Qi, J.; Feng, Y.; Liu, Y.; Li, B.; Qiu, L.; et al. Identification of hub genes regulating isoflavone accumulation in soybean seeds via GWAS and WGCNA approaches. Front. Plant Sci. 2023, 14, 1120498. [Google Scholar] [CrossRef] [PubMed]
- Zhang, Q.; Ye, Z.; Wang, Y.; Zhang, X.; Kong, W. Haplotype-resolution transcriptome analysis reveals important responsive gene modules and allele-specific expression contributions under continuous salt and drought in Camellia sinensis. Genes 2023, 14, 1417. [Google Scholar] [CrossRef] [PubMed]
- Fang, S.; Qiu, S.; Chen, K.; Lv, Z.; Chen, W. The transcription factors SbMYB45 and SbMYB86.1 regulate flavone biosynthesis in Scutellaria baicalensis. Plant Physiol. Biochem. 2023, 200, 107794. [Google Scholar] [CrossRef] [PubMed]
- Wu, J.-W.; Zhao, Z.-Y.; Hu, R.-C.; Huang, Y.-F. Genome-wide identification, stress- and hormone-responsive expression characteristics, and regulatory pattern analysis of Scutellaria baicalensis SbSPLs. Plant Mol. Biol. 2024, 114, 20. [Google Scholar] [CrossRef] [PubMed]
- Nuruzzaman, M.; Sharoni, A.M.; Kikuchi, S. Roles of NAC transcription factors in the regulation of biotic and abiotic stress responses in plants. Front. Microbiol. 2013, 4, 248. [Google Scholar] [CrossRef] [PubMed]
- Fang, Y.; Liu, J.; Zheng, M.; Zhu, S.; Pei, T.; Cui, M.; Chang, L.; Xiao, H.; Yang, J.; Martin, C.; et al. SbMYB3 transcription factor promotes root-specific flavone biosynthesis in Scutellaria baicalensis. Hortic. Res. 2023, 10, uhac266. [Google Scholar] [CrossRef] [PubMed]
- Sweetlove, L.J.; Fernie, A.R. The spatial organization of metabolism within the plant cell. Annu. Rev. Plant Biol. 2013, 64, 723–746. [Google Scholar] [CrossRef] [PubMed]
- Wang, W.; Hu, S.; Zhang, C.; Yang, J.; Zhang, T.; Wang, D.; Cao, X.; Wang, Z. Systematic analysis and functional characterization of R2R3-MYB genes in Scutellaria baicalensis Georgi. Int. J. Mol. Sci. 2022, 23, 9342. [Google Scholar] [CrossRef] [PubMed]
- Lim, J.; Yeo, H.J.; Kim, K.; Seo, H.; Kim, J.K.; Park, S.U. Effect of sodium chloride on flavone biosynthesis and antioxidant activities in hairy root culture of Scutellaria baicalensis. Korean J. Med. Crop Sci. 2025, 33, 51–59. [Google Scholar] [CrossRef]
- Sun, Z.-R.; Zhai, M.-P.; Wang, W.-Q.; Li, Y.-R. Effects of density on seedling growth and glycyrrhizinic acid content in Glycyrrhiza uralensis. China J. Chin. Mater. Med. 2007, 32, 2222–2226. [Google Scholar] [PubMed]
- Liu, H.; Gu, H.; Ye, C.; Guo, C.; Zhu, Y.; Huang, H.; Liu, Y.; He, X.; Yang, M.; Zhu, S. Planting density affects Panax notoginseng growth and ginsenoside accumulation by balancing primary and secondary metabolism. Front. Plant Sci. 2021, 12, 628294. [Google Scholar] [CrossRef] [PubMed]
- Hadacek, F.; Bachmann, G.; Engelmeier, D.; Chobot, V. Hormesis and a chemical raison d’être for secondary plant metabolites. Dose-Response 2011, 9, 79–116, Hadacek. [Google Scholar]
- Nakabayashi, R.; Saito, K. Integrated metabolomics for abiotic stress responses in plants. Curr. Opin. Plant Biol. 2015, 24, 10–16. [Google Scholar] [CrossRef] [PubMed]
- Chen, S.; Zhou, Y.; Chen, Y.; Gu, J. fastp: An ultra-fast all-in-one FASTQ preprocessor. Bioinformatics 2018, 34, i884–i890. [Google Scholar] [CrossRef]
- Yuan, Z.; Zhang, C.; Zhu, W.; Yan, G.; Chen, X.; Qiu, P.; Ruzimurod, B.; Ye, W.; Bobokhonova, Z.Q.; Yin, Z. Molecular mechanism that underlies cotton response to salt and drought stress revealed by complementary transcriptomic and iTRAQ analyses. Environ. Exp. Bot. 2023, 209, 105288. [Google Scholar] [CrossRef]
- Shao, H.; Wang, H.; Tang, X. NAC transcription factors in plant multiple abiotic stress responses: Progress and prospects. Front. Plant Sci. 2015, 6, 902. [Google Scholar] [CrossRef] [PubMed]
- Wang, Z.; Zhang, Z.; Wang, P.; Qin, C.; He, L.; Kong, L.; Ren, W.; Liu, X.; Ma, W. Genome-wide identification of the NAC transcription factors family and regulation of metabolites under salt stress in Isatis indigotica. Int. J. Biol. Macromol. 2023, 240, 124436. [Google Scholar] [CrossRef] [PubMed]
- Kim, D.; Langmead, B.; Salzberg, S.L. HISAT: A fast spliced aligner with low memory requirements. Nat. Methods 2015, 12, 357–360. [Google Scholar] [CrossRef] [PubMed]
- Kim, D.; Paggi, J.M.; Park, C.; Bennett, C.; Salzberg, S.L. Graph-based genome alignment and genotyping with HISAT2 and HISAT-genotype. Nat. Biotechnol. 2019, 37, 907–915. [Google Scholar] [CrossRef] [PubMed]
- Li, B.; Dewey, C.N. RSEM: Accurate transcript quantification from RNA-seq data with or without a reference genome. BMC Bioinform. 2011, 12, 323. [Google Scholar] [CrossRef] [PubMed]
- Love, M.I.; Huber, W.; Anders, S. Moderated estimation of fold change and dispersion for RNA-seq data with DESeq2. Genome Biol. 2014, 15, 550. [Google Scholar] [CrossRef]
- Yu, G.; Wang, L.-G.; Han, Y.; He, Q.-Y. clusterProfiler: An R package for comparing biological themes among gene clusters. OMICS 2012, 16, 284–287. [Google Scholar] [CrossRef] [PubMed]
- BioRender. Available online: biorender.com (accessed on. (accessed on 5 July 2026).
- Livak, K.J.; Schmittgen, T.D. Analysis of relative gene expression data using real-time quantitative PCR and the 2⁻ΔΔCT method. Methods 2001, 25, 402–408. [Google Scholar] [CrossRef] [PubMed]
- Tukey, J.W. Comparing individual means in the analysis of variance. Biometrics 1949, 5, 99–114. [Google Scholar] [CrossRef]
Figure 1.
Agronomic plasticity under different planting densities. (A) Field growth comparison across three planting densities (50,000, 100,000 and 150,000 plants·mu-1). The recommended density under the present conditions is 100,000 plants·mu-1. (B) Belowground biomass at different planting densities. Values are mean ± SD (n = 3). (C) Rhizome diameter (upper panel) and root length (lower panel) under different planting densities. (D) Contents of four major root flavones in response to planting density. Different lowercase letters indicate significant differences among densities. Note: 1 mu ≈ 666.7 m2. Significance levels: ns, P > 0.05; *, 0.01 < P ≤ 0.05; **, 0.001 < P ≤ 0.01; ***, 0.0001 < P ≤ 0.001; ****, P ≤ 0.0001.
Figure 1.
Agronomic plasticity under different planting densities. (A) Field growth comparison across three planting densities (50,000, 100,000 and 150,000 plants·mu-1). The recommended density under the present conditions is 100,000 plants·mu-1. (B) Belowground biomass at different planting densities. Values are mean ± SD (n = 3). (C) Rhizome diameter (upper panel) and root length (lower panel) under different planting densities. (D) Contents of four major root flavones in response to planting density. Different lowercase letters indicate significant differences among densities. Note: 1 mu ≈ 666.7 m2. Significance levels: ns, P > 0.05; *, 0.01 < P ≤ 0.05; **, 0.001 < P ≤ 0.01; ***, 0.0001 < P ≤ 0.001; ****, P ≤ 0.0001.
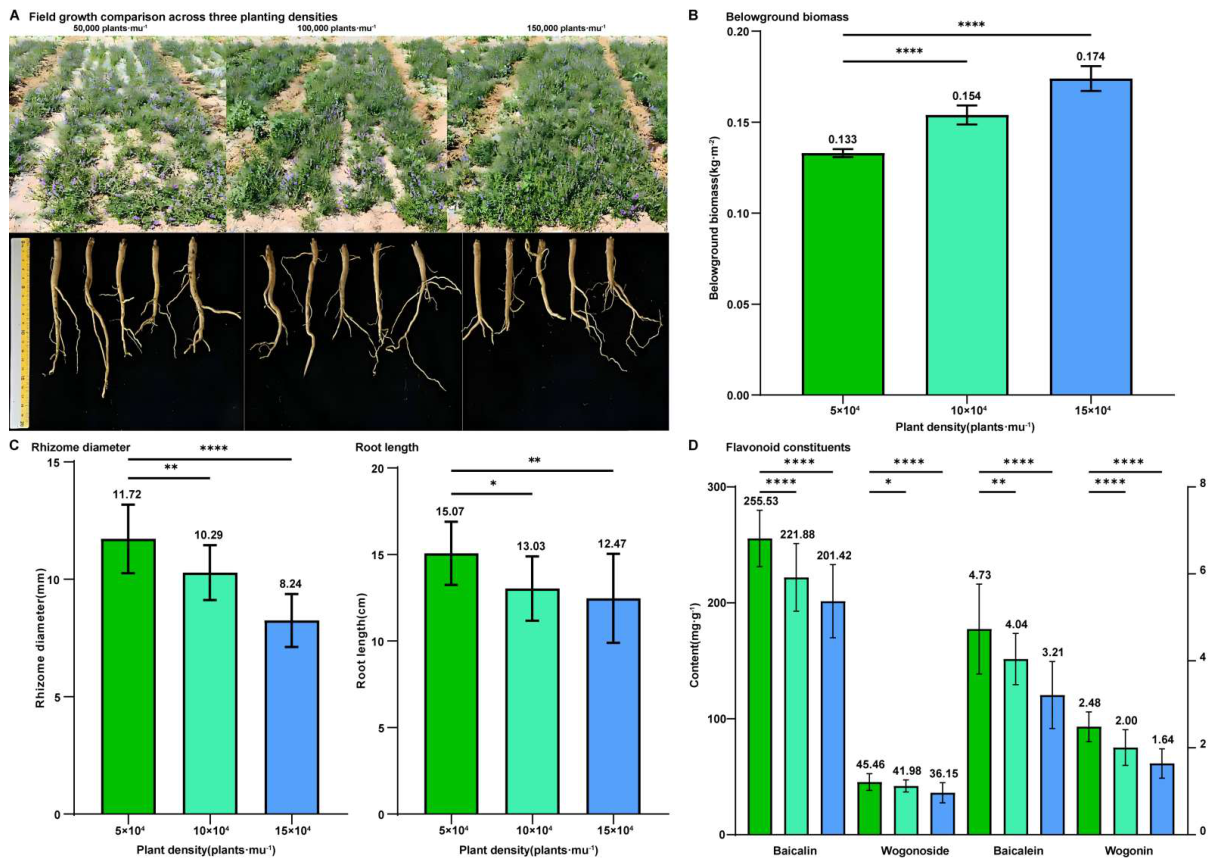
Figure 2.
Moderate salt stress induces flavonoid accumulation. (A) Seed germination percentage, germination potential and germination index under different NaCl concentrations (0%, 0.1%, 0.2%, 0.3%, 0.4% and 0.5%). (B) Morphological responses of seedlings after 15 d of salt stress: 0% NaCl (normal growth), 0.5% NaCl (generally normal growth) and 0.6% NaCl (yellowing and wilting). (C) Time-course changes of four major flavones (baicalin, wogonoside, baicalein and wogonin) under selected salt-stress conditions. (D) Total number of differentially expressed genes (DEGs) at each time point (upper), and the corresponding counts of up- and down-regulated DEGs (lower).
Figure 2.
Moderate salt stress induces flavonoid accumulation. (A) Seed germination percentage, germination potential and germination index under different NaCl concentrations (0%, 0.1%, 0.2%, 0.3%, 0.4% and 0.5%). (B) Morphological responses of seedlings after 15 d of salt stress: 0% NaCl (normal growth), 0.5% NaCl (generally normal growth) and 0.6% NaCl (yellowing and wilting). (C) Time-course changes of four major flavones (baicalin, wogonoside, baicalein and wogonin) under selected salt-stress conditions. (D) Total number of differentially expressed genes (DEGs) at each time point (upper), and the corresponding counts of up- and down-regulated DEGs (lower).
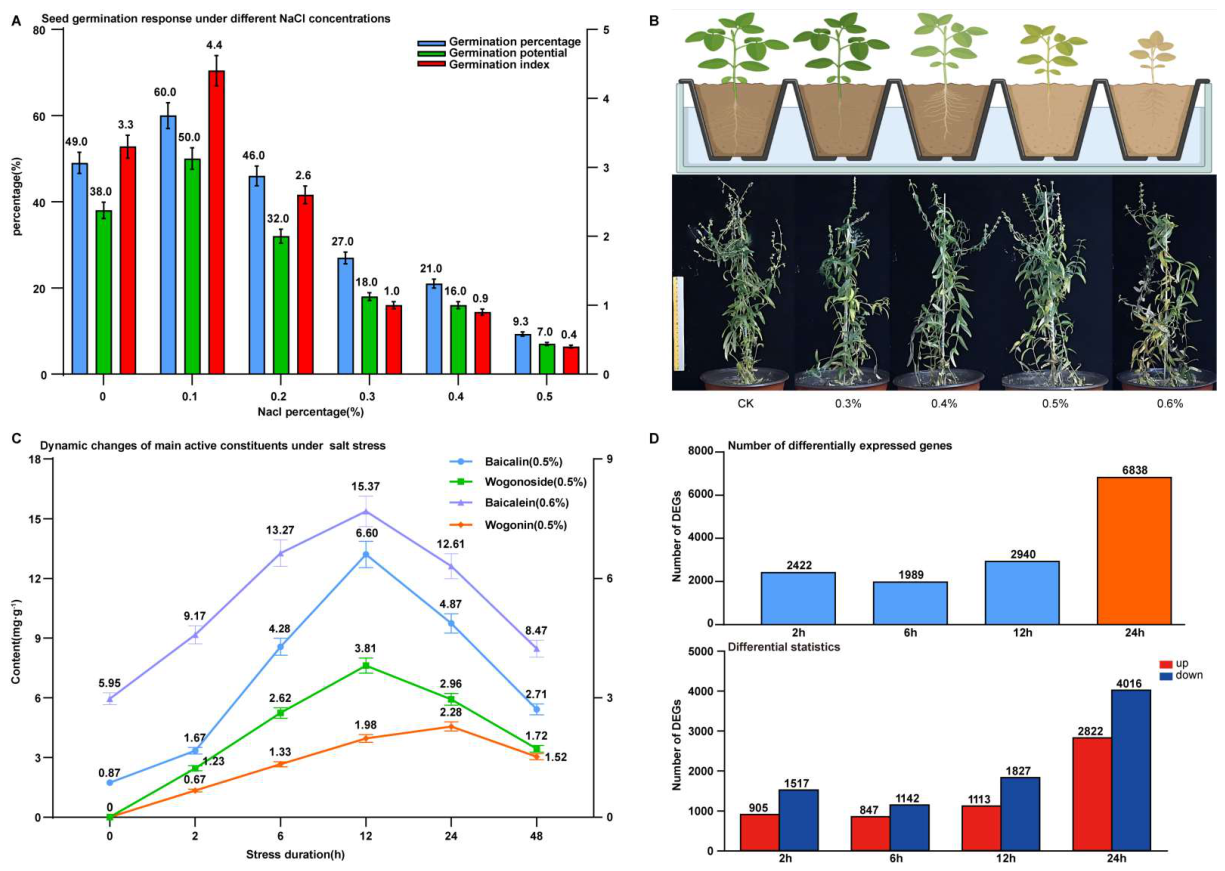
Figure 3.
Transcriptomic responses and expression of flavonoid pathway genes in S. baicalensis roots under NaCl stress. (A) Principal component analysis (PCA) of transcriptomes from control (CK) and treated (HQ) samples at 2, 6, 12, 24 h. (B) KEGG annotations analysis of genes in turquoise WGCNA module. (C) Pearson correlation heatmap across samples. Grid values are correlation coefficients, denotes strong correlation and weak correlation, dendrograms show hierarchical clustering of sample replicates. (D) Venn diagram displaying the overlapping and unique DEGs among pairwise comparisons.
Figure 3.
Transcriptomic responses and expression of flavonoid pathway genes in S. baicalensis roots under NaCl stress. (A) Principal component analysis (PCA) of transcriptomes from control (CK) and treated (HQ) samples at 2, 6, 12, 24 h. (B) KEGG annotations analysis of genes in turquoise WGCNA module. (C) Pearson correlation heatmap across samples. Grid values are correlation coefficients, denotes strong correlation and weak correlation, dendrograms show hierarchical clustering of sample replicates. (D) Venn diagram displaying the overlapping and unique DEGs among pairwise comparisons.
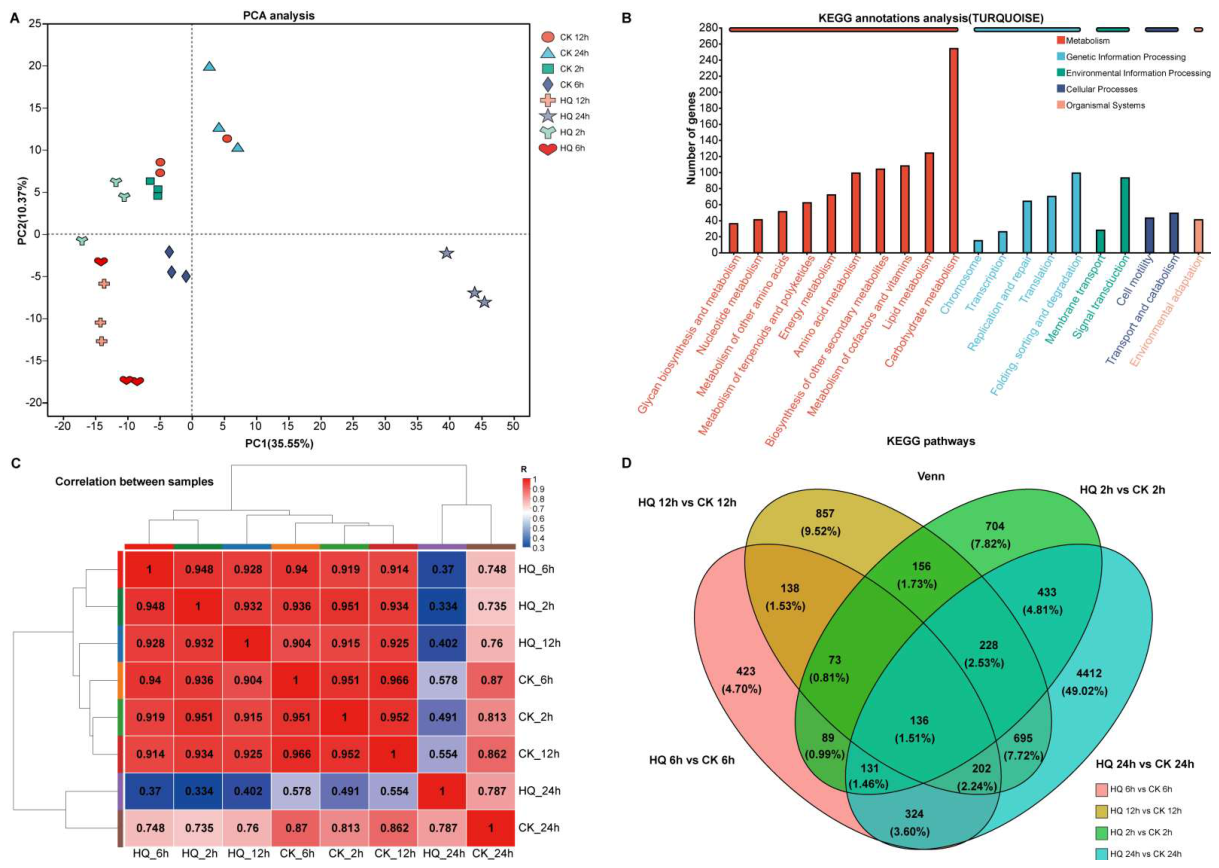
Figure 4.
Gene Ontology (GO) enrichment analysis of DEGs and the turquoise module in Scutellaria baicalensis. (A) Bubble plots of GO enrichment for DEGs (HQ vs. CK) at 2, 6, 12, and 24 h. (B) Sankey diagram (left) linking genes to GO terms, and bubble plot (right) of GO enrichment for the turquoise module.
Figure 4.
Gene Ontology (GO) enrichment analysis of DEGs and the turquoise module in Scutellaria baicalensis. (A) Bubble plots of GO enrichment for DEGs (HQ vs. CK) at 2, 6, 12, and 24 h. (B) Sankey diagram (left) linking genes to GO terms, and bubble plot (right) of GO enrichment for the turquoise module.
Disclaimer/Publisher’s Note: The statements, opinions and data contained in all publications are solely those of the individual author(s) and contributor(s) and not of MDPI and/or the editor(s). MDPI and/or the editor(s) disclaim responsibility for any injury to people or property resulting from any ideas, methods, instructions or products referred to in the content. |
© 2026 by the authors. Licensee MDPI, Basel, Switzerland. This article is an open access article distributed under the terms and conditions of the Creative Commons Attribution (CC BY) license.
Copyright: This open access article is published under a Creative Commons CC BY 4.0 license, which permit the free download, distribution, and reuse, provided that the author and preprint are cited in any reuse.