

Submitted:
23 September 2026
Posted:
24 September 2026
You are already at the latest version
Abstract
Unsaturated polyester resin (UPR) composites containing 0.02–1.00 %wt. ZnO nanoparticles (ZnO NPs) were prepared using an MEKP–cobalt octanoate curing system and evaluated for sanitary sewer components. The influence of ZnO NPs content on chemical structure, hardness, tensile and flexural properties, scratch resistance, thermal behaviour, and surface characteristics was investigated using FTIR, XRD, mechanical testing, TGA, DSC, optical surface analysis, and SEM. Based on the initial screening, composites containing 0.06, 0.75, and 1.00 %wt. of ZnO NPs were selected for detailed characterisation and subsequent 28-day exposure to activated sludge. The effect of ZnO NPs content was not uniform across the investigated properties. Among the comprehensively characterised formulations, 0.06 wt.% ZnO NPs provided the most favourable overall balance, retaining a tensile strength of 41.20 ± 2.08 MPa while increasing Td,5% from 359.6 °C for pristine UPR to 368.4 °C and Tmax from 410.9 to 422.5 °C. No statistically significant mass changes were observed after activated-sludge exposure, indicating good bulk stability. However, surface roughness and heterogeneity increased, with Ra rising from 0.26 to 1.01 µm for the 0.06%_ZnO NPs composite. Overall, this formulation appears the most promising for further development toward sanitary sewer applications.
Keywords:
composites
; unsaturated polyester resin
; zinc oxide nanoparticles
; exposure to activated sludge
1. Introduction
Pipelines are widely used worldwide and play a vital role in many industries. However, their use is associated with several problems, which can be reduced by using composite materials [1]. Growing demands for structural integrity, durability and chemical resistance have spurred the development of advanced polymer-matrix composites [2]. Both metallic and composite systems offer effective solutions for transporting water, wastewater, crude oil, and gas, but are susceptible to different degradation mechanisms. In metal structures, the main threat is corrosion, which reduces mechanical properties, while in composite materials, matrix cracking, surface abrasion, and associated leaks may occur [1]. A particular problem in sewerage systems is microbiologically induced corrosion, which can significantly shorten the service life of the infrastructure and justifies the need to seek more durable material solutions [2].
Material selection for plastic pipe production is a crucial stage in the design process. Different polymer groups are characterised by varying mechanical, chemical, and thermal properties. The most commonly used materials are thermoplastics (polyethylene (PE) and polyamides (PA)) and thermosetting (resins) are most commonly used [1,3,4]. Importantly, thermoplastic materials offer significant advantages for recycling and post-moulding processing. However, they require higher processing temperatures due to their low melt flow rate [5]. PE, in particular HDPE and PE100, is one of the most commonly used materials for producing pipes intended for the transmission of water and gas, due to its favourable combination of durability, flexibility, resistance to environmental factors, and relatively low operating costs [6,7]. PA, primarily PA11 and PA12, are mainly used in more demanding pipework systems, including underwater installations for the transport of oil and gas, where their high resistance to stress creep and material fatigue, good barrier properties and ability to operate at higher temperatures and pressures than typical PE systems are utilised [8,9,10]. Engineering polymers, such as polyether ether ketone (PEEK), are also attracting increasing interest. These materials retain their favourable mechanical properties even during prolonged exposure to elevated temperatures and humidity, and are resistant to typical chemicals found in the oil industry [11]. As mentioned earlier, chemically curable plastics are also used in pipe manufacturing, including vinyl ester resins, which combine favourable mechanical properties and, thanks to their lower content of ester groups susceptible to hydrolysis, also exhibit increased resistance to moisture, corrosion, and aggressive chemical environments [12].
In this context, unsaturated polyester resins are widely used because of their low cost, ease of processing, and the ability to adjust their viscosity using reactive diluents, such as styrene, which makes it easier to adapt processing parameters to the requirements of the production process [2,13]. At the same time, their limited resistance to prolonged exposure to aggressive environmental factors, as well as concerns regarding the use of conventional monomers and diluents, are prompting a search for more sustainable solutions. To this end, research is being conducted into the use of bio-based raw materials, including dimethyl itaconate, whilst ensuring that the resulting composites retain the appropriate mechanical and functional properties [14]. In parallel, strategies are being developed to modify resin composition and synthesis, including the use of anhydrides such as orthophthalic anhydride, phthalic anhydride, and maleic anhydride, which may improve mechanical strength and increase material durability compared with conventional polyester systems [15,16].
Apart from environmental considerations and regulatory pressures associated with using styrene as a reactive diluent, conventional unsaturated polyester resins are susceptible to moisture absorption and chemical degradation, which may affect structural integrity when used to manufacture pipes for transporting aggressive reagents [17,18,19]. Efforts are underway to develop more stable composite materials that offset the drawbacks associated with their lack of structural stability. For materials intended for sewer pipe construction, it is particularly important to test them in contact with media that reflect real-world conditions, such as sewage [20,21]. This is particularly significant because it represents a complex environment containing, among other things, sulphates, ionised substances, and microorganisms, including heterotrophic bacteria (e.g., Pseudomonas spp., Bacillus spp. and others), nitrifying and denitrifying bacteria, fungi, and yeasts (Aspergillus spp., Penicillium spp., Candida spp., or Cladosporium spp.) [22,23].
The production of composites containing zinc oxide nanoparticles (ZnO NPs) is of particular interest due to the favourable properties of these nanomaterials. ZnO NPs are characterised, among other things, by high chemical stability and a relatively favourable toxicological profile, which facilitates the design of composite materials that maintain structural integrity under chemically aggressive conditions [24,25,26]. A further advantage is their potential antimicrobial activity, which may be significant in the complex microbiological environment found in wastewater [25,26]. However, optimising the quantity of these nanoparticles introduced into the polymer matrix is critical. The reason for this is that too high a quantity may cause agglomeration, significantly affecting the cross-linking kinetics and leading to mechanical damage. On the other hand, low concentrations can provide a real enhancement, helping increase either tensile strength or flexural strength [26,27,28].
In this study, composites based on unsaturated polyester resin modified with ZnO NPs over a wide concentration range (0.02–1.00%wt.) were prepared. These were cured at room temperature using the MEKP–cobalt octanoate redox system. Varying nanofiller contents enabled assessment of curing-related spectral changes using FTIR spectroscopy, as well as on the crystallographic structure and mechanical properties of the composites. Based on the results, three representative ZnO concentration were selected for further, in-depth investigations into the thermal, physicochemical, and surface properties. In the final stage, the composites were exposed to activated sewage sludge for 28 days to assess their stability under a complex wastewater-related environment by monitoring changes in mass, surface morphology, topography, and roughness. The results allowed assessment of the materials’ stability under conditions similar to those in a sewerage environment, as well as their potential suitability for applications related to constructing parts of sanitary sewage systems.
2. Materials and Methods
2.1. Materials
An unsaturated polyester resin (UPR) was selected as the polymer matrix because it is commonly used in the manufacture of pipes and tanks by the Continuous Filament Winding (CFW) process and was supplied by Ciech Sarzyna S.A., Nowa Sarzyna, Poland. As specified by the manufacturer, the uncured resin contains approximately 44 wt.% styrene and has a viscosity of approximately 205 mPa·s at 23 °C, whereas the flexural strength of the cured polyester resin is approximately 86 MPa. No additional purification or pretreatment was performed before use. The curing system consisted of a 4% cobalt octanoate solution as an accelerator and methyl ethyl ketone peroxide (MEKP; Butanox® M-50, AkzoNobel, Amsterdam, Netherlands) as the curing initiator. The commercial MEKP formulation contained 8.8–9.0% total active oxygen. Prior to casting, the mold surfaces were coated with a wax-based release agent, Paste Wax 34D, Abel Industrie, to facilitate removal of the cured specimens. Zinc oxide nanoparticles (ZnO NPs, CAS No. 1314-13-2) were selected as the nanofiller and obtained from Sigma-Aldrich, Darmstadt, Germany, and it characterisation was performed in previous study and presented in Table 1 [29].
Potassium dihydrogen phosphate (KH2PO4), dipotassium hydrogen phosphate (K2HPO4), disodium hydrogen phosphate dihydrate (Na2HPO4·2H2O), ammonium chloride (NH4Cl), calcium chloride dihydrate (CaCl2·2H2O), magnesium sulfate heptahydrate (MgSO4·7H2O), and iron(III) chloride hexahydrate (FeCl3·6H2O), hydrochloric acid were obtained from Chempur, Piekary Śląskie, Poland. Formaldehyde solution (37% v/v) and ethanol were purchased from Avantor Performance Materials, Gdańsk, Poland. Activated sludge used as the inoculum was collected from the aeration tank of a municipal wastewater treatment plant located in Kraków, Poland.
2.2. Preparation of Composites
Polyester resin-based samples were prepared by a conventional casting method. For each batch, 300 g of polyester resin was weighed and transferred into a plastic container. Before processing, the resin was thermally equilibrated at 23 °C until it reached a constant temperature to ensure uniform processing conditions and minimise viscosity fluctuations. In the case of nanocomposite samples, ZnO NPs were incorporated into the resin at selected concentrations of 0.02 – 1.00%wt. ZnO NPs and dispersed in the resin matrix before curing. Subsequently, a 4% cobalt octoate solution was added to the temperature-equilibrated resin as an accelerator. The mixture was mechanically stirred for 15 min at 850 rpm using an EUROSTAR 20 digital stirrer, IKA-Werke GmbH & Co. KG, Staufen, Germany. During stirring, the container with the resin mixture was placed in a water bath maintained at 23 °C to prevent temperature variations caused by mechanical mixing and to ensure homogeneous dispersion of the components. After this stage, 6 mL of methyl ethyl ketone peroxide (MEKP) was added as an organic peroxide curing initiator, and the mixture was stirred for an additional 2 min to obtain a uniform reactive system (Table 2). The prepared resin mixture was then poured into moulds fabricated according to the dimensions required by the relevant testing standards. Before casting, the mould surfaces were coated with a wax-based release agent to facilitate demoulding of the cured samples. After filling, the moulds were closed and tightened using a carpenter’s clamp to ensure proper mould alignment and to limit dimensional deviations during curing. The initial hardening process was carried out for 1 h at room temperature. After this period, the samples were removed from the moulds and left undisturbed for 24 h to complete the curing process. Finally, post-curing was performed in an oven at 60 °C in order to reduce internal stresses and improve the final material properties. This curing and post-curing procedure was not followed by any additional solvent-removal step prior to thermal analysis.
2.3. Methods
2.3.1. Inductively Coupled Plasma Mass Spectrometry
Elemental analysis was performed using an inductively coupled plasma mass spectrometer (ICP-MS; iCAP Q, Thermo Fisher Scientific, Bremen, Germany). Prior to analysis, representative portions of the composite samples were subjected to closed-vessel microwave-assisted mineralisation using a MARS X microwave sample preparation system (CEM Corporation, Matthews, NC, USA). Mineralization was carried out in an oxidizing HNO3/H2O2 medium, following the general approach commonly applied for elemental analysis by ICP-MS. After mineralization and cooling, the digests were quantitatively transferred, diluted with ultrapure water, and subjected to ICP-MS analysis. Measurements were performed at an RF power of 1548.6 W, with plasma, auxiliary, and nebulizer gas flow rates of 13.956, 0.8021, and 1.02464 dm3 min−1, respectively. The acquisition time was 0.005 s, and ten instrumental readings were recorded for each analytical series. Zn concentrations were recalculated relative to the mass of the analyzed composite sample and expressed as mg Zn g−1. The theoretical Zn content corresponding to the nominal ZnO loading was calculated stoichiometrically using the Zn mass fraction in ZnO. Based on the molar masses of Zn (65.38 g mol−1) and ZnO (81.38 g mol−1), the Zn mass fraction in ZnO was 0.8034. Accordingly, nominal ZnO contents of 0.1, 0.5, and 1.0 wt.% correspond to theoretical Zn contents of approximately 0.803, 4.017, and 8.034 mg g−1, respectively. The ZnO-equivalent content corresponding to the ICP-MS-determined Zn concentration was calculated as .
2.3.2. Fourier-Transform Infrared Spectroscopy
FTIR spectra were recorded using a Spectrum One spectrometer (PerkinElmer, Waltham, MA, USA) equipped with an attenuated total reflectance (ATR) accessory. Measurements were performed at room temperature over the wavenumber range of 4000 – 650 cm−1, at room temperature, using 32 scans per sample and a spectral resolution of 4 cm—1.
2.3.3. X-Ray Diffraction
The crystal structures of the samples were analyzed by X-ray diffraction using a D8 Discover diffractometer, Bruker AXS GmbH, Karlsruhe, Germany. Cu Kα radiation (λ = 1.54 Å) generated by an X-ray tube operated at 40 kV and 30 mA was employed. Diffraction patterns were collected over a 2θ range of 2–70° with a step size of 0.04°.
2.3.4. Scratch Resistance Test
Scratch resistance was evaluated under a constant applied load using an HM1.0 scratch tester (S/N 5201709006) at the Anti-Corrosion Laboratory of Tenslab S. z o.o., Gdańsk, Poland. Environmental conditions were monitored using a PosiTector DPM thermohygrometer (S/N 817245) equipped with a probe (S/N 331597). Tests were performed at 22 °C and 51% relative humidity under a normal load of 20 N, in accordance with PN-EN ISO 1518:2023. The resulting scratch tracks were then examined to assess the materials’ resistance to surface damage.
2.3.5. Microhardness Testing
Vickers microhardness measurements were performed using an HMV-G21S microhardness tester, Shimadzu Corporation, Kyoto, Japan, equipped with a Vickers diamond indenter. A test load of 0.490 N (HV0.05) was applied for 15 s, and the Vickers hardness was determined from the measured diagonals of the residual indentation.
2.3.6. Tensile Testing
Tensile tests were performed using a CY-6040 universal testing machine, Chun Yen Testing Machines Co., Ltd., Taichung, Taiwan. Tensile strength and Young’s modulus were determined from the recorded stress–strain curves. For each composite formulation, five dumbbell-shaped specimens (n = 5) were prepared for tensile testing in accordance with PN-EN ISO 527-1:2012. For standard type 1A specimens, the nominal overall length was 170 mm, the width of the narrow parallel section was 10 mm, and the thickness was 4 mm.
2.3.7. Flexural Testing
Three-point bending tests were performed using an AGS-X universal testing machine, Shimadzu Corporation, Kyoto, Japan at a crosshead speed of 10 mm·min−1. Flexural strength and flexural modulus were determined from the obtained force–deflection data. For each composite formulation, five rectangular beam-shaped specimens (n = 5) were prepared for flexural testing in accordance with PN-EN ISO 178:2011. The nominal specimen dimensions were 80 × 10 × 4 mm (length × width × thickness).
2.3.8. Thermogravimetric Analysis
Thermogravimetric measurements were carried out using a Pyris 1 TGA analyzer (PerkinElmer) at the Department of Materials Science and Engineering, National Chung Hsing University, Taiwan. Samples weighing approximately 5–10 mg were heated from room temperature to 900 °C at a heating rate of 10 °C·min−1. The analysis was initially performed under a nitrogen atmosphere up to 750 °C, after which the purge gas was switched to air and the samples were further heated to 900 °C.
2.3.9. Differential Scanning Calorimetry
Differential scanning calorimetry measurements were carried out with a DSC 3500 Sirius calorimeter, NETZSCH-Gerätebau GmbH, Selb, Germany. Composites with masses of approximately 10–20 mg were placed in sealed aluminium pans and analyzed under a continuous nitrogen purge of 20 mL·min−1. The thermal programme consisted of two heating runs separated by a cooling stage, covering the temperature interval from −50 to 250 °C. A constant rate of 10 K·min−1 was applied during both heating segments and during cooling.
2.3.10. Optical Microscopy and Surface Roughness Analysis
Surface morphology and topography were examined using a VHX-7000 4K digital microscope (Keyence Corporation, Osaka, Japan) before and after the 28-day activated sludge exposure test. Digital images were acquired at a resolution of 4000 × 3000 pixels using the high dynamic range (HDR) and depth-composition functions to improve the visualization of surface irregularities and enable three-dimensional reconstruction of areas exhibiting pronounced height differences. Surface observations and topographical measurements were performed at magnifications of 500× and 2000×. The microscope-integrated analysis software was used to obtain two-dimensional micrographs, three-dimensional surface reconstructions, and height profiles. Surface texture was evaluated using both profile- and area-based roughness parameters. The profile analysis included the arithmetic mean roughness (Ra), root mean square roughness (Rq), maximum height of the profile (Rz), and profile skewness (Rsk), whereas the areal analysis included the arithmetic mean height (Sa) and additional three-dimensional surface parameters. Multiple line profiles were collected from different regions of each analyzed area to account for spatial variations in surface morphology. The parameters determined before and after activated sludge exposure were compared to identify changes in surface roughness and topography associated with the incubation process.
No additional cleaning procedure specifically intended to remove residual release agent was performed prior to the initial surface analysis, as the specimens were characterised in their as-manufactured, post-demoulding state. The same mould-preparation, release-agent application, and demoulding procedure was applied to all formulations to maintain consistent processing conditions. A possible contribution of residual release agent to the absolute initial roughness values cannot therefore be completely excluded.
2.3.11. Scanning Electron Microscopy
Scanning electron microscopy was used to compare the surface features and fracture morphology of the composite specimens before and after 28-day exposure to activated sludge. Observations were carried out with a JSM-IT200 scanning electron microscope, JEOL Ltd., Tokyo, Japan, under low-vacuum conditions at an accelerating voltage of 10 kV. Images were recorded at 100× and 250× magnification. Prior to imaging, both external and fracture surfaces were sputter-coated with a thin gold layer using a DII-29030SCTR coater (JEOL Ltd., Tokyo, Japan). The micrographs were then examined for changes in surface topography, fracture characteristics, structural discontinuities, and possible nanofiller agglomeration resulting from, or present after, activated-sludge exposure.
2.3.12. Exposure of Composite Samples to Activated Sludge
Preparation of Mineral Salts Medium
To prepare 5 L of mineral salts medium (MSM), approximately 4.5 L of demineralized water was placed in a glass vessel and continuously stirred. Subsequently, 50 mL of stock solution A, containing 8.50 g·L−1 KH2PO4, 21.70 g·L−1 K2HPO4, 34.00 g·L−1 Na2HPO4·2H2O, and 0.50 g·L−1 NH4Cl, was added to the water. After complete mixing, 5 mL of stock solution B (36.40 g·L−1 CaCl2·2H2O) was introduced slowly under continuous stirring, followed by 5 mL of stock solution C (22.50 g·L−1 MgSO4·7H2O). Finally, 5 mL of stock solution D (0.25 g·L−1 FeCl3·6H2O) was added slowly while maintaining continuous stirring. Each stock solution was added only after the previously introduced component had been completely dispersed. Direct mixing of the concentrated stock solutions was avoided to minimise local precipitation. The medium was then brought to a final volume of 5 L with demineralized water and thoroughly mixed. The pH of MSM was adjusted with 1 M hydrochloric acid (HCl) before combining it with the activated sludge [30].
Preparation and Preconditioning of Activated Sludge Inoculum
Activated sludge was collected from the aeration tank of a municipal wastewater treatment plant located in Krakow, Poland. Prior to inoculum preparation, the activated sludge was filtered to separate the biomass-rich fraction from the liquid phase. The fraction retained on the filter was collected for further use, whereas the filtrate was discarded. The inoculum was prepared by combining MSM and the filtered activated sludge at a volumetric ratio of 70:30. The mixture was preconditioned for 5 days at room temperature, under continuous agitation at 200 rpm, in the dark [30].
Activated Sludge Exposure Test
Following the 5-day preconditioning period, the composite specimens were weighed to determine their initial mass and subsequently introduced into incubation vessels containing 400 mL of the preconditioned inoculum. Accordingly, each vessel contained 280 mL of MSM and 120 mL of activated sludge. Depending on the composite formulation, the total mass of specimens placed in each vessel ranged from 12.31 ± 0.81 to 16.69 ± 0.31 g. The samples were incubated for 28 days at room temperature, under continuous agitation at 200 rpm, in the dark. The experiments were performed in triplicate (n = 3).
2.4. Statistical Analysis
Statistical analysis was performed using one-way analysis of variance (ANOVA), followed by Tukey’s HSD post hoc test for multiple pairwise comparisons between groups. Differences were considered statistically significant at *p < 0.05; **p < 0.01, and ***p < 0.001. Results are presented as mean ± standard error (SE). All statistical analyses were performed using OriginPro software, OriginLab Corporation, Northampton, MA, USA.
3. Results
For hybrid composites intended for use in sewerage systems, it is essential to comprehensively assess how both material composition and manufacturing parameters affect the material’s performance characteristics. Even relatively minor changes in nanofiller content, its incorporation method, or the curing system used can affect the cross-linking process, the dispersion of the inorganic phase, the material structure, and, consequently, its mechanical and surface properties as well as its environmental resistance. For this reason, in this study a series of composites based on unsaturated polyester resin (UPR), and containing ZnO NPs in a wide concentration range from 0.02 to 1.00%wt. were prepared. These materials were subjected to preliminary characterisation using FTIR spectroscopy, XRD analysis, mechanical testing, and a scratch resistance test, enabling assessment of curing-related changes in the polymer matrix, structure, and mechanical properties of the composites. Based on the results, three representative ZnO NPs contents were selected, covering both lower and higher nanofiller concentrations, and were then subjected to in-depth thermal, physicochemical, and surface characterisation and compared with unmodified UPR resin. Figure 1 presents the concept and scheme of the conducted studies, including the method of preparation and curing of the composites, the characterisation techniques employed, and the 28-day exposure of selected materials to an activated sludge environment, following which changes in their properties and surface morphology were assessed.
3.1. Quantitative Determination of Zn Content by ICP-MS
ICP-MS analysis showed that the zinc content increased with an increase in the nominal ZnO NPs content in the composites. At the same time, the experimentally determined Zn concentrations were lower than the theoretical values calculated on the basis of the nominal ZnO NPs content (Table 3). For composites containing 0.1 and 0.5%wt. of ZnO, the determined Zn content was ~50% of the theoretical value, whilst for the sample containing 1.0%wt. of ZnO NPs it was ~38%. Based on the available data, it is not possible to definitively determine the cause of these differences. They may have been influenced, amongst other things, by the representativeness of the samples taken and the analytical recovery. However, these factors were not assessed separately. Therefore, the ICP-MS results should be treated as a quantitative determination of Zn in the analysed material portions, rather than as a complete balance of the ZnO NPs content in the entire composites.
3.2. Comparative Characterisation of UPR/ZnO Composites Across a Broad ZnO Concentration Range
3.2.1. Fourier Transform Infrared Spectroscopy
FTIR analysis (Figure 2a) confirmed that all the materials studied retained the characteristic chemical structure of cured unsaturated polyester resin. The spectra were dominated by a strong absorption band in the range of approximately 1720–1730 cm−1, attributed to the stretching vibrations of the C=O in the ester groups. Furthermore, characteristic absorption bands in the range 2950–2850 cm−1 were observed, which were associated with stretching vibrations of aliphatic C–H groups. In turn, the characteristic absorption bands at 1600 and 1490 cm−1 were attributed mainly to vibrations of aromatic structures. Furthermore, the absorption bands in the 1230–1070 cm−1 range were attributed to the stretching vibrations of C–O and C–O–C present in the ester bonds [31,32,33]. Particular attention was paid to the spectral region around 1645–1648 cm−1, which is associated with the stretching vibrations of unsaturated C=C groups in UPR. Previous studies have shown that this band is significantly attenuated during curing, as the double bonds are consumed during cross-linking [31,33]. Chabrs et al. reported the disappearance of the band at approximately 1645 cm−1 following the curing of an unsaturated polyester resin, whilst Chencheni et al. observed a significant weakening of the vinyl C=C band at 1648 cm−1 in cured UPR-based composites [31,33]. Moreover, the introduction of ZnO nanoparticles in the concentration range of 0.02–1% wt. did not result in the appearance of any new distinct absorption bands or significant shifts in the characteristic bands. This indicates that adding the nanofiller did not fundamentally alter the chemical structure of the cured polyester matrix, consistent with earlier observations by Franco-Urquiza [33].
The band at approximately 982 cm−1 is associated with residual unsaturation in the polyester backbone and has been assigned to –R–CH=CH–R structures in UPR systems [34,35]. Its decrease during curing therefore reflects the conversion of polyester C=C bonds [34]. Next, the A1645/A1720 and A982/A1720 ratios (Table 4, Figure 2b) were calculated to compare residual unsaturation among the investigated materials. Because the polyester-related band at ~982 cm−1 may partly overlap with the neighboring styrene-related bands at ~992 cm−1, both ratios were interpreted only as semi-quantitative indicators of residual unsaturation [35]. Notably, the A1645/A1720 ratio did not show a clear dependence on the ZnO NPs concentration. Similarly, the complementary ratios A982/A1720 also varied across the formulations studied. It is worth noting that, in the case of composites containing 0.75 and 1.00% %wt., both ZnO NPs ratios were lower than in the case of pristine UPR. The A1645/A1720 ratio dropped from 0.494 to ~0.292, whilst the A982/ A1720 dropped from 0.674 to 0.219, for 0.75%_Zn0 NPs and 1%_Zn0 NPs. However, neither ratio showed the same concentration-dependent profile across all formulations, as shown by the 0.5%_Zn0 NPs composite. Consequently, the FTIR parameters are interpreted merely as semi-quantitative indicators of differences in residual unsaturation and do not provide direct evidence of a specific radical reaction pathway during curing. The disappearance of the C=C band in the 1645–1648 cm−1 range during UPR curing has previously been reported in the literature by Chabrós et al. and was associated with the effectiveness of the curing process [31].
3.2.2. X-Ray Diffraction
XRD analysis (Figure 3) was performed to evaluate the phase structure of the studied composites and to identify changes associated with an increase in the ZnO NPs content. The pristine UPR resin exhibited a broad diffraction halo extending to ~30° 2θ, with a maximum located at ~20° 2θ, characteristic of the predominantly amorphous cross-linked polyester matrix. In comparison, the ZnO-containing composites showed progressively more distinct reflections in the region characteristic of crystalline ZnO. A similar broad signal was also present for all composites containing ZnO NPs. However, no significant shift in the position of the maxium ~20° 2θ was observed with increasing nanofiller content. Similar broad signals have been previously described by Chencheni et al. and Nguyen et al. for pristine UPR and UPR-based composites and have been attributed to the amorphous structure of the polyester matrix [32,36]. Nevertheless, the diffraction patterns of composites containing ZnO NPs exhibited reflections characteristic of the crystalline ZnO NPs, whose intensity increased as its content increased. The signals recorded at 31.8°, 34.4°, and 36.3° 2θ were attributed to the (100), (002), and (101) crystallographic planes of the hexagonal wurtzite structure of ZnO, respectively. These results are consistent with those previously published by Stępka et al. [29].
3.2.3. Scratch Resistance Test
In Table S1, photographs of the results of the scratch resistance test at a constant load of 20 N are presented. Based on the results, no obvious relationship was found between the ZnO NPs content and the visibility of scratches. The differences observed between the individual composites were minor and did not show a consistent trend with increasing ZnO NPs concentration. For pristine UPR and most composites containing ZnO NPs, only slightly visible scratches were observed. In samples containing 0.04% and 1% ZnO NPs, the resulting scratches were very difficult to detect. In summary, the addition of ZnO NPs did not significantly impair the scratch resistance of the materials compared to the UPR.
3.2.4. Microhardness Test
Hardness testing is an important complementary method for characterising the mechanical properties of composites, because it allows their local resistance to plastic deformation and compression to be assessed. Figure 4 and Table 5 present the results of Vickers microhardness tests for pristine UPR and ZnO NP-modified composites. The pristine UPR exhibited the highest Vickers hardness, at ~154 HV. Among the composites, the highest values were obtained for 0.25% ZnO NPs (132 HV) and 0.08% ZnO NPs (131 HV), while the lowest value was recorded for 0.5% ZnO NPs (101 HV). This indicates that introducing ZnO NPs decreased hardness. However, the changes did not show a clear dependence on nanofiller content. This may be related, among other things, to the nanofiller distribution within the composite.
3.2.5. Tensile and Flexural Properties
Table 6 and Figure 5 present the results of tests on the mechanical properties of pure UPR resin and ZnO NPs-modified composites, including Young’s modulus and tensile strength, as well as flexural modulus and flexural strength. Pristine UPR exhibited the highest Young’s modulus, which was 3269.12 ± 121.30 MPa. The presence of ZnO NPs resulted in a statistically significant decrease in this parameter in all tested composites (*p < 0.001), suggesting a reduction in their tensile stiffness. However, no monotonic relationship was observed between the ZnO NPs content and the Young’s modulus value. Among the modified materials, the highest Young’s modulus was obtained for 0.25%_ZnO NPs (1846.25 ± 42.36 MPa), corresponding to a decrease of ~43.5% compared to UPR, while the lowest value was obtained for 0.75%_ZnO NPs (1165.50 ± 219.53 MPa), for which the reduction was ~64.3%, compared to UPR (Table 6, Figure 5a). Similarly, no clear trend related to increased ZnO NPs content was observed for tensile strength. For pristine UPR, this value reached 46.56 ± 1.45 MPa. A statistically significant decrease (*p < 0.05) was observed for 0.04%_ZnO NPs and 0.75%_ZnO NPs, where tensile strength was 36.75 ± 2.43 and 29.00 ± 5.48 MPa, respectively (Table 6, Figure 5b). This corresponded to a decrease of ~21.1% and 37.7% compared to UPR, respectively. At the same time, for composites: 0.1%_ZnO NPs and 0.25%_ ZnO NPs, the tensile strength remained similar to that of the pristine UPR, indicating that even at these concentrations of the nanofiller, the composites retained their mechanical properties.
Further, the flexural modulus of pristine UPR was 2543.10 ± 178.74 MPa (Table 6, Figure 5c). As with the other mechanical parameters, no clear correlation was found between this value and the ZnO NPs content. However, 0.1% ZnO NPs composite is particularly interesting, as its flexural modulus increased by ~31.1% compared to UPR, reaching 3334.83 ± 124.94 MPa (**p < 0.01). This result indicates increased stiffness under bending loads. Further increasing the nanofiller content did not improve flexural modulus, and for 1%_ZnO NPs, a significant decrease of ~34.2% relative to UPR was observed (1,673.40 ± 66.46 MPa; **p < 0.01). In turn, the flexural strength of pristine UPR was 82.50 ± 5.08 MPa (Table 6, Figure 5d). The highest value was observed for the 0.1%_ZnO NPs (85.56 ± 1.30 MPa), which corresponds to an increase of ~3.7% compared to UPR. However, this difference was not statistically significant. The lowest value of flexural strength was observed for the 1%_ZnO NPs (58.05 ± 2.03 MPa; *p < 0.01), corresponding to a decrease of ~29.6% compared to the UPR. What’s more, a statistically significant decrease in this parameter was also observed for following composites: 0.04%_ZnO NPs, 0.06%_ZnO NPs, 0.08%_ZnO NPs, and 0.5%_ZnO NPs (*p < 0.05).
3.3. Thermal Properties
3.3.1. Thermogravimetric Analysis
TGA analysis was carried out to assess the thermal stability of UPR and nanocomposites containing ZnO NPs (Figure 6, Table 7). A small but measurable mass loss was observed below 200 °C for the investigated materials. In cured UPR systems, such low-temperature mass loss may be associated with the release of absorbed moisture, residual solvent, residual styrene, and other low-molecular-weight volatile species [37,38,39]. In the presented materials, the contribution of residual volatiles cannot be completely excluded because no dedicated solvent-removal step was performed after curing and post-curing. Accordingly, this initial mass loss was not assigned to degradation of the cross-linked polyester backbone. Thermal decomposition occurred predominantly in a single main stage under N2, with values between 410.2 and 422.5 °C (Figure S1) , corresponding to degradation of the polymer matrix. After reaching 750 °C and switching the atmosphere to air, a second mass-loss stage was observed, with between 765.9 and 768.6 °C (Table 7), corresponding primarily to oxidation of the carbonaceous residue formed during pyrolysis. A similar behaviour was reported by Krishnan et al., who attributed this additional mass-loss stage in air to oxidation of char [39]. Further, the values did not show a consistent dependence on ZnO content. For neat UPR, was 359.6 °C. The addition of 0.06% ZnO NPs increased this value to 368.4 °C, whereas for the 0.75%_ZnO NPs and 1%_ZnO NPs nanocomposites it decreased to 348.2 and 354.1 °C, respectively (Table 7). Although the low-temperature mass loss remained below 5% for all materials, as indicated by values above 348 °C, residual volatile species may contribute to the cumulative mass loss used to determine . Therefore, is considered here as a comparative operational parameter of thermal stability rather than the exact onset temperature of polyester backbone degradation. The 0.06%_ZnO NPs composite therefore exhibited a higher than neat UPR, whereas the 0.75%_ZnO NPs and 1%_ZnO NPs composites showed lower values. This observation is consistent with the findings of Franco-Urquiza et al., who showed that ZnO can affect the degradation kinetics of UPR, although changes in the onset of decomposition do not necessarily translate into a clear enhancement of the overall thermal stability [33]. After heating to 750 °C under N2, the residual mass was 3.50% for neat UPR and ranged from 4.73 to 6.71% for the ZnO NPs-containing composites, indicating a higher fraction of non-volatile residue in the modified materials. After switching to an oxidising atmosphere, the char was almost completely oxidised, with the final residue at 850 °C ranging from 0 to 0.45% (Table 7). Krishnan et al. reported a similarly pronounced decrease in the residual mass of UPR under oxidising conditions compared with N2, attributing this behaviour to oxidation of the carbonaceous char [39].
3.3.2. Differential Scanning Calorimetry
Differential Scanning Calorimetry (DSC) analysis (Figures S2-S9) was carried out to assess the effect of ZnO NPs on the glass transition temperature (Tg) and the presence of residual cross-linking effects in the UPR matrix. The Tg values ranged from 107.6 to 113.2 °C and did not show a clear dependence on the ZnO NPs content. For pure UPR, it was 108.9 °C, while the highest value was recorded for the 1% ZnO NPs composite, reaching 113.2 °C. An exothermic residual cross-linking effect was observed only for 0.06%_ZnO NPs and 1%_ZnO NPs at 114.9 and 127.1 °C, respectively, with enthalpies of 4.89 and 3.70 J g−1 (Table 8). The absence of a similar effect for pure UPR and the 0.75% ZnO NPs composite indicates that the influence of ZnO NPs on the curing behaviour was also not continuous.
– enthalpy of the residual cross-linking exotherm; – glass transition temperature.
3.4. Surface Response of Nanocomposites to Activated Sludge Exposure
Measurements of roughness and topography parameters were carried out both before and after 28 days’ exposure to activated sludge. Establishing the initial values of roughness and topography parameters made it possible to distinguish the effect of the ZnO NPs content on the original topography of the composites from the changes induced by contact with activated sludge. Table S2 presents the mass measurements taken before and after the experiments, in which the composites were exposed to active sewage sludge for 28 days. No statistically significant changes in mass were recorded between the start of the experiment and day 28, which confirms that UPR-based materials do not exhibit biodegradability.
Importantly, surface analysis carried out prior to exposure to activated sludge showed that, even in their initial state, the formulations under investigation differed in terms of surface morphology and topography. Registered images indicated the presence of local elevations and depressions of varying amplitude depending on the ZnO NPs content (Figure 7, Figure 8, Figure 9 and Figure 10). The most distinctly developed topography was observed for the composite containing 1% ZnO NPs (Figure 10), for which the height profile was characterised by deeper local depressions and a greater amplitude of variation than in the case of UPR and composites with a lower ZnO NPs concentration.
Further, SEM observations of cross-sections supplemented by EDS mapping was presented to assess the distribution of single components within the material. In the case of pure UPR (Figure 11), the signal originated mainly from elements associated with the polymer matrix, whilst in the composite containing ZnO NPs, a distinct Zn signal was additionally observed. The distribution of the Zn signal was punctate and locally inhomogeneous, indicating the presence of ZnO nanoparticles in the matrix (Figure 12). Moreover, EDS maps confirmed the presence of Zn on the surface of the ZnO NPs-modified UPR composite, whilst no signal for this element was observed for the pure resin (Figure 12, Figures S10-S11).
Following 28 days’ exposure to activated sludge, changes in the surface morphology and topography of the materials were observed that were clearly dependent on their composition. Representative surface images, 3D reconstructions and the corresponding height profiles are shown in Figure 13, Figure 14, Figure 15 and Figure 16. For pristine UPR, the surface after exposure was characterised by relatively small changes in height along the analysed profile and a more even topography compared with the initial state (Figure 13). Interestingly, following exposure to activated sewage sludge, the surface of the 0.06%_ZnO NPs composite exhibited a more heterogeneous topography, characterized by increased local height variations evident in both the 3D topographic map and the corresponding surface profile (Figure 14). A similar effect, albeit with a slightly different spatial distribution, was observed for 0.75%_ZnO NPs (Figure 15). The topographical map following exposure indicated greater height variation across the analysed area. Interestingly, in the case of the 1%_ZnO NPs composite, the changes were of a different nature. The depth profile was more uniform than before incubation, although there were still localised regions with significant depth (Figure 16).
Furter, the surface roughness measurements were supplemented by SEM analysis of the UPR and 0.06%_ZnO NPs composite surfaces after 28 days of exposure (Figure S12). In the case of UPR, the surface remained relatively continuous, whereas the 0.06%_ZnO NPs composite exhibited more numerous local inhomogeneities and isolated surface defects. The SEM observations are therefore consistent with the surface roughness results, indicating a more developed and heterogeneous surface of the 0.06%_ZnO NPs composite following contact with activated sludge.
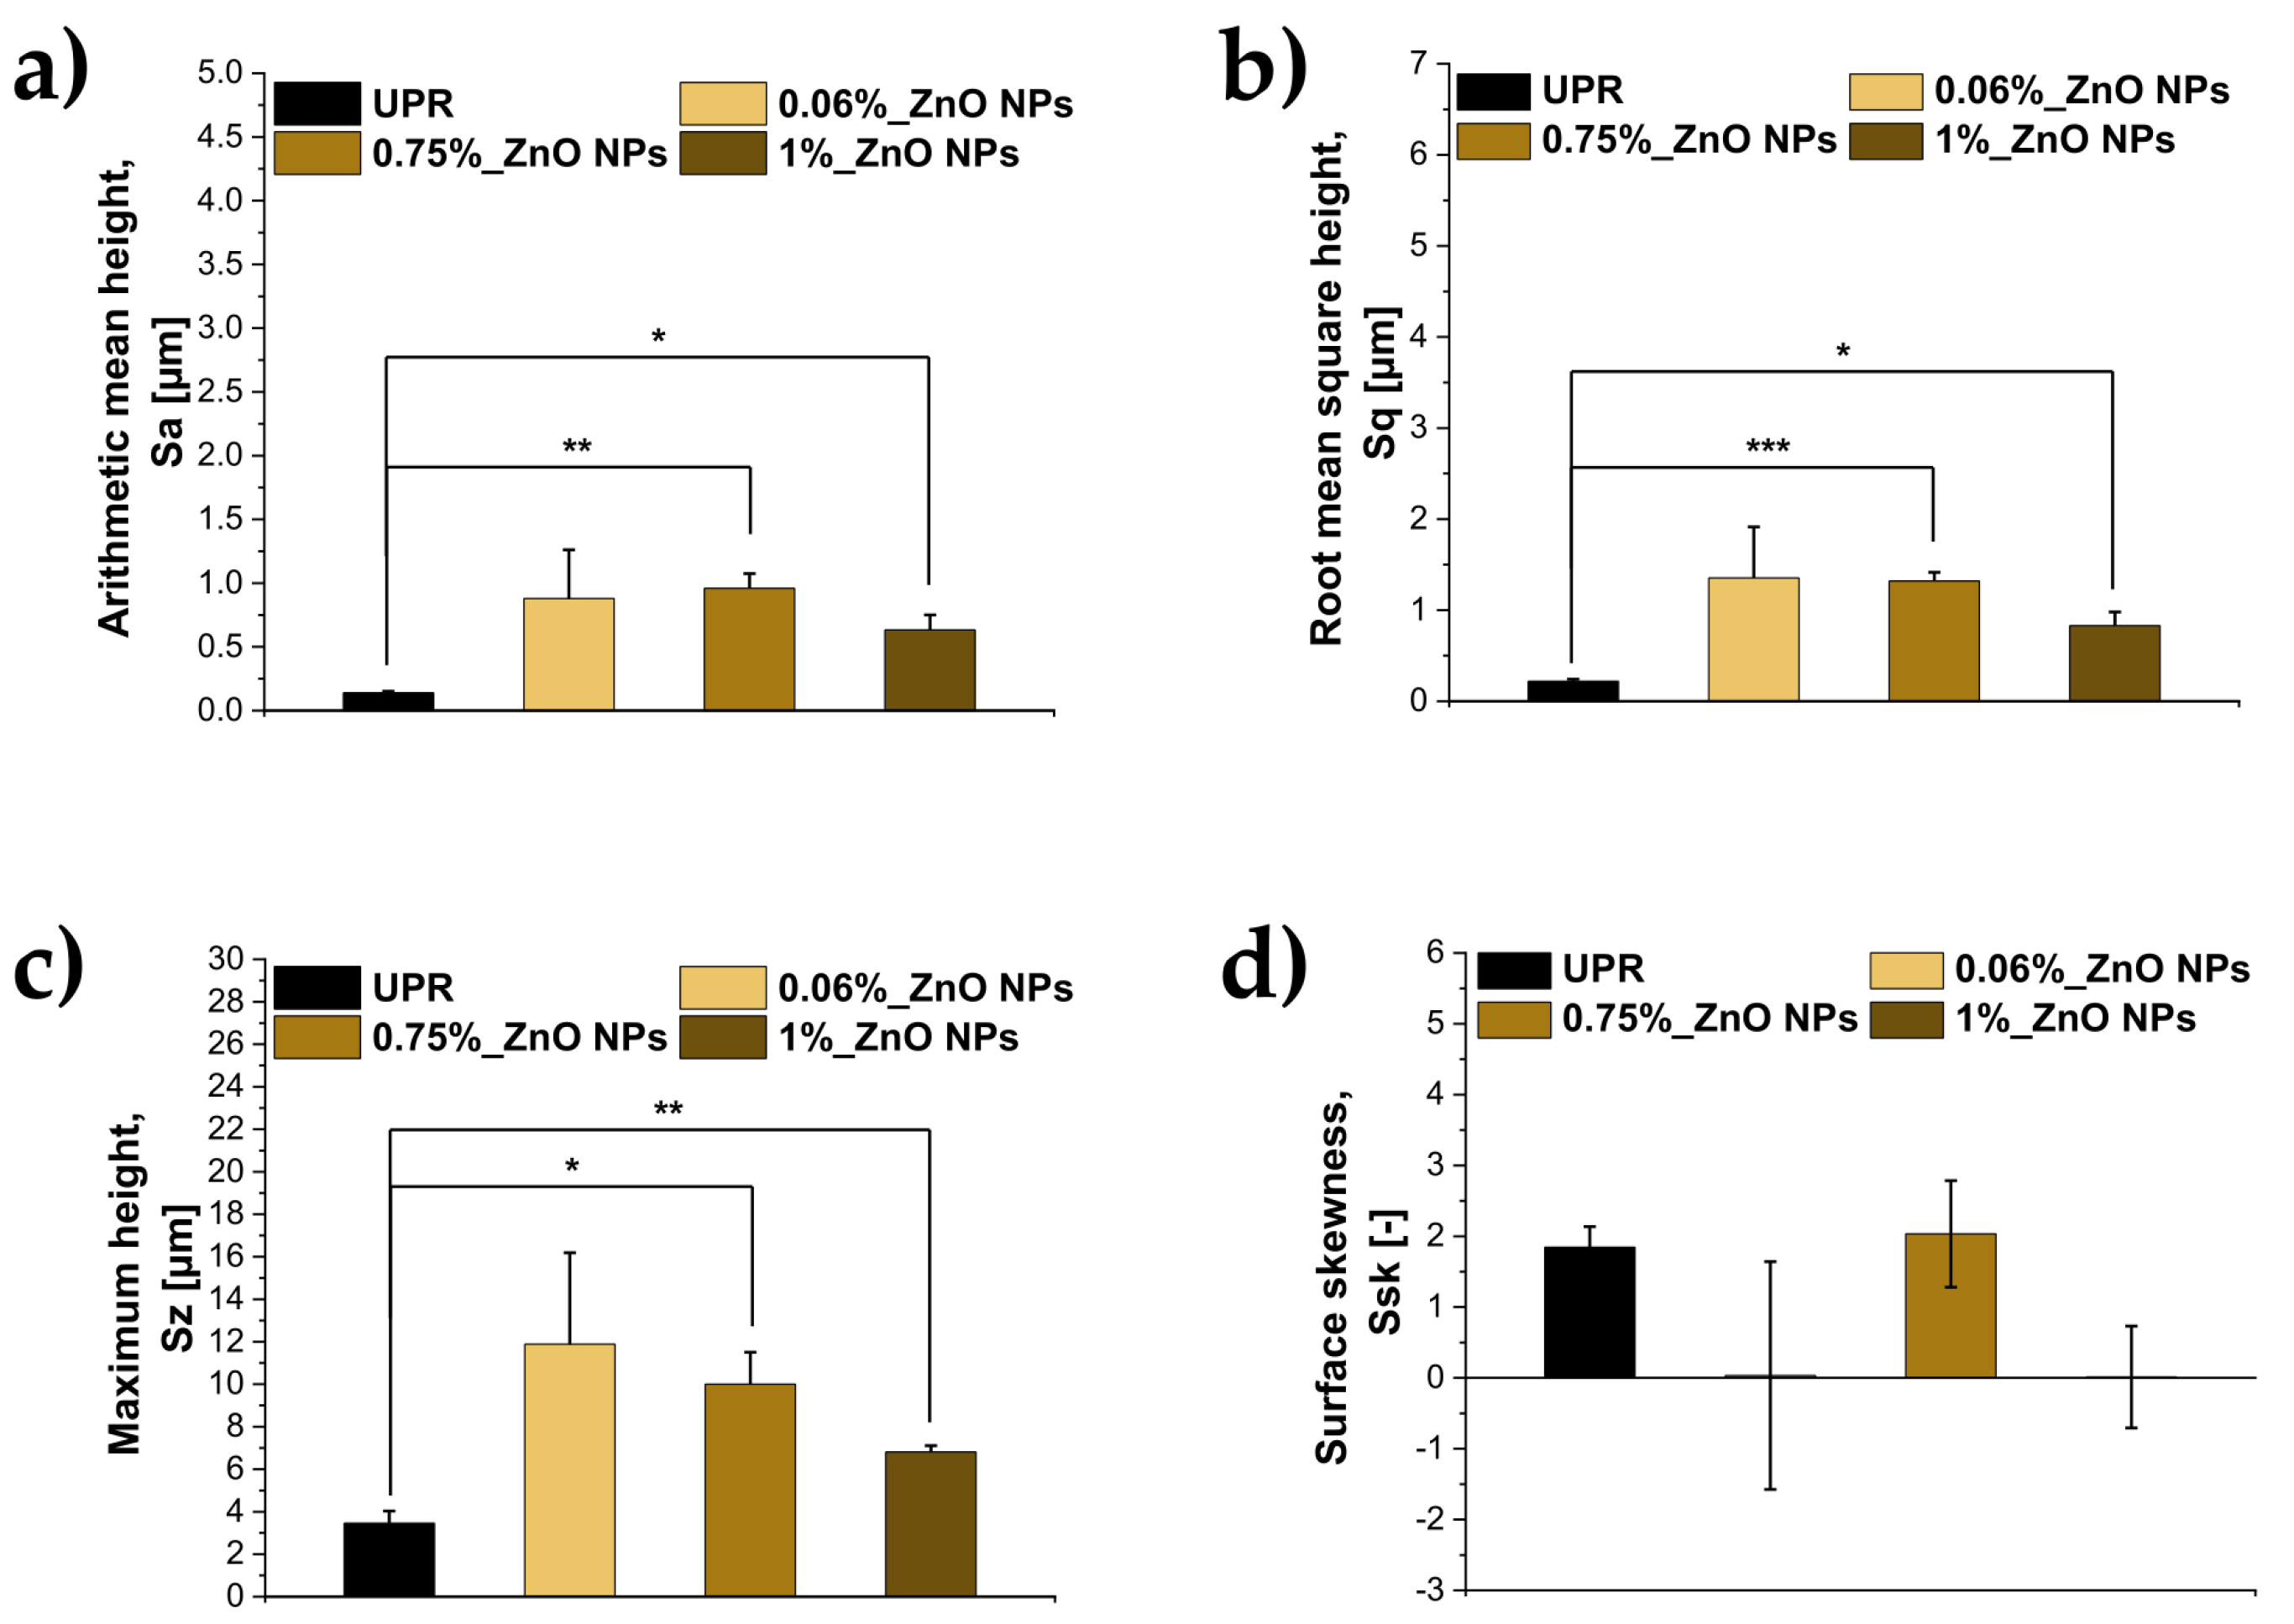
As already observed in the previous photographs, a 28-day exposure to activated sludge did not result in a unidirectional change in the topography of all materials. Prior to exposure to activated sludge, the values of the roughness and topography parameters already differed between the individual composites (Tables S3 and S4), with the highest values of Ra, Rq, Rz, Sa, Sq and Sz recorded for the composite containing 1% ZnO NPs. It should be noted that the R parameters characterised the roughness of the linear surface profile, whilst the S parameters enabled the assessment of the three-dimensional topography of the entire analysed area. However, after 28 days of contact with the activated sludge, distinctly different trends in changes were observed depending on the ZnO NPs content. In the case of pristine UPR, the Ra, Rq and Rz values decreased from 0.28 to 0.12 µm, from 0.35 to 0.17 µm and from 1.28 to 0.90 µm, respectively (Figure 17 and Figure 19). A similar trend was observed for the surface parameters Sa and Sq, which decreased from 0.31 to 0.14 µm and from 0.41 to 0.22 µm, respectively. This indicates a reduction in the average surface roughness of the UPR following exposure. At the same time, the Sz value increased from 2.53 to 3.46 µm, and Ssk from 0.28 to 1.85 (Figure 18 and Figure 20), suggesting that, despite the overall smoothing of the surface, there were localised, distinctly convex features on it, which may be residues of microorganisms and salts originating from the effluent.
The highest changes in surface topography were observed for the 0.06%_ZnO NPs composite. Following exposure, Ra increased from 0.26 to 1.01 µm, Rq from 0.32 to 1.35 µm, and Rz from 1.20 to 5.26 µm. A comparable increase was observed for the areal roughness parameters, with Sa rising from 0.28 to 0.88 µm and Sq from 0.35 to 1.35 µm, while Sz increased more than fivefold, from 2.23 to 11.89 µm. The concurrent increase in both the mean roughness parameters and those describing extreme surface heights indicates an increase in surface roughness and topographical heterogeneity after exposure. In addition, Rsk increased from 0.17 to 0.76, indicating a shift in the profile height distribution towards a greater contribution of positive surface elevations. A similar, although less substantial, change in surface topography was observed for the 0.75% ZnO NPs composite. Ra increased from 0.39 to 0.89 µm, Rq from 0.47 to 1.13 µm, and Rz from 2.32 to 4.34 µm. The areal parameters showed a comparable increase, with Sa rising from 0.39 to 0.96 µm, Sq from 0.49 to 1.32 µm, and Sz from 3.50 to 10.01 µm. The increase in Rsk from 0.17 to 0.66 and in Ssk from 0.20 to 2.03 indicates that the post-exposure surface height distribution shifted towards a greater contribution of local elevations. In contrast, the 1% ZnO NPs composite exhibited a different surface response. After exposure, Ra decreased from 1.00 to 0.56 µm and Rq from 1.14 to 0.72 µm, while Rz decreased only slightly, from 4.05 to 3.77 µm. Similarly, Sa and Sq decreased from 1.06 to 0.63 µm and from 1.23 to 0.83 µm, respectively. At the same time, Sz remained at a comparable level, increasing only slightly from 6.23 to 6.81 µm. Rsk changed from 0.39 to −0.26, indicating a shift towards a greater contribution of depressions in the profile after exposure, while Ssk decreased from 0.66 to approximately zero (0.01), suggesting a more symmetric areal height distribution.
Figure 17.
Profile roughness parameters of pristine UPR and selected ZnO NPs-modified nanocomposites before exposure to activated sludge: (a) arithmetic mean roughness (Ra), (b) root mean square roughness (Rq), (c) maximum height of the profile (Rz), and (d) profile skewness (Rsk). Data are presented as mean ± SE (n=3, N=3). Statistical significance was determined relative to pristine UPR, where: *p < 0.05, **p < 0.01, ***p < 0.001.
Figure 17.
Profile roughness parameters of pristine UPR and selected ZnO NPs-modified nanocomposites before exposure to activated sludge: (a) arithmetic mean roughness (Ra), (b) root mean square roughness (Rq), (c) maximum height of the profile (Rz), and (d) profile skewness (Rsk). Data are presented as mean ± SE (n=3, N=3). Statistical significance was determined relative to pristine UPR, where: *p < 0.05, **p < 0.01, ***p < 0.001.
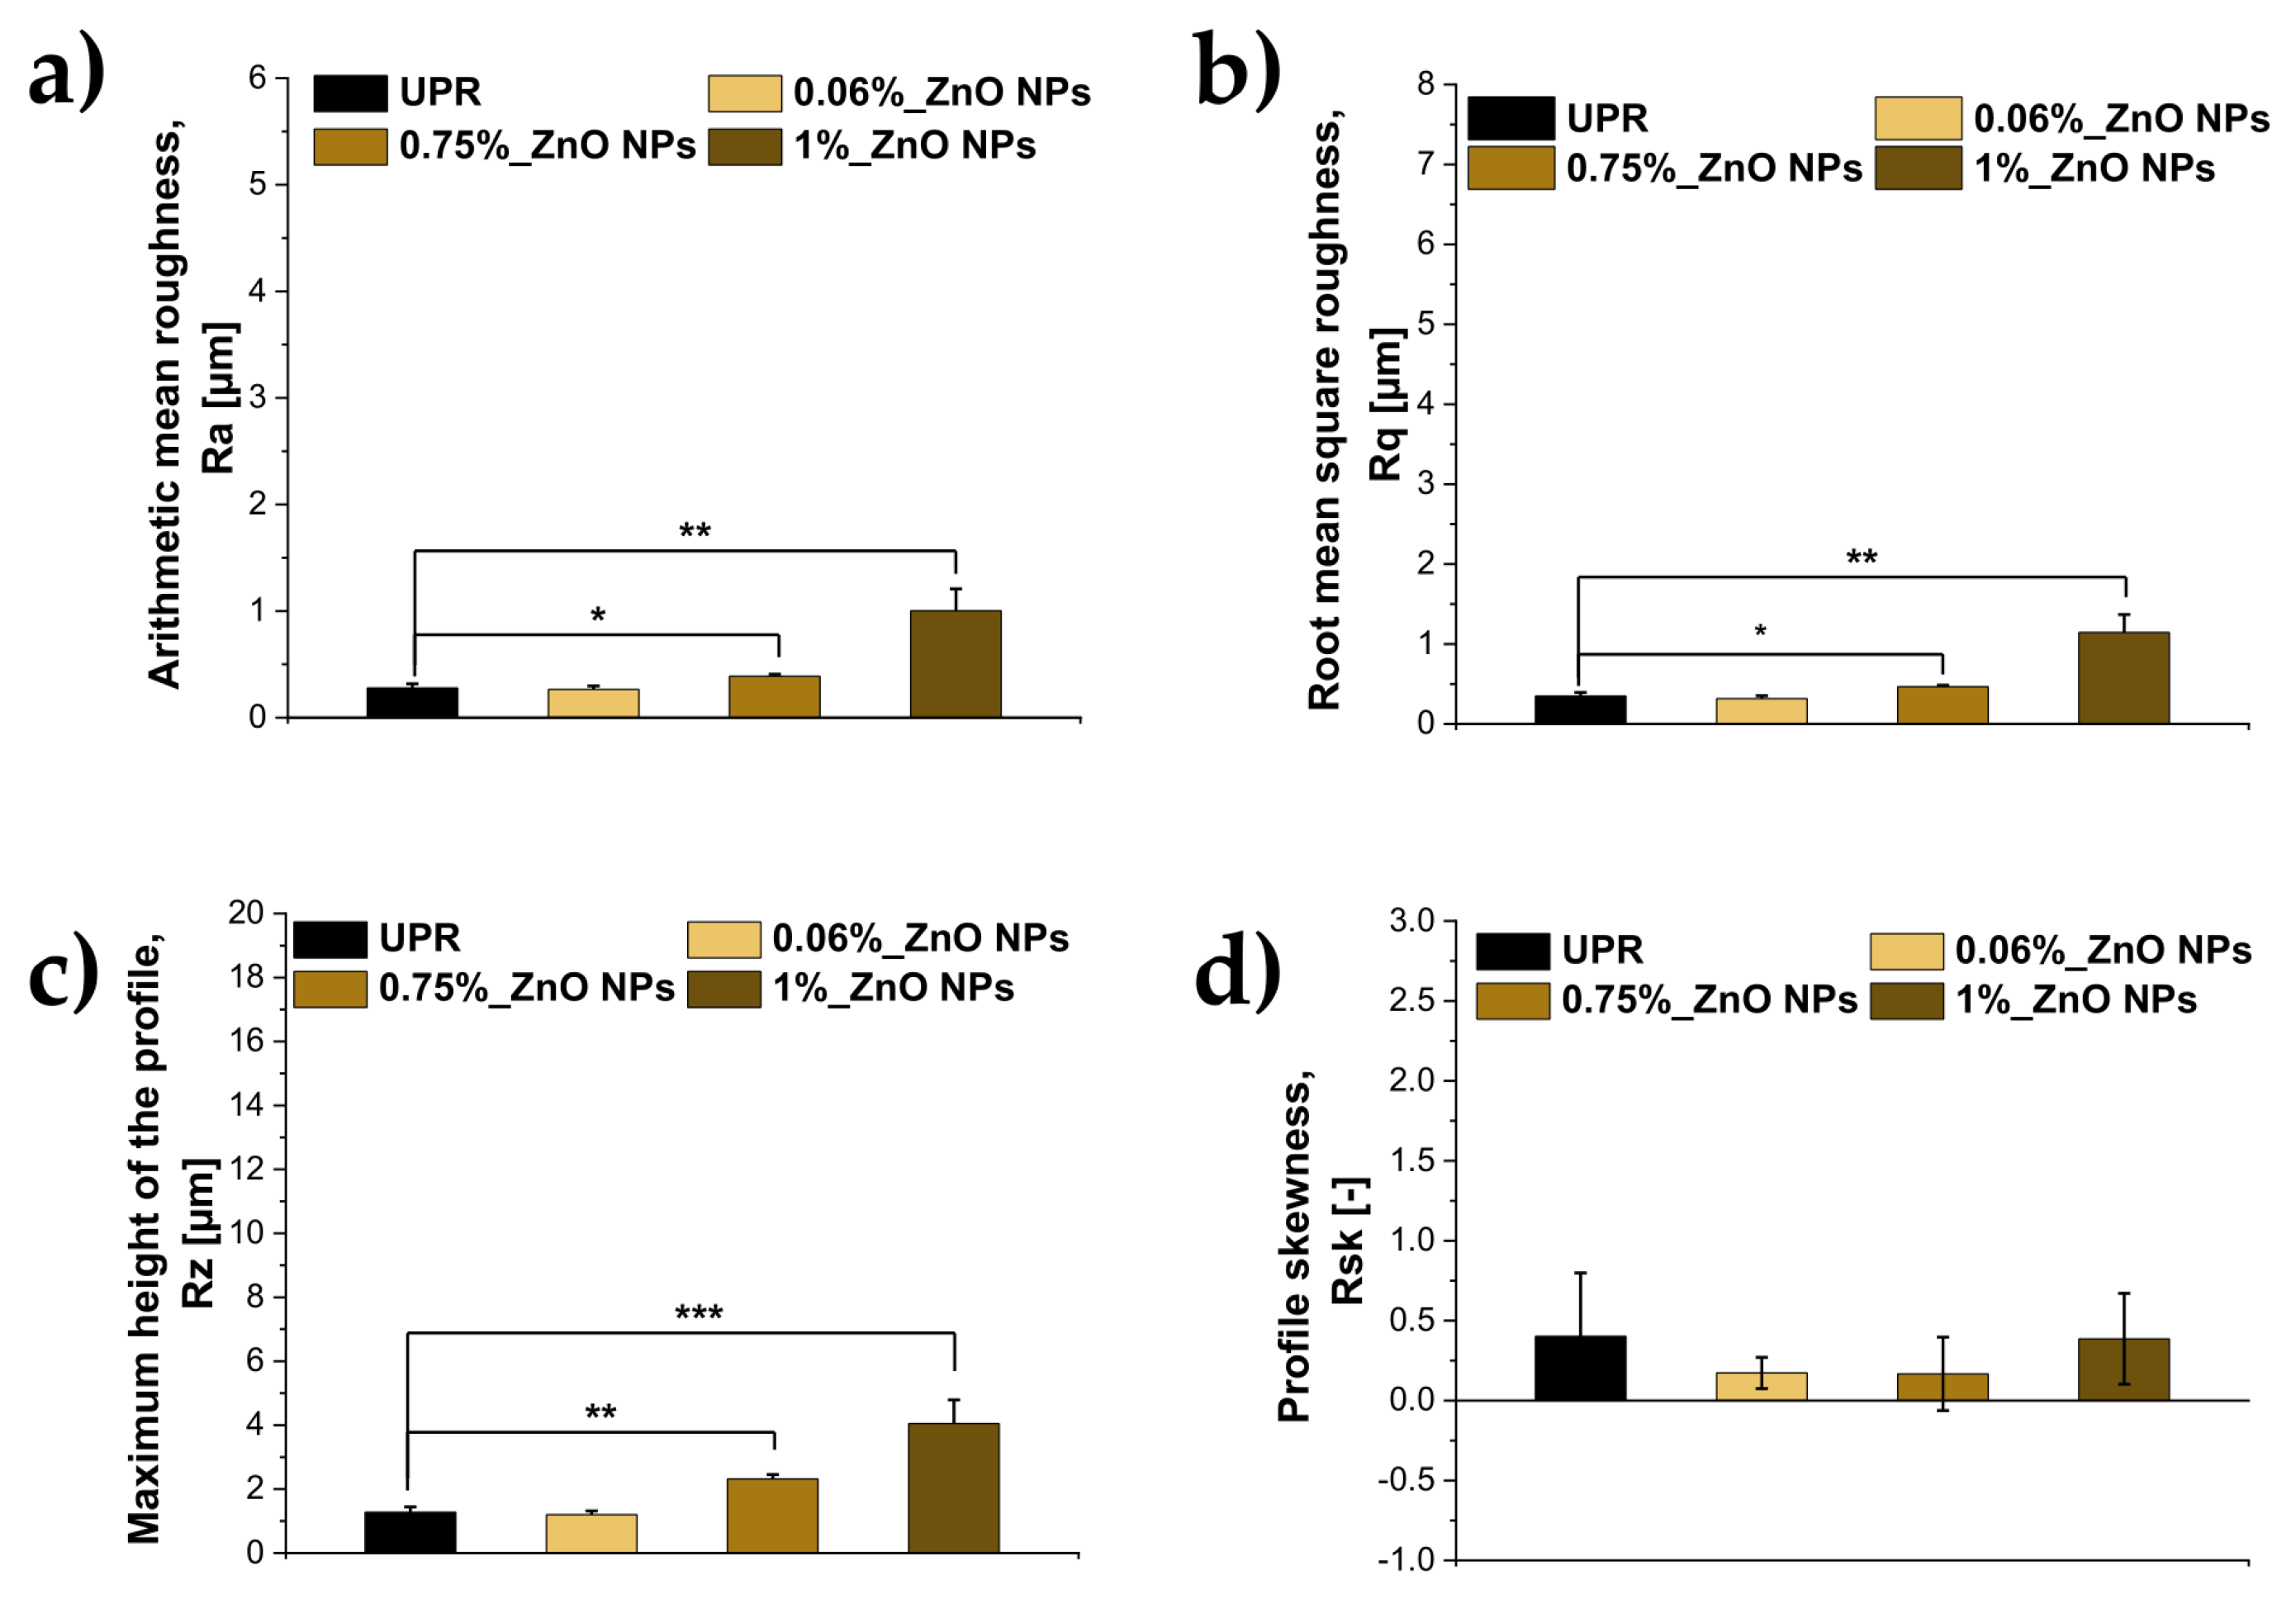
Figure 18.
Areal surface topography parameters of neat UPR and selected ZnO NPs-modified nanocomposites before exposure to activated sludge: (a) arithmetic mean height (Sa), (b) root mean square height (Sq), (c) maximum height (Sz), and (d) surface skewness (Ssk). Data are presented as mean ± SE (n=3, N=3). Statistical significance was determined relative to pristine UPR: *p < 0.05, **p < 0.01, ***p < 0.001.
Figure 18.
Areal surface topography parameters of neat UPR and selected ZnO NPs-modified nanocomposites before exposure to activated sludge: (a) arithmetic mean height (Sa), (b) root mean square height (Sq), (c) maximum height (Sz), and (d) surface skewness (Ssk). Data are presented as mean ± SE (n=3, N=3). Statistical significance was determined relative to pristine UPR: *p < 0.05, **p < 0.01, ***p < 0.001.
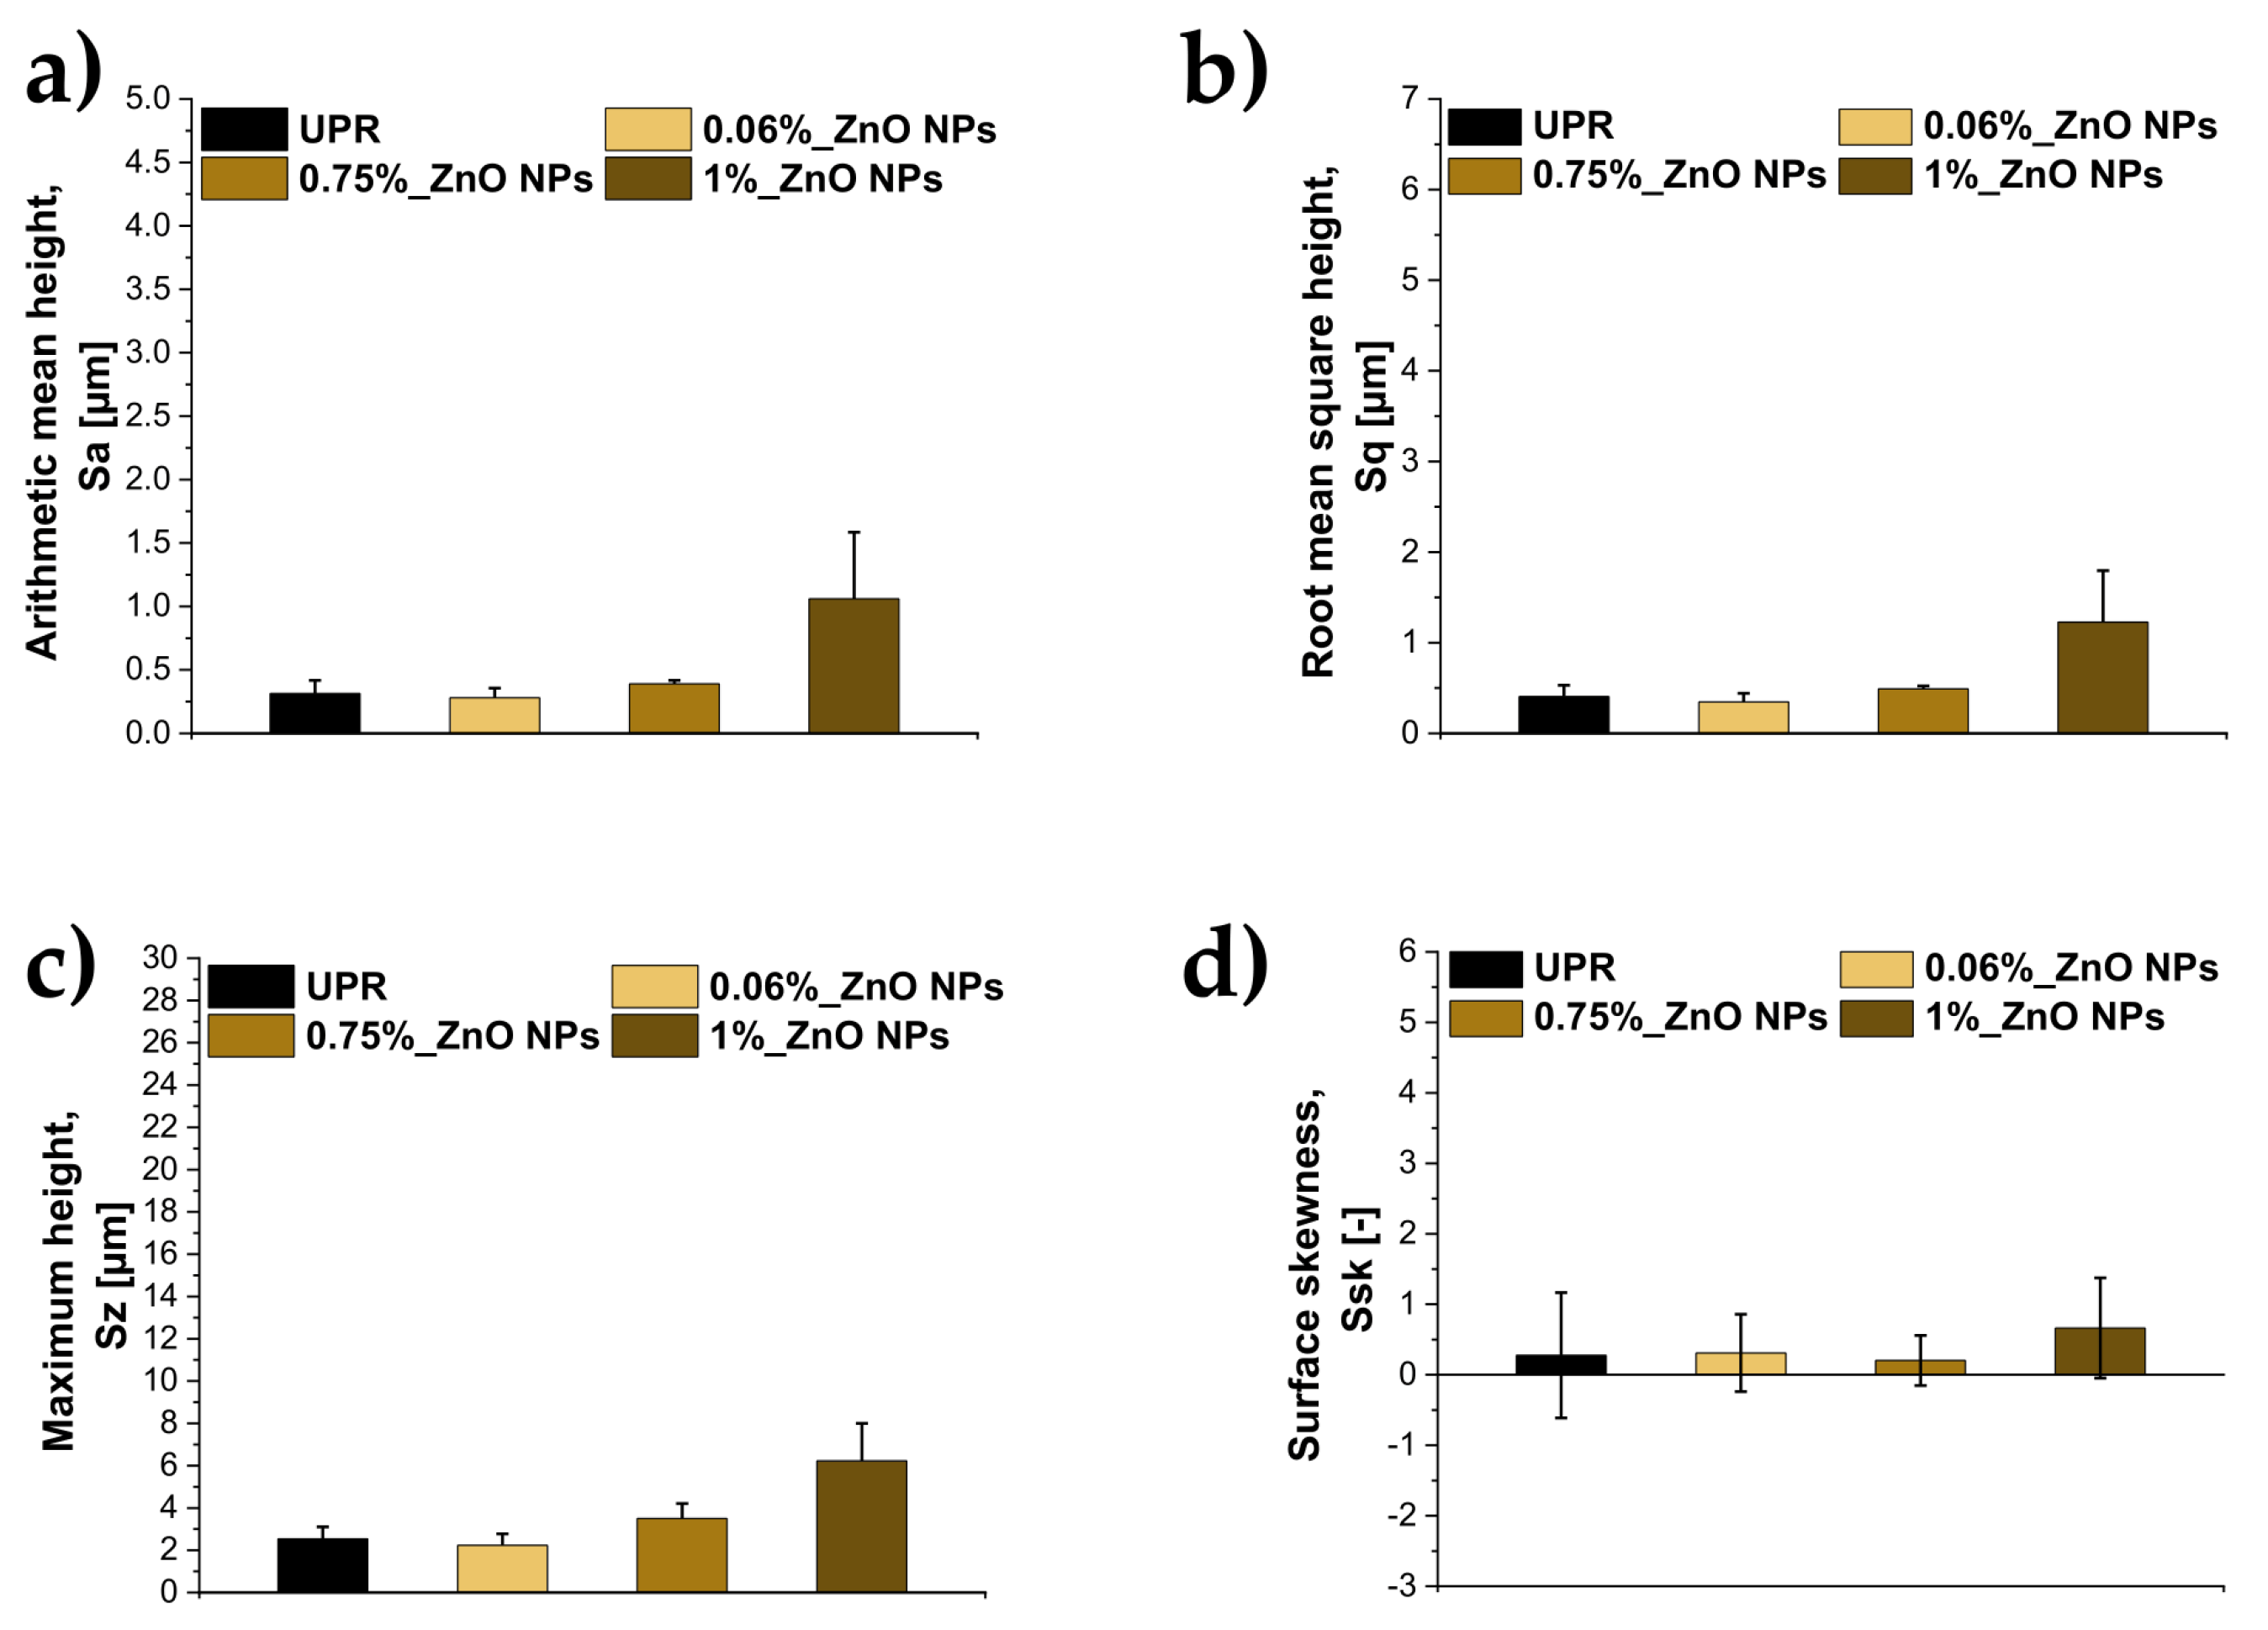
Figure 19.
Profile roughness parameters of pristine UPR and selected ZnO NPs-modified nanocomposites after exposure to activated sludge: (a) arithmetic mean roughness (Ra), (b) root mean square roughness (Rq), (c) maximum height of the profile (Rz), and (d) profile skewness (Rsk). Data are presented as mean ± SE (n=3, N=3). Statistical significance was determined relative to pristine UPR, where: *p < 0.05, **p < 0.01, ***p < 0.001.
Figure 19.
Profile roughness parameters of pristine UPR and selected ZnO NPs-modified nanocomposites after exposure to activated sludge: (a) arithmetic mean roughness (Ra), (b) root mean square roughness (Rq), (c) maximum height of the profile (Rz), and (d) profile skewness (Rsk). Data are presented as mean ± SE (n=3, N=3). Statistical significance was determined relative to pristine UPR, where: *p < 0.05, **p < 0.01, ***p < 0.001.
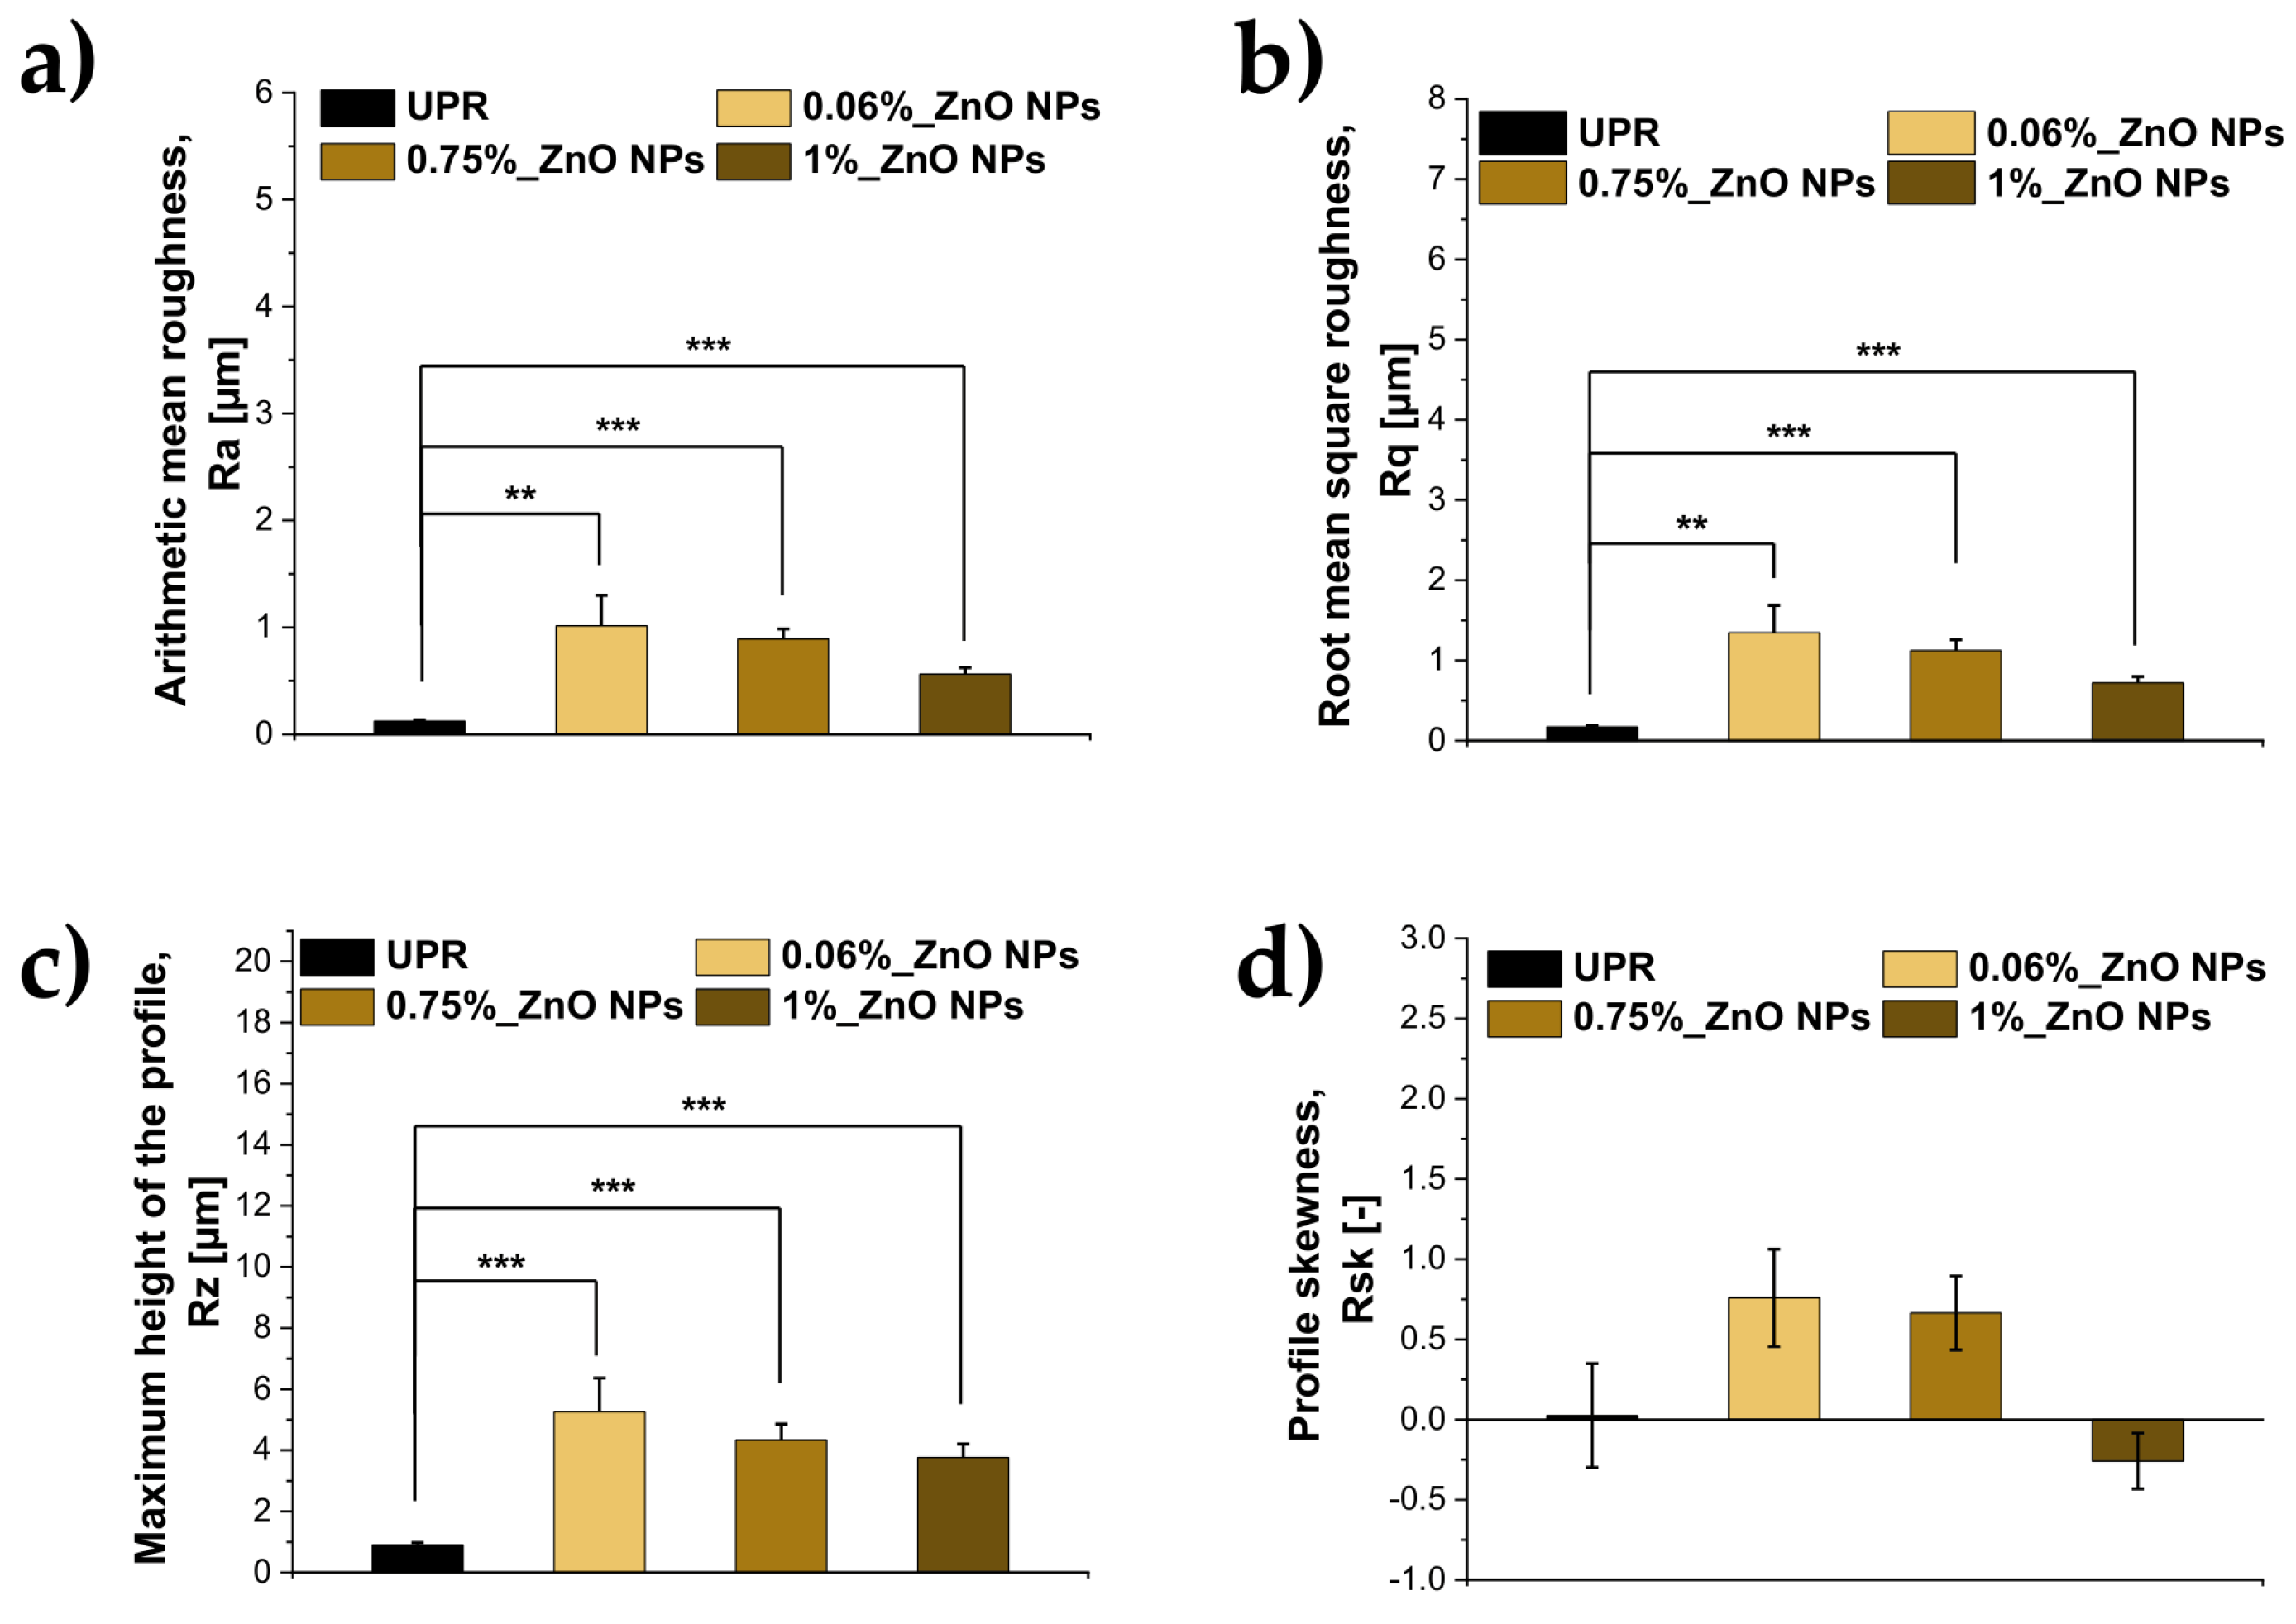
Figure 20.
Areal surface topography parameters of pristine UPR and selected ZnO NPs-modified nanocomposites after exposure to activated sludge: (a) arithmetic mean height (Sa), (b) root mean square height (Sq), (c) maximum height (Sz), and (d) surface skewness (Ssk). Data are presented as mean ± SE (n=3, N=3). Statistical significance was determined relative to pristine UPR: *p < 0.05, **p < 0.01, ***p < 0.001.
Figure 20.
Areal surface topography parameters of pristine UPR and selected ZnO NPs-modified nanocomposites after exposure to activated sludge: (a) arithmetic mean height (Sa), (b) root mean square height (Sq), (c) maximum height (Sz), and (d) surface skewness (Ssk). Data are presented as mean ± SE (n=3, N=3). Statistical significance was determined relative to pristine UPR: *p < 0.05, **p < 0.01, ***p < 0.001.
4. Discussion
4.1. Selection of Representative Composites for Further Characterisation
The selection of formulations for in-depth characterisation was based on the assumption that the effect of ZnO NPs on the properties of hybrid composites is strongly dependent on the nanofiller content and might not be consistent. Unlike conventional fillers, their nanometric counterparts can induce measurable changes in the properties of polymers even at relatively low concentrations, due to their large specific surface area and the significant interfacial area formed between the nanoparticles and the polymer matrix [40,41]. Consequently, increasing the nanoparticle content (up to 5–10%wt.) does not lead to a corresponding enhancement of the composite’s properties, as higher concentrations may promote particle agglomeration, reduce the effective interfacial area between the polymer and the filler, and prevent stress transfer [40]. Previous studies of systems based on UPR have shown the existence of optimal concentration ranges for ZnO NPs, above which the mechanical properties may be impaired, due to, e.g., nanoparticle agglomeration, the formation of local heterogeneities, and less effective stress propagation at the phase boundary [42,43,44]. Therefore, using a wide range of ZnO NPs concentrations was intended to assess potential changes in the structure and the mechanical, thermal, physicochemical, and surface properties of the materials, as well as their stability under exposure to activated sludge.
Previous studies of unsaturated polyester-based systems confirm the importance of selecting the appropriate ZnO NPs content. González-García et al. demonstrated that even the incorporation of 0.05%wt. of ZnO NPs into UPR led to a reduction in the elastic modulus from 4935 MPa for the unmodified resin to 3860 – 2700 MPa for ZnO NPs-containing composites heat-treated at various temperatures, corresponding to a reduction of ~21.8 – 45.3% compared to the polymer matrix. These authors attributed the observed changes to poor interfacial interactions between the ZnO NPs and the polyester matrix [33]. A similar effect was observed for the 0.06%_ZnO NPs composite obtained in this study, which justified the choice of this formulation as a representative of the lower range of nanofiller contents tested. Compared with UPR, the Young’s modulus (Table 6, Figure 5a) and tensile strength (Table 6, Figure 5b) decreased by 48.7% and 11.5%, respectively, whilst the flexural modulus (Table 6, Figure 5c) and flexural strength (Table 6, Figure 5d) decreased by 11.8% and 21.6%, respectively. This was accompanied by a reduction in Vickers hardness of ~20.1% compared with UPR. The relative values of the flexural modulus were 2243.20 ± 141.33 MPa for 0.06%_ZnO NPs and 2543.10 ± 178.74 MPa for UPR (Table 5).
As mentioned earlier, the effect of ZnO NP content on mechanical properties was inconsistent. Although all the composites studied exhibited a lower Young’s modulus and Vickers hardness than pristine UPR, the magnitude of these changes did not increase proportionally with the nanofiller content. Similarly, tensile strength, flexural modulus, and flexural strength varied unpredictably across the entire concentration range studied. This behaviour is consistent with the observations of Chen et al., who demonstrated that unmodified ZnO NPs can lead to a deterioration in the mechanical properties of UPR due to the high surface energy of the particles, their limited dispersion and their tendency to aggregate within the matrix. Surface modification of ZnO using aminopropyltriethoxysilane and oleic acid improved interfacial compatibility and nanoparticle dispersion. At a content of 3%wt. of modified ZnO NPs, the tensile and flexural strengths increased by 91.4% and 71.3%, respectively, compared with pristine UPR [44].
In our work, the non-monotonic changes were particularly evident in the 0.75%_ZnO NPs composite. This material exhibited the lowest values of Young’s modulus (Table 6, Figure 5a) and tensile strength (Table 6, Figure 5b) amongst the formulations studied, being 1165.50 ± 219.53 and 29.00 ± 5.48 MPa, respectively. Compared with UPR, this corresponded to reductions of 64.3 and 37.7%, respectively. At the same time, the flexural properties were significantly better preserved. The flexural modulus (Table 6, Figure 5c) was 2,673.48 ± 222.14 MPa and was even slightly higher than that of UPR, whilst the flexural strength (Table 6, Figure 5d) was 77.35 ± 5.54 MPa, which corresponded to a decrease of only around 6.2%. The Vickers hardness reached 119 HV and was ~22.7% lower than that of the unmodified resin (Table 5).
A different profile of mechanical properties was observed for the composite containing the maximum amount of nanofiller tested: 1%_ZnO NPs. The Young’s modulus (Table 6, Figure 5a) and tensile strength (Table 6, Figure 5b) were 1730.40 ± 59.42 and 35.00 ± 4.57 MPa, respectively, which corresponded to a reduction of 47.1% and 24.8% compared to UPR. In this case, the most highest reduction was observed in the flexural properties, with the flexural modulus (Table 6, Figure 5c) and flexural strength (Table 6, Figure 5d) decreasing to 1673.40 ± 66.46 MPa and 58.05 ± 2.03 MPa, respectively, corresponding to reductions of 34.2% and 29.6% relative to neat UPR. At the same time, Vickers hardness was 110 HV, ~28.6% lower than that of pristine UPR (Table 5).
In view of above, the lack of predictability of changes in mechanical properties as a function of ZnO NP content and the differing response profiles of the individual formulations, composites containing 0.06, 0.75 and 1% ZnO NPs were selected for further characterisation. These materials differed in terms of stiffness, tensile and flexural strength, and hardness. This selection enabled an assessment of whether the differences revealed during mechanical characterisation were also reflected in the thermal and surface properties, as well as in the behaviour of the materials when exposed to activated sludge.
4.2. Influence of ZnO NPs on Surface Properties and Stability after Activated Sludge Exposure
Activated sludge is a highly heterogeneous biological matrix, composed of microorganisms aggregated into flocs and embedded in extracellular polymeric substances (EPS), as well as of adsorbed organic and inorganic matter. The organic fraction of sludge flocs consists primarily of proteins, carbohydrates, lipids and humic substances, whilst the composition of EPS additionally includes, amongst other things, nucleic acids and uronic acids [45]. The EPS matrix contains numerous functional groups capable of interacting with organic compounds, metal ions and the surfaces of solid materials [46]. The inorganic fraction may contain phosphorus compounds and elements associated with minerals, such as Ca, Mg and Fe, amongst others, the concentration of which depends heavily on the composition of the effluent [47]. The activated sludge also contains a highly diverse community of microorganisms. The bacteria found in it include, amongst others, Nitrosomonas, Pseudomonas and Acinetobacter. Important functional groups include ammonia-oxidising bacteria, such as Nitrosomonas and Nitrosospira, and bacteria involved in nitrite oxidation, including Nitrospira and Nitrobacter. In addition to bacteria, fungi, including yeasts, are also present in activated sludge; in environmental studies relating to wastewater treatment, representatives of Aspergillus, Candida, Trichosporon and Rhodotorula, amongst others, have been identified [48,49,50]. Such high biological diversity, combined with the presence of EPS, organic matter and mineral matter, means that the surface of the material operating in a sewage environment is simultaneously exposed to physicochemical and biological influences. For this reason, it is particularly important to analyse the effect of exposure to sewage sludge on the composites produced.
ZnO NPs may be involved in various mechanisms that inhibit biofilm growth, including by influencing the initial stages of microbial adhesion to surfaces. This is particularly important because the properties of the material itself, such as roughness, hydrophilicity or hydrophobicity, porosity and surface topography, are among the factors determining the adhesion of microbial cells [51,52]. Rosenberg et al. demonstrated that, under oligotrophic conditions, surfaces containing nano-ZnO inhibited biofilm formation in a manner dependent on the amount of ZnO. After 72 hours, surfaces with a higher content of ZnO NPs showed a reduction in the number of viable surface-adhered cells of 2.12 log for E. coli and 3.49 log for S. aureus compared with the unmodified surface [44]. Importantly, from the perspective of environmental applications, this effect was strongly dependent on the experimental conditions, suggesting that the composition of the medium can significantly influence the behaviour of surfaces containing ZnO NPs. Mahamuni-Badiger et al. also highlighted that the activity of ZnO in inhibiting adhesion and biofilm formation depends, amongst other things, on the concentration of the nanoparticles, their size and shape, surface modifications and the presence of surface defects [45].
At the same time, the effect of ZnO NPs on surface colonisation is not universal across all groups of microorganisms. Rosenberg et al. demonstrated that whilst nano-ZnO inhibited biofilm formation by the bacteria under investigation in oligotrophic conditions, the opposite effect was observed in the case of the yeast Candida albicans. Surfaces containing nano-ZnO promoted colonisation by C. albicans, and after 48 hours the number of live cells attached to the surface was up to 1.27 log higher than on the unmodified surface [44]. For this reason, evaluation of changes in the morphology, topography, roughness and mass of UPR-based ZnO NPs-containing composites following exposure to activated sludge is important for characterising their overall response to a complex environment in which microorganisms, EPS, organic substances and mineral components are present simultaneously.
The most pronounced changes in the surface properties following 28-day exposure to sewage sludge were observed for composites containing 0.06 and 0.75% ZnO NPs. In the case of 0.06%_ZnO NPs, the Ra value increased from 0.26 to 1.01 µm, the Sa value from 0.28 to 0.88 µm, and the Sz value from 2.23 to 11.89 µm (Tables S3–S4, Figure 17, Figure 18, Figure 19 and Figure 20). A similar trend was observed for the 0.75%_ZnO NPs, where Ra increased from 0.39 to 0.89 µm, Sa from 0.39 to 0.96 µm, and Sz from 3.50 to 10.01 µm. The simultaneous increase in average roughness parameters and those describing extreme height differences demonstrates an increase in the measured surface heterogeneity of these formulations after activated-sludge exposure. Higher roughness may potentially favour the initial immobilisation of microorganisms, as local depressions and elevations increase the number of potential contact sites. Al. Amshawee et al. reported that surface roughness, in combination with its wettability, can significantly influence both initial adhesion and the subsequent stability of the biofilm [53].
Different surface characteristics were observed for the UPR and the 1%_ZnO NPs composite following a 28-day exposure test to active sludge. For UPR, Ra decreased from 0.28 to 0.12 µm and Sa from 0.31 to 0.14 µm, whilst for the 1% ZnO NPs, these values decreased from 1.00 to 0.56 µm and from 1.06 to 0.63 µm, respectively. The reduction in average roughness parameters may indicate partial surface smoothing during exposure. However, it cannot be directly equated with a reduction in microbial colonisation. In aquatic environments, the surface of the material may rapidly become coated with a so-called conditioning layer containing EPS, proteins and humic substances, which alters the original physicochemical properties of the substrate, thereby contributing to the adhesion of microorganisms [54]. The observed changes in roughness and topography should therefore be interpreted as the overall surface response to activated-sludge exposure rather than as a direct measure of polymer degradation. The measured surface state may reflect several concurrent phenomena, including local material alteration, water uptake or swelling, surface deposition, and attachment of microbial biomass or extracellular components. Consequently, the present data do not allow the individual contributions of material loss, swelling, sludge deposition, and microbial attachment to the measured roughness changes to be quantitatively distinguished.
5. Conclusions
In summary, the incorporation of ZnO NPs in the range of 0.02–1.00%wt. influenced the mechanical, thermal and surface properties of the composites. However, the observed changes did not show a clear trend as the nanofiller content increased. Among the formulations subjected to comprehensive characterisation, the composite containing 0.06% ZnO NPs exhibited the most favourable overall balance of properties. It retained a relatively high tensile strength (41.20 ± 2.08 MPa compared with 46.56 ± 1.45 MPa for UPR), whilst at the same time exhibiting the highest thermal stability: Td,5% increased from 359.6 °C for UPR to 368.4 °C, and Tmax of the main degradation stage from 410.9 to 422.5 °C.
All the materials tested exhibited good mass stability during 28-day exposure to activated sludge, with no statistically significant changes in mass. Moreover, contact with the active sludge caused changes in surface morphology and topography of materials. For the 0.06% ZnO NPs, Ra increased from 0.26 to 1.01 µm and Sa from 0.28 to 0.88 µm, indicating an increase in surface heterogeneity. These surface changes should be interpreted as a response to the complex activated-sludge environment rather than as direct evidence of material degradation. Therefore, 0.06%_ZnO NPs composite can be considered the most promising of the comprehensively tested formulations for further development towards applications in sanitary sewerage system components. Although further long-term studies are required regarding biofilm formation and the behaviour of the material’s properties in a sewage environment.
Supplementary Materials
The following supporting information can be downloaded at the website of this paper posted on Preprints.org.
Author Contributions
Conceptualization, D. Stępka; Methodology, D. Stępka, C.-Y. Hang, J.-H. Weng, K.-C. Yen, D. Mierzwiński, D. Słota, K. Niziołek, K. Haraźna, K. Setlak; Validation, D. Stępka, K. Haraźna; Formal analysis, D. Stępka; Investigation, D. Stępka, C.-Y. Hang, J.-H. Weng, K.-C. Yen, D. Mierzwiński, D. Słota, K. Niziołek, K. Haraźna, K. Setlak; Resources, D. Stępka; Writing—original draft preparation, D. Stępka, K. Haraźna; Writing—review and editing, J. Jampilek, A. Sobczak-Kupiec; Visualization, D. Stępka; Supervision, J. Jampilek, T.-M. Wu, A. Sobczak-Kupiec; Project administration, D. Stępka, A. Sobczak-Kupiec; Funding acquisition, D. Stępka, A. Sobczak-Kupiec.:
Funding
This work was carried out as part of the Applied PhD programme, project number DWD/5/0233/2021.
Data Availability Statement
The raw data supporting the conclusions of this article will be made available by the authors on request.
Acknowledgments
The research for this thesis was carried out as part of the 5th edition of the Applied PhD Programme (DWD-5), funded by the Polish Ministry of Science and Higher Education. During the preparation of this manuscript, the authors used ChatGPT (GPT-5, OpenAI, 2025) and Grammarly to improve English grammar, clarity, and cohesion, and to refine academic style. The content was subsequently carefully reviewed and revised by the authors, who take full responsibility for the accuracy and final version of the publication. Nano Banana Pro (Gemini 3 Pro Image, Google DeepMind) was used solely for graphical assistance in the preparation of Figure 1. The scientific concept was developed by the authors.
Conflicts of Interest
The authors declare no conflicts of interest.
References
- Alabtah, F.G.; Mahdi, E.; Eliyan, F.F. The Use of Fiber Reinforced Polymeric Composites in Pipelines: A Review. Compos. Struct. 2021, 276. [Google Scholar] [CrossRef]
- Seraji, S.M.; Song, P.; Varley, R.J.; Bourbigot, S.; Voice, D.; Wang, H. Fire-Retardant Unsaturated Polyester Thermosets: The State-of-the-Art, Challenges and Opportunities. Chem. Eng. J. 2022, 430, 132785. [Google Scholar] [CrossRef]
- Yadollahi, S.M.; Piratla, K.R. A State-of-the-Art Review on Failure Mechanisms in Buried Plastic Pipes. Tunn. Undergr. Space Technol. 2025, 162. [Google Scholar] [CrossRef]
- Khalid, H.U.; Ismail, M.C.; Nosbi, N. Permeation Damage of Polymer Liner in Oil and Gas Pipelines: A Review. Polymers 2020, 12, 1–31. [Google Scholar] [CrossRef]
- Hasan, K.M.F.; Horváth, P.G.; Alpár, T. Potential Fabric-Reinforced Composites: A Comprehensive Review. J. Mater. Sci. 2021, 56, 14381–14415. [Google Scholar] [CrossRef]
- Wang, H.; Shah, J.; El Hawwat, S.; Huang, Q.; Khatami, A. A Comprehensive Review of Polyethylene Pipes: Failure Mechanisms, Performance Models, Inspection Methods, and Repair Solutions. J. Pipeline Sci. Eng. 2024, 4. [Google Scholar] [CrossRef]
- Nguyen, K.Q.; Mwiseneza, C.; Mohamed, K.; Cousin, P.; Robert, M.; Benmokrane, B. Long-Term Testing Methods for HDPE Pipe - Advantages and Disadvantages: A Review. Eng. Fract. Mech. 2021, 246. [Google Scholar] [CrossRef]
- Mota, G.P.; da Silva, A.H.M. da F.T.; da Rocha, E.B.D.; da Silva, A.L.N. Evaluation of Aging Process of PA11 from Offshore Flexible Pipe Pressure Barrier. Appl. Ocean Res. 2024, 144. [Google Scholar] [CrossRef]
- Fiorenza de Lima, H.; Vaz, M.A.; Ferreira da Costa, M.; Gomez, A.A.; Lima de Oliveira, G. Creep Behavior of In-Service Flexible Flowline Polyamide 11. Polym. Test. 2020, 81. [Google Scholar] [CrossRef]
- Jacques, B.; Werth, M.; Merdas, I.; Thominette, F.; Verdu, J. Hydrolytic Ageing Polyam. 11. 1 Hydrolys. Kinet. Water.
- Di Boon, Y.; Joshi, S.C.; Bhudolia, S.K. Review: Filament Winding and Automated Fiber Placement with in Situ Consolidation for Fiber Reinforced Thermoplastic Polymer Composites. Polymers 2021, 13. [Google Scholar] [CrossRef]
- Ramakrishnan, T.; Mohan Gift, M.D.; Chitradevi, S.; Jegan, R.; Subha Hency Jose, P.; Nagaraja, H.N.; Sharma, R.; Selvakumar, P.; Hailegiorgis, S.M. Study of Numerous Resins Used in Polymer Matrix Composite Materials. Adv. Mater. Sci. Eng. 2022. [Google Scholar] [CrossRef]
- Suriano, R.; Gonzalez, M.N.G.; Turri, S. Environmental Profile and Technological Validation of New High-Tg Unsaturated Polyesters from Fully Bio-Based Monomers and Reactive Diluents. J. Polym. Environ. 2021, 29, 1122–1133. [Google Scholar] [CrossRef]
- Panic, V. V.; Seslija, S.I.; Popovic, I.G.; Spasojevic, V.D.; Popovic, A.R.; Nikolic, V.B.; Spasojevic, P.M. Simple One-Pot Synthesis of Fully Biobased Unsaturated Polyester Resins Based on Itaconic Acid. Biomacromolecules 2017, 18, 3881–3891. [Google Scholar] [CrossRef]
- Ahamad, A.; Mary Lubi, C.; Mohan, A.; Safeer, M.; Thachil, E.T. Synthesis of Unsaturated Polyester Resin - Effect of Anhydride Composition. Des. Monomers Polym. 2001, 4, 260–267. [Google Scholar] [CrossRef]
- Manikumar, R.; Rao, T.N. Unsaturated Polyester Resin Synthesis for Enhanced Fiber-Reinforced Composite Performance. Dig. J. Nanomater. Biostruct. 2024, 19, 1009–1020. [Google Scholar] [CrossRef]
- Taurino, R.; Bondioli, F.; Messori, M. Use of Different Kinds of Waste in the Construction of New Polymer Composites: Review. Mater. Today Sustain. 2023, 21, 100298. [Google Scholar] [CrossRef]
- Akbari, S.; Root, A.; Skrifvars, M.; Ramamoorthy, S.K.; Åkesson, D. Novel Bio-Based Branched Unsaturated Polyester Resins for High-Temperature Applications. J. Polym. Environ. 2024, 32, 2031–2044. [Google Scholar] [CrossRef]
- Grimalt, J.; Frattini, L.; Carreras, P.; Fombuena, V. Optimizing Rheological Performance of Unsaturated Polyester Resin with Bio-Based Reactive Diluents: A Comprehensive Analysis of Viscosity and Thermomechanical Properties. Polym. Test. 2023, 129. [Google Scholar] [CrossRef]
- Ji, H.W.; Koo, D.D.; Kang, J.H. Short-and Long-Term Structural Characterization of Cured-in-Place Pipe Liner with Reinforced Glass Fiber Material. Int. J. Environ. Res. Public Health 2020, 17. [Google Scholar] [CrossRef]
- Domingos, Y.S.; Felipe, R.C.T. dos S.; Felipe, R.N.B.; Fernandes, G.J.T. Evaluation of the Environmental Aging of the Glass Fiber-Reinforced Polymer Composite When in Contact with the Effluent of a Treatment Plant. J. Compos. Mater. 2020, 54, 1385–1402. [Google Scholar] [CrossRef]
- Jaranowska, P.; Cydzik-Kwiatkowska, A.; Zielińska, M. Configuration of Biological Wastewater Treatment Line and Influent Composition as the Main Factors Driving Bacterial Community Structure of Activated Sludge. World J. Microbiol. Biotechnol. 2013, 29, 1145–1153. [Google Scholar] [CrossRef]
- Maharaj, S.D.; Nkuna, R.; Matambo, T.S. Shotgun Metagenomic and Physicochemical Profiling of Municipal Wastewater Treatment Plants Using Activated Sludge and Trickling Filters. Sci. Rep. 2026, 16. [Google Scholar] [CrossRef]
- Shin, J.; Choi, J.; Choi, Y.W.; Kim, S.; Hwang, I. Development and Characterization of Zn-ZnO Nanocomposites for Enhanced Biodegradable Material Properties. Materials 2025, 18. [Google Scholar] [CrossRef]
- Şomoghi, R.; Semenescu, A.; Pasăre, V.; Chivu, O.R.; Nițoi, D.F.; Marcu, D.F.; Florea, B. The Impact of ZnO Nanofillers on the Mechanical and Anti-Corrosion Performances of Epoxy Composites. Polymers 2024, 16. [Google Scholar] [CrossRef]
- Peng, G.; Li, Q.; Yang, Y.; Wang, H.; Li, W. Effects of Nano ZnO on Strength and Stability of Unsaturated Polyester Composites. Polym. Adv. Technol. 2008, 19, 1629–1634. [Google Scholar] [CrossRef]
- Folorunso, O.; Hamam, Y.; Sadiku, R.; Kupolati, W. Effects of Defects on the Properties of Polymer Nanocomposites: A Brief Review. J. Inorg. Organomet. Polym. Mater. 2024, 34, 5667–5690. [Google Scholar] [CrossRef]
- Wong, T.T.; Amigues, S.; Awaja, F. The Influence of Zinc Oxide Nanoparticles on Dispersion, Rheology, and Mechanical Properties of Epoxy-Based Composites. Polymers 2025, 17. [Google Scholar] [CrossRef]
- Stępka, D.; Niziołek, K.; Słota, D.; Jampilek, J.; Sobczak-Kupiec, A. Physicochemical Characterization of Nanofillers for Unsaturated Polyester Resin Modification. Materials 2026, 19, 3720. [Google Scholar] [CrossRef]
- Haraźna, K.; Walas, K.; Urbańska, P.; Witko, T.; Snoch, W.; Siemek, A.; Jachimska, B.; Krzan, M.; Napruszewska, B.D.; Witko, M.; et al. Polyhydroxyalkanoate-Derived Hydrogen-Bond Donors for the Synthesis of New Deep Eutectic Solvents. Green Chem. 2019, 21. [Google Scholar] [CrossRef]
- Chabros, A.; Gawdzik, B.; Podkościelna, B.; Goliszek, M.; Paczkowski, P. Composites of Unsaturated Polyester Resins with Microcrystalline Cellulose and Its Derivatives. Materials 2020, 13. [Google Scholar] [CrossRef]
- Chencheni, A.; Belkhiri, S.; Tarchoun, A.F.; Abdelaziz, A.; Bessa, W.; Boucheffa, Y.; Trache, D. Unravelling the Thermal Behavior and Kinetics of Unsaturated Polyester Resin Supplemented with Organo-Nanoclay. RSC Adv. 2024, 14, 517–528. [Google Scholar] [CrossRef]
- Franco-Urquiza, E.A.; May-Crespo, J.F.; Escalante Velázquez, C.A.; Pérez Mora, R.; González García, P. Thermal Degradation Kinetics of ZnO/Polyester Nanocomposites. Polymers 2020, 12. [Google Scholar] [CrossRef]
- Silva, M.P.; Santos, P.; Parente, J.M.; Valvez, S.; Reis, P.N.B.; Piedade, A.P. Effect of Post-Cure on the Static and Viscoelastic Properties of a Polyester Resin. Polymers 2020, 12. [Google Scholar] [CrossRef]
- Cao, X.; Lee, L.J. Control of Shrinkage and Residual Styrene of Unsaturated Polyester Resins Cured at Low Temperatures: I. Effect of Curing Agents. Polymer (Guildf) 2003, 44, 1893–1902. [Google Scholar] [CrossRef]
- Nguyen, S.A.; Dong, T.Q.; Doan, M.Q.; Nguyen, N.H.; Nguyen, T.A.; Ngo, X.D.; Pham, A.T.; Le, A.T. Boosting the Ultraviolet Shielding and Thermal Retardancy Properties of Unsaturated Polyester Resin by Employing Electrochemically Exfoliated E-GO Nanosheets. RSC Adv. 2023, 13, 25762–25777. [Google Scholar] [CrossRef]
- Stępka, D.; Słota, D.; Niziołek, K.; Buchwald, Z.; Setlak, K.; Mierzwiński, D.; Jampílek, J.; Haraźna, K.; Sobczak-Kupiec, A. Comparative Study of Nanofiller-Reinforced Orthophthalic Polyester Composites: Mechanical, Surface, Tribological and Environmental Performance. Materials 2026, 18, 3989. [Google Scholar] [CrossRef]
- Ren, K.; Tsai, Y. Thermal Hazard Characteristics of Unsaturated Polyester Resin Mixed with Hardeners. Polymers 2021, 13, 1–8. [Google Scholar] [CrossRef]
- Krishnan, L.; Kandola, B.K.; Deli, D.; Ebdon, J.R. Thermal Stability, Flammability and Mechanical Performances of Unsaturated Polyester–Melamine Resin Blends and of Glass Fibre-Reinforced Composites Based on Them. Polymers 2022, 14. [Google Scholar] [CrossRef]
- Ashraf, M.A.; Peng, W.; Zare, Y.; Rhee, K.Y. Effects of Size and Aggregation/Agglomeration of Nanoparticles on the Interfacial/Interphase Properties and Tensile Strength of Polymer Nanocomposites. Nanoscale Res. Lett. 2018, 13. [Google Scholar] [CrossRef]
- Zare, Y. The Roles of Nanoparticles Accumulation and Interphase Properties in Properties of Polymer Particulate Nanocomposites by a Multi-Step Methodology. Compos. Part A Appl. Sci. Manuf. 2016, 91, 127–132. [Google Scholar] [CrossRef]
- Abbas, M.; Buntinx, M.; Deferme, W.; Peeters, R. (Bio)Polymer/ZnO Nanocomposites for Packaging Applications: A Review of Gas Barrier and Mechanical Properties. Nanomaterials 2019, 9. [Google Scholar] [CrossRef]
- Mohammed, M.; Oleiwi, J.K.; Jawad, A.J. afar M.; Mohammed, A.M.; Osman, A.F.; Rahman, R.; Adam, T.; Betar, B.O.; Gopinath, S.C.B.; Dahham, O.S. Effect of Zinc Oxide Surface Treatment Concentration and Nanofiller Loading on the Flexural Properties of Unsaturated Polyester/Kenaf Nanocomposites. Heliyon 2023, 9. [Google Scholar] [CrossRef]
- Chen, H.; Tian, X.; Liu, J. Unsaturated Polyester Resin Nanocomposites Containing ZnO Modified with Oleic Acid Activated by N,N’-Carbonyldiimidazole. Polymers 2018, 10. [Google Scholar] [CrossRef]
- Wilén, B.-M.; Jin, B.; Lant, P. Relationship between Flocculation of Activated Sludge and Composition of Extracellular Polymeric Substances; 2003. [Google Scholar]
- Yu, H.Q. Molecular Insights into Extracellular Polymeric Substances in Activated Sludge. Environ. Sci. Technol. 2020, 54, 7742–7750. [Google Scholar] [CrossRef]
- Ylivainio, K.; Lehti, A.; Jermakka, J.; Wikberg, H.; Turtola, E. Predicting Relative Agronomic Efficiency of Phosphorus-Rich Organic Residues. Sci. Total Environ. 2021, 773. [Google Scholar] [CrossRef]
- Niu, L.; Li, Y.; Xu, L.; Wang, P.; Zhang, W.; Wang, C.; Cai, W.; Wang, L. Ignored Fungal Community in Activated Sludge Wastewater Treatment Plants: Diversity and Altitudinal Characteristics. Environ. Sci. Pollut. Res. 2017, 24, 4185–4193. [Google Scholar] [CrossRef]
- Wu, L.; Ning, D.; Zhang, B.; Li, Y.; Zhang, P.; Shan, X.; Zhang, Q.; Brown, M.R.; Li, Z.; Van Nostrand, J.D.; et al. Global Diversity and Biogeography of Bacterial Communities in Wastewater Treatment Plants. Nat. Microbiol. 2019, 4, 1183–1195. [Google Scholar] [CrossRef]
- Gao, P.; Xu, W.; Sontag, P.; Li, X.; Xue, G.; Liu, T.; Sun, W. Correlating Microbial Community Compositions with Environmental Factors in Activated Sludge from Four Full-Scale Municipal Wastewater Treatment Plants in Shanghai, China. Appl. Microbiol. Biotechnol. 2016, 100, 4663–4673. [Google Scholar] [CrossRef]
- Rosenberg, M.; Visnapuu, M.; Vija, H.; Kisand, V.; Kasemets, K.; Kahru, A.; Ivask, A. Selective Antibiofilm Properties and Biocompatibility of Nano-ZnO and Nano-ZnO/Ag Coated Surfaces. Sci. Rep. 2020, 10. [Google Scholar] [CrossRef]
- Mahamuni-Badiger, P.P.; Patil, P.M.; Badiger, M. V.; Patel, P.R.; Thorat-Gadgil, B.S.; Pandit, A.; Bohara, R.A. Biofilm Formation to Inhibition: Role of Zinc Oxide-Based Nanoparticles. Mater. Sci. Eng. C 2020, 108. [Google Scholar] [CrossRef]
- Al-Amshawee, S.; Yunus, M.Y.B.M.; Lynam, J.G.; Lee, W.H.; Dai, F.; Dakhil, I.H. Roughness and Wettability of Biofilm Carriers: A Systematic Review. Environ. Technol. Innov. 2021, 21, 101233. [Google Scholar] [CrossRef]
- Hwang, G.; Liang, J.; Kang, S.; Tong, M.; Liu, Y. The Role of Conditioning Film Formation in Pseudomonas Aeruginosa PAO1 Adhesion to Inert Surfaces in Aquatic Environments. Biochem. Eng. J. 2013, 76, 90–98. [Google Scholar] [CrossRef]
Figure 1.
Schematic representation of the experimental workflow, including the preparation and curing of ZnO NPs-containing nanocomposites, material characterisation, and the 28-day exposure of selected composites to activated sewage sludge followed by surface morphology assessment. The graphical elements of the scheme were created with the assistance of Nano Banana, Gemini Image, Google.
Figure 1.
Schematic representation of the experimental workflow, including the preparation and curing of ZnO NPs-containing nanocomposites, material characterisation, and the 28-day exposure of selected composites to activated sewage sludge followed by surface morphology assessment. The graphical elements of the scheme were created with the assistance of Nano Banana, Gemini Image, Google.
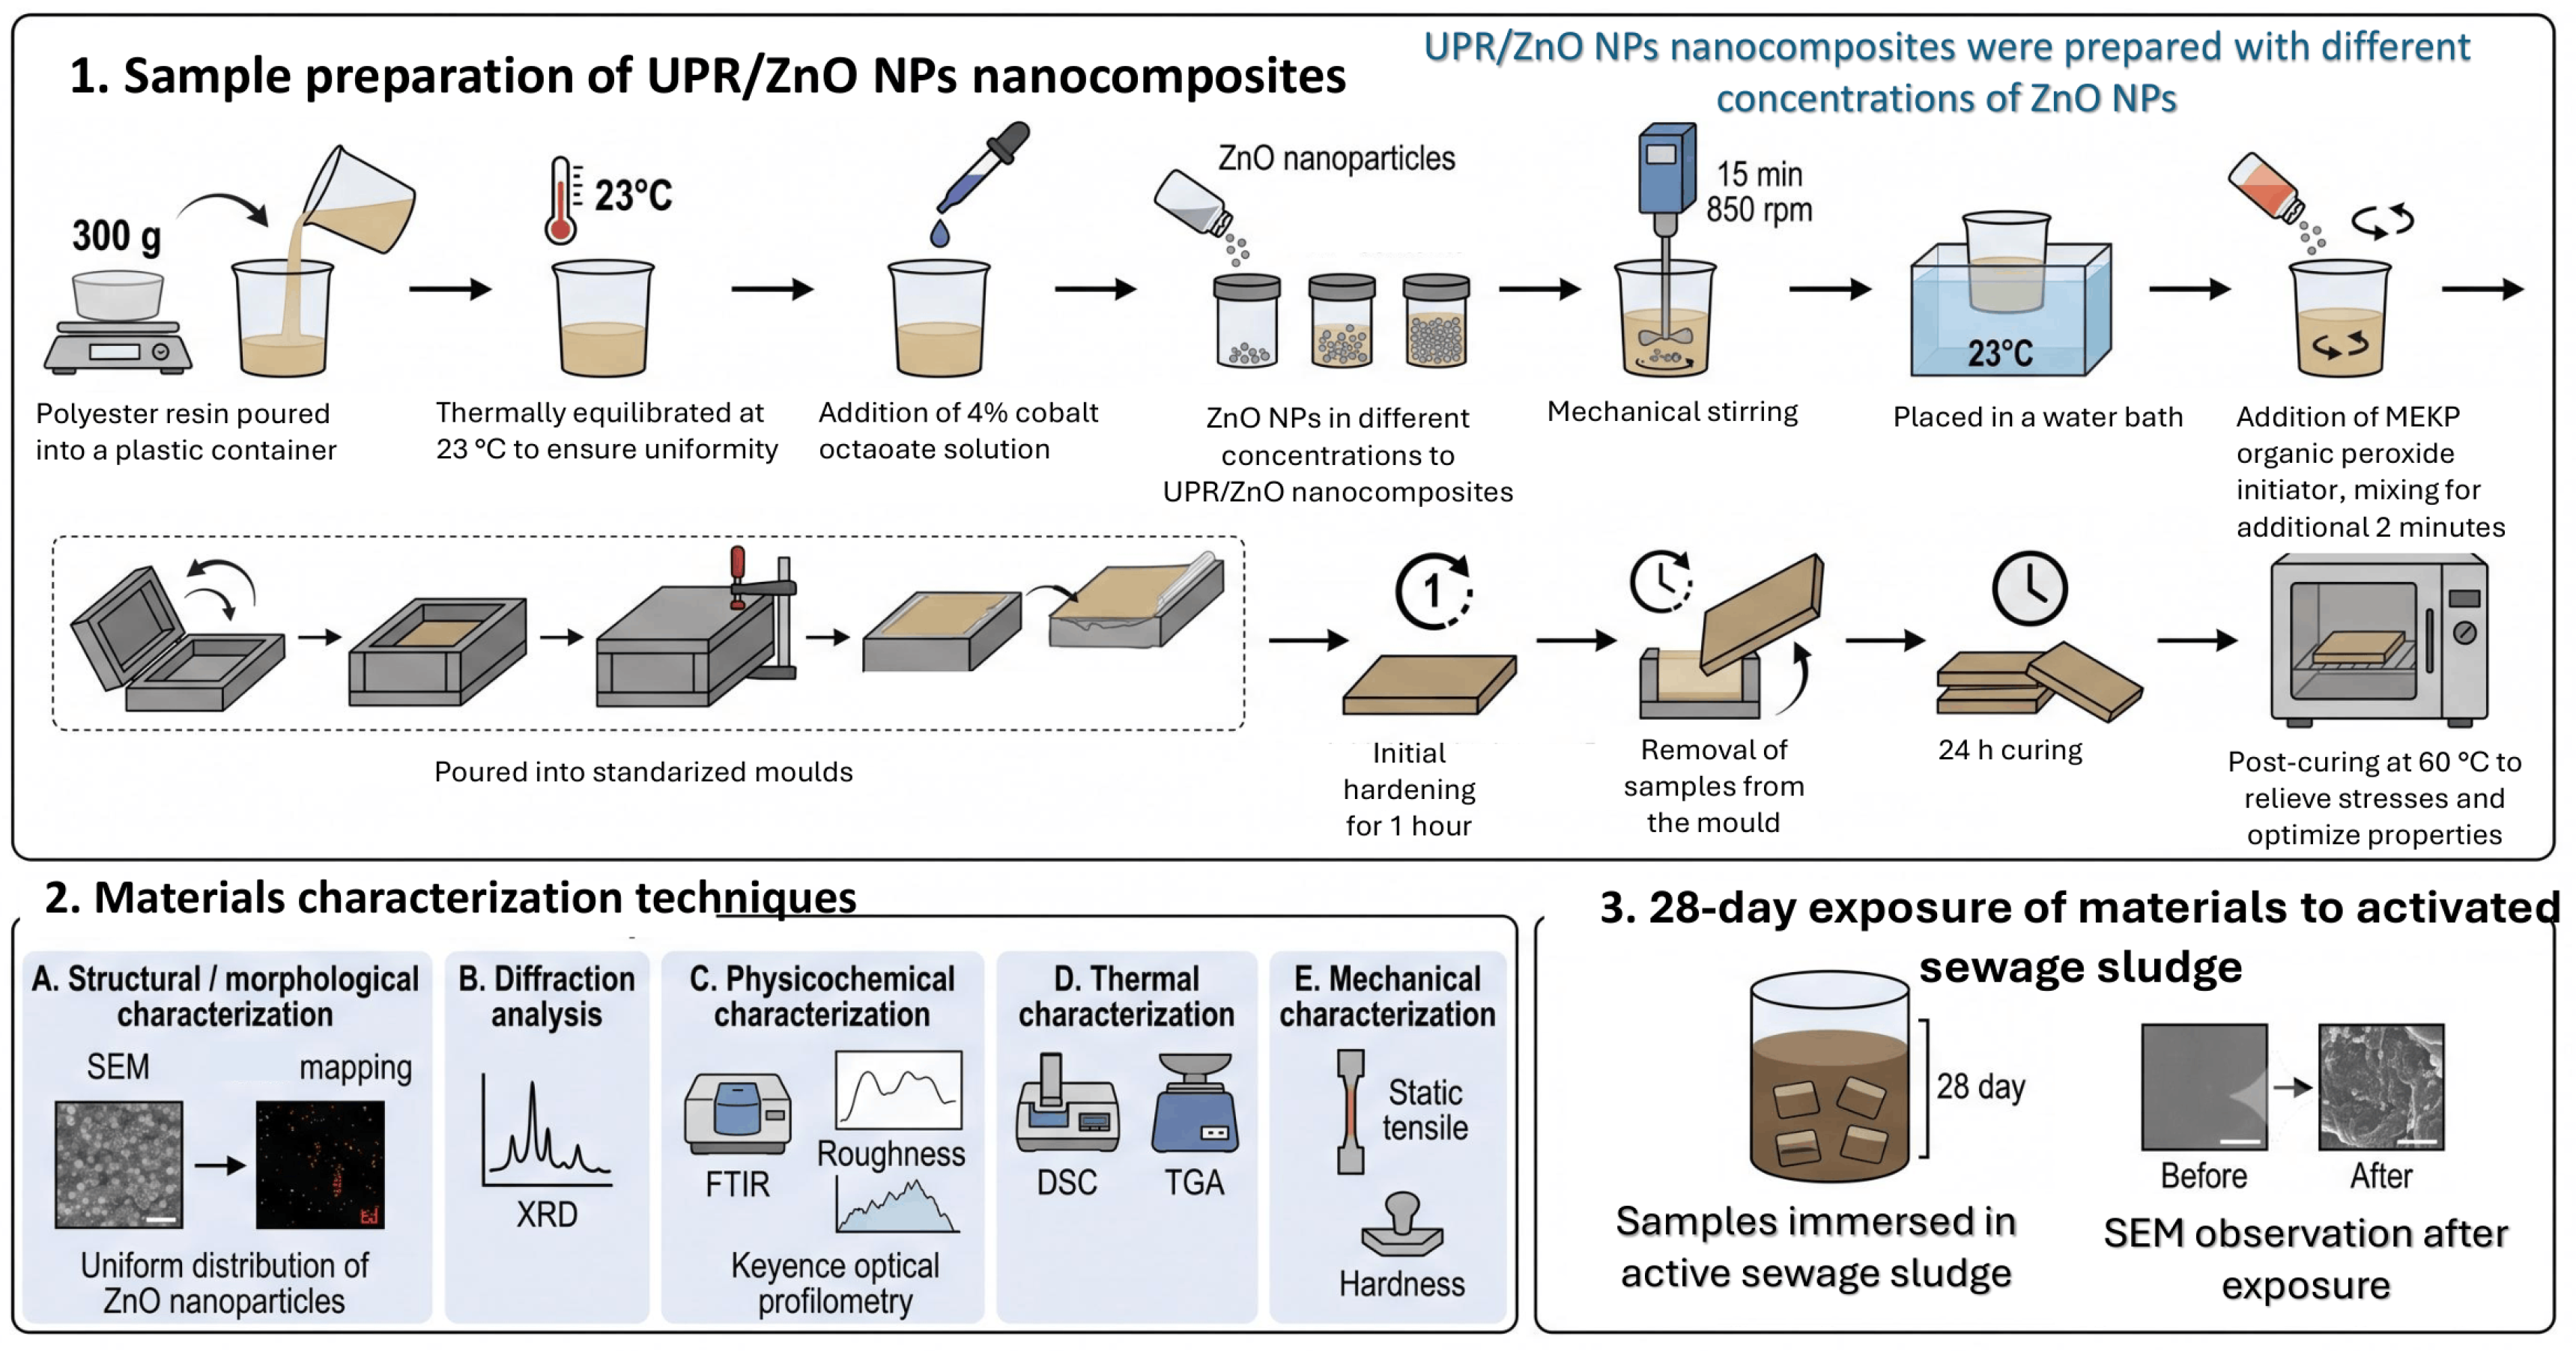
Figure 2.
FTIR spectra of UPR-based composites containing 0.02 – 1.00%wt. of ZnO NPs: (a) the full spectrum in the range of 4000 - 650 cm−1 and (b) a spectrum in the range 1750 - 1600 cm−1, with the ester carbonyl band ν(C=O) at approximately 1720 cm−1 and the ν(C=C) band at approximately 1645 cm−1 indicated, which are used to evaluate changes associated with the curing process.
Figure 2.
FTIR spectra of UPR-based composites containing 0.02 – 1.00%wt. of ZnO NPs: (a) the full spectrum in the range of 4000 - 650 cm−1 and (b) a spectrum in the range 1750 - 1600 cm−1, with the ester carbonyl band ν(C=O) at approximately 1720 cm−1 and the ν(C=C) band at approximately 1645 cm−1 indicated, which are used to evaluate changes associated with the curing process.
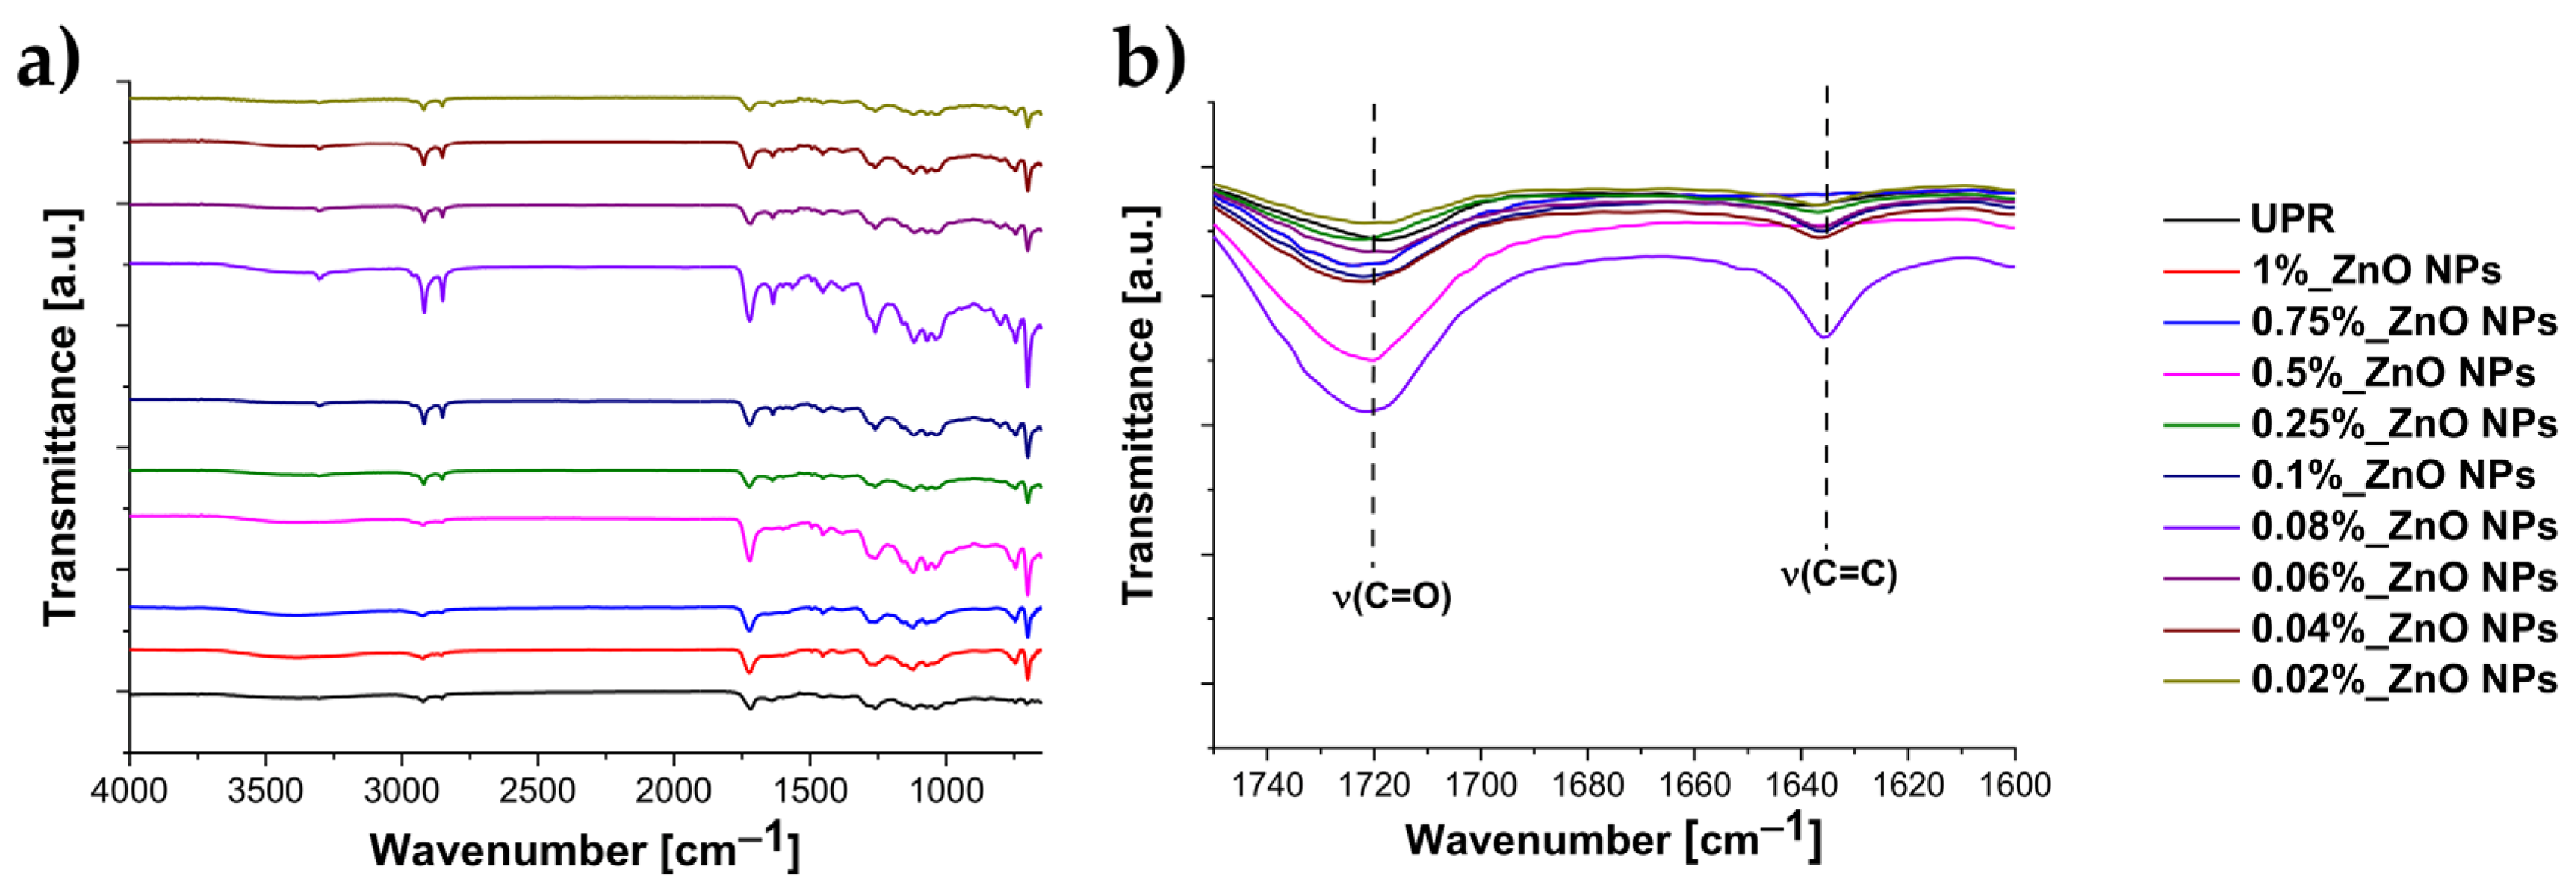
Figure 3.
X-ray diffraction patterns of neat UPR and ZnO NPs-modified composites: (a) comparison of the diffraction profiles with characteristic ZnO NPs reflections at 2θ = 31.68°, 34.38°, and 36.16°, corresponding to the (100), (002), and (101) crystallographic planes, respectively [29]; (b) individual XRD patterns of pristine UPR and ZnO NPs-modified composites containing 0.02–1.00 wt.% ZnO NPs, presented with vertical offsets for clarity.
Figure 3.
X-ray diffraction patterns of neat UPR and ZnO NPs-modified composites: (a) comparison of the diffraction profiles with characteristic ZnO NPs reflections at 2θ = 31.68°, 34.38°, and 36.16°, corresponding to the (100), (002), and (101) crystallographic planes, respectively [29]; (b) individual XRD patterns of pristine UPR and ZnO NPs-modified composites containing 0.02–1.00 wt.% ZnO NPs, presented with vertical offsets for clarity.
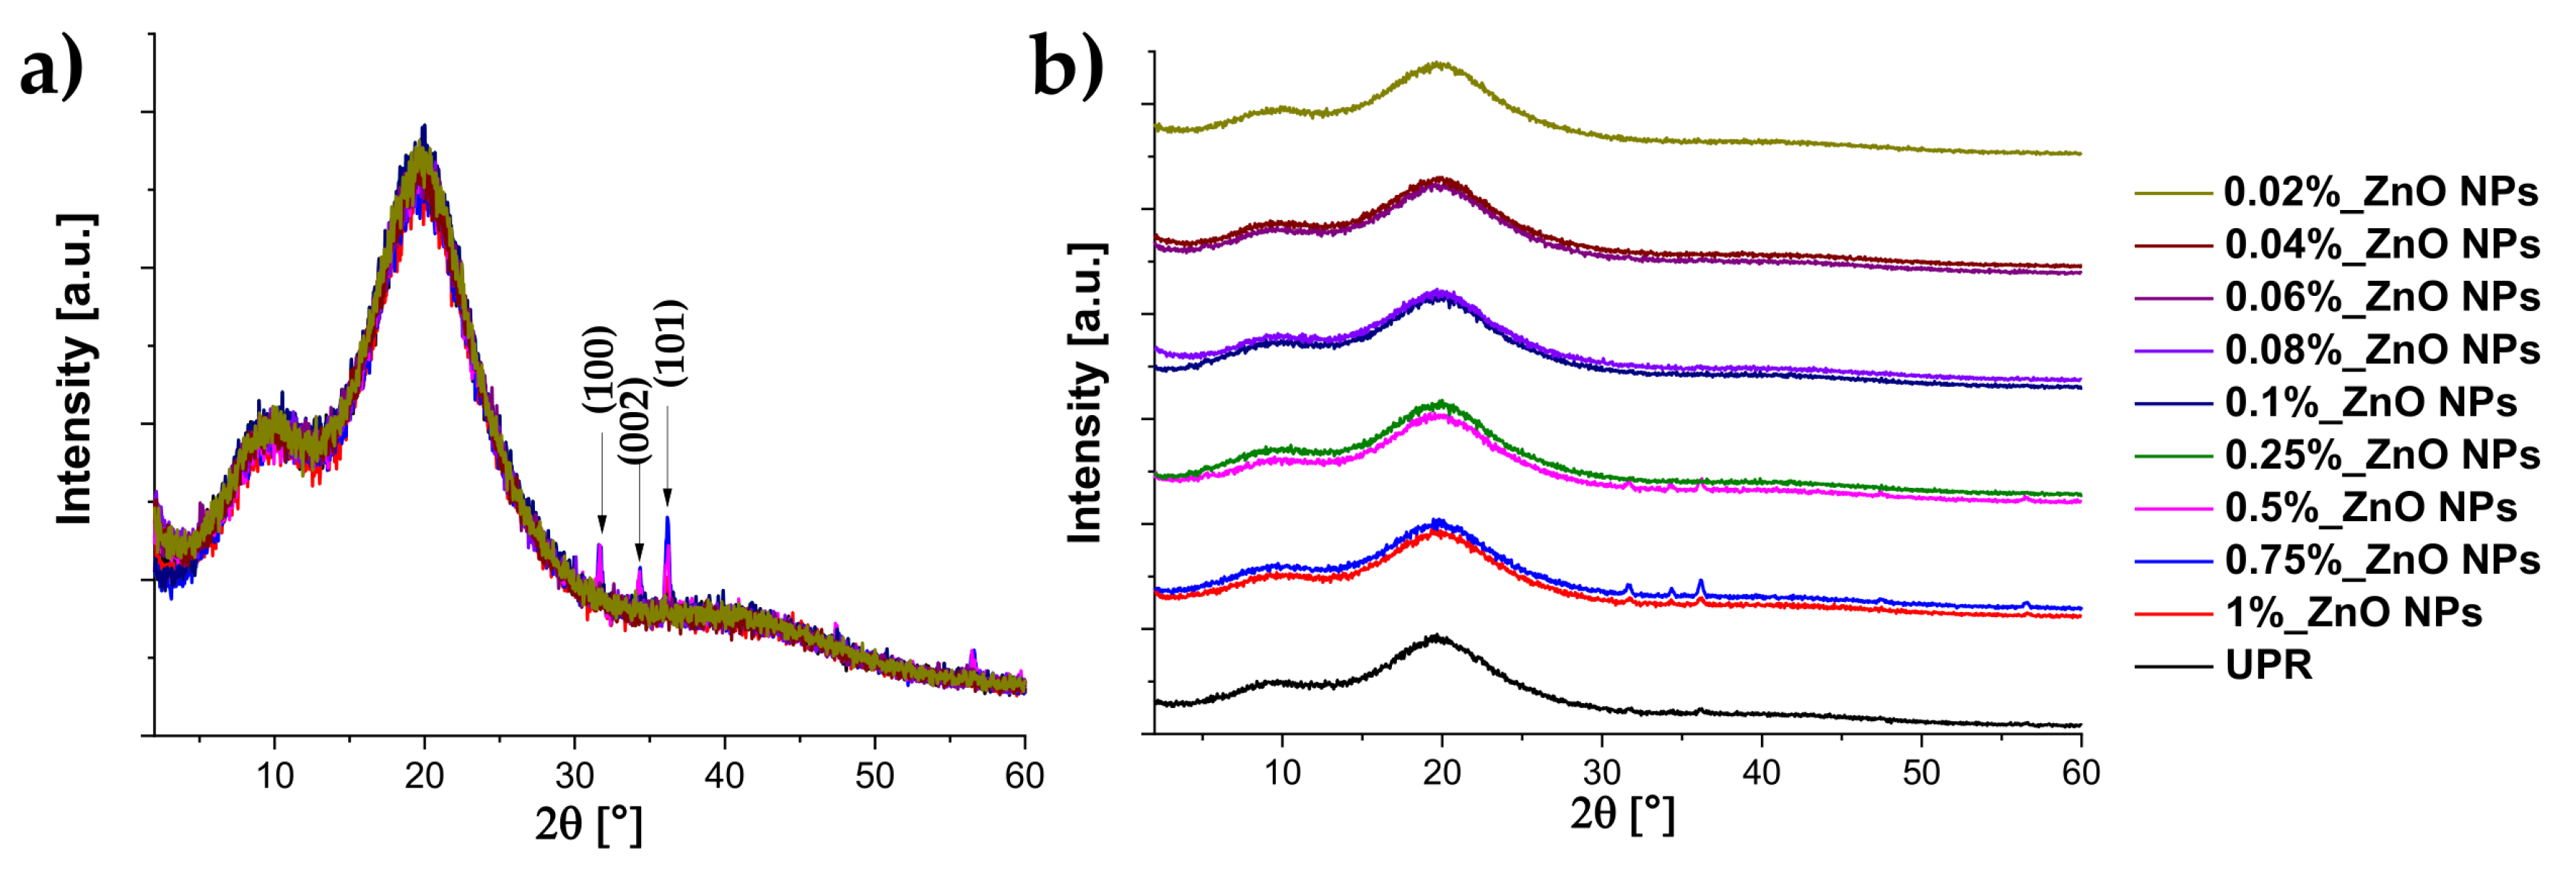
Figure 4.
Representative indentations obtained during Vickers hardness testing of pristine UPR and composites containing 0.02–1%wt. ZnO NPs. The red lines indicate the diagonals of the indentations used to determine the hardness. Scale: 100 µm.
Figure 4.
Representative indentations obtained during Vickers hardness testing of pristine UPR and composites containing 0.02–1%wt. ZnO NPs. The red lines indicate the diagonals of the indentations used to determine the hardness. Scale: 100 µm.
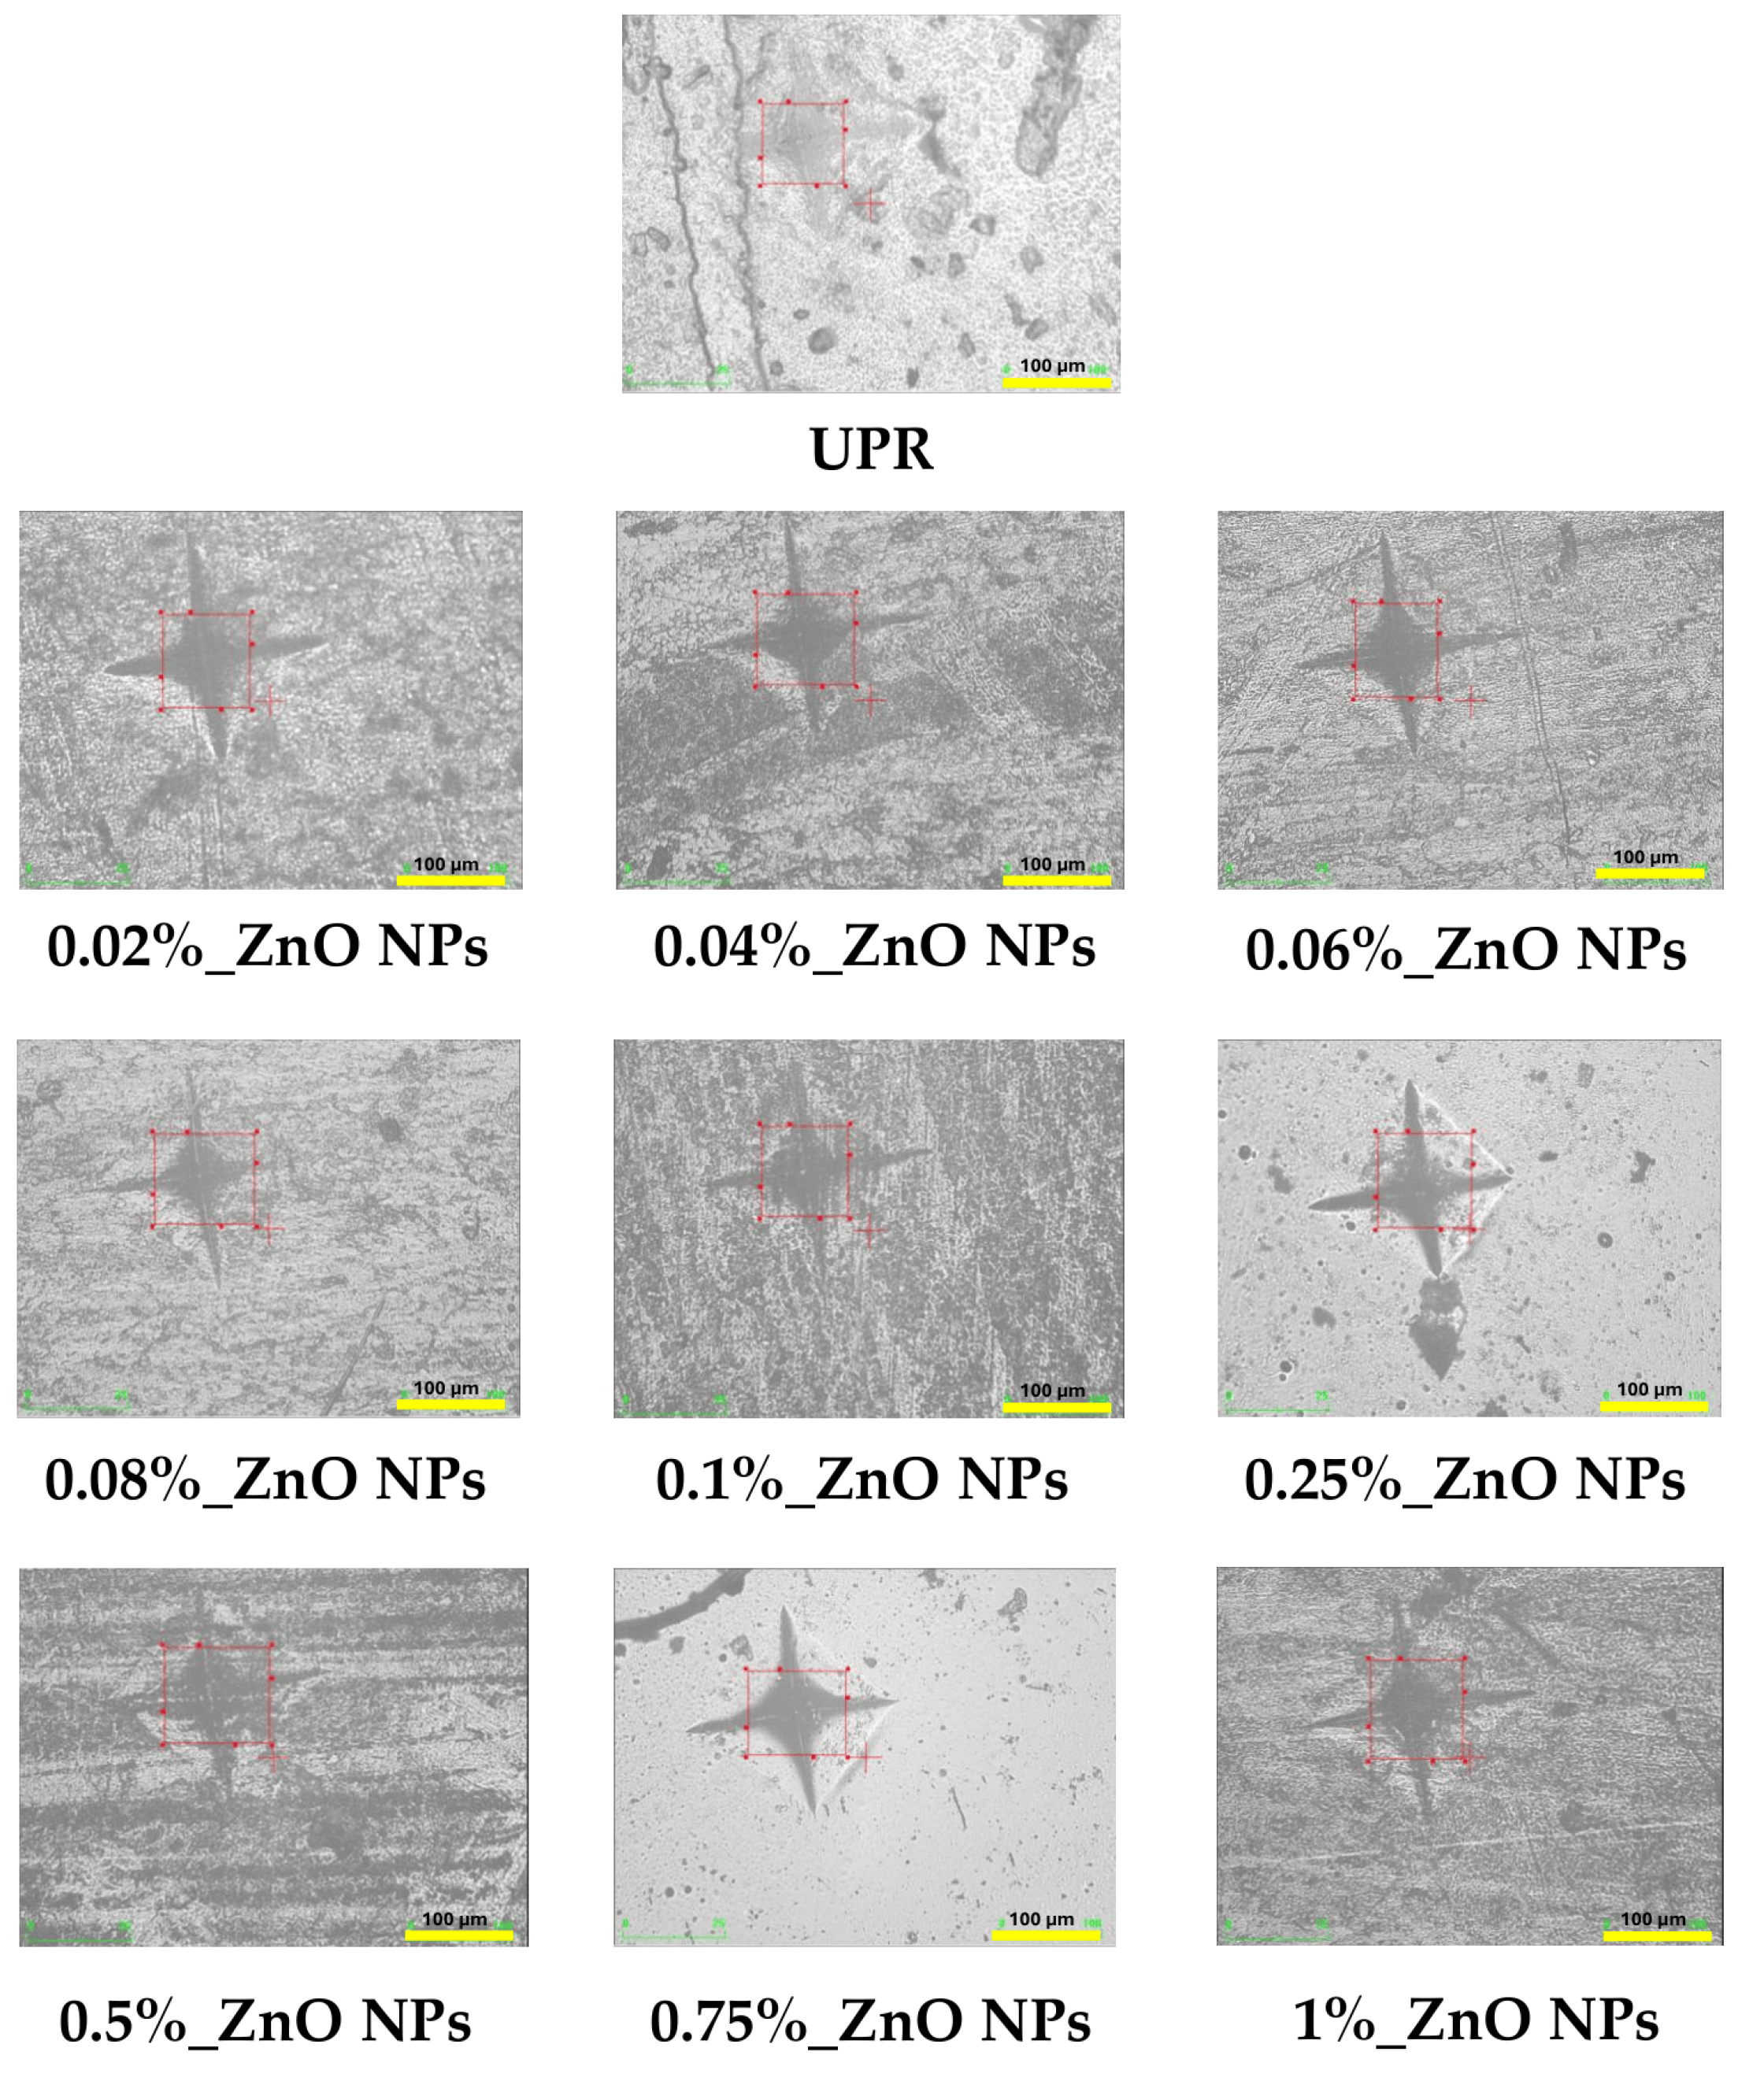
Figure 5.
Mechanical properties of pristine UPR and selected ZnO NPs-modified composites: (a) Young’s modulus, (b) tensile strength, (c) flexural modulus, and (d) flexural strength. Data are presented as mean ± standard error (SE). Statistical significance was determined relative to pure UPR: *p < 0.05, **p < 0.01, ***p < 0.001.
Figure 5.
Mechanical properties of pristine UPR and selected ZnO NPs-modified composites: (a) Young’s modulus, (b) tensile strength, (c) flexural modulus, and (d) flexural strength. Data are presented as mean ± standard error (SE). Statistical significance was determined relative to pure UPR: *p < 0.05, **p < 0.01, ***p < 0.001.
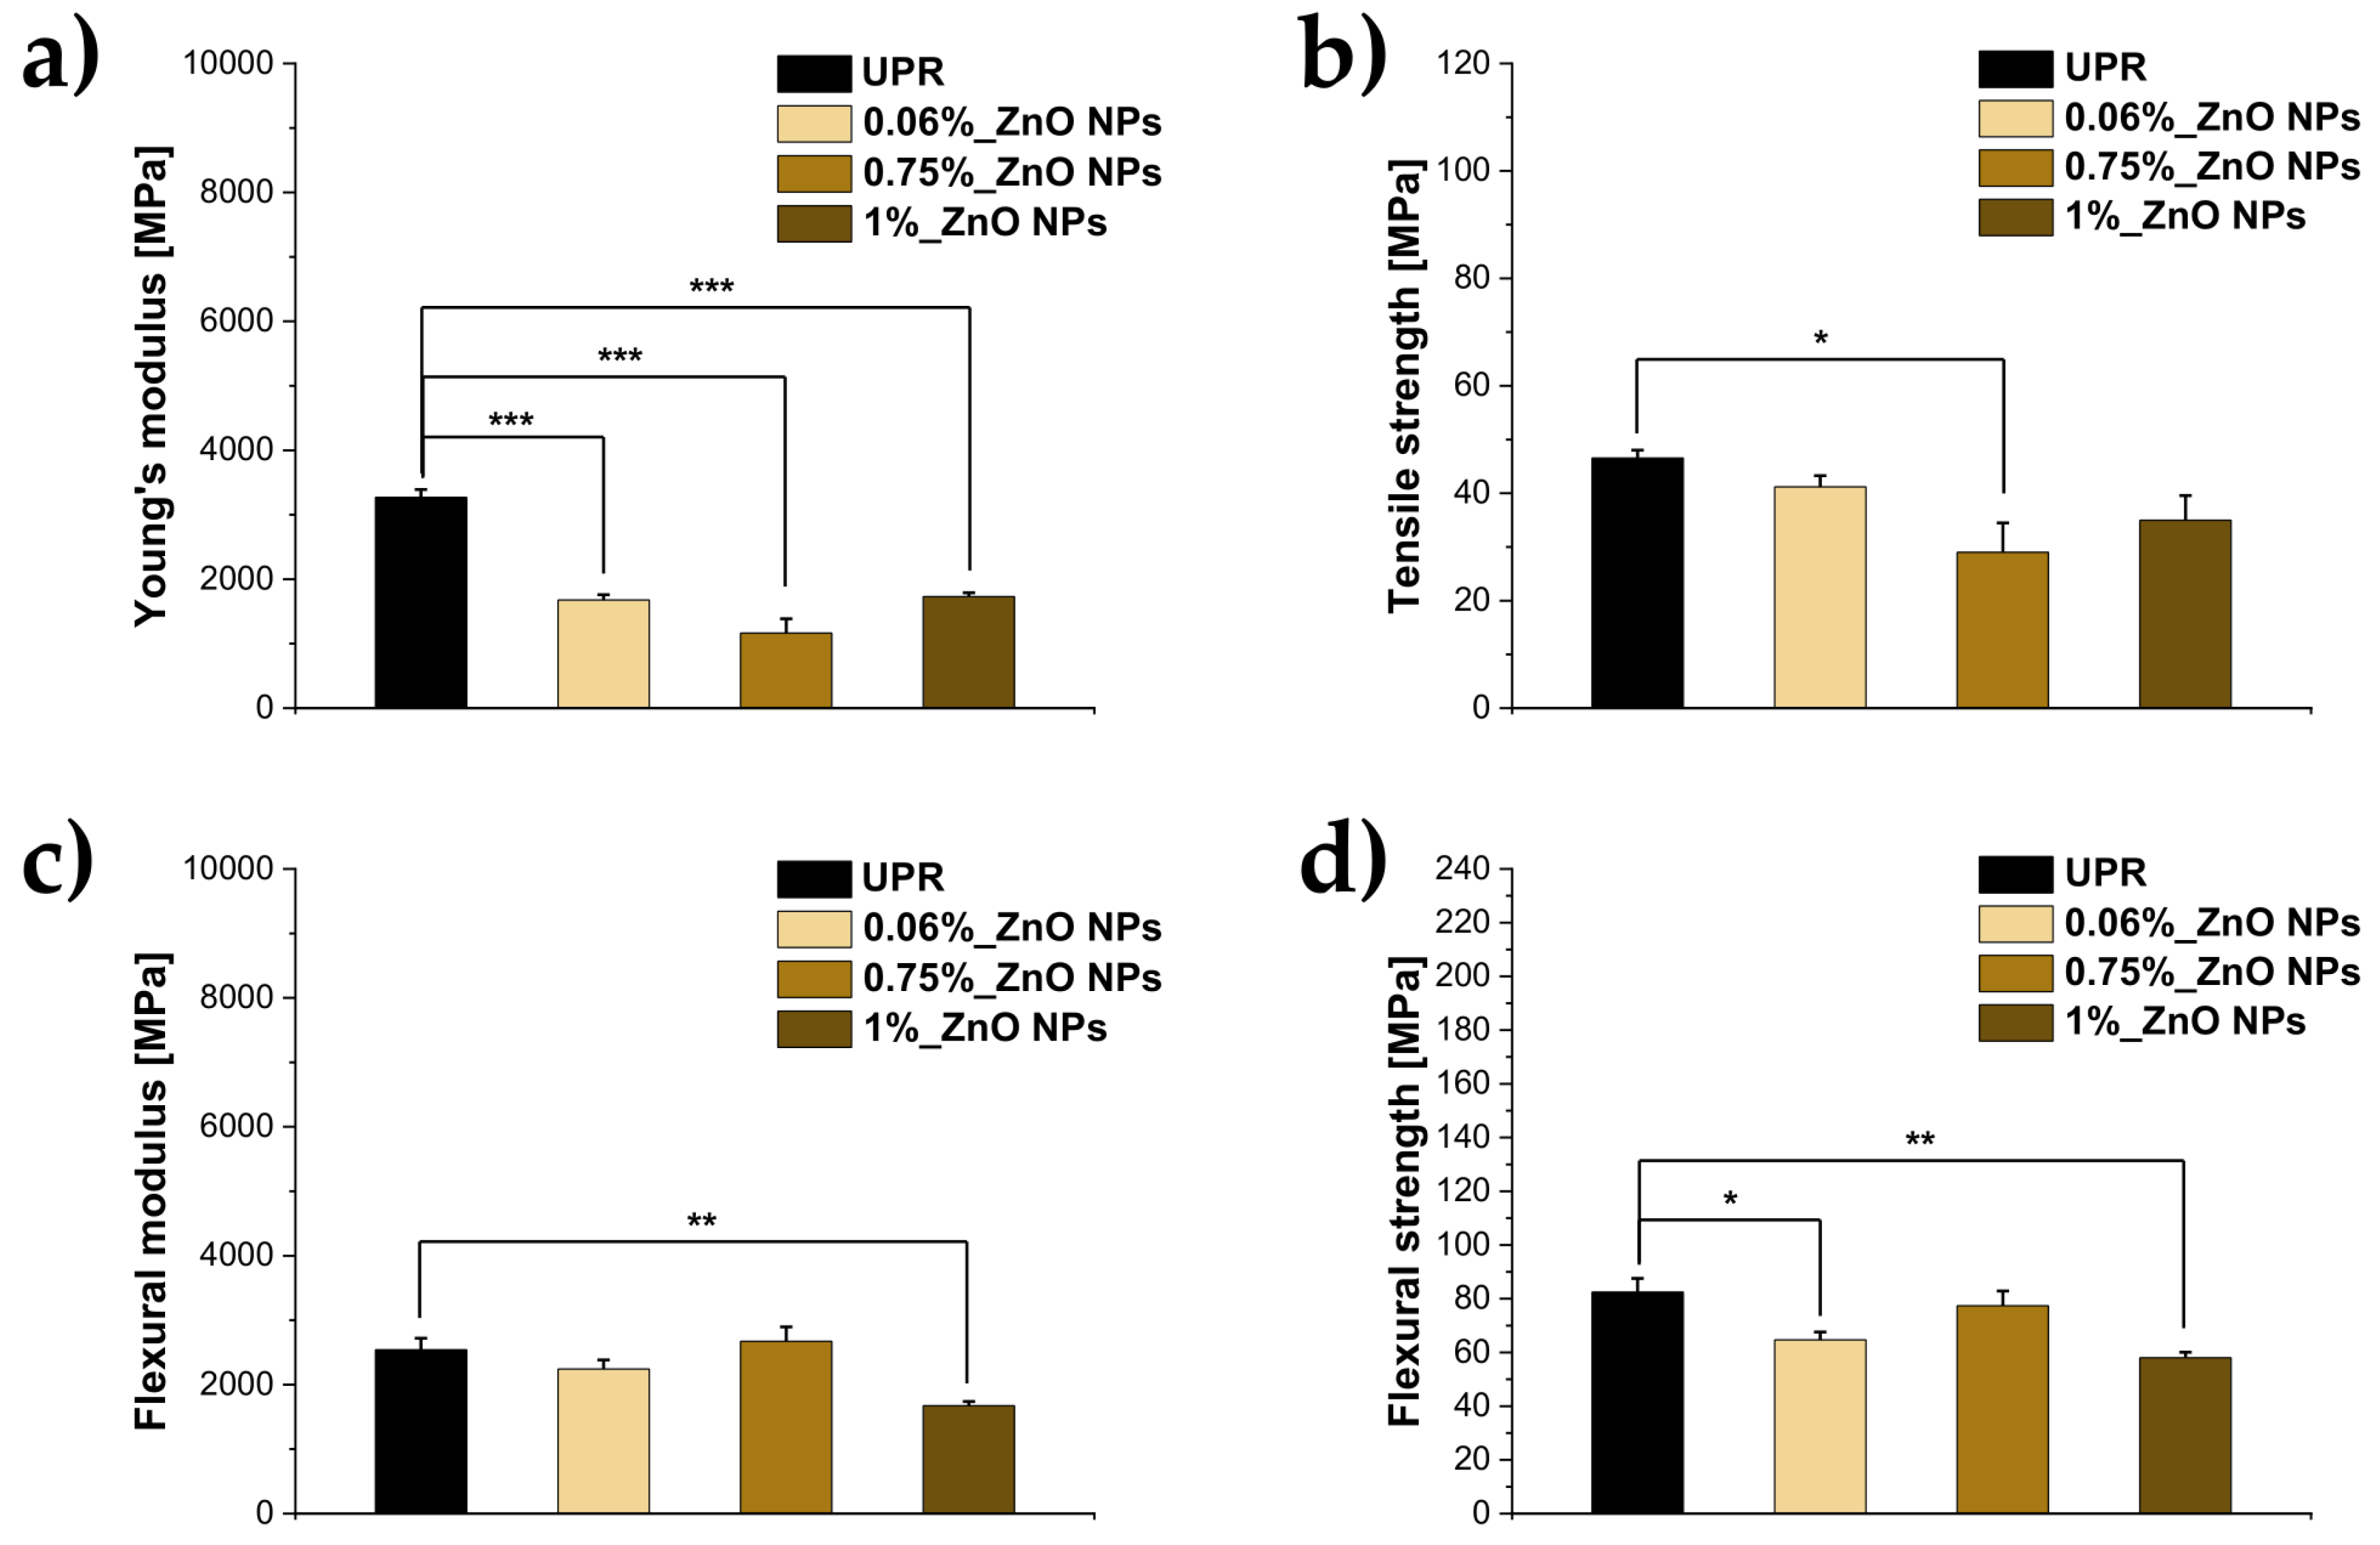
Figure 6.
Thermogravimetric (TGA) analysis of pristine UPR and selected nanocomposites: 0.06%_ZnO NPs, 0.75%_ZnO NPs, and 1%_ZnO NPs. The inset shows an enlarged view of the main decomposition region between 350 and 400 °C.
Figure 6.
Thermogravimetric (TGA) analysis of pristine UPR and selected nanocomposites: 0.06%_ZnO NPs, 0.75%_ZnO NPs, and 1%_ZnO NPs. The inset shows an enlarged view of the main decomposition region between 350 and 400 °C.
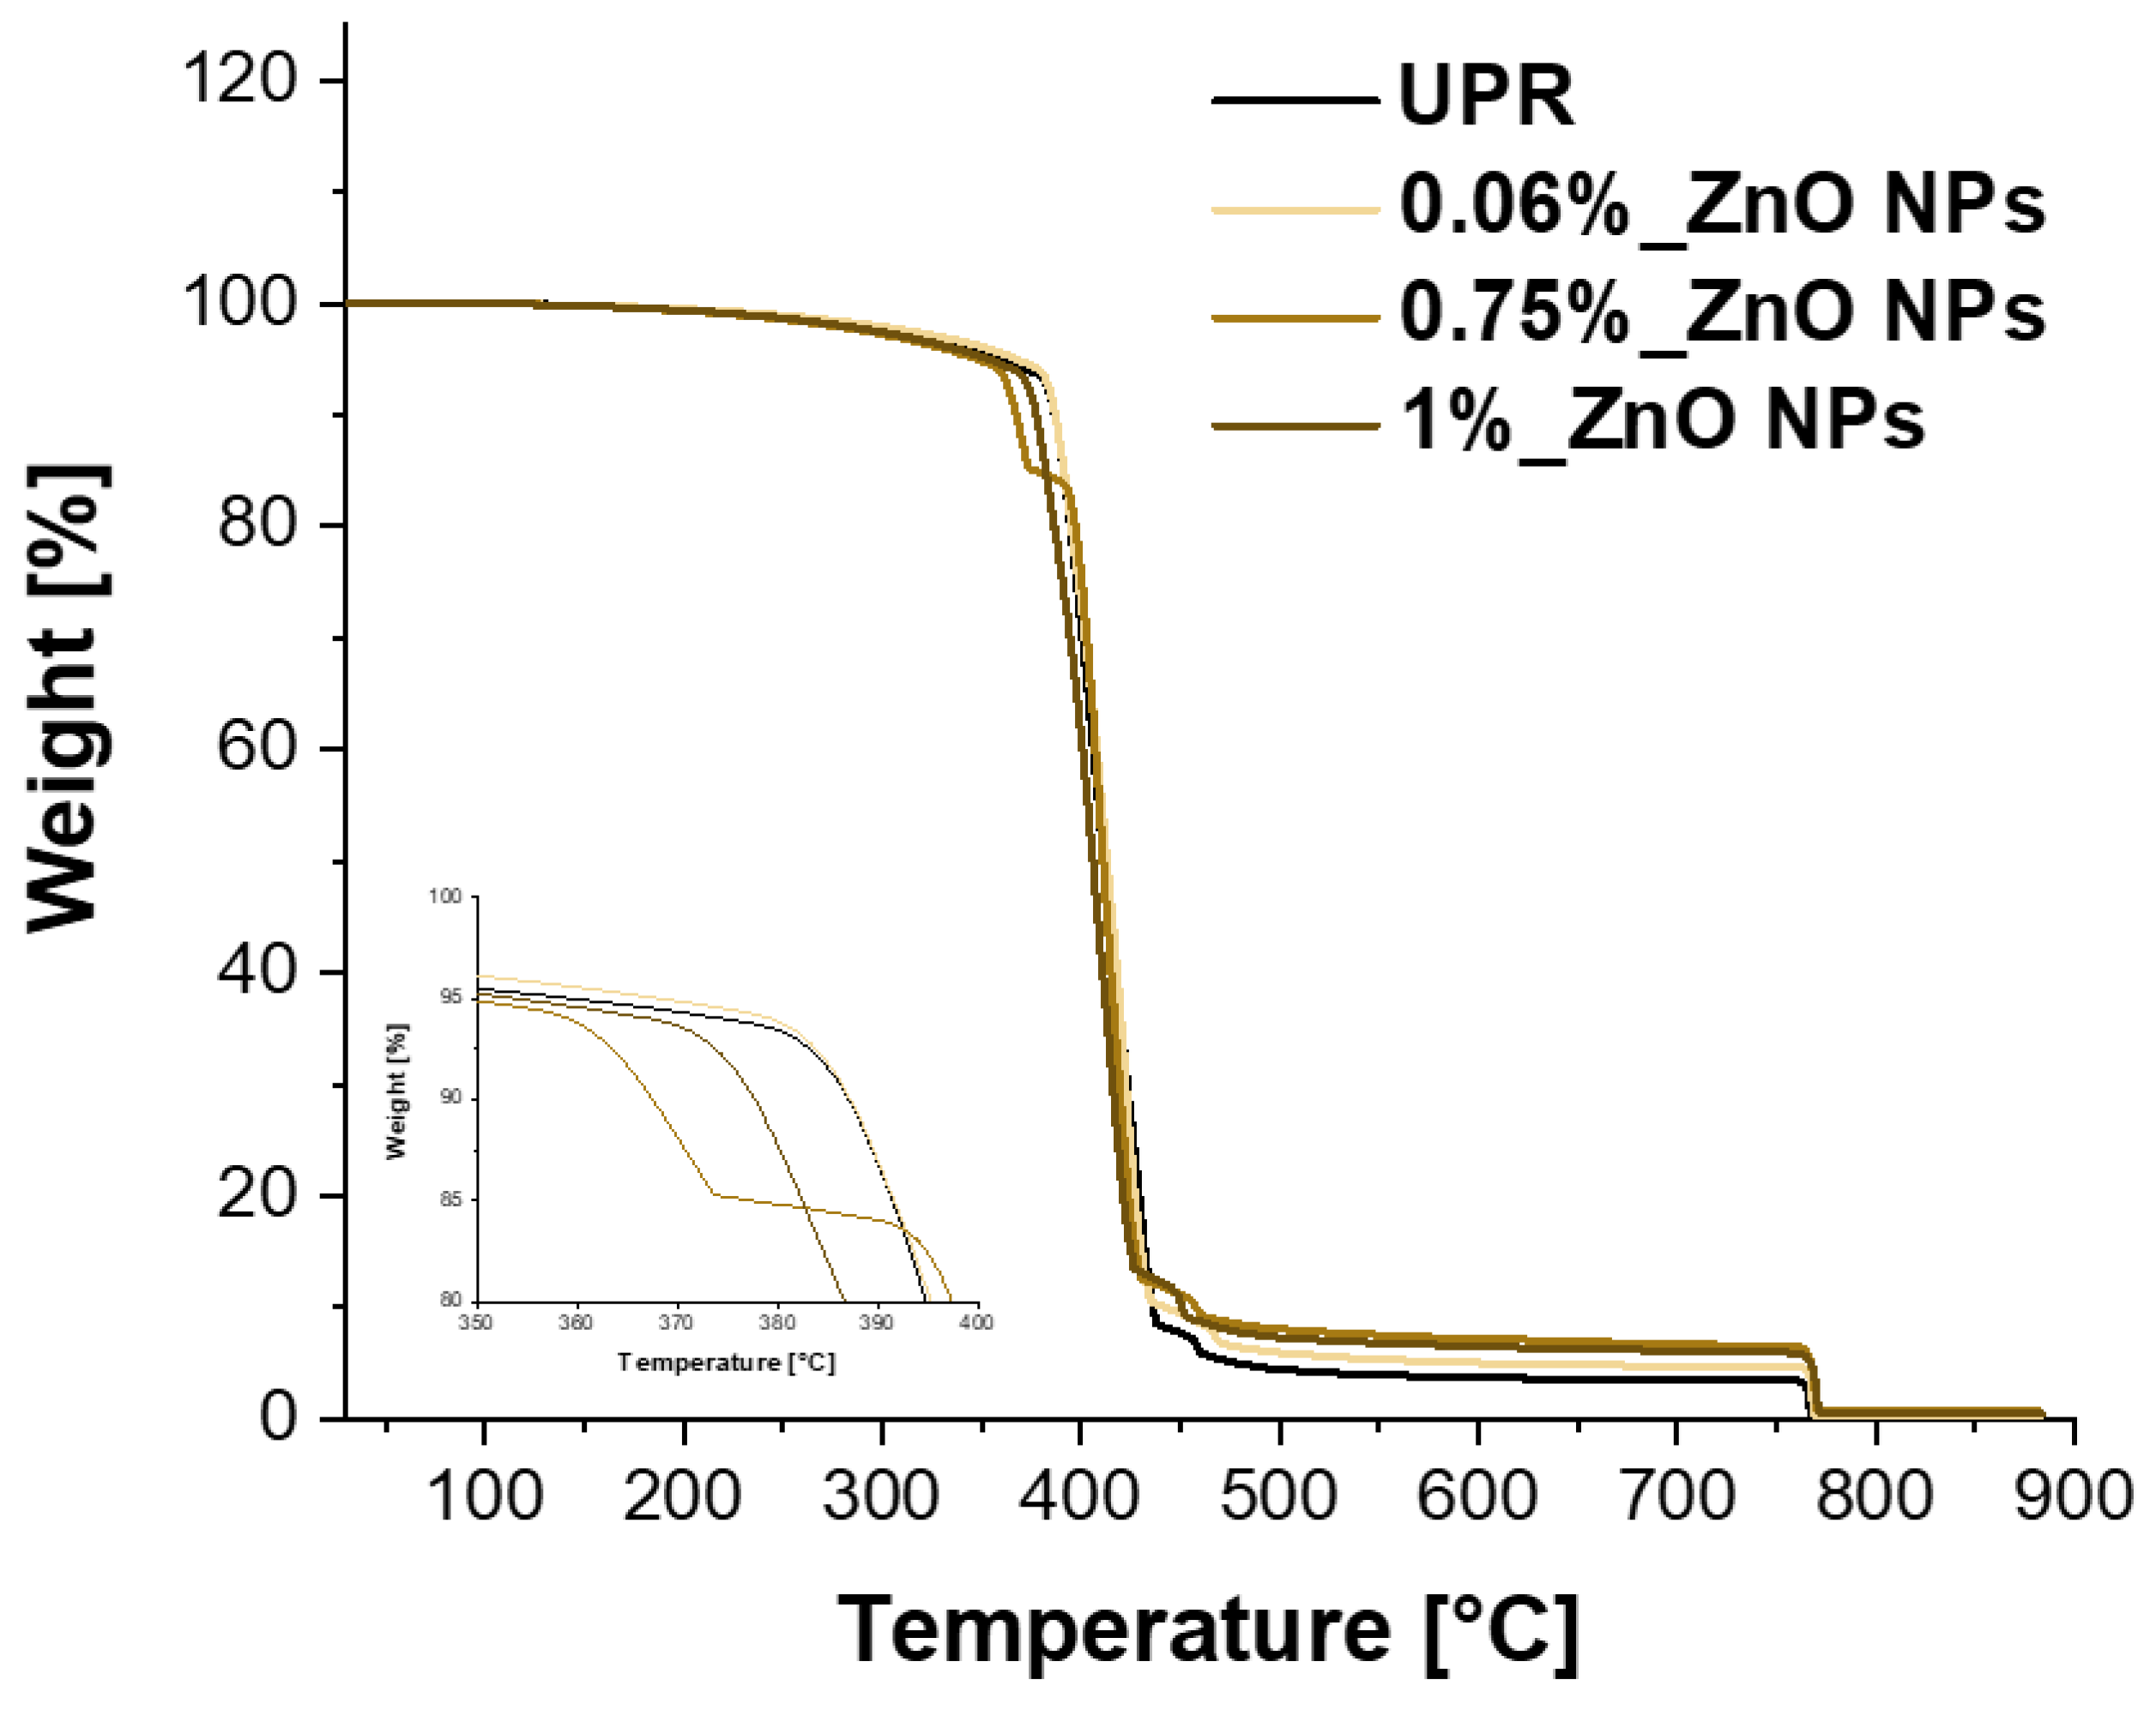
Figure 7.
Representative surface morphology and topography of UPR before activated sludge exposure: (a) surface image recorded at 2500× magnification, (b) 3D topographic reconstruction recorded at 500× magnification, and (c) corresponding surface height profile across the analyzed area. Scale bar = 10 μm.
Figure 7.
Representative surface morphology and topography of UPR before activated sludge exposure: (a) surface image recorded at 2500× magnification, (b) 3D topographic reconstruction recorded at 500× magnification, and (c) corresponding surface height profile across the analyzed area. Scale bar = 10 μm.
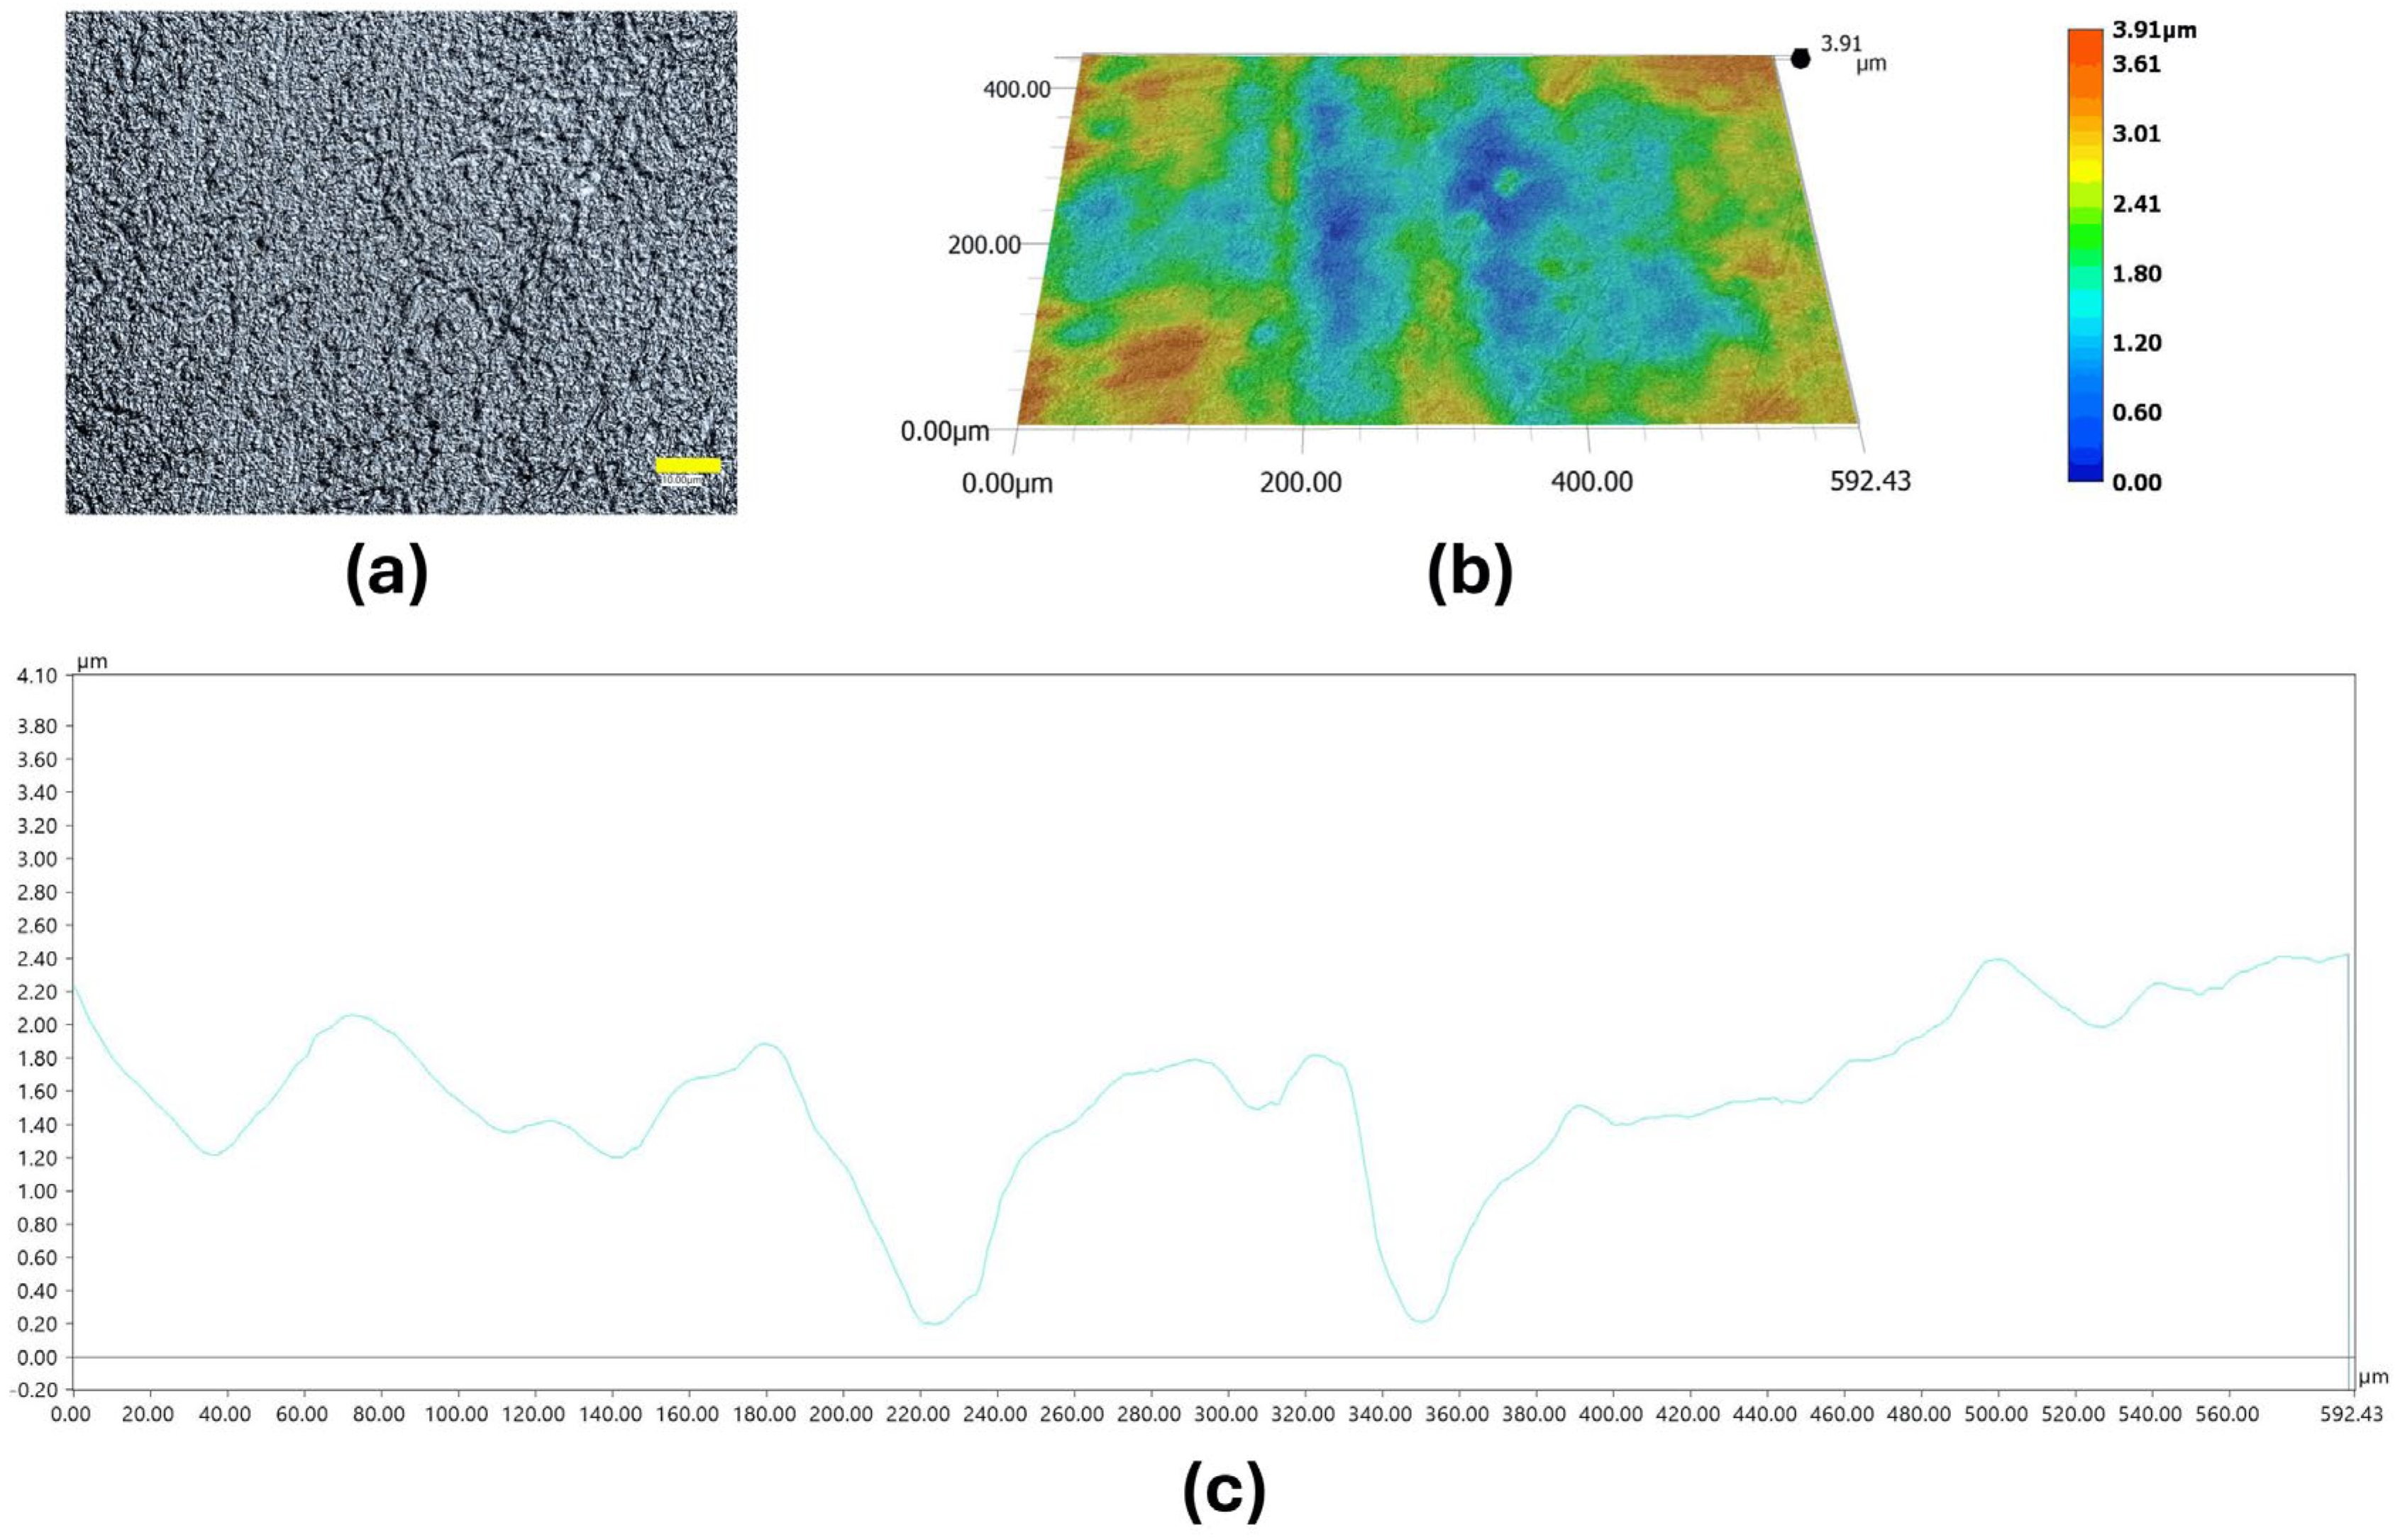
Figure 8.
Representative surface morphology and topography of 0.06%_ZnO NPs before activated sludge exposure: (a) surface image recorded at 2500× magnification, (b) 3D topographic reconstruction recorded at 500× magnification, and (c) corresponding surface height profile across the analyzed area. Scale bar = 10 μm.
Figure 8.
Representative surface morphology and topography of 0.06%_ZnO NPs before activated sludge exposure: (a) surface image recorded at 2500× magnification, (b) 3D topographic reconstruction recorded at 500× magnification, and (c) corresponding surface height profile across the analyzed area. Scale bar = 10 μm.
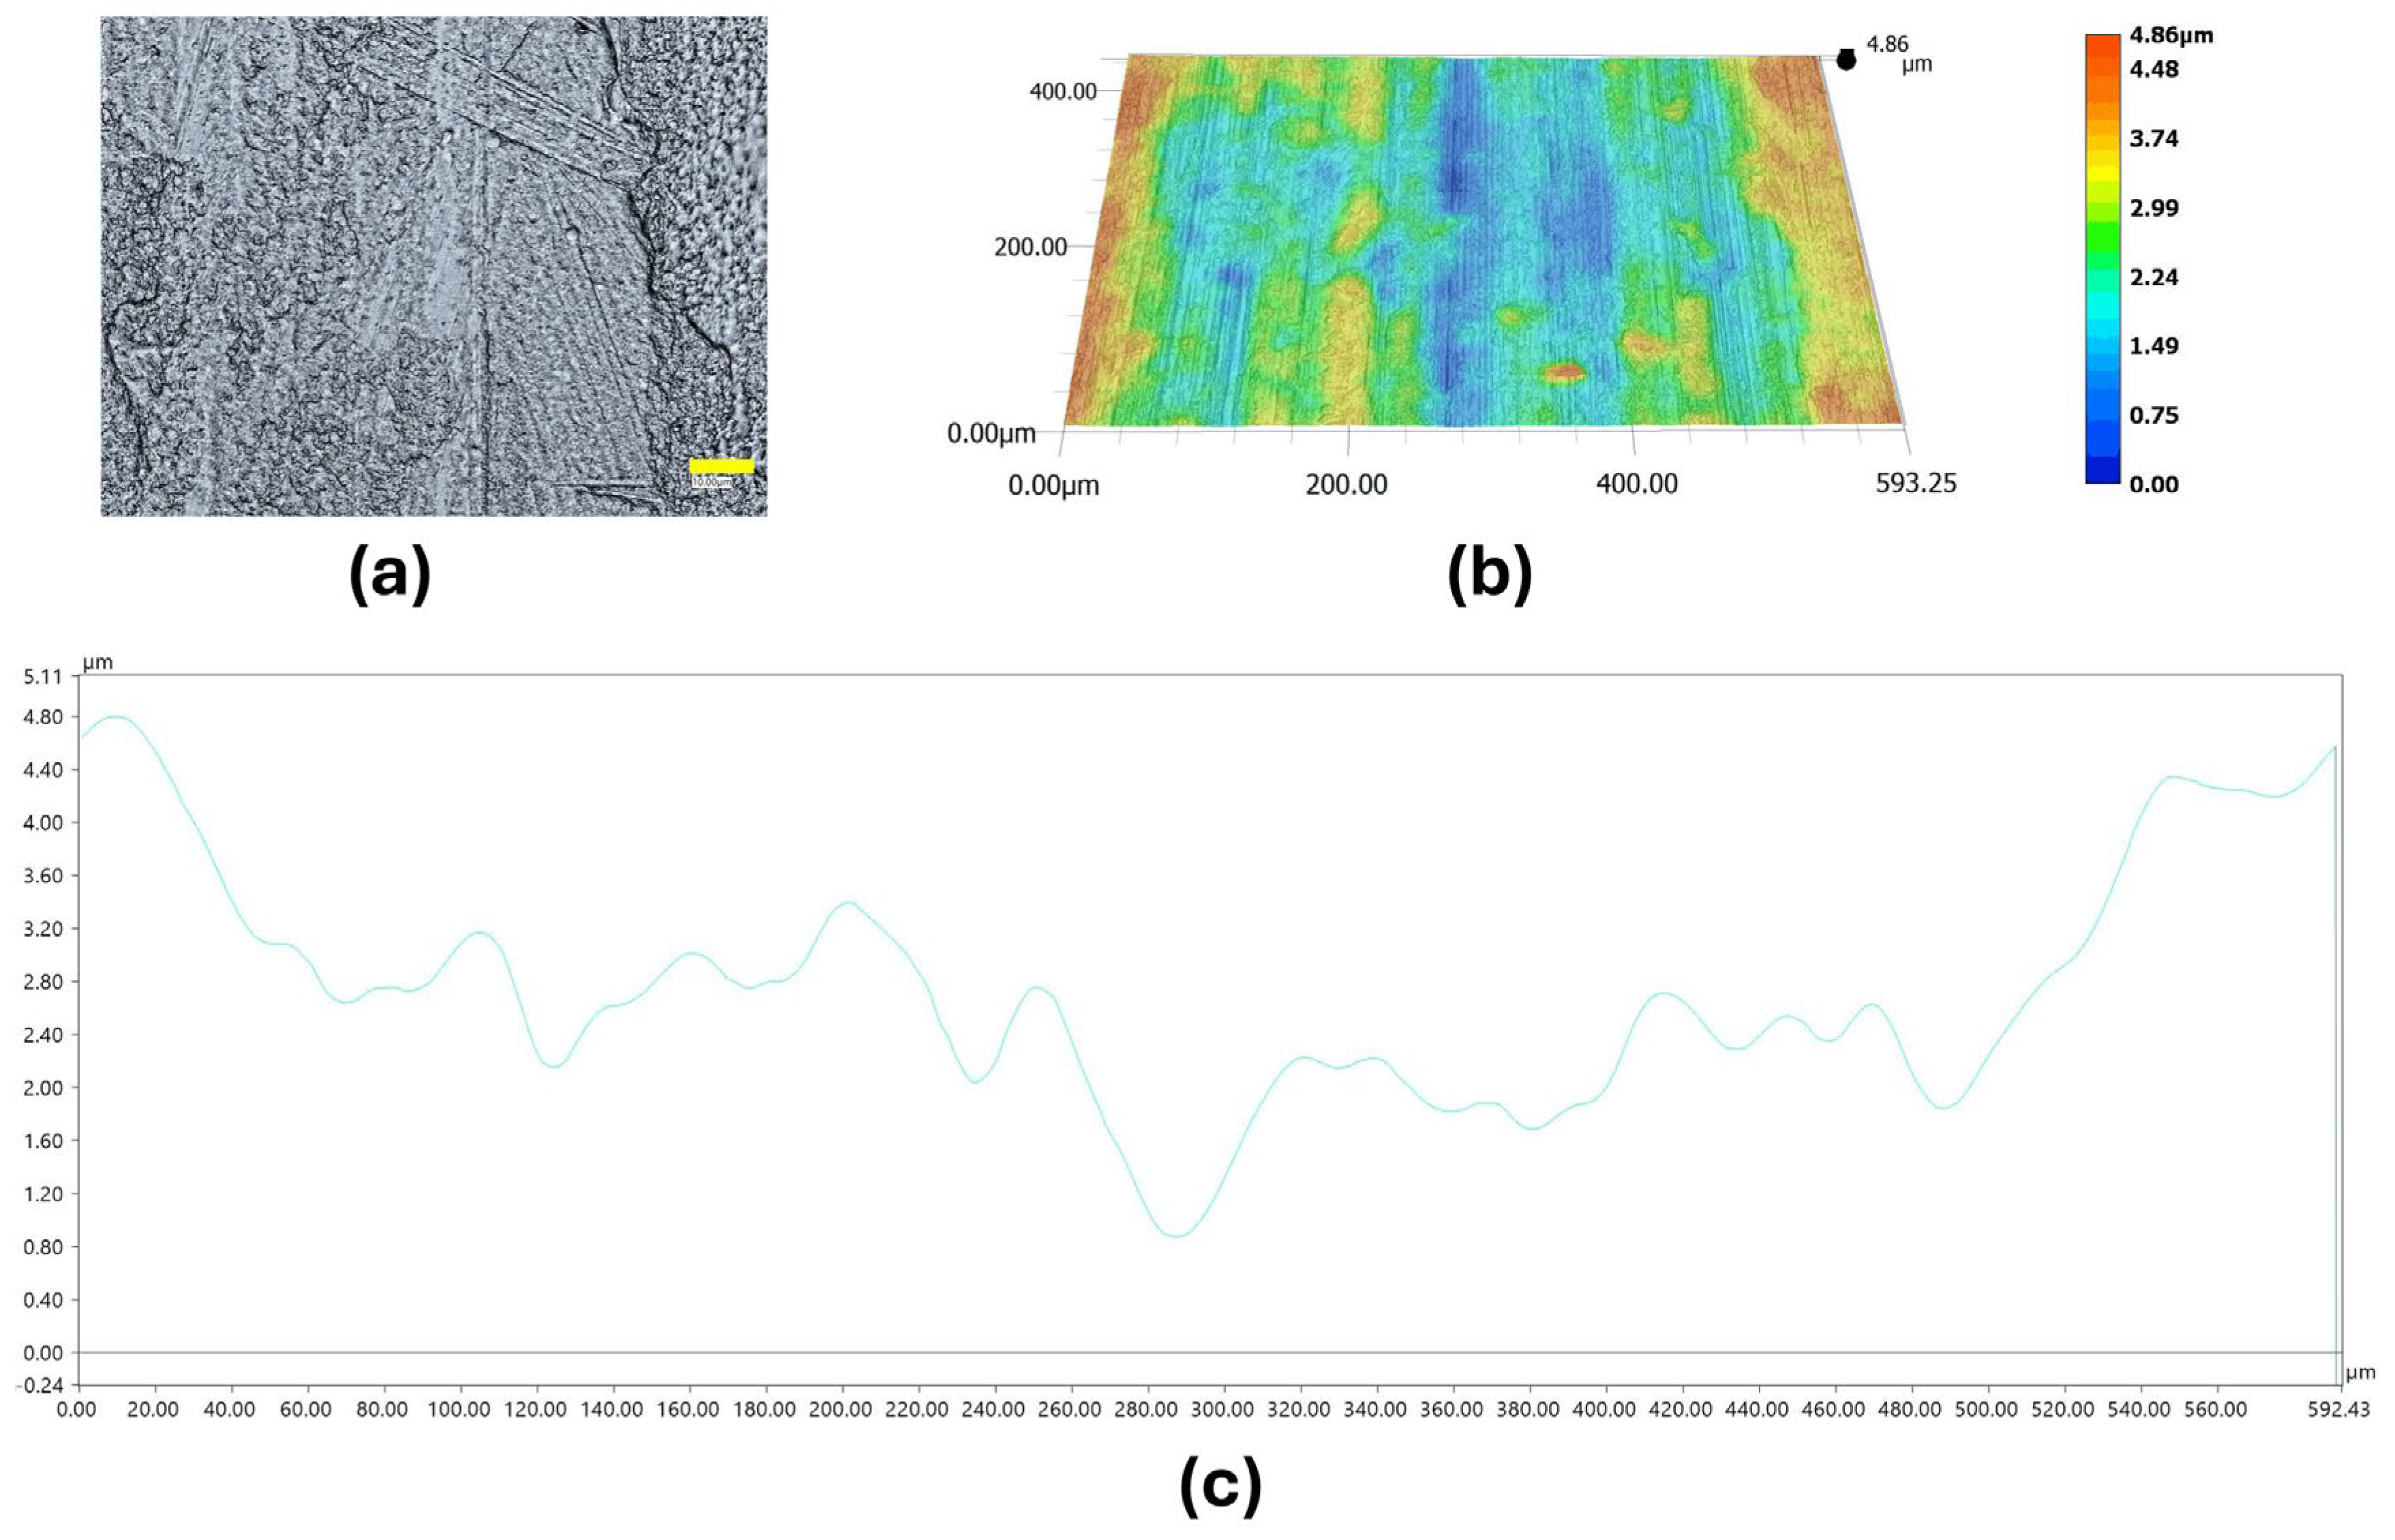
Figure 9.
Representative surface morphology and topography of 0.75%_ZnO NPs before activated sludge exposure: (a) surface image recorded at 2500× magnification, (b) 3D topographic reconstruction recorded at 500× magnification, and (c) corresponding surface height profile across the analyzed area. Scale bar = 10 μm.
Figure 9.
Representative surface morphology and topography of 0.75%_ZnO NPs before activated sludge exposure: (a) surface image recorded at 2500× magnification, (b) 3D topographic reconstruction recorded at 500× magnification, and (c) corresponding surface height profile across the analyzed area. Scale bar = 10 μm.
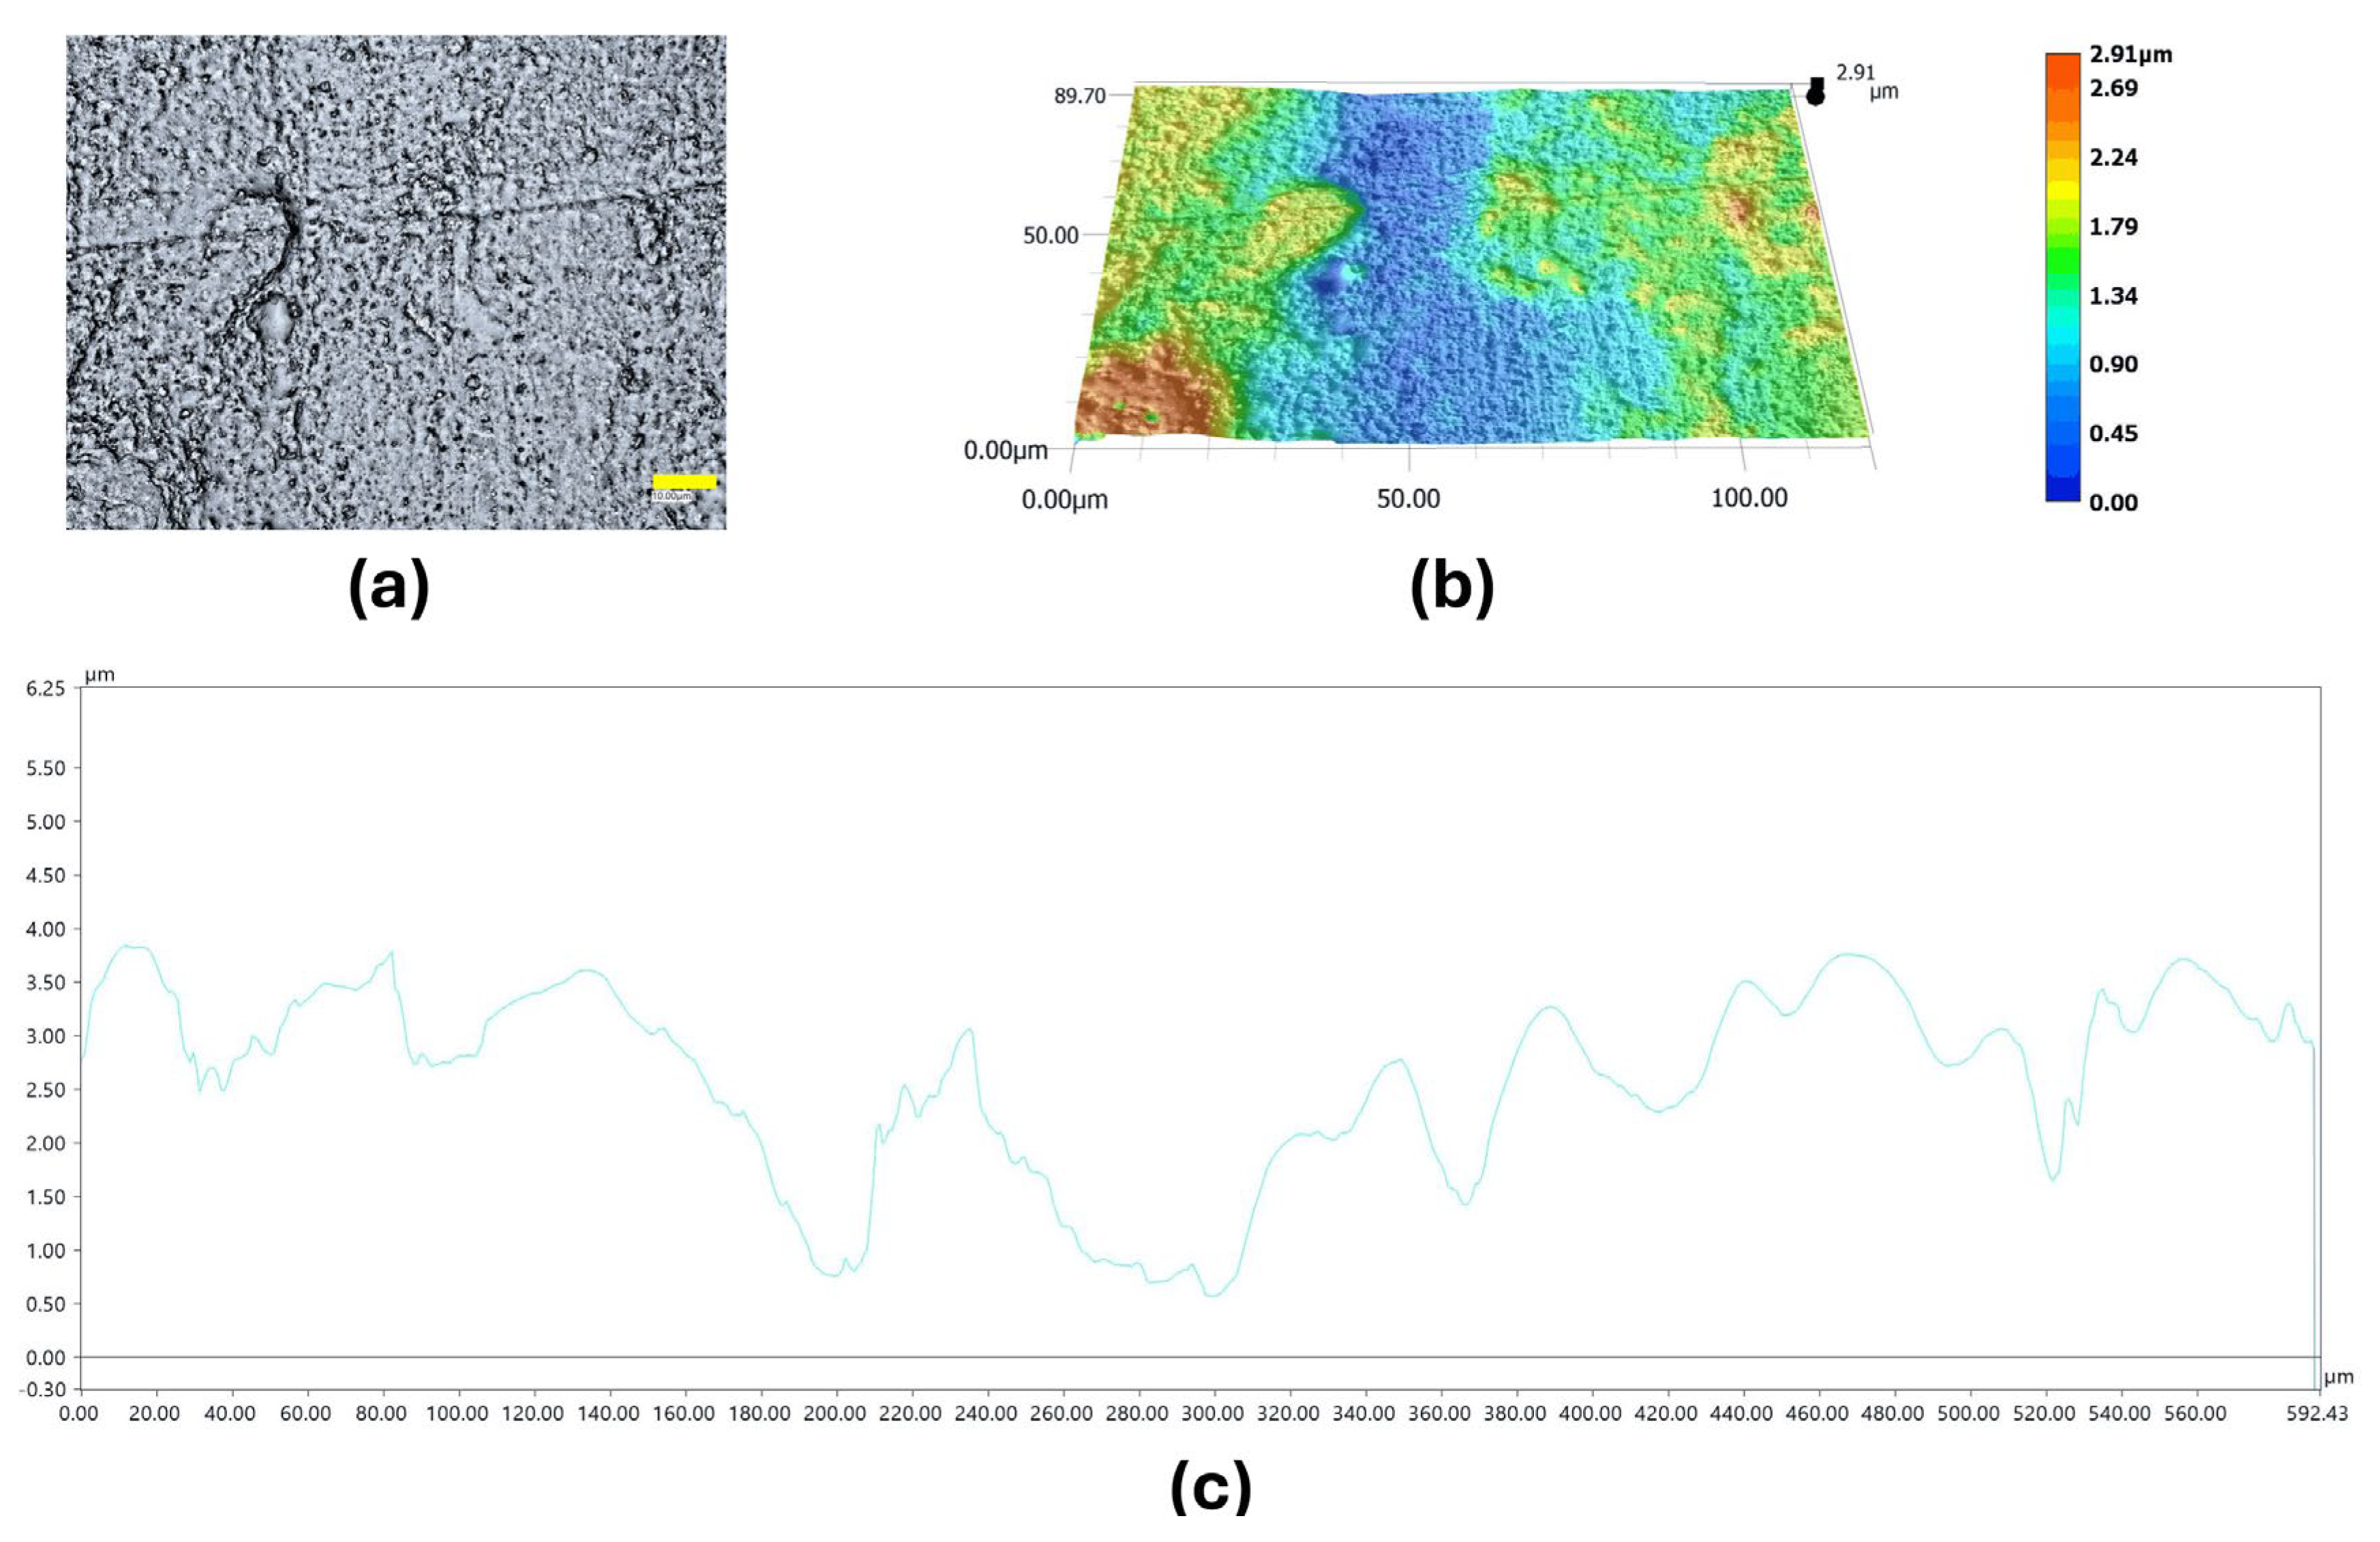
Figure 10.
Representative surface morphology and topography of 1%_ZnO NPs before activated sludge exposure: (a) surface image recorded at 2500× magnification, (b) 3D topographic reconstruction recorded at 500× magnification, and (c) corresponding surface height profile across the analyzed area. Scale bar = 10 μm.
Figure 10.
Representative surface morphology and topography of 1%_ZnO NPs before activated sludge exposure: (a) surface image recorded at 2500× magnification, (b) 3D topographic reconstruction recorded at 500× magnification, and (c) corresponding surface height profile across the analyzed area. Scale bar = 10 μm.
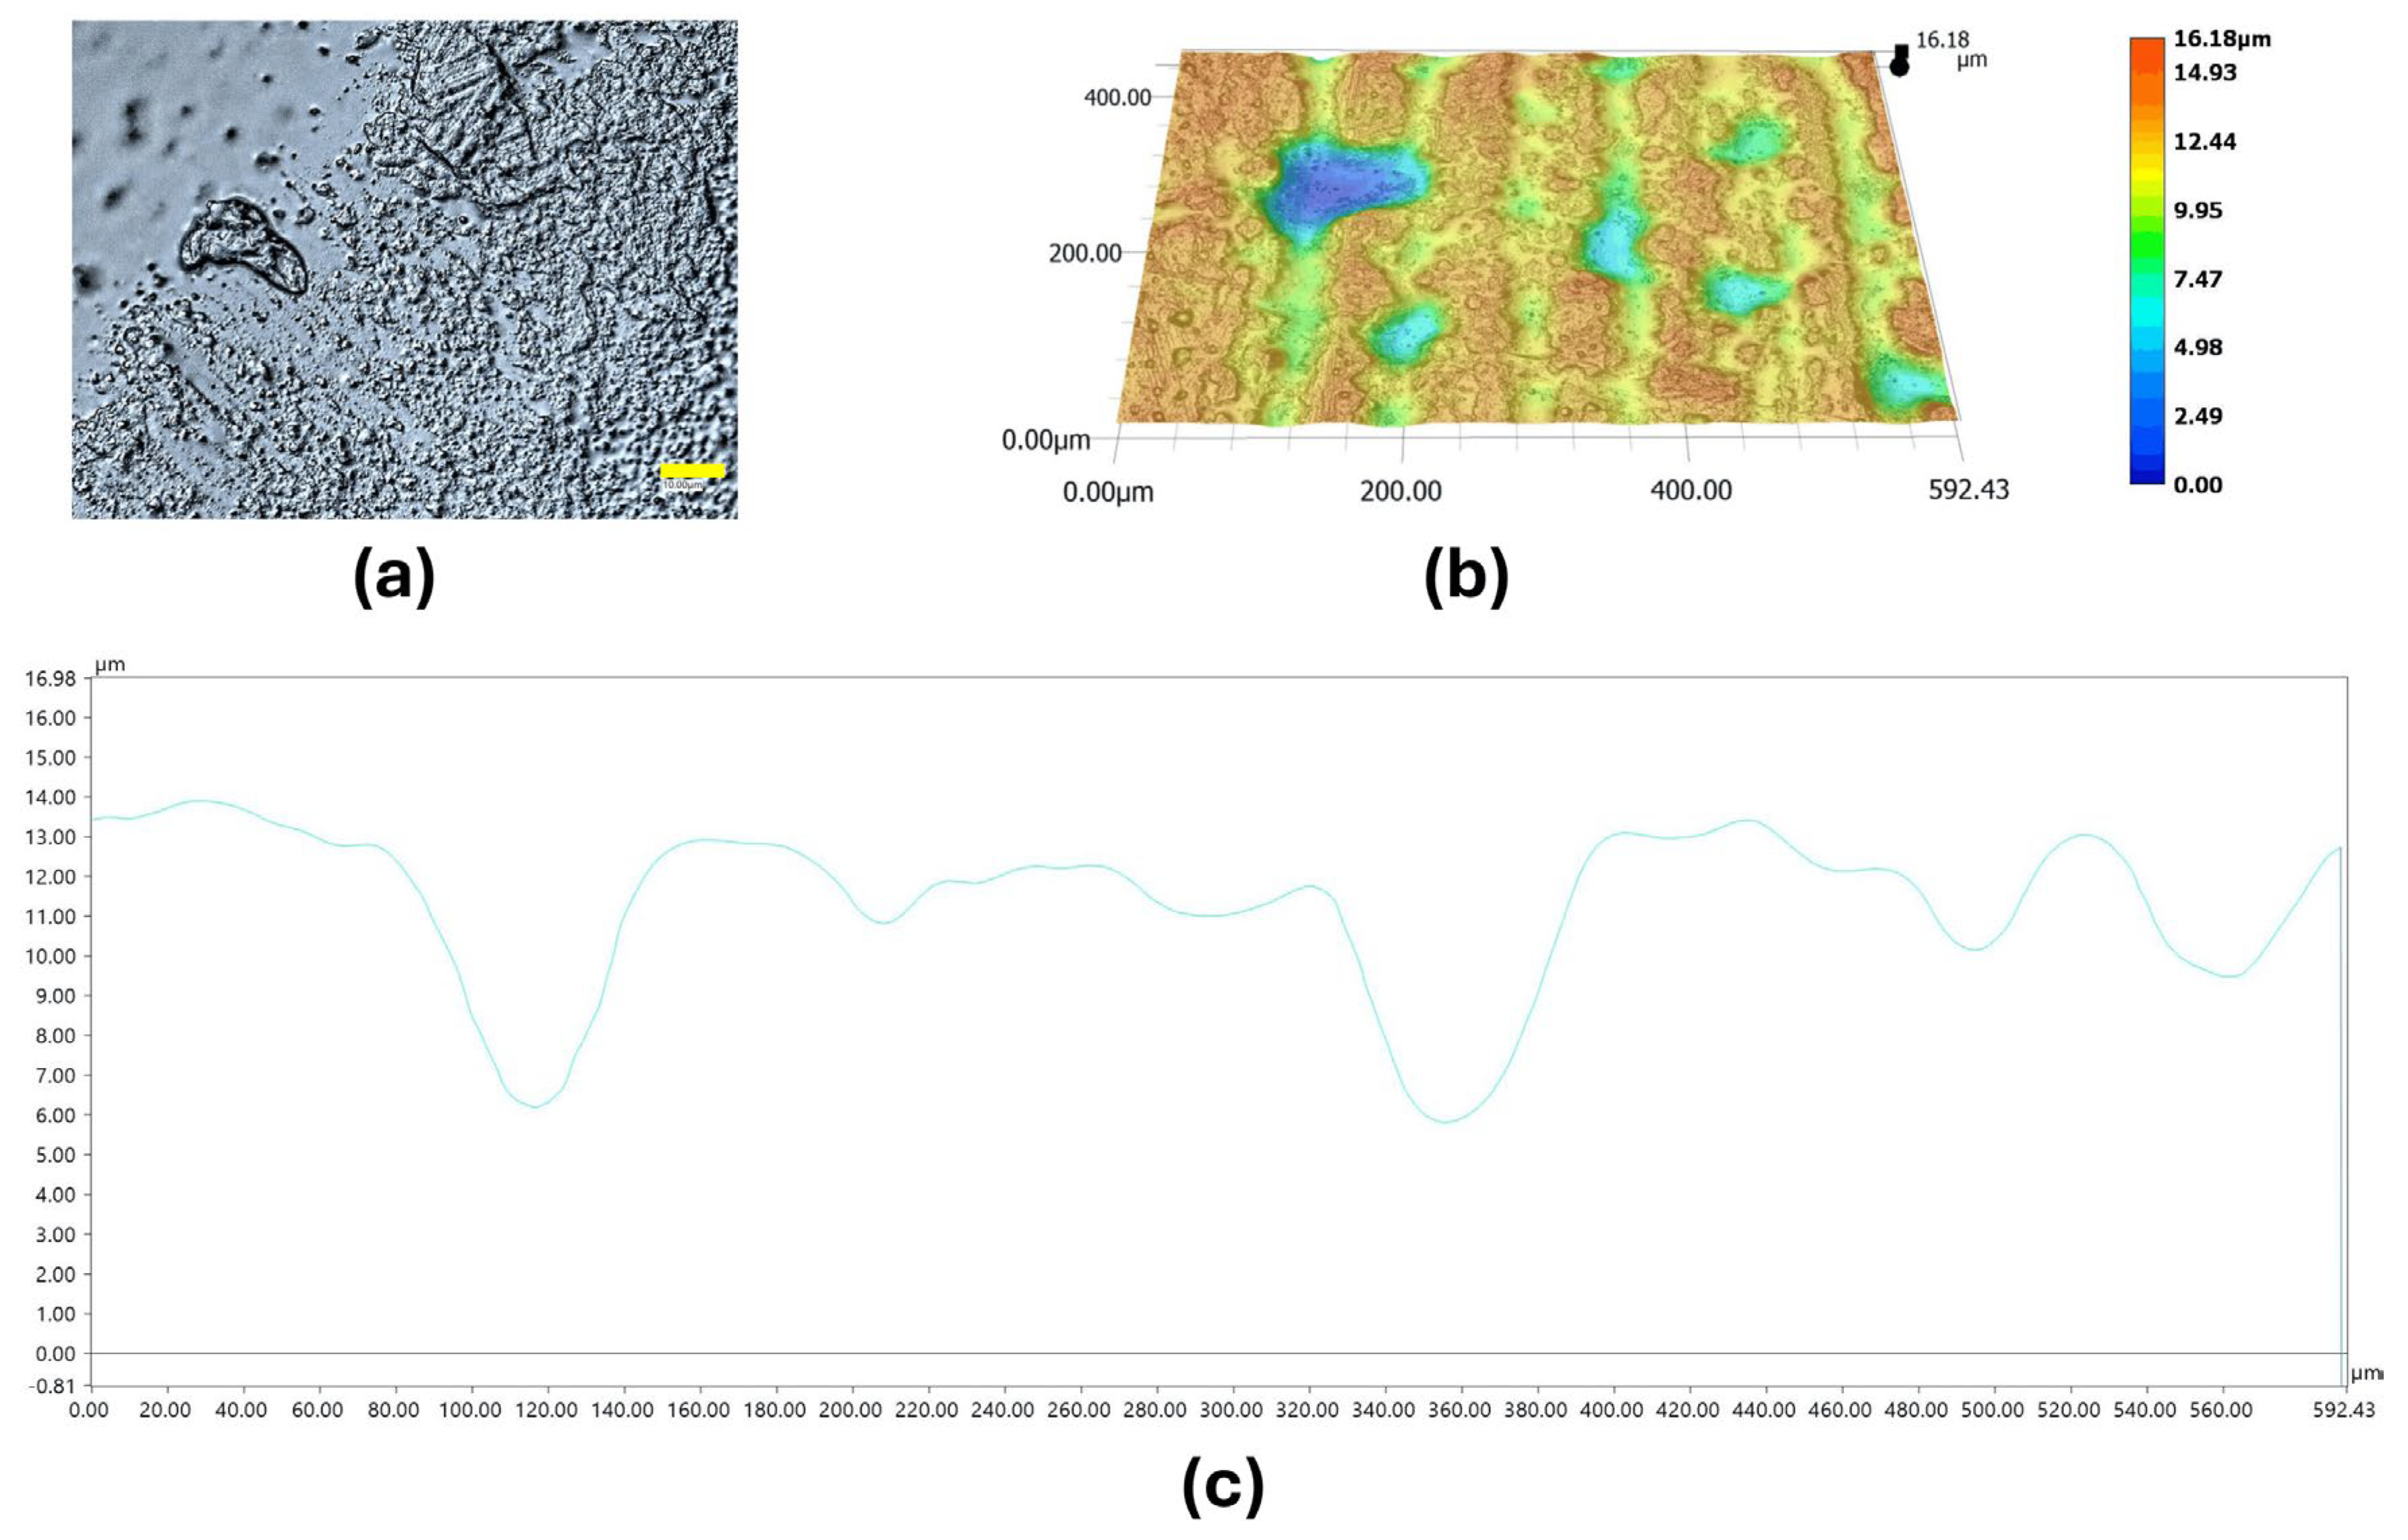
Figure 11.
SEM micrographs and EDS elemental maps of the cross-sections of UPR and ZnO NPs-modified UPR composite: (a) UPR and (b) 0.75%_ZnO NPs. Elemental distributions of C, O, Zn, and Au are shown. Magnification: 500×; scale bar: 50 µm.
Figure 11.
SEM micrographs and EDS elemental maps of the cross-sections of UPR and ZnO NPs-modified UPR composite: (a) UPR and (b) 0.75%_ZnO NPs. Elemental distributions of C, O, Zn, and Au are shown. Magnification: 500×; scale bar: 50 µm.
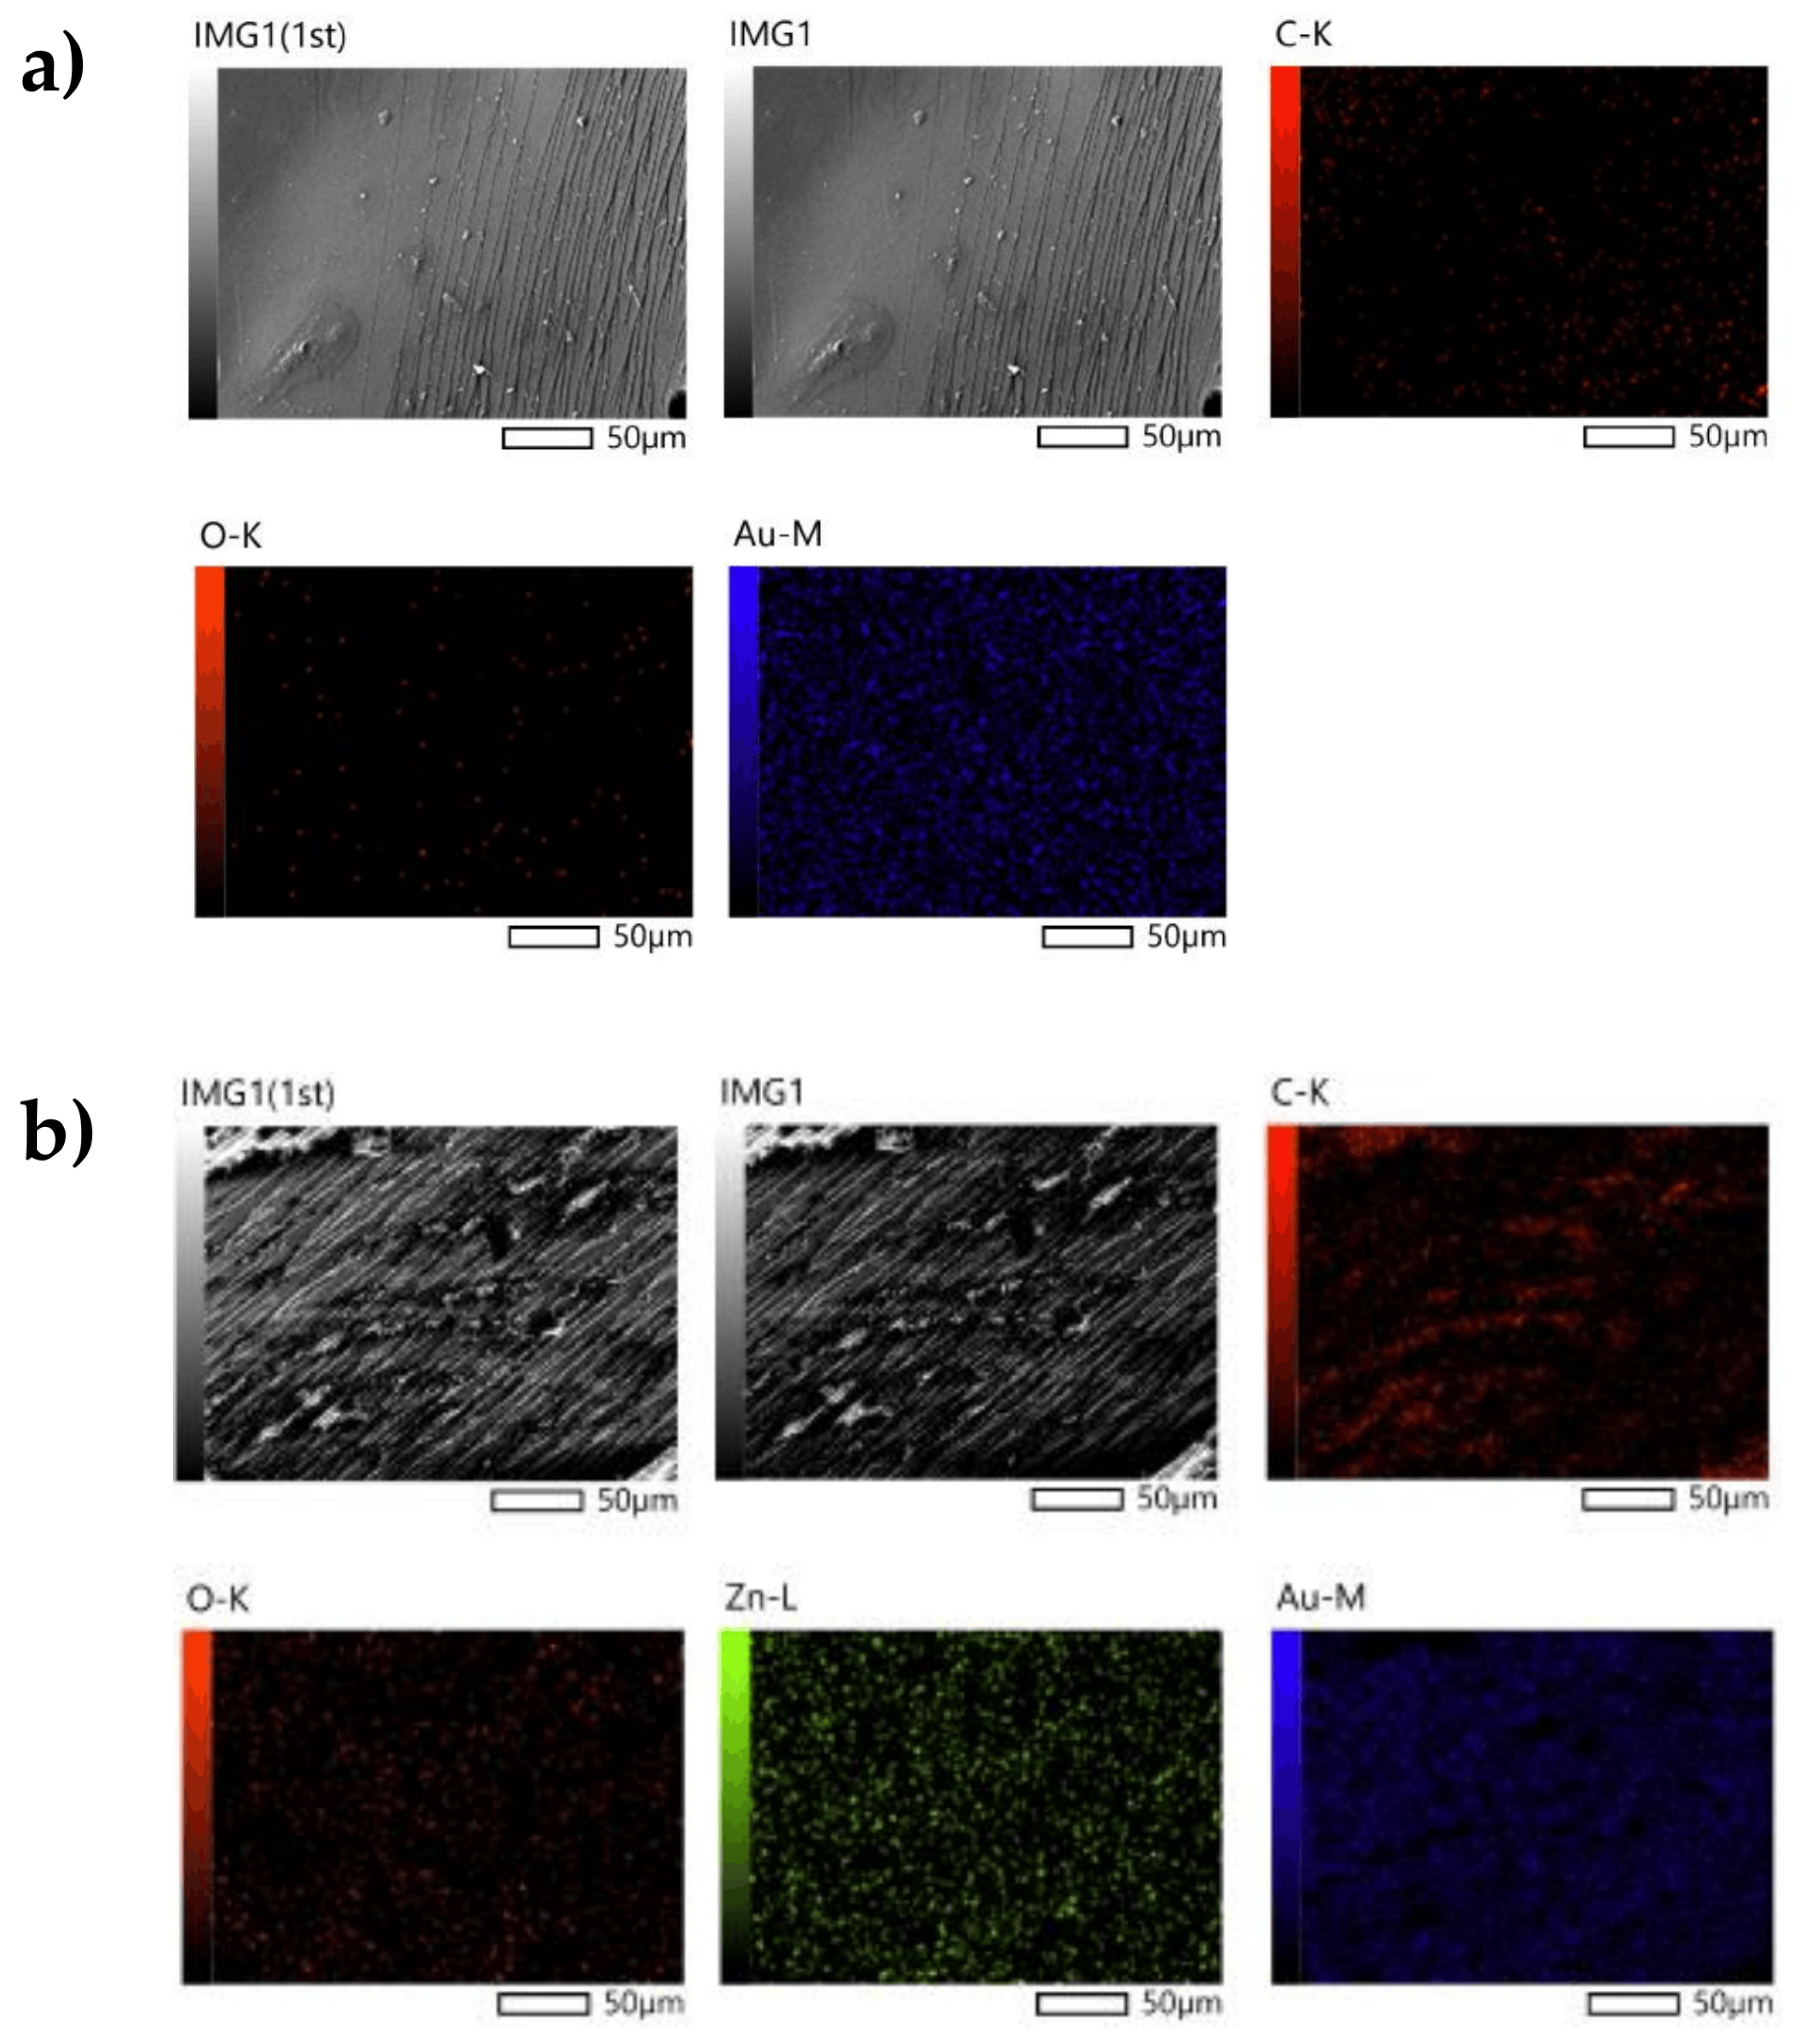
Figure 12.
SEM micrographs and EDS elemental maps of the surfaces of UPR and ZnO NPs-modified UPR composite: (a) UPR and (b) 0.75%_ZnO NPs. Elemental distributions of C, O, Zn, and Au are shown. Magnification: 500×; scale bar: 50 µm.
Figure 12.
SEM micrographs and EDS elemental maps of the surfaces of UPR and ZnO NPs-modified UPR composite: (a) UPR and (b) 0.75%_ZnO NPs. Elemental distributions of C, O, Zn, and Au are shown. Magnification: 500×; scale bar: 50 µm.
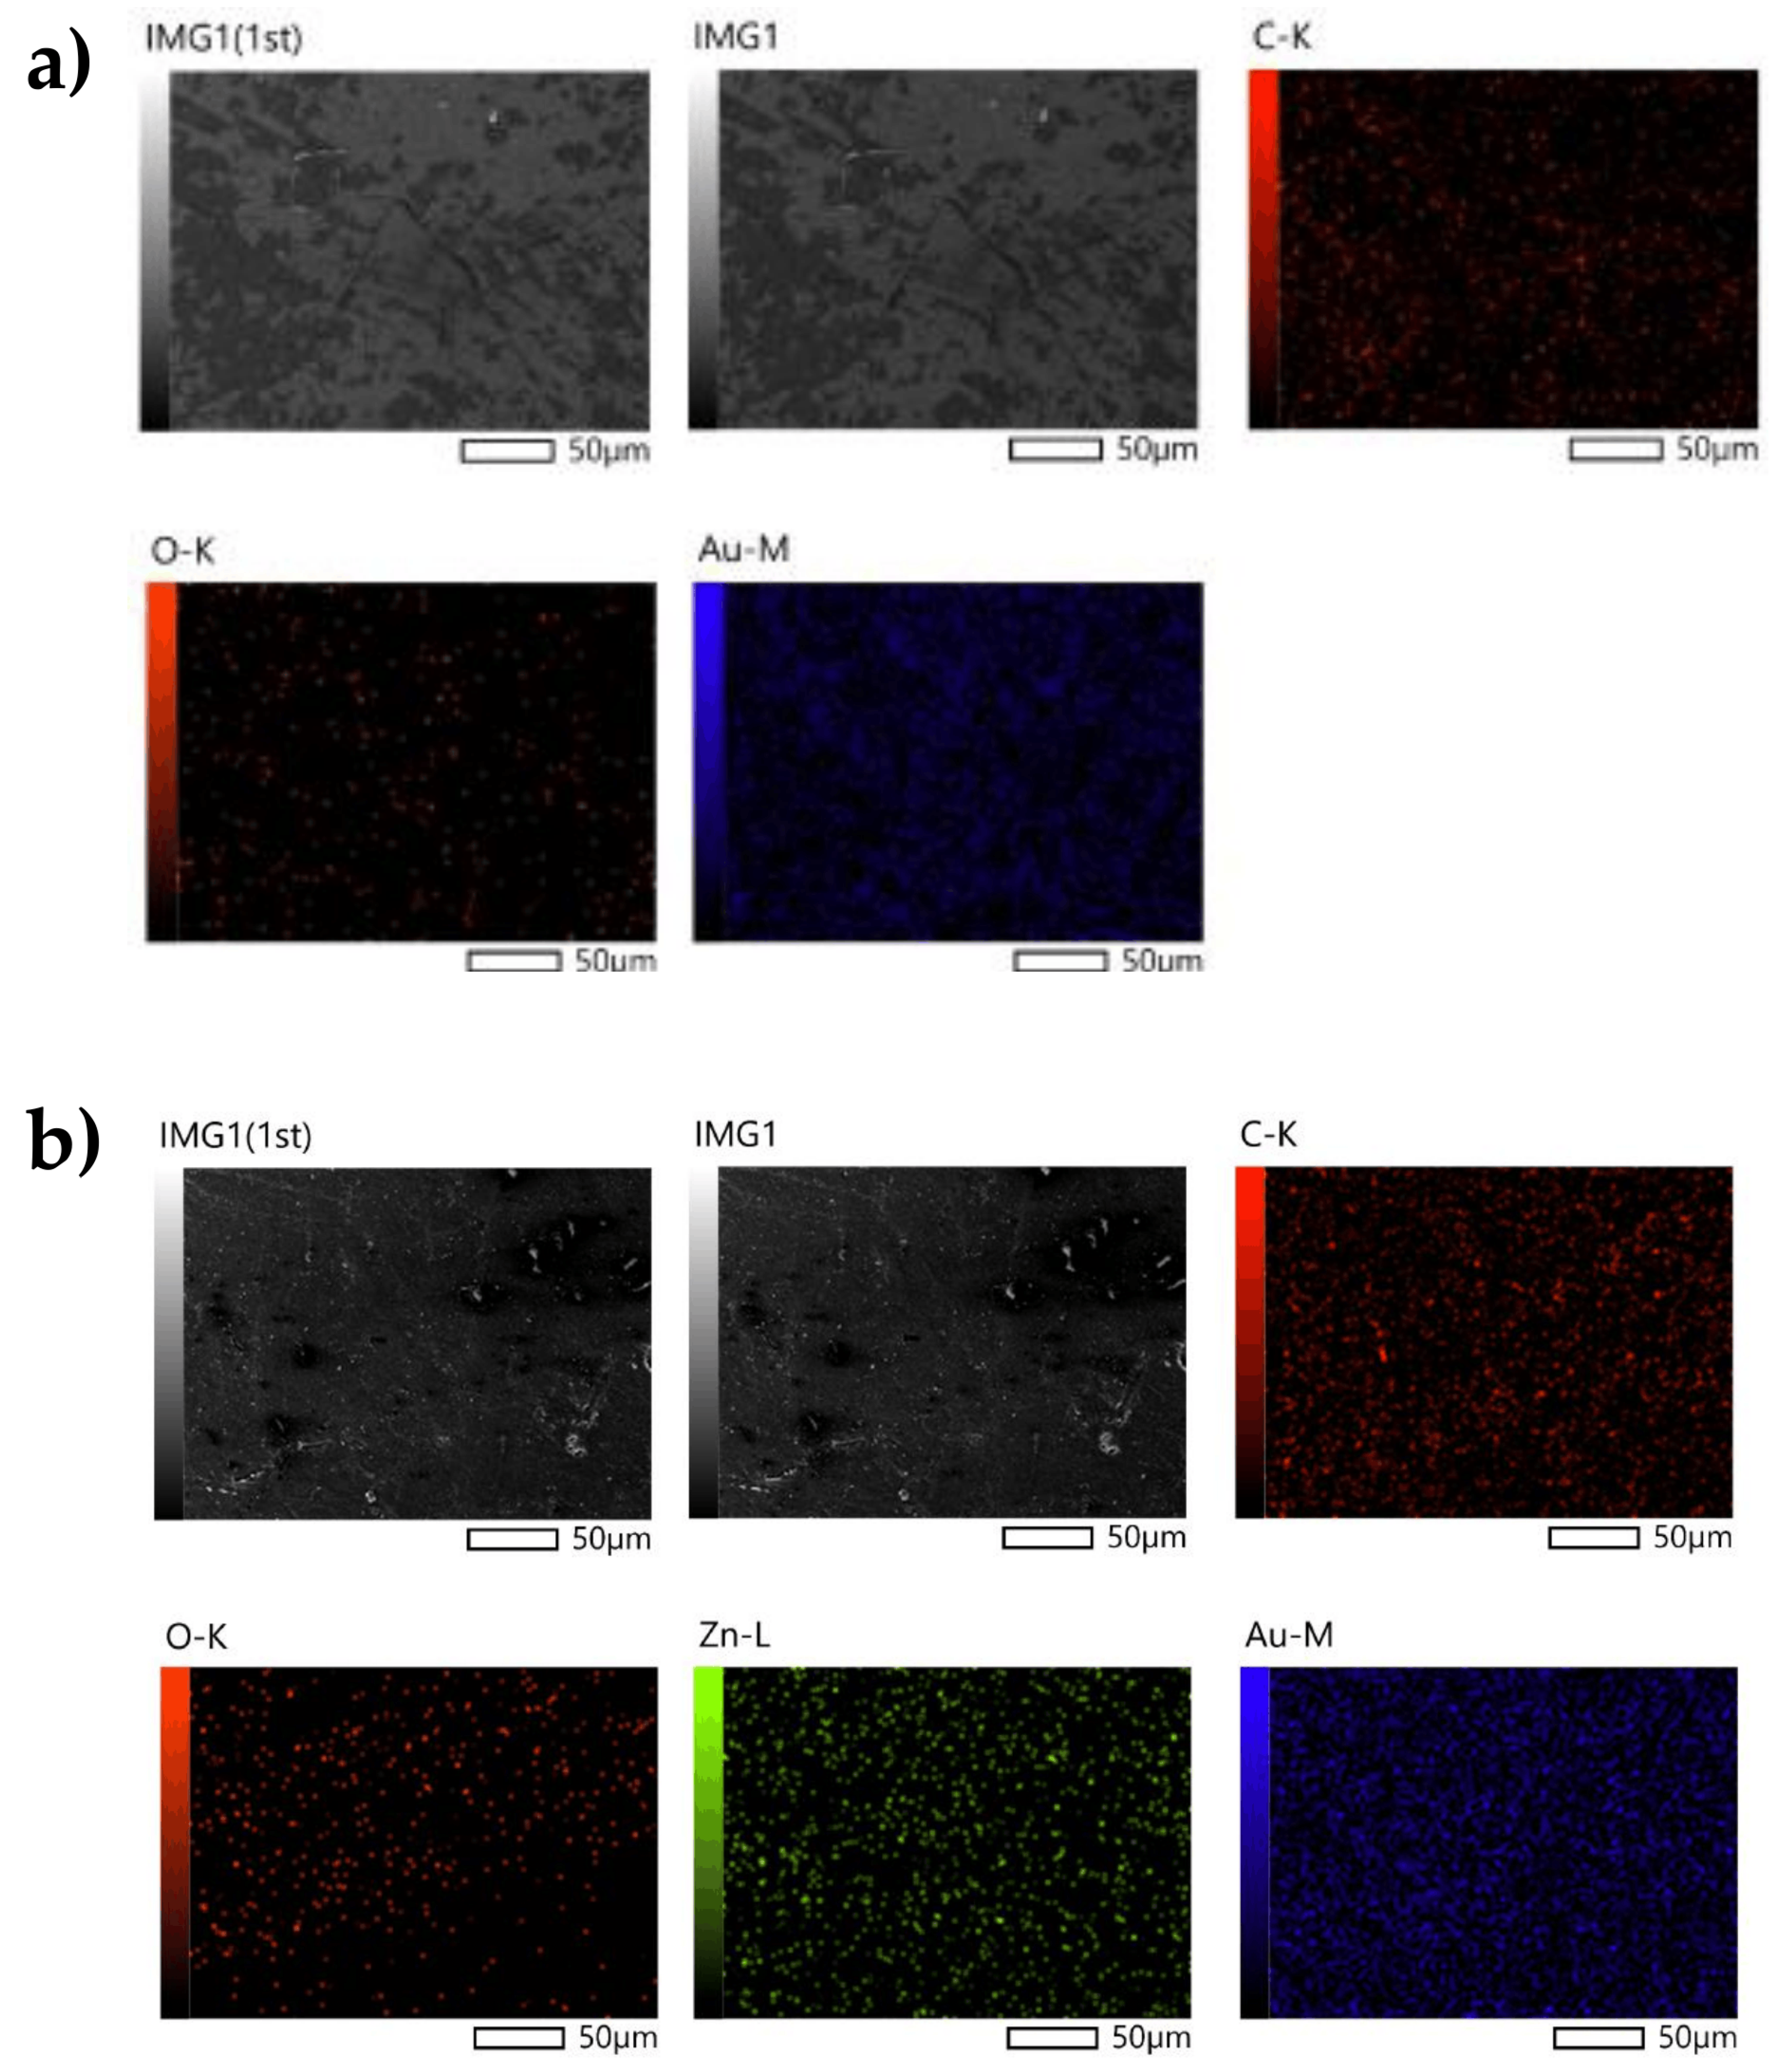
Figure 13.
Representative surface morphology and topography of UPR after activated sludge exposure: (a) surface image recorded at 2500× magnification, (b) 3D topographic reconstruction recorded at 500× magnification, and (c) corresponding surface height profile across the analyzed area. Scale bar = 10 μm.
Figure 13.
Representative surface morphology and topography of UPR after activated sludge exposure: (a) surface image recorded at 2500× magnification, (b) 3D topographic reconstruction recorded at 500× magnification, and (c) corresponding surface height profile across the analyzed area. Scale bar = 10 μm.
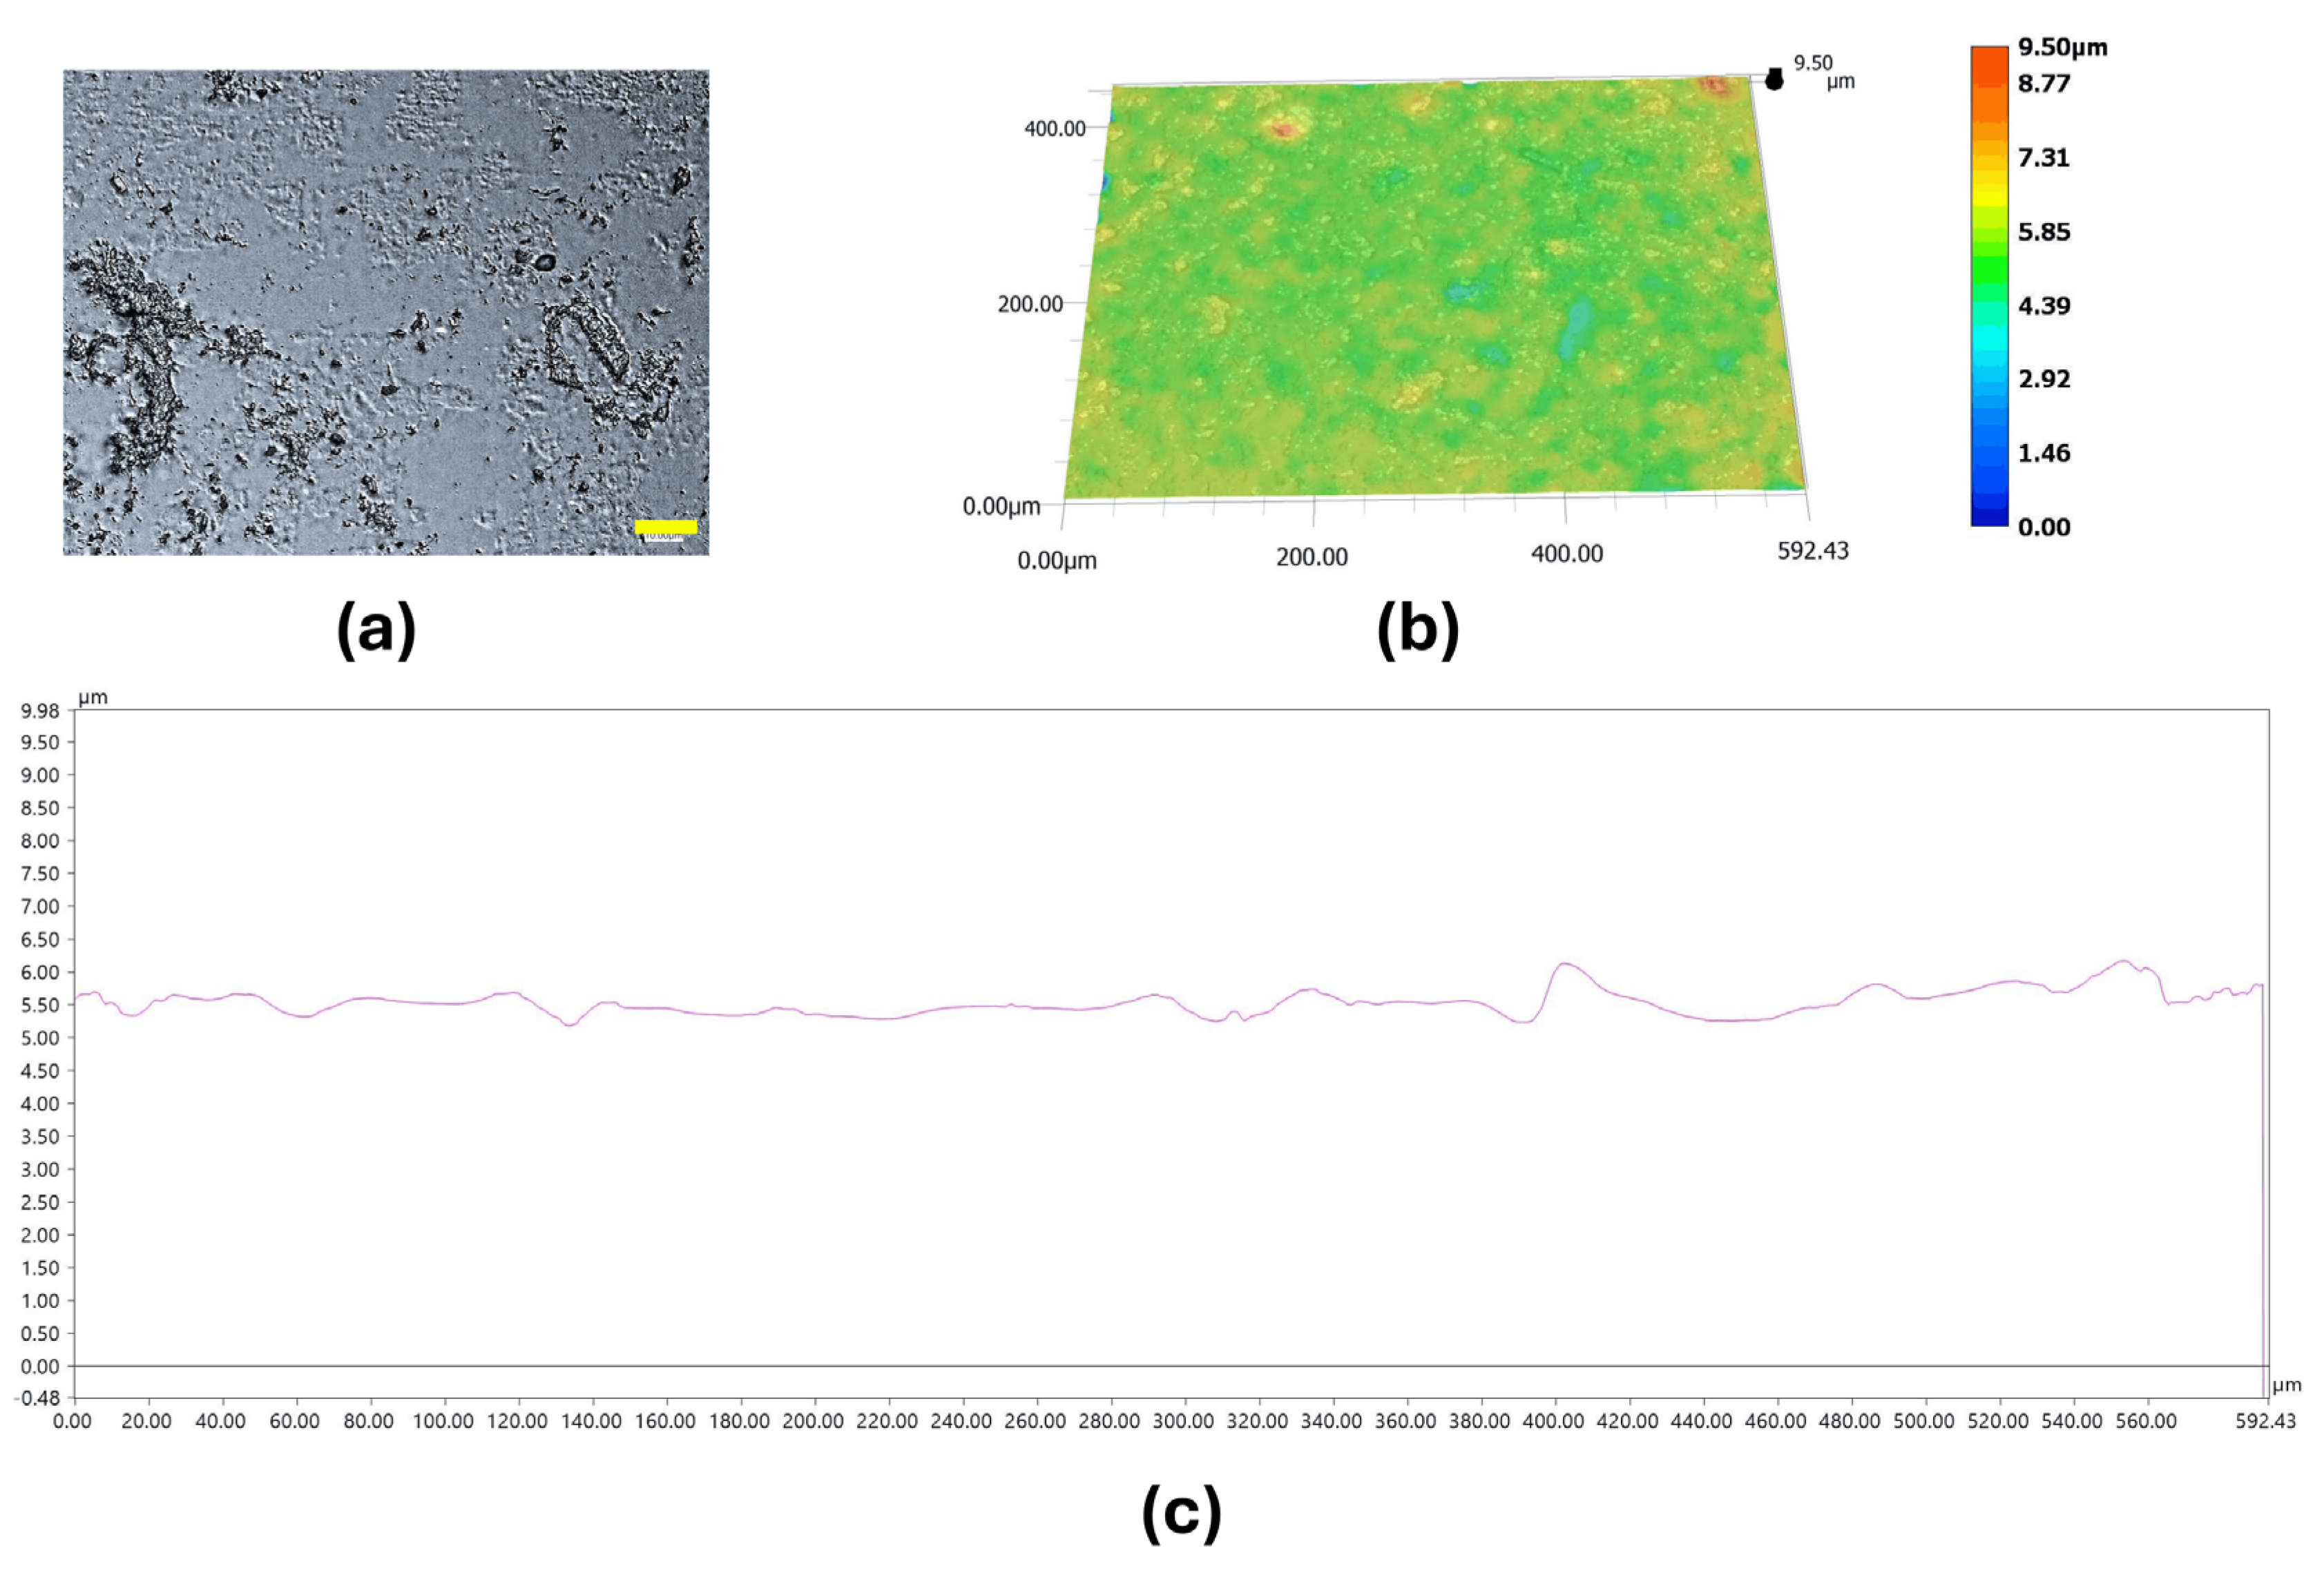
Figure 14.
Representative surface morphology and topography of 0.06%_ZnO NPs after activated sludge exposure: (a) surface image recorded at 2500× magnification, (b) 3D topographic reconstruction recorded at 500× magnification, and (c) corresponding surface height profile across the analyzed area. Scale bar = 10 μm.
Figure 14.
Representative surface morphology and topography of 0.06%_ZnO NPs after activated sludge exposure: (a) surface image recorded at 2500× magnification, (b) 3D topographic reconstruction recorded at 500× magnification, and (c) corresponding surface height profile across the analyzed area. Scale bar = 10 μm.
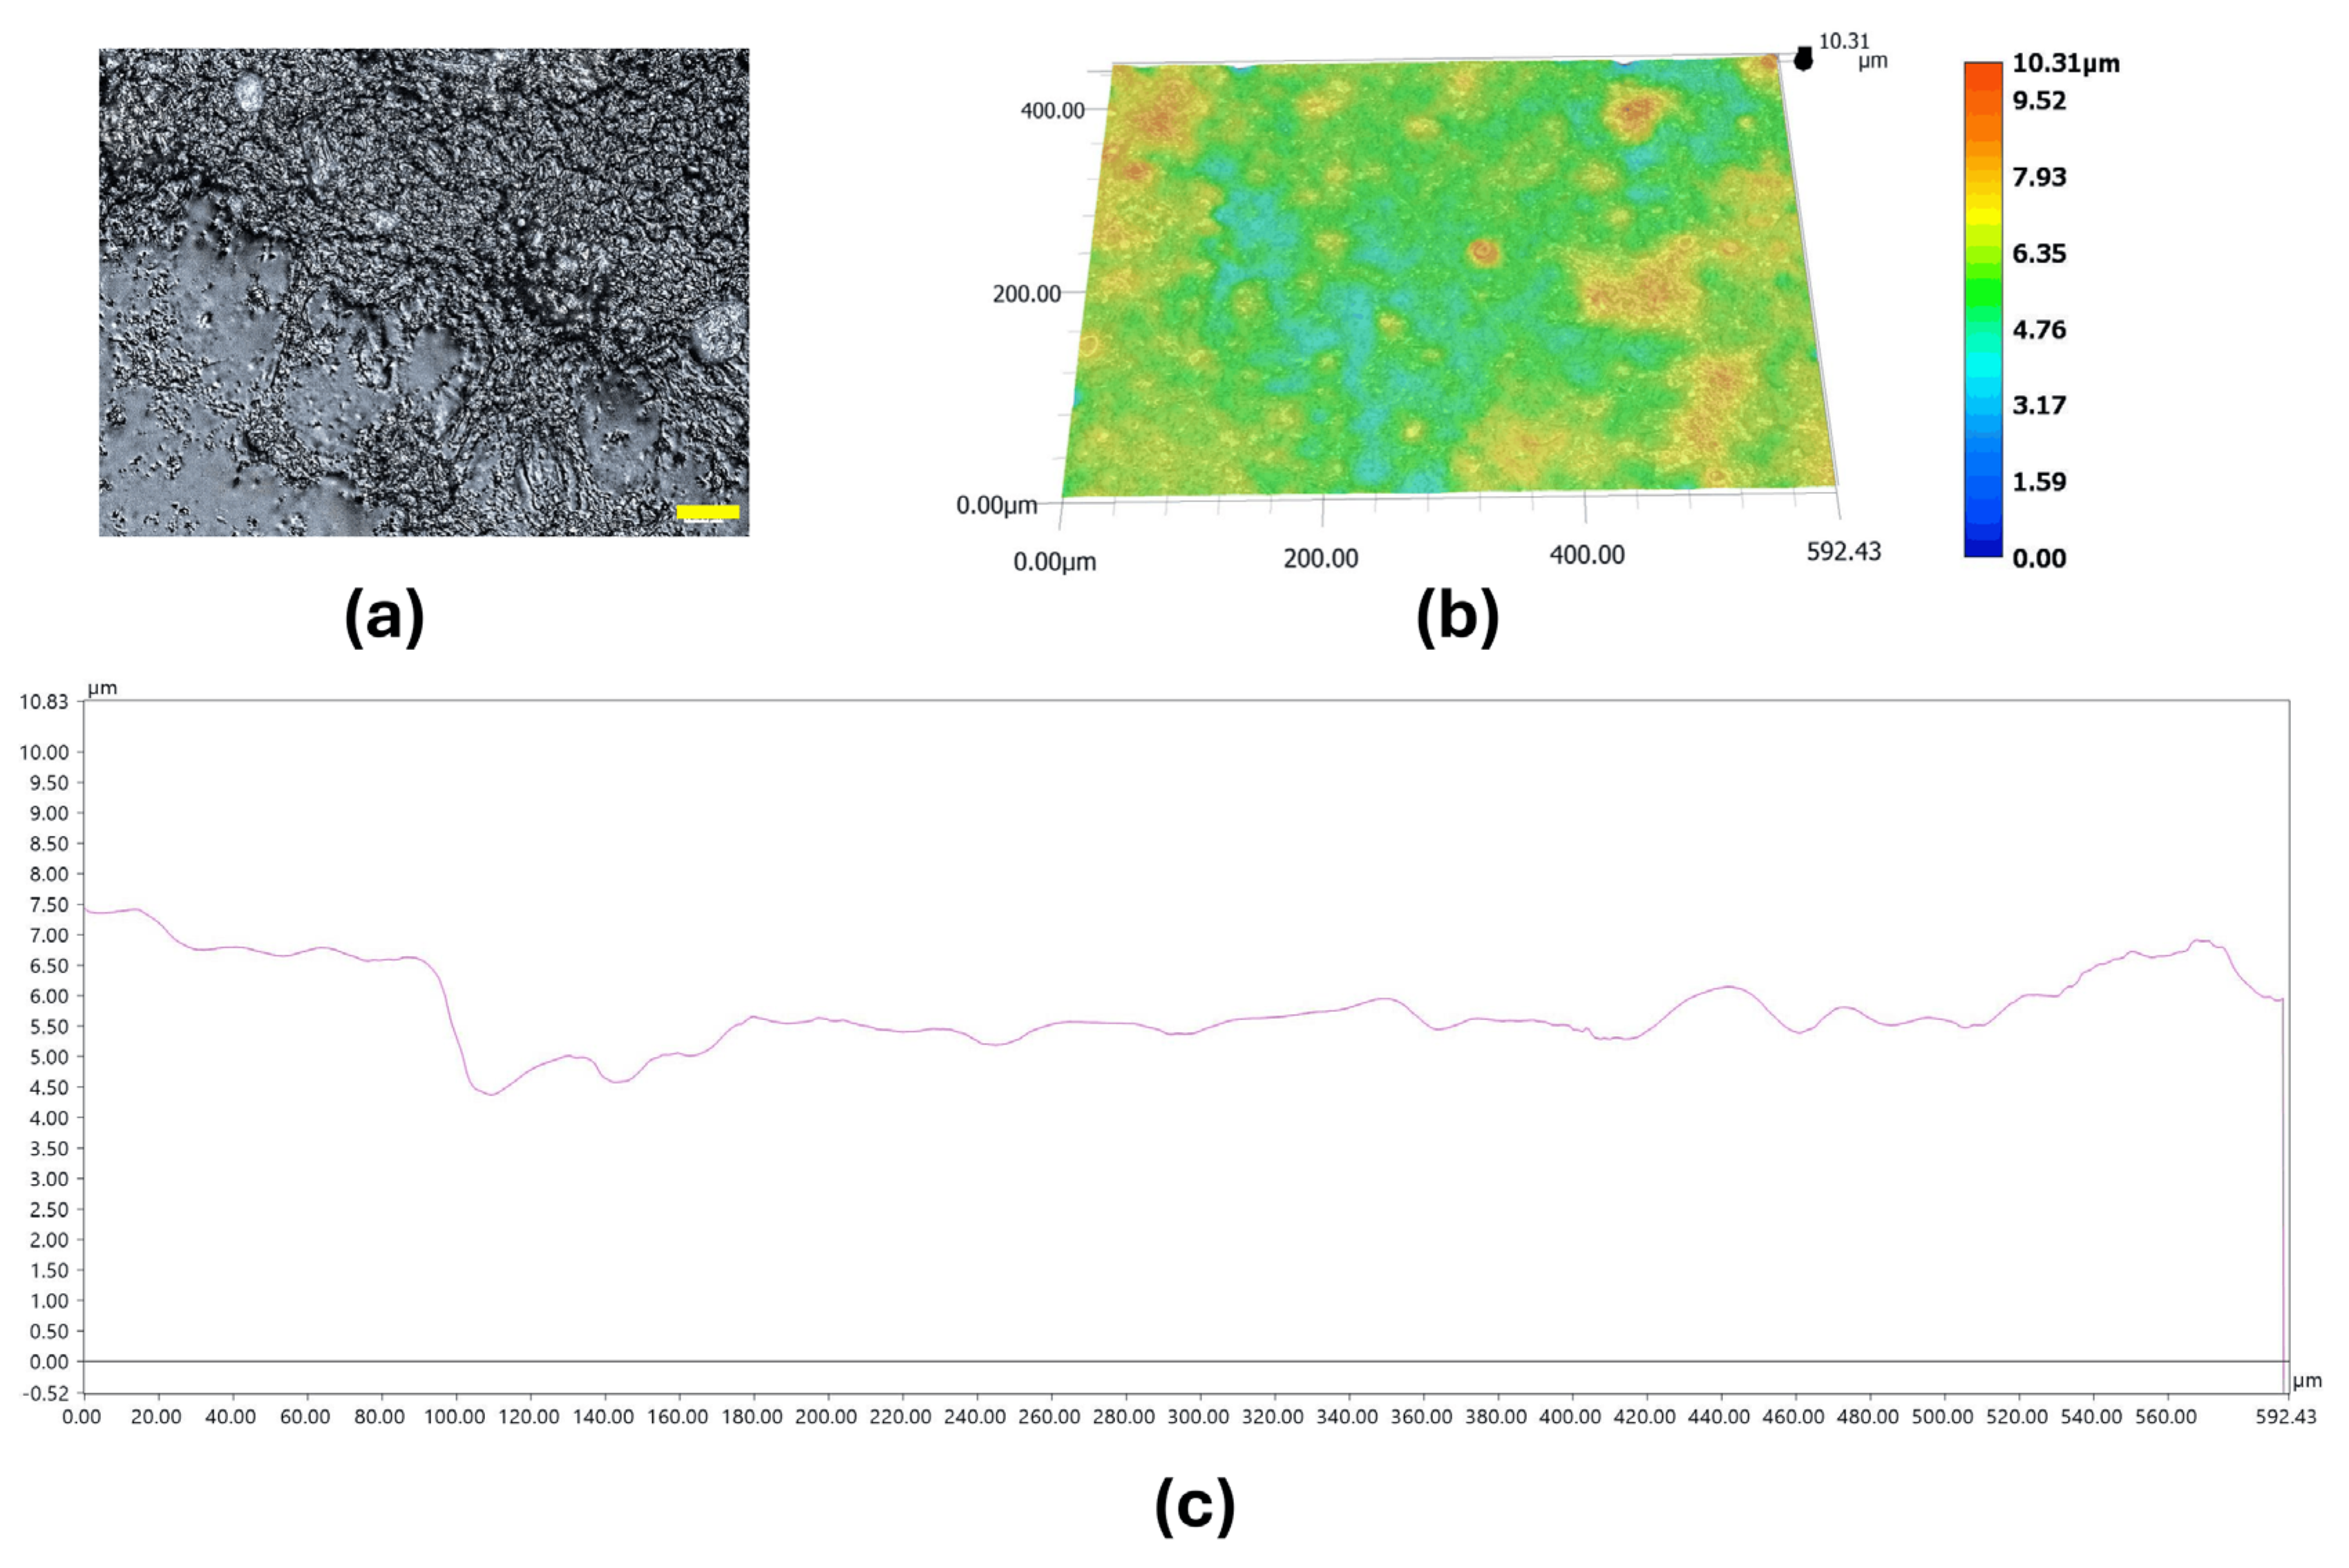
Figure 15.
Representative surface morphology and topography of 0.75%_ZnO NPs after activated sludge exposure: (a) surface image recorded at 2500× magnification, (b) 3D topographic reconstruction recorded at 500× magnification, and (c) corresponding surface height profile across the analyzed area. Scale bar = 10 μm.
Figure 15.
Representative surface morphology and topography of 0.75%_ZnO NPs after activated sludge exposure: (a) surface image recorded at 2500× magnification, (b) 3D topographic reconstruction recorded at 500× magnification, and (c) corresponding surface height profile across the analyzed area. Scale bar = 10 μm.
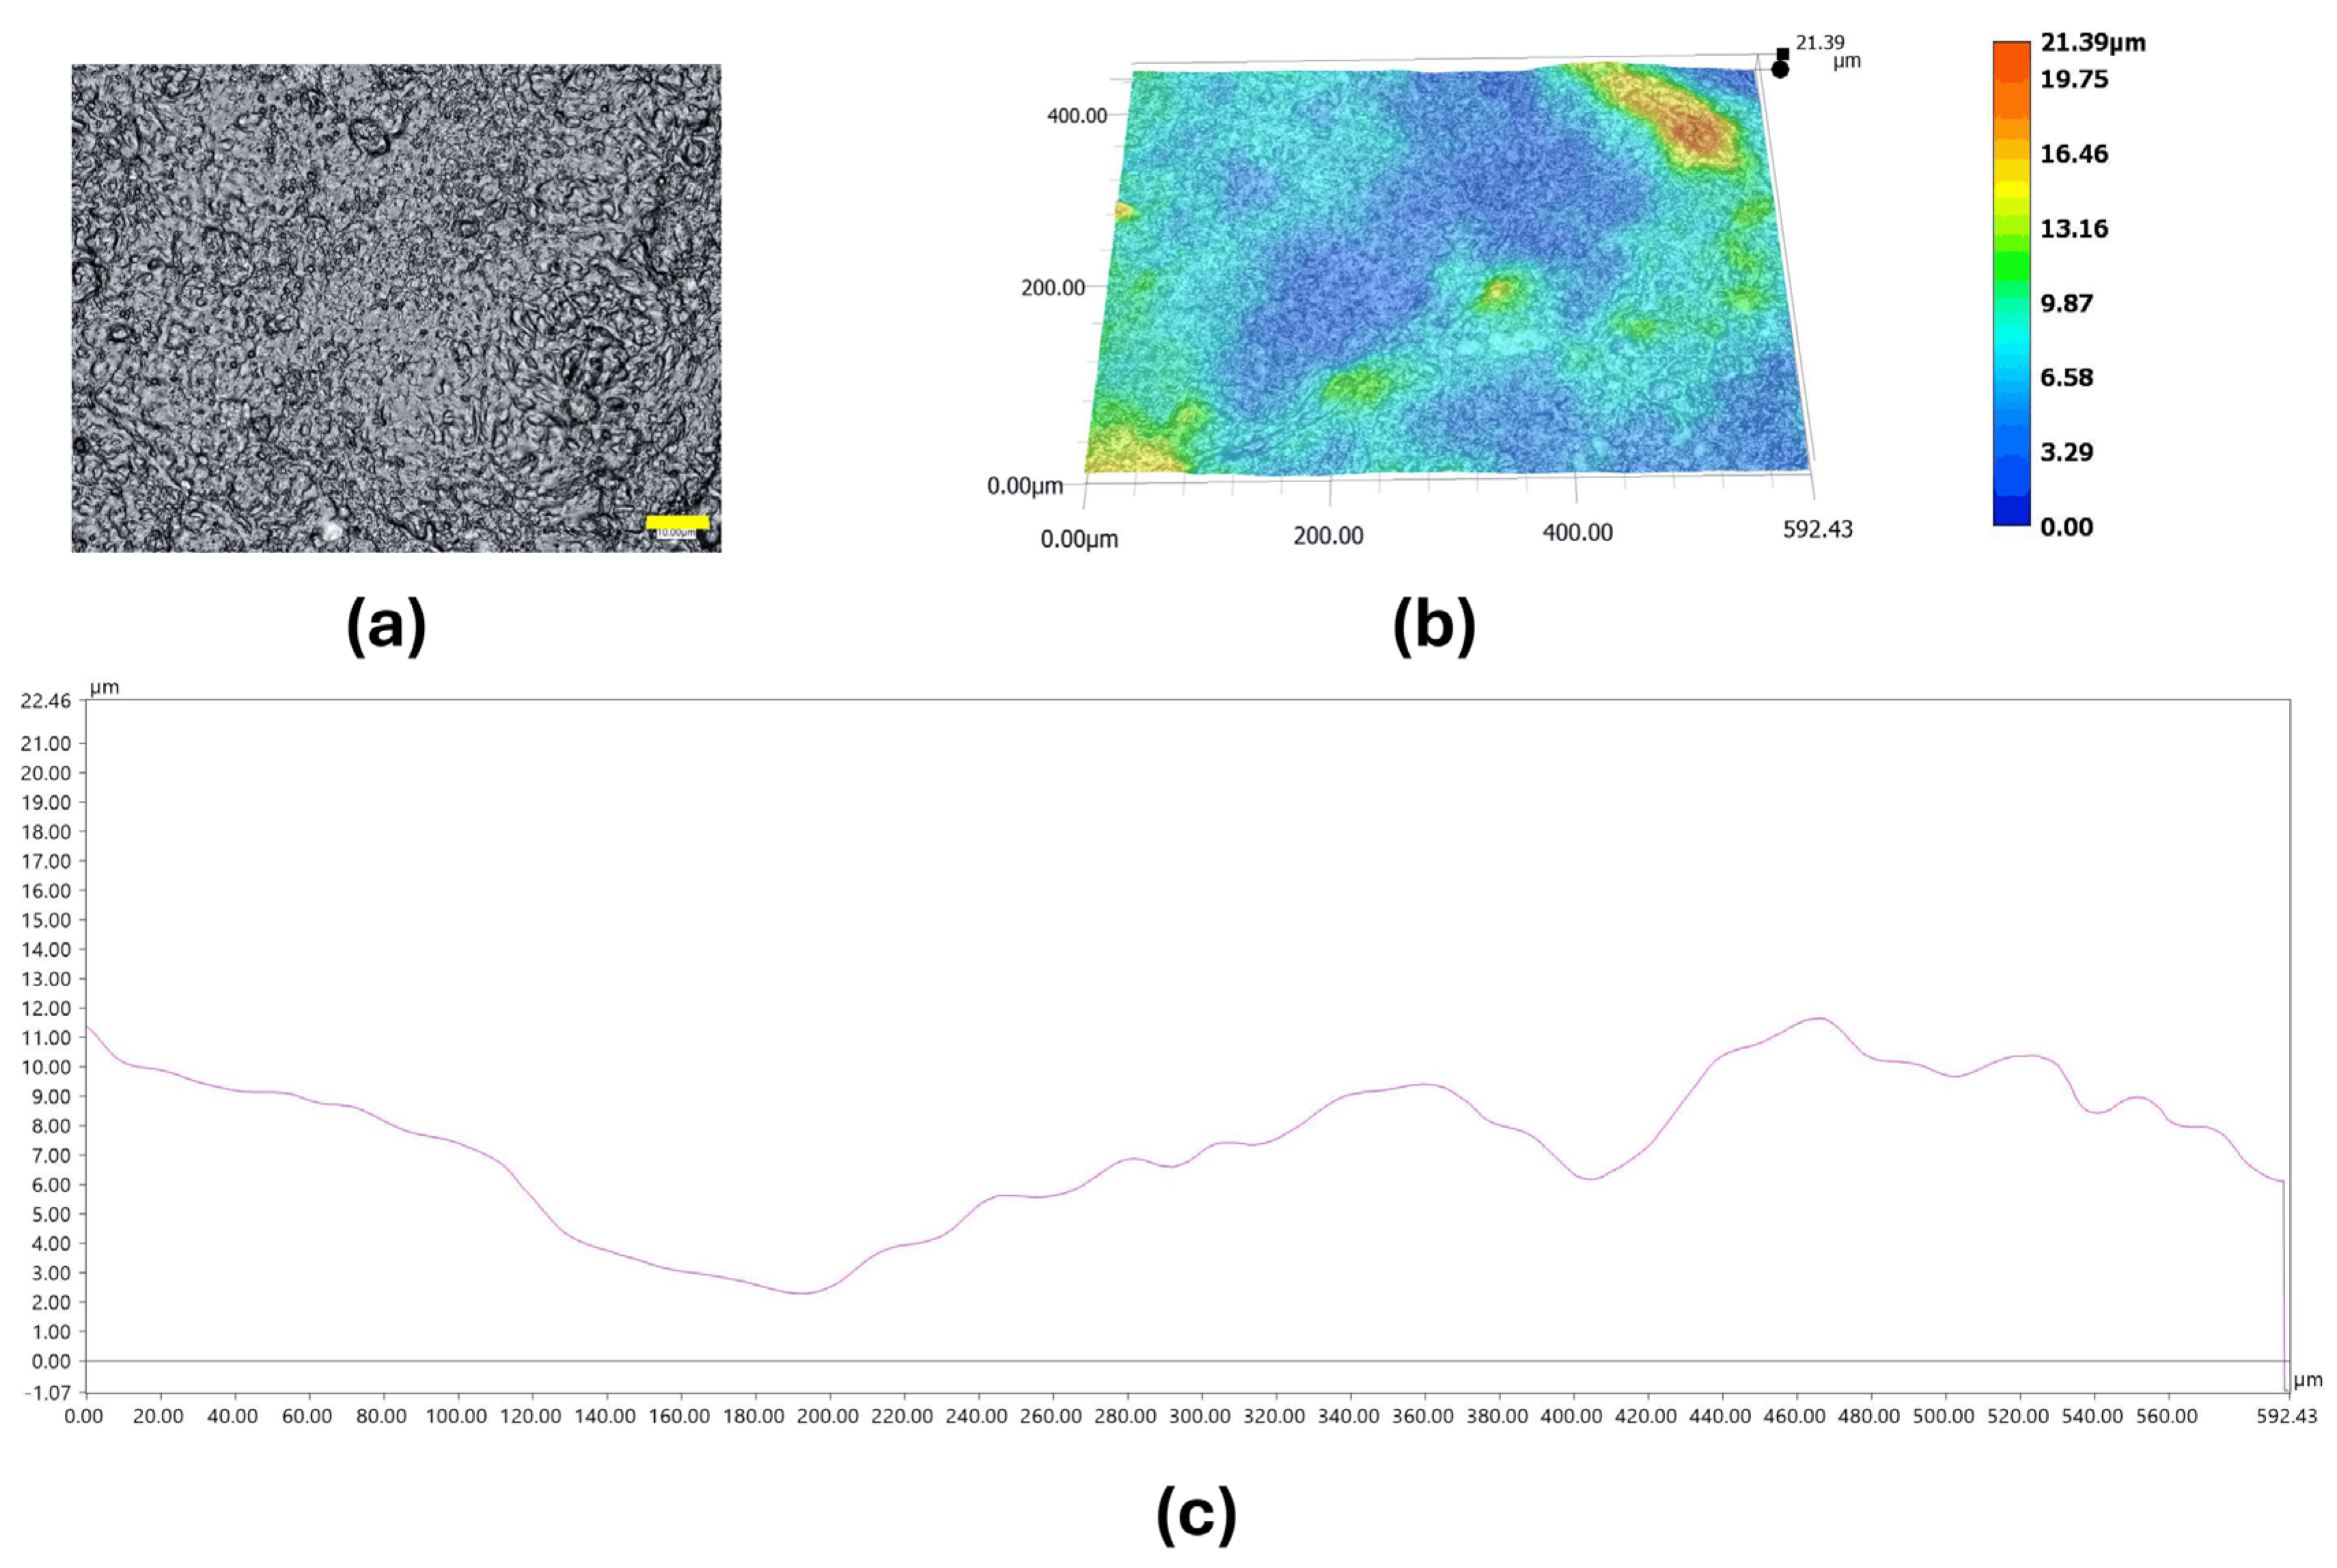
Figure 16.
Representative surface morphology and topography of 1%_ZnO NPs after activated sludge exposure: (a) surface image recorded at 2500× magnification, (b) 3D topographic reconstruction recorded at 500× magnification, and (c) corresponding surface height profile across the analyzed area. Scale bar = 10 μm.
Figure 16.
Representative surface morphology and topography of 1%_ZnO NPs after activated sludge exposure: (a) surface image recorded at 2500× magnification, (b) 3D topographic reconstruction recorded at 500× magnification, and (c) corresponding surface height profile across the analyzed area. Scale bar = 10 μm.
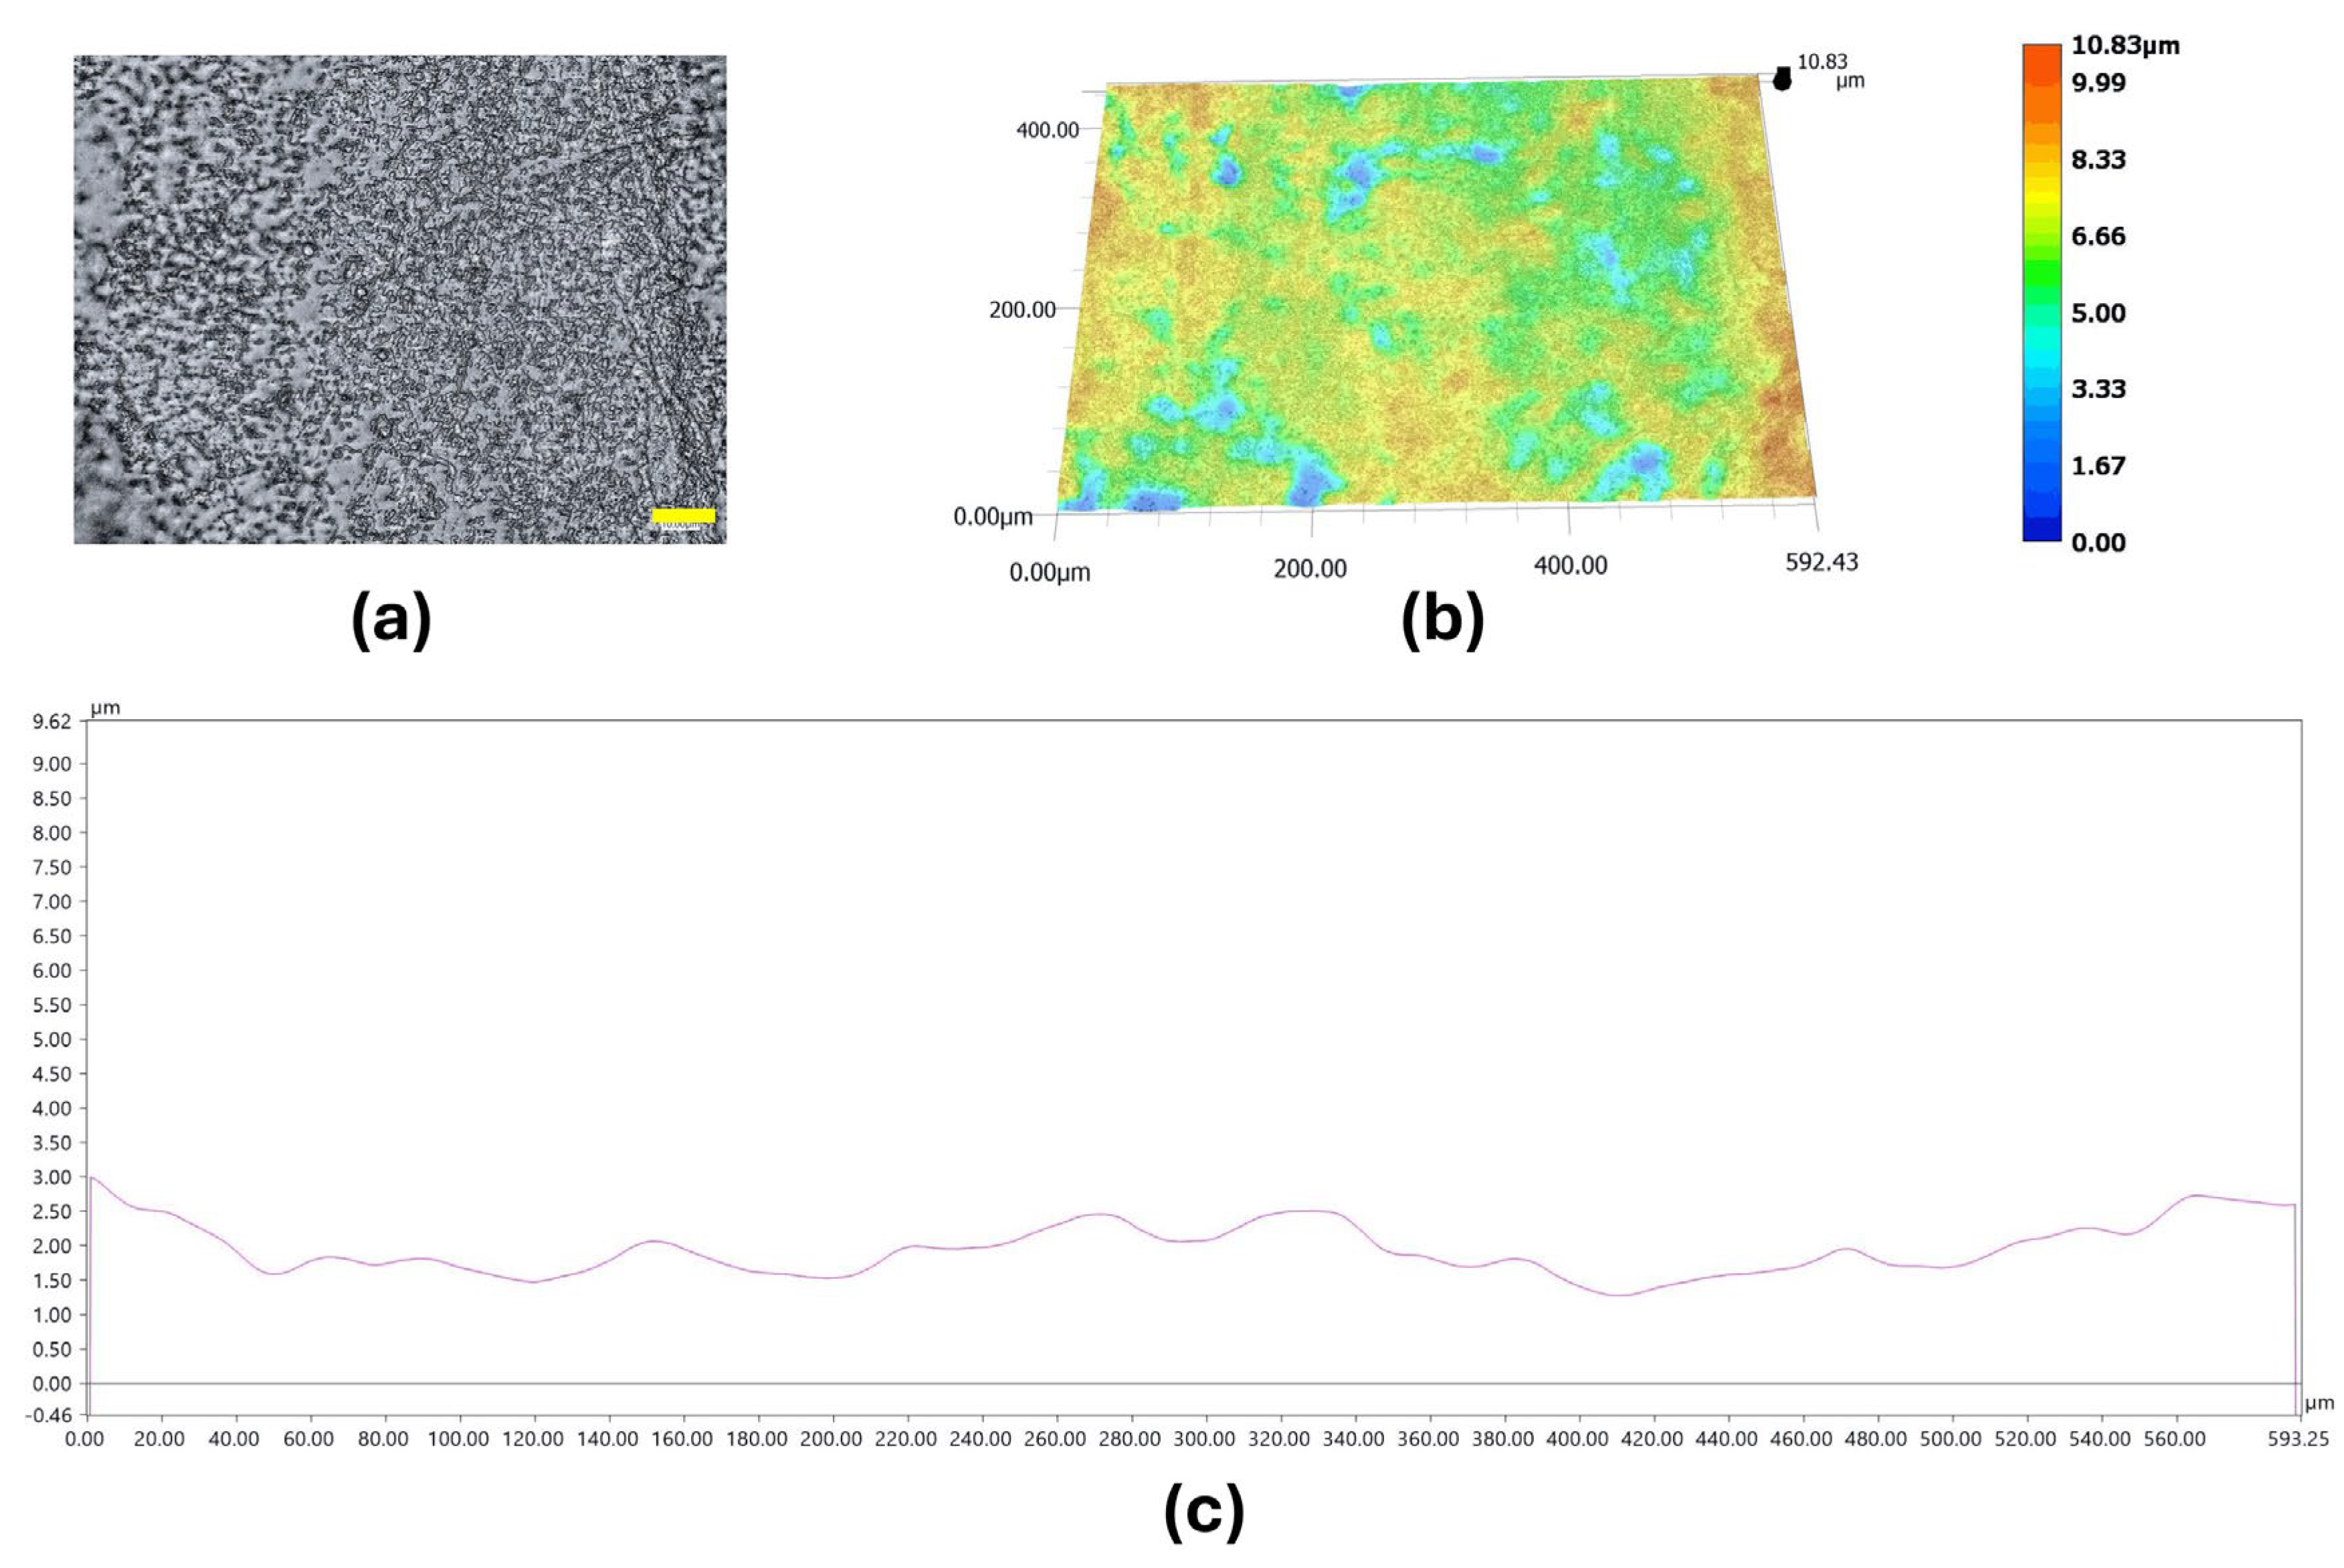

Table 1.
Selected physicochemical characteristics of the ZnO filler used in this study [29].
Table 1.
Selected physicochemical characteristics of the ZnO filler used in this study [29].
| Crystal structure | SBET [m2·g−1] | D10 [µm] | D50 [µm] | D90 [µm] | Mean equivalent size [µm] | Morphological characteristics |
|---|---|---|---|---|---|---|
| Hexagonal (wurtzite phase) | 10.547 | 0.638 ± 0.019 | 2.086 ± 0.072 | 11.475 ± 0.724 | 4.424 ± 0.229 |
Fine particles with relatively small and uniformly distributed agglomerates |
Table 2.
Formulation of ZnO NPs-containing nanocomposites and identification of samples selected for comprehensive characterisation.
Table 2.
Formulation of ZnO NPs-containing nanocomposites and identification of samples selected for comprehensive characterisation.
| Samples abbreviation | Unsaturated polyester resin [g] | 4% cobalt octoate solution [mL] | Methyl ethyl ketone peroxide [mL] | ZnO NPs [%wt.] | Full specifications |
|---|---|---|---|---|---|
| UPR | 300 | 0.75 | 6 | 0.00 | + |
| 0.02%_ZnO NPs | 300 | 0.75 | 6 | 0.02 | - |
| 0.04%_ZnO NPs | 300 | 0.75 | 6 | 0.04 | - |
| 0.06%_ZnO NPs | 300 | 0.75 | 6 | 0.06 | + |
| 0.08%_ZnO NPs | 300 | 0.75 | 6 | 0.08 | - |
| 0.1%_ZnO NPs | 300 | 0.75 | 6 | 0.10 | - |
| 0.25%_ZnO NPs | 300 | 0.75 | 6 | 0.25 | - |
| 0.5%_ZnO NPs | 300 | 0.75 | 6 | 0.50 | - |
| 0.75%_ZnO NPs | 300 | 0.75 | 6 | 0.75 | + |
| 1%_ZnO NPs | 300 | 0.75 | 6 | 1.00 | + |
Table 3.
Experimentally determined Zn concentrations in selected UPR/ZnO NPs composites and stoichiometrically calculated ZnO-equivalent contents compared with the nominal ZnO loadings.
Table 3.
Experimentally determined Zn concentrations in selected UPR/ZnO NPs composites and stoichiometrically calculated ZnO-equivalent contents compared with the nominal ZnO loadings.
| 0.1%_ZnO NPs | 0.5%_ZnO NPs | 1%_ZnO NPs | |
|---|---|---|---|
|
Concentration of Zn determined by ICP-MS [mg g–1] |
0.4028 ± 0.0161 | 1.9588 ± 0.0432 | 3.0171 ± 0.0744 |
| Theoretical Zn content [mg g–1] | 0.8034 | 4.0170 | 8.0340 |
|
Percentage of the theoretical value [%] |
50.1 | 48.8 | 37.6 |
| ZnO NPs-equivalent content calculated from ICP-MS-determined Zn [wt.%] | 0.050 | 0.244 | 0.376 |
Table 4.
A1645 /A1720 ratios for pristine UPR and UPR-based composites with different ZnO NPs contents.
Table 4.
A1645 /A1720 ratios for pristine UPR and UPR-based composites with different ZnO NPs contents.
| Sample abbreviations | A1645/A1720 | A982/A1720 |
|---|---|---|
| UPR | 0.494 | 0.674 |
| 0.02%_ZnO NPs | 0.527 | 0.820 |
| 0.04%_ZnO NPs | 0.479 | 0.683 |
| 0.06%_ZnO NPs | 0.494 | 0.674 |
| 0.08%_ZnO NPs | 0.459 | 0.871 |
| 0.1%_ZnO NPs | 0.402 | 0.877 |
| 0.25%_ZnO NPs | 0.522 | 0.652 |
| 0.5%_ZnO NPs | 0.291 | 0.796 |
| 0.75%_ZnO NPs | 0.292 | 0.219 |
| 1%_ZnO NPs | 0.292 | 0.219 |
Table 5.
Vickers hardness of pristine UPR and composites modified with various concentrations of ZnO NPs.
Table 5.
Vickers hardness of pristine UPR and composites modified with various concentrations of ZnO NPs.
| Sample abbreviations | Vickers hardness (HV 0.5) |
|---|---|
| UPR | 154 |
| 0.02%_ZnO NPs | 124 |
| 0.04%_ZnO NPs | 117 |
| 0.06%_ZnO NPs | 123 |
| 0.08%_ZnO NPs | 131 |
| 0.1%_ZnO NPs | 110 |
| 0.25%_ZnO NPs | 132 |
| 0.5%_ZnO NPs | 101 |
| 0.75%_ZnO NPs | 119 |
| 1%_ZnO NPs | 110 |
Table 6.
Mechanical properties of UPR and ZnO nanoparticle-modified UPR composites determined by tensile and flexural tests. Data are presented as mean ± standard error (SE). Statistical significance was assessed relative to neat UPR: *p < 0.05, **p < 0.01, ***p < 0.001.
Table 6.
Mechanical properties of UPR and ZnO nanoparticle-modified UPR composites determined by tensile and flexural tests. Data are presented as mean ± standard error (SE). Statistical significance was assessed relative to neat UPR: *p < 0.05, **p < 0.01, ***p < 0.001.
| Sample abbreviations | Young’s modulus [MPa] | Tensile strength [MPa] | Flexural modulus [MPa] | Flexural strength [MPa] |
|---|---|---|---|---|
| UPR | 3269.12 ± 121.30 | 46.56 ± 1.45 | 2543.10 ± 178.74 | 82.50 ± 5.08 |
| 0.02%_ZnO NPs | 1526.80 ± 160.15*** | 38.20 ± 3.99 | 2354.47 ± 354.71 | 68.17 ± 5.72 |
| 0.04%_ZnO NPs | 1473.50 ± 100.44*** | 36.75 ± 2.43* | 2528.19 ± 217.39 | 68.69 ± 3.05* |
| 0.06%_ZnO NPs | 1676.60 ± 82.74*** | 41.20 ± 2.08 | 2243.20 ± 141.33 | 64.69 ± 2.88* |
| 0.08%_ZnO NPs | 1786.25 ± 143.98*** | 44.50 ± 3.66 | 2238.00 ± 88.31 | 66.91 ± 2.40* |
| 0.1%_ZnO NPs | 1791.25 ± 17.94*** | 46.63 ± 0.38 | 3334.83 ± 124.94** | 85.56 ± 1.30 |
| 0.25%_ZnO NPs | 1846.25 ± 42.36*** | 46.00 ± 0.91 | 2503.42 ± 180.17 | 72.23 ± 2.33 |
| 0.5%_ZnO NPs | 1519.50 ± 106.89*** | 38.00 ± 2.74 | 2528.40 ± 217.56 | 68.71 ± 3.05* |
| 0.75%_ZnO NPs | 1165.50 ± 219.53*** | 29.00 ± 5.48* | 2673.48 ± 222.14 | 77.35 ± 5.54 |
| 1%_ZnO NPs | 1730.40 ± 59.42*** | 35.00 ± 4.57 | 1673.40 ± 66.46** | 58.05 ± 2.03** |
Table 7.
Thermogravimetric parameters of neat UPR and nanocomposites, including the temperature at 5% mass loss (Td,5%), maximum degradation temperatures (Tmax,DTG,1 and Tmax,DTG,2), and residual mass after heating in N2 and subsequent oxidation in air.
Table 7.
Thermogravimetric parameters of neat UPR and nanocomposites, including the temperature at 5% mass loss (Td,5%), maximum degradation temperatures (Tmax,DTG,1 and Tmax,DTG,2), and residual mass after heating in N2 and subsequent oxidation in air.
| Abbreviations | Td,5% [°C] | Tmax,DTG, 1 [°C] | Residual mass at 750 °C in N2 [%] | Tmax,DTG, 2 [°C] | Residual mass after oxidation in air at 850 °C [%] |
|---|---|---|---|---|---|
| UPR | 359.6 | 410.9 | 3.50 | 765.9 | 0.45 |
| 0.06%_ZnO NPs | 368.4 | 422.5 | 4.73 | 767.0 | 0.00 |
| 0.75%_ZnO NPs | 348.2 | 410.2 | 6.71 | 767.5 | 0.16 |
| 1%_ZnO NPs | 354.1 | 415.3 | 6.11 | 768.6 | 0.02 |
Table 8.
DSC analysis of pristine UPR resin and selected ZnO NP composites.
| Abbreviations | Tres [°C] | ΔHres [J g−1] | Tg [°C] |
|---|---|---|---|
| UPR | — | — | 108.9 |
| 0.06%_ZnO NPs | 114.9 | 4.89 | 109.2 |
| 0.75%_ZnO NPs | — | — | 107.6 |
| 1%_ZnO NPs | 127.1 | 3.70 | 113.2 |
Tres – peak temperature of the residual cross-linking exotherm;
Disclaimer/Publisher’s Note: The statements, opinions and data contained in all publications are solely those of the individual author(s) and contributor(s) and not of MDPI and/or the editor(s). MDPI and/or the editor(s) disclaim responsibility for any injury to people or property resulting from any ideas, methods, instructions or products referred to in the content. |
© 2026 by the authors. Licensee MDPI, Basel, Switzerland. This article is an open access article distributed under the terms and conditions of the Creative Commons Attribution (CC BY) license (http://creativecommons.org/licenses/by/4.0/).
Copyright: This open access article is published under a Creative Commons CC BY 4.0 license, which permit the free download, distribution, and reuse, provided that the author and preprint are cited in any reuse.