
Submitted:
23 September 2026
Posted:
24 September 2026
You are already at the latest version
Abstract
Conventional multimodal driver-workload recognition relies on behavioral and physiological statistics, whereas discrete task labels do not explicitly encode risk, stage, or strategy. We propose ACT-R Cognitive Semantic Lightweight Fusion (ACTR-CSLF), which aggregates dynamic states from an ACT-R driving model into 20 task-cognitive semantic features and combines them with 16 driving, eye-tracking, and electroencephalographic features in multinomial logistic regression. Leave-one-subject-out validation used 420 weather-task segments from 30 participants, with condition-prior, one-hot, random-code, rank-matched, shuffled-semantic, and leave-one-scene-out controls. Macro-F1 was 0.5795 for Human-only, 0.7485 for ACT-R-only, and 0.7277 for Human+ACT-R; Condition-only reached 0.7674, revealing a strong closed-set task prior. Standard random codes averaged 0.7309, so superiority to arbitrary high-dimensional task codes was unsupported. However, the real ACT-R representation exceeded the empirical 95% upper bound of rank-matched random codes (0.7277 vs. 0.7251; one-sided empirical p = 0.0198), and all 30 shuffled mappings performed worse. In leave-one-scene-out validation, Human+ACT-R outperformed discrete unknown fallbacks in Macro-F1 (0.2590 vs. 0.1902-0.1929) and accuracy (0.5643 vs. 0.2690-0.2714). With 111 parameters, 1.0879 KB storage, and 0.2147 ms mean CPU latency, ACTR-CSLF offers a lightweight, traceable balance of predictive performance, cognitive interpretability, and deployment cost.
Keywords:
driver workload
; ACT-R
; task cognitive semantics
; multimodal driving
; task-condition prior
; interpretable machine learning
1. Introduction
Conditionally automated driving transforms the driver from a continuous controller into a supervisor of automation who remains responsible for taking over. When a system-boundary event occurs, the driver must reorient attention, understand the environment, assess risk, select a strategy, and control the vehicle within a limited time. Takeover performance is jointly influenced by task complexity, weather, road scenario, and driver state [1,2]. Driver workload is therefore not a stable quantity captured by a single sensor; it emerges from the interaction between task demands and individual responses. Reliable classification of low, medium, and high workload can inform takeover-warning lead time, information density, and automation-recovery strategies.
Driver-workload assessment has developed into a multimodal paradigm combining subjective ratings, driving performance, eye movements, peripheral physiology, and neural signals. Systematic reviews show that measurement types differ in workload sensitivity and application context, while multimodal information can cover behavioral control, visual search, and internal resource allocation [3,4]. Evidence from electroencephalographic (EEG) microstates, gaze entropy, and pre-takeover physiological responses further indicates that task difficulty elicits distinct but related neural, visual, and physiological responses [5,6,7]. Recent work on aligned multimodal fusion, on-road neuroergonomics, and in-vehicle physiological sensing continues to advance workload recognition [20,21,22]. Nevertheless, most recognition methods still rely primarily on summary features from fixed time windows. Even when weather or scenario labels are included, these labels mainly identify the current task rather than explain its risk, stage, intent, or strategy structure.
Adaptive Control of Thought-Rational (ACT-R) is a cognitive architecture that organizes perception, memory, decision making, and action through modules, buffers, and production rules [8,9]. Classical driving models have integrated lane keeping, visual control, and multitasking within a unified cognitive framework [10,11]. More recently, ACT-R and integrated cognitive architectures have been applied to workload during automated-driving takeovers, situation awareness, hazard-response perception, and multistage takeover processes [12,13,14,15,16]; integration of SEEV and ACT-R has also demonstrated a route for combining explicit attention with situational states [23]. Unlike a discrete scenario identifier, an ACT-R runtime log records changes in risk state, current intent, task stage, strategy rules, and lane-change and recovery processes. ACT-R can therefore be used not only to generate behavior but also to transform an anonymous driving task into computable and traceable task cognitive semantics.
Using cognitive semantics for workload classification requires two evaluation settings to be distinguished. In a new-subject/known-task closed-set setting, a discrete task identifier can directly exploit a stable condition-level workload prior and may therefore be highly predictive. However, each task-ID dimension only marks identity: it does not express cognitive structure across conditions and provides no natural predefined encoding for an unseen task. ACT-R semantics instead describe risk, intent, stage, and strategy in a fixed-dimensional space. Whether their predictive performance reflects meaningful cognitive structure, arbitrary high-dimensional task coding, or the task-to-semantics correspondence must be examined through context decomposition, random coding, rank matching, and semantic shuffling.
Accordingly, this study addresses three questions: (1) Can ACT-R task cognitive semantics represent task structure associated with driver workload? (2) How do ACT-R semantics and discrete task-identity encodings differ in discrimination and interpretability? (3) How do ACT-R semantics perform when task-identity priors are structurally controlled or an unseen task is held out? The contributions are threefold. First, we aggregate risk, intent, task stage, driving strategy, lane change/recovery, and decision complexity into a 20-dimensional ACT-R task cognitive semantic representation, converting anonymous conditions into traceable cognitive structure. Second, we develop a lightweight workload-classification framework centered on ACT-R task cognitive semantics and compatible with driving, eye-tracking, and EEG inputs; Human-only, condition-prior, one-hot, ACT-R-only, and joint models decompose the effects of task-level structure and individual multimodal responses. Third, task-to-semantics shuffling, standard random codes, rank-matched random codes, leave-one-scene-out validation, identity-chain verification, and performance-complexity analysis provide layered tests of structural validity, representational capability, interpretability, and deployment efficiency.
2. Materials and Methods
2.1. Participants and Experimental Platform
Thirty-five participants were recruited. Two withdrew because of simulator sickness, and one was excluded because of equipment failure or abnormal acquisition, leaving 32 valid participants. The valid sample comprised 19 men and 13 women aged 18–29 years (mean, 24.7 years; standard deviation, 2.61 years), including 24 experienced and eight novice drivers. All participants held a Class C1 driving license, had more than six months of practical driving experience, had normal or corrected-to-normal vision, and provided informed consent before the experiment. Because of multimodal matching and data-completeness constraints, the main development data set included 30 of these participants.
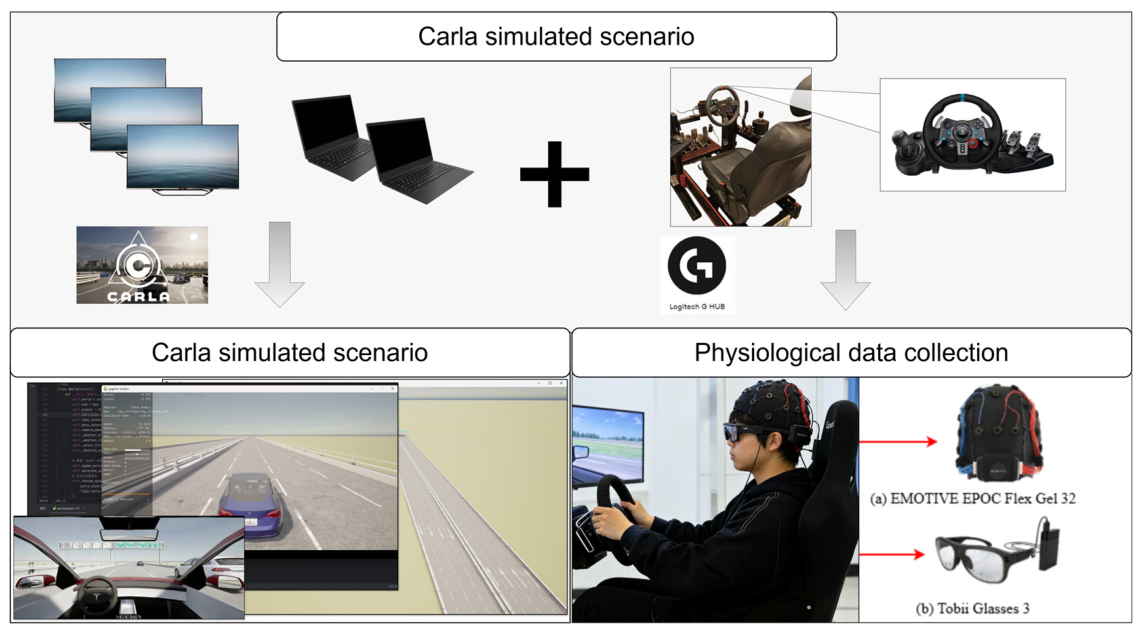
The experiment was conducted in the CARLA 0.9.15 high-fidelity driving simulator [17] using a Logitech G29 steering wheel and pedals with a three-screen display. Eye-tracking data were recorded at 50 Hz using Tobii Glasses 3, and EEG data were recorded at 128 Hz using a 32-channel EMOTIV EPOC Flex Gel system. Before the formal experiment, participants completed 5–10 min of adaptation driving, device fitting, calibration, and signal-quality checks. Rest between the clear and rainy routes was at least 5 min. The clear condition used CARLA’s ClearNoon preset, and the heavy-rain condition used HardRainNoon; the experimenter switched presets between formal runs. Road geometry, traffic-event order, vehicle layout, and task requirements were held constant across weather conditions. The weather manipulation primarily altered precipitation, cloud cover, ambient illumination, and the visual appearance of a wet road.
Figure 1.
Experimental platform and multimodal data-acquisition setup.
2.2. Driving Tasks and Sample Structure
The experimental road was an approximately 6.9 km, three-lane expressway scenario with a design speed of 100 km/h. The one-way road contained three traffic lanes and one emergency lane; each traffic lane was 3.75 m wide, and the curve radius was at least 700 m. The complete route comprised continuous periods of automated-driving monitoring, first takeover, left- and right-curve driving, lane-blockage avoidance and lane change, long-straight driving, resumption of automated driving, and straight-road recovery. Workload modeling used seven target segments—first takeover, vehicle cut-in conflict, left-curve driving, lane-blockage avoidance and lane change, long-straight steady driving, right-curve driving, and second takeover with obstacle avoidance—under clear and heavy-rain conditions, yielding 14 task conditions. Each participant in the development data set contributed one segment for each condition.
The full route was divided into event segments A-J. Segments B, C, D, E, F, G, and I were selected for three-level workload classification (Table 1). The automated-driving baseline, automation-recovery segment, and final straight-road recovery segment were used mainly to establish control states, complete system transitions, or reduce carryover from preceding operations. They did not impose the same sustained manual-control and risk-management requirements as the seven target tasks and were therefore excluded from the primary three-level analysis. Each participant contributed seven target segments in each of two weather conditions. The main analysis thus comprised 30 participants x 2 weather conditions x 7 target tasks = 420 participant-weather-task segments.
Figure 2.
Experimental highway route and sequence of driving events.
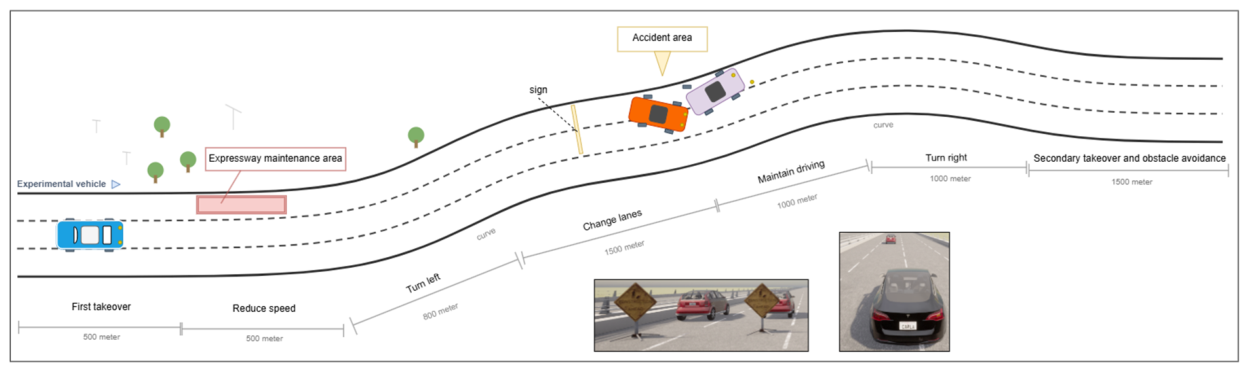

Table 2.
Data sets, identity status, and validation use.
| Data set | Participants/samples | Condition structure | Identity and label status | Formal use |
|---|---|---|---|---|
| DEV_SEQUENCE | 30/420 | 7 scenes x 2 weather conditions per participant | Operator-recalled sequence mapping; labels anchored by sequence | Closed-set LOSO comparison and frozen-model development |
| VERIFIED_SUBSET | 11/154 | 7 scenes x 2 weather conditions per participant | Sensor identity chain A/B1; questionnaires still sequence-anchored | Within-subset LOSO and locked 20-to-11 holdout |
2.3. Driving, Eye-Tracking, and EEG Features
Eight driving-behavior features were retained: the lower quartile of longitudinal acceleration, mean lateral acceleration, mean steering-longitudinal-acceleration coupling, total lane invasions, maximum absolute lane deviation, mean lateral velocity, the lower quartile of steering input, and the standard deviation of steering-rate change. Five eye-tracking features were retained: the standard deviation of the wearable-device acceleration on the x-axis, the standard deviations of gyroscope signals on the y- and z-axes, mean left-pupil diameter, and the upper quartile of the gyroscope x-axis signal. Three EEG features were retained: the frontal-occipital alpha difference, frontal theta/alpha ratio, and left/right parietal alpha ratio. Together, these modalities provided 16 human-factor features describing observable vehicle control, head-eye behavior, and neural responses within each segment.
2.4. Subjective Driver Workload and Three-Level Labels
The segment-level questionnaire assessed overall workload, mental demand, time pressure, control difficulty, and tension/perceived risk. Each item was rated on a seven-point scale. The design adopted the multidimensional resource-demand rationale of the NASA Task Load Index [18] while accommodating repeated segment ratings. Let q_ijr denote participant i’s rating on item r for segment j. The segment-level mean score was calculated as follows:
where sij is the mean subjective workload score for participant i and segment j, qijr is the response to questionnaire item r, and r = 1,...,5 indexes the five workload items.
To reduce between-participant differences in rating scale, scores were standardized within each participant across the 14 segments:
where zij is the within-participant standardized workload score, μi is participant i’s mean across the 14 segment scores, and σi is the corresponding within-participant standard deviation.
All standardized segment scores were then split at the global tertiles into low-, medium-, and high-workload classes. The resulting class counts were 139, 141, and 140, respectively. Labels were derived exclusively from subjective ratings and did not incorporate driving-behavior features.
2.5. Data Sets and Validation Boundaries
The analysis unit was a participant-weather-scene segment. DEV_SEQUENCE contained 30 participants and 420 samples. Sensor-questionnaire linkage was based on the experimental operator’s recalled sequence mapping. VERIFIED_SUBSET contained 11 participants and 154 samples for whom the driving-eye-tracking-EEG identity chain reached evidence level A/B1; however, the anonymous questionnaire identifiers could not be linked to a recovered real-name crosswalk, so labels remained sequence-anchored. VERIFIED_SUBSET was used for directional robustness checks and the locked 20-to-11 holdout; it was not treated as an independent external cohort.
3. ACT-R Task Cognitive Semantic Representation
3.1. ACT-R Driving Model
The ACT-R driving model comprised a perception layer, a production-rule layer, a bridging execution layer, and a skill-control layer. CARLA supplied environmental states including speed, forward distance, relative motion, lane position, and adjacent-lane feasibility. The model wrote these states to goal, visual-location, and manual buffers. Production rules then implemented risk grading, gap re-evaluation, lane-change preparation and execution, lane-change abortion, recentering, and recovery. The construction and behavioral performance of this expressway ACT-R model have been reported previously [19]. The present study did not repeat the full validation of its production rules or vehicle controller; instead, it used frozen runtime logs to generate task semantics.
3.2. From Dynamic Internal States to 20-Dimensional Semantics
For each weather-scene log, internal states were aggregated by task segment. Discrete variables were summarized using entropy, transition counts, or state proportions; stage variables were summarized by the mean, standard deviation, and a high percentile; rules and actions were summarized by entropy and transition intensity; lane change and recovery were summarized by activity and goal proportions; and decision complexity was described by mean decision time and the mean number of candidate rules. The resulting compact semantic table contained 14 conditions x 20 fields. A condition vector was shared across participants and represented the task cognitive structure described by ACT-R, not the internal psychological state of a particular participant at a particular moment.
Table 3.
Definitions of the 20 ACT-R task cognitive semantic features.
| Semantic group | Dimensions | Fields | Cognitive interpretation |
|---|---|---|---|
| Risk | 3 | risk_entropy; risk_transition_count; risk_mid_ratio | Diversity and escalation/de-escalation of risk states and occupancy of medium risk |
| Intent | 4 | intent_entropy; intent_transition_count; intent_lane_changing_ratio; intent_return_center_ratio | Changes in driving intent and proportions of lane-change/recentering intent |
| Task stage | 3 | stage_mean; stage_std; stage_p95 | Task-progress level, variability, and exposure to advanced stages |
| Driving strategy | 4 | production_entropy; production_transition_count; manual_action_entropy; manual_action_transition_count | Complexity of production selection and manual-action organization |
| Lane change/recovery | 4 | lane_change_active_ratio; lane_change_purpose_ratio; return_center_purpose_ratio; watchdog_armed_ratio | Maneuver activation, goal maintenance, recentering, and safety monitoring |
| Decision complexity | 2 | decision_time_mean; rule_candidate_count_mean | Decision duration and competition among candidate rules |
3.3. Theoretical Boundary of Condition-Level Semantics
The 20 fields were not physical measurements such as vehicle speed, steering-wheel angle, or brake activation. They were task cognitive semantics abstracted from ACT-R internal states and production-rule activity. They can indicate why a task exhibits greater risk transitions, advanced-stage exposure, or strategy-organization complexity in the model, but they cannot be interpreted as the individualized cognitive trajectory of a real driver. Driving, eye-tracking, and EEG features form the individual multimodal-response branch, whereas ACT-R forms the task-cognitive-structure branch. Their different origins mean that combining the branches does not presuppose a synergistic performance gain.
3.4. Discrete Task Identity versus ACT-R Cognitive Semantics
One-hot encoding is a simple and strong closed-set baseline for a fixed task set because it identifies task identity directly. ACT-R is not a more complicated task label; it is a mechanism for converting task identity into cognitive structure. Its unseen-task interface assumes that the established ACT-R process can be run for a new condition to produce the same 20-dimensional semantics; it does not imply input-free zero-shot inference.
Table 4.
Representational capabilities of task identity and ACT-R task cognitive semantics.
| Attribute | 14-condition one-hot | Weather/scene one-hot | Standard random task code | ACT-R semantics |
|---|---|---|---|---|
| Primary function | Joint condition identity | Weather and scene identity | Stable high-dimensional identity | Structured task cognitive representation |
| Anonymous identifier | Yes | Yes | Yes | No |
| Meaning of dimensions | None | Category position only | None | Risk, intent, stage, strategy, and related structure |
| Explicit structure across conditions | None | Shared factors only | None | Present |
| Cognitive traceability | None | None | None | Traceable to ACT-R states and production rules |
| Fixed-dimensional interface | 14 dimensions; a new condition requires a new ID | 9 dimensions; a new category requires expansion | 20 dimensions but requires a new coding rule | Fixed at 20 dimensions |
| Natural encoding of an unseen task | None; all-zero unknown fallback | Partial; fallback for an unseen scene | No predefined semantics | Generated after running the established ACT-R process |
| Use of closed-set task identity | Strong | Strong | Strong | Retains high discrimination without an anonymous ID interpretation |
4. Lightweight Classification Framework and Validation Design
4.1. Human-Factor Multimodal Responses and ACT-R Task Structure
The Human branch contained 16 segment-level driving, eye-tracking, and EEG features describing observable individual responses. The ACT-R branch contained 20 condition-level task-semantic features describing task structure in the cognitive model. Within every training fold, missing-value imputation and standardization parameters were fitted using the training data only; neither a test participant nor a held-out scene contributed to preprocessing estimates. ACTR-CSLF is a lightweight classification framework centered on ACT-R task cognitive semantics and capable of joint input with human-factor representations. ACT-R-only served as the key representation ablation for testing the discriminative capability of task semantics themselves. The overall computation graph and layered validation boundary are summarized in Figure 3.
4.2. Lightweight Multinomial Logistic Classifier
The standardized 16-dimensional human-factor vector h_i and 20-dimensional ACT-R vector a_c(i) were concatenated to form x_i = [h_i; a_c(i)] in R^36. For class k in {low, medium, high}, the model estimated:
where xi is the 36-dimensional input for sample i; yi is its workload class; βk and bk are the coefficient vector and intercept for class k; k and l index the three workload classes; T denotes matrix transposition; and P(yi = k | xi) is the posterior class probability.
The training objective was the sum of multiclass cross-entropy and an L2 regularization term:
where L is the regularized training loss; N is the number of training samples; yi is the observed class of sample i; βk is the coefficient vector for class k; βkT is its squared Euclidean norm; and λ is the L2 regularization weight, corresponding inversely to the implementation parameter C under the solver’s scaling convention.
The model was optimized with the limited-memory Broyden-Fletcher-Goldfarb-Shanno (LBFGS) algorithm for a maximum of 3000 iterations. The inverse regularization strength C was selected from {0.1, 1, 10} using Macro-F1 in inner grouped validation; the locked audit used the development-set frozen value C = 1.0. Human+ACT-R contained 36 x 3 class coefficients and three intercepts, for 111 parameters in total. ACT-R-only contained 63 parameters.
4.3. Decomposition of Task-Context Contributions
Closed-set evaluation used leave-one-subject-out cross-validation (LOSO). All 14 task conditions of the held-out participant were present among the remaining training participants. The comparisons included Human-only; Condition-majority, which estimated P(Y | condition) within each training fold; Condition-only, which used only a 14-condition one-hot vector; Factorized context-only, which encoded weather and scene separately; Human+Weather/Scene; Human+14-condition; ACT-R-only; and Human+ACT-R. The first four models decomposed the task-condition prior, and the latter four compared discrete task identity, structured cognitive representation, and individual response.
4.4. Controls for Semantic Structure
The standard-random control assigned a stable 20-dimensional random task code to each of the 14 conditions in 100 repetitions, testing the effect of high-dimensional identity coding. The rank-matched control constrained the effective rank of each random representation to approximate that of the real ACT-R table in 100 repetitions, thereby reducing differences in representational degrees of freedom. Task-to-semantics shuffling permuted the real 20-dimensional vectors across the 14 conditions in 30 repetitions, preserving the semantic distribution while breaking the correct correspondence. All controls used the same outer folds, classifier, and frozen protocol. Empirical intervals were repetition-based quantile intervals rather than parameter confidence intervals.
4.5. Known Tasks, Unseen Tasks, and Identity-Chain Verification
Closed-set LOSO assessed new-subject/known-task performance. Leave-one-scene-out validation held out one scene at a time. The discrete one-hot representations used an all-zero unknown fallback for the unseen scene, whereas ACT-R used the 20-dimensional semantics generated for that scene by the established model. This design evaluated only the task-representation interface within the present study. Identity robustness was assessed by LOSO within the 11-participant sensor-chain-verified subset and by a locked 20-to-11 holdout in which the remaining 20 development participants were used for training and the 11 verified participants were tested once. Evaluation metrics were accuracy, Macro-F1, balanced accuracy, and quadratic weighted kappa (QWK), with Macro-F1 specified as the primary metric.
4.6. Efficiency and Interpretability
The frozen efficiency benchmark used a single CPU thread, batch size 1, 100 warm-up predictions, and 1000 timed predictions. Serialized model size and mean, median, and 95th-percentile single-sample latency were reported. Semantic lookup was timed separately. Interpretability was evaluated with 100 within-participant grouped permutations. In each repetition, one semantic or human-factor feature group was permuted, and the decrease in overall Macro-F1 relative to the real model was recorded. This analysis describes predictive contribution and does not identify a psychological causal mechanism.
5. Results
5.1. Workload Discrimination by ACT-R Task Cognitive Semantics
As shown in Figure 4 and Table 5, Human-only achieved a Macro-F1 of 0.5795, whereas ACT-R-only reached 0.7485, a difference of 0.1689. Thus, the 20-dimensional task semantics generated by the ACT-R cognitive model contained substantial workload-discriminative structure. ACT-R-only was nearly identical to Human+14-condition (0.7486), but the two inputs serve different representational functions: ACT-R-only provides a fixed-dimensional structure with cognitive meaning, whereas Human+14-condition directly uses anonymous condition identity.
5.2. Task-Condition Prior and Closed-Set Context Comparisons
Condition-majority and Condition-only achieved Macro-F1 values of 0.7683 and 0.7674, respectively, the two highest values under closed-set LOSO. The held-out participant did not contribute to training, but all 14 task conditions were covered by the remaining participants. The result therefore represents a condition-level predictive advantage in the new-subject/known-task setting rather than transfer to an unknown task. The Macro-F1 difference between Human+Condition and Condition-only was -0.0187, and that between Human+ACT-R and ACT-R-only was -0.0208. Under the current strong task prior, the 16 human-factor summary features did not further improve the closed-set Macro-F1 of task-level representation models. This asymmetry does not invalidate human-factor signals; rather, it indicates that the present label structure and feature compression allowed task-level information to account for most of the discrimination.
5.3. Condition-Workload Association
Figure 5 shows systematic differences in workload distributions among task conditions. The mean dominant-class proportion across the 14 conditions was 0.7667, and six conditions had dominant-class proportions of at least 0.80. The second takeover with obstacle avoidance under heavy rain was classified as high workload in 100% of segments. Long-straight driving under ClearNoon was low workload in 93.3% of segments, right-curve driving under ClearNoon was low workload in 90.0%, and the vehicle cut-in conflict under heavy rain was high workload in 86.7%. The raw and bias-corrected Cramer’s V values for condition-label association were 0.7097 and 0.6891, respectively; normalized mutual information was 0.3079, and mutual information was 0.5754 nat. One-hot vectors were generated exclusively from a prespecified weather-by-task dictionary without reading test labels or test-participant statistics. Their high performance therefore arose from a known-task condition prior rather than target leakage.
5.4. Real, Random, and Shuffled Semantics
Across 100 standard 20-dimensional random task codes, the mean Macro-F1 was 0.7309, and the real ACT-R semantics lay at the 24th percentile. Thus, with only 14 fixed conditions, a high-dimensional stable code can itself provide a strong task-identity representation, and the data do not support a claim that ACT-R is superior to arbitrary high-dimensional random task codes. After effective rank was controlled, the rank-matched random mean decreased to 0.6955. The observed ACT-R value of 0.7277 exceeded the empirical 97.5th-percentile upper bound of 0.7251, with an add-one-corrected one-sided empirical tail probability of 0.0198. Moreover, all 30 task-to-semantics shuffles performed worse than the correct ACT-R mapping. Together, these controls show that high-dimensional identity accounts for part of closed-set performance, whereas the real ACT-R structure retains discriminative value when representational rank or the task-to-semantics correspondence is controlled.
Table 6.
Controls for ACT-R semantic structure.
| Representation/control | Repetitions | Macro-F1, mean or observed | SD | Empirical 95% interval | Position of real ACT-R/tail probability |
|---|---|---|---|---|---|
| Human+ACT-R, real semantics | 1 | 0.7277 | - | - | - |
| Standard 20-dimensional random task code | 100 | 0.7309 | 0.0045 | [0.7212, 0.7374] | 24th percentile; p = 0.7624 |
| Rank-matched random task code | 100 | 0.6955 | 0.0210 | [0.6478, 0.7251] | 99th percentile; p = 0.0198 |
| Task-to-semantics shuffled | 30 | 0.6756 | 0.0187 | [0.6468, 0.7071] | 30/30 below the observed value |
5.5. Representational Capability for Unseen Scene Conditions
Leave-one-scene-out results are shown in Figure 6 and Table 7. The seven-fold mean Macro-F1 of Human+ACT-R was 0.2590, close to the Human-only value of 0.2582, but higher than Human+factorized fallback (0.1902) and Human+condition fallback (0.1929). Human+ACT-R achieved an accuracy of 0.5643, exceeding the two discrete fallback values of 0.2690 and 0.2714. Within this leave-one-scene-out design, ACT-R therefore provided a more natural and more effective fixed-dimensional task-representation interface than the discrete unknown fallbacks. However, because its Macro-F1 did not exceed that of Human-only, the current ACT-R semantics alone did not establish strong cross-task generalization.
5.6. Identity-Chain Verification and Locked Audit
Within the 11-participant identity-chain-verified subset, Human+ACT-R achieved a Macro-F1 of 0.6971 under LOSO and retained comparatively high discrimination. Because this subset came from the same experimental cohort and its questionnaire labels remained sequence-anchored, it was used only as a robustness check. In the stricter locked 20-to-11 holdout, Human+ACT-R achieved 0.6833, outperforming Human-only (0.5232) but remaining below the learned scene embedding (0.6883), Human+Weather/Scene (0.7206), and Human+14-condition (0.7287). These results again demonstrate a strong task-condition prior while showing that ACT-R semantics retained usable discrimination in data with a verified sensor identity chain.
5.7. Performance-Complexity Trade-Off and Cognitive Interpretation
ACTR-CSLF contained 111 parameters, occupied 1.0879 KB after serialization, and required mean, median, and 95th-percentile CPU inference times of 0.2147, 0.1634, and 0.2679 ms per sample, respectively. Figure 7 places the framework in a region of high Macro-F1, low parameter count, and low latency. Mean semantic-table lookup required approximately 0.0009 ms, but this value represents retrieval of a 20-dimensional vector from the 14-condition table only; it excludes online ACT-R execution, sensor processing, and synchronization overhead.
As shown in Figure 8, predictive contribution among the ACT-R semantic groups was concentrated in driving strategy and task stage, with mean Macro-F1 decreases of 0.1324 and 0.1199, respectively. These were followed by intent (0.0890), decision complexity (0.0856), risk (0.0692), and lane change/recovery (0.0561). This ordering traces model predictions back to production/action organization and task progression rather than leaving the explanation at an anonymous condition number. It does not demonstrate a causal psychological mechanism in real drivers.
6. Discussion
6.1. Task Conditions Create a Strong Workload Prior
Driver workload is jointly determined by task demands and individual responses. Takeover, braking, lane changing, and steady straight driving differ systematically in risk, time pressure, and control requirements; concentration of condition-level workload distributions is therefore theoretically plausible. Condition-majority, Condition-only, and the association statistics consistently showed that the dominant discriminative structure in the present data arose first from task demands. The term task-identity shortcut describes the route by which a closed-set model exploits a known-condition prior; it does not imply an implementation error or label leakage. For systems deployed with a fixed task library and intended primarily for new drivers, one-hot encoding remains an efficient and competitive baseline.
6.2. ACT-R Represents Task Demands, Whereas Human-Factor Modalities Represent Individual Responses
For a given weather-task condition, the generic ACT-R agent produced a shared and comparatively deterministic structural vector describing stable task demands such as risk, intent, stage, and strategy. Human-factor multimodal features additionally contained effects of driving experience, current state, individual control strategy, physiological differences, and sensor noise. ACT-R-only achieved 0.7485, whereas adding the human-factor features did not further improve closed-set Macro-F1. This result indicates that the present labels and task system were driven mainly by stable task demands. It does not negate the relevance of human-factor signals; instead, it suggests that 16 segment-level summary features, the available sample size, and a linear decision boundary were insufficient to extract a stable individual increment beyond the task prior. Future studies should model individual responses at higher temporal resolution rather than treating generic task semantics as an individual’s psychological state.
6.3. The Value of ACT-R Is Not Reducible to High-Dimensional Task Identity
The performance of standard random 20-dimensional codes showed that a model can memorize task identity whenever stable, separable vectors are assigned to 14 fixed conditions. High closed-set performance alone therefore cannot validate a cognitive mechanism. Rank matching reduced differences in representational degrees of freedom, while task-to-semantics shuffling broke the correct condition-semantic correspondence. The real ACT-R semantics were more robust than both controls, suggesting that their representational value cannot be explained completely by arbitrary identity coding. The supported claim is that structured state organization and the correct task-to-semantics mapping have detectable representational value, not that ACT-R internal states have been proven equivalent to the cognitive processes of real drivers.
6.4. Lightweight Interpretation and Potential for Unseen-Task Representation
Structured semantics allow a simple linear classifier to read risk, stage, strategy, and related fields directly, without requiring a deep network to relearn their meanings. The 111-parameter model, approximately 1.09 KB footprint, and 0.2147 ms classification latency support its suitability for resource-constrained or auditable driver-state monitoring modules. In leave-one-scene-out validation, ACT-R’s advantage over discrete unknown fallbacks further indicates that a fixed 20-dimensional interface can preserve contextual input when a new task is introduced. This conclusion is strictly bounded to the seven scenarios and established ACT-R generation procedure used here. It supports a more natural representation for unseen tasks, not universal zero-shot generalization or verified generalization to real roads.
6.5. Limitations and Future Work
The study has three principal limitations. First, the cognitive-semantic resolution is limited: each ACT-R vector represents condition-level task semantics rather than an individualized, temporally resolved cognitive trajectory, so it cannot be used to infer the internal psychological process of a real driver. Second, the data and identity-verification scope are limited: questionnaire identity was recovered by experimental sequence, and although an 11-participant sensor-chain verification and locked 20-to-11 audit were available, all samples came from the same experimental cohort. Third, external validity and deployment validation are limited: the experiment used a simulator, two weather conditions, and seven scenes; weather order was fixed; and real-vehicle validation has not yet been conducted. The 0.0009 ms value measures semantic-table lookup rather than end-to-end system latency. Future work should prioritize recovery of a direct questionnaire-to-real-name crosswalk, recruit independent participants and task conditions, and evaluate individualized dynamic semantics and real-road deployment while retaining the predefined 20-dimensional interface.
7. Conclusions
This study proposed an ACT-R task cognitive semantic representation that converts discrete driving-task identity into 20 cognitive features grouped as risk, intent, task stage, driving strategy, lane change/recovery, and decision complexity. The experiments revealed a pronounced task-condition prior: simple condition encodings achieved high closed-set classification performance. At the same time, ACT-R-only reached a Macro-F1 of 0.7485, demonstrating that structured cognitive semantics retained substantial workload discrimination without relying on an anonymous task-ID interpretation. The real ACT-R representation outperformed task-to-semantics shuffling and rank-matched random representations and provided a more effective fixed-dimensional interface than discrete one-hot fallbacks under leave-one-scene-out validation. ACTR-CSLF unified task cognitive structure and individual multimodal responses using only 111 parameters and supported explanations traceable to strategy, stage, intent, and risk. The main contribution of ACT-R is therefore not the highest closed-set score, but the transformation of highly predictive task-condition information into a cognitively meaningful, traceable, analyzable, and extensible representation. This provides a lightweight route for integrating cognitive-architecture knowledge with driver-state monitoring.
Author Contributions
Conceptualization, H.C., L.X.; methodology, H.C., L.X., Y.T.; software, H.C., Y.T.; data curation, H.C., L.X., J.C.; writing—original draft preparation, H.C., L.X., J.C., C.S.; writing—review and editing, H.C., L.X., C.S., J.C.; visualization, H.C., L.X., C.S, H.S.; supervision, L.X., J.C., C.S.; funding acquisition, L.X., J.C., C.S. All authors have read and agreed to the published version of the manuscript.
Funding
This research was funded by the National Nature Science Foundation of China (52262046, 52302389); Natural Science Foundation of Hunan Province (2026JJ50487); Scientific Research Project of Hunan Provincial Department of Education (25B0689); Natural Science Foundation of Jiangsu Province (BK20231197); Science and Technology Program of Suzhou (SYG2025116).
Institutional Review Board Statement
Not applicable.
Informed Consent Statement
Informed consent was obtained from all participants involved in the study.
Data Availability Statement
The raw data supporting the conclusions of this article can be made available by the corresponding author.
Conflicts of Interest
The authors declare no conflicts of interest.
References
- Chen, H.L.; Zhao, X.H.; Chen, C.; et al. A systematic review on test performance of the driver takeover process in automated driving. Accid. Anal. Prev. 2025, 215, 108012. [Google Scholar] [CrossRef] [PubMed]
- Melnicuk, V.; Thompson, S.; Jennings, P.; et al. Effect of cognitive load on drivers’ state and task performance during automated driving: Introducing a novel method for determining stabilisation time following take-over of control. Accid. Anal. Prev. 2021, 151, 105967. [Google Scholar] [CrossRef] [PubMed]
- Ma, J.; Wu, Y.P.; Rong, J.; et al. A systematic review on the influence factors, measurement, and effect of driver workload. Accid. Anal. Prev. 2023, 192, 107289. [Google Scholar] [CrossRef] [PubMed]
- Tao, D.; Huang, J.Q.; Zhang, Q.L.; et al. Assessment of drivers’ mental workload: Exploring the roles of multimodal physiological measures, driving measures and their combinations. Adv. Eng. Inform. 2025, 68, 103796. [Google Scholar] [CrossRef]
- Ma, S.W.; Yan, X.D.; Billington, J.; et al. Cognitive load during driving: EEG microstate metrics are sensitive to task difficulty and predict safety outcomes. Accid. Anal. Prev. 2024, 207, 107769. [Google Scholar] [CrossRef] [PubMed]
- Goodridge, C.M.; Goncalves, R.C.; Arabian, A.; et al. Gaze entropy metrics for mental workload estimation are heterogenous during hands-off level 2 automation. Accid. Anal. Prev. 2024, 202, 107560. [Google Scholar] [CrossRef] [PubMed]
- Deng, M.; Gluck, A.; Zhao, Y.J.; et al. An analysis of physiological responses as indicators of driver takeover readiness in conditionally automated driving. Accid. Anal. Prev. 2024, 195, 107372. [Google Scholar] [CrossRef] [PubMed]
- Anderson, J.R.; Bothell, D.; Byrne, M.D.; et al. An integrated theory of the mind. Psychol. Rev. 2004, 111, 1036–1060. [Google Scholar] [CrossRef] [PubMed]
- Dimov, C.; Khader, P.H.; Marewski, J.N.; et al. How to model the neurocognitive dynamics of decision making: A methodological primer with ACT-R. Behav. Res. Methods 2020, 52, 857–880. [Google Scholar] [CrossRef] [PubMed]
- Salvucci, D.D. Modeling driver behavior in a cognitive architecture. Hum. Factors 2006, 48, 362–380. [Google Scholar] [CrossRef] [PubMed]
- Salvucci, D.D.; Gray, R. A two-point visual control model of steering. Perception 2004, 33, 1233–1248. [Google Scholar] [CrossRef] [PubMed]
- Oh, H.; Yun, Y.; Myung, R. Driver behavior and mental workload for takeover safety in automated driving: ACT-R prediction modeling approach. Traffic Inj. Prev. 2024, 25, 381–389. [Google Scholar] [CrossRef] [PubMed]
- Rehman, U.; Cao, S.; MacGregor, C.G. Modelling level 1 situation awareness in driving: A cognitive architecture approach. Transp. Res. Part C Emerg. Technol. 2024, 165, 104737. [Google Scholar] [CrossRef]
- Rehman, U.; Cao, S.; MacGregor, C.G. Modeling brake perception response time in on-road and roadside hazards using an integrated cognitive architecture. IEEE Trans. Hum.-Mach. Syst. 2024, 54, 441–454. [Google Scholar] [CrossRef]
- Scharfe-Scherf, M.S.L.; Wiese, S.; Russwinkel, N. A cognitive model to anticipate variations of situation awareness and attention for the takeover in highly automated driving. Information 2022, 13, 418. [Google Scholar] [CrossRef]
- Tan, X.M.; Zhang, Y.Q. Understanding driver response to multi-stage takeover requests across varied modalities: A computational cognitive modeling approach. Transp. Res. Part C Emerg. Technol. 2025, 174, 105114. [Google Scholar] [CrossRef]
- Dosovitskiy, A.; Ros, G.; Codevilla, F.; et al. CARLA: An open urban driving simulator. Proc. 1st Annu. Conf. Robot Learn. PMLR 2017, Volume 78, 1–16. [Google Scholar]
- Hart, S.G. NASA-Task Load Index (NASA-TLX); 20 years later. In Proceedings of the Human Factors and Ergonomics Society Annual Meeting; 2006; Volume 50, pp. 904–908. [Google Scholar] [CrossRef]
- Chen, H.; Shu, J.; Xie, L. Development and evaluation of an ACT-R cognitive model for highway driving. In Proceedings of the 2025 8th International Conference on Transportation Information and Safety; IEEE, 2025; pp. 893–900. [Google Scholar] [CrossRef]
- Wang, A.; Yang, H.; Wang, J.; et al. Driver cognitive load estimation in conditional driving with aligned attention-enabled multimodal fusion. Transp. Res. Part C Emerg. Technol. 2026, 183, 105471. [Google Scholar] [CrossRef]
- Atici-Ulusu, H.; Taskapilioglu, O.; Gunduz, T. A neuroergonomics approach to investigate the mental workload of drivers in real driving settings. Transp. Res. Part F Traffic Psychol. Behav. 2024, 103, 177–189. [Google Scholar] [CrossRef]
- Sriranga, A.K.; Lu, Q.; Birrell, S. A systematic review of in-vehicle physiological indices and sensor technology for driver mental workload monitoring. Sensors 2023, 23, 2214. [Google Scholar] [CrossRef] [PubMed]
- Du, N.; Wu, X.W.; Misu, T.; et al. A preliminary study of modeling driver situational awareness based on SEEV and ACT-R models. Proc. Hum. Factors Ergon. Soc. Annu. Meet. 2022, Volume 66, 1602–1606. [Google Scholar] [CrossRef]
Figure 3.
ACTR-CSLF architecture and validation boundary. The upper panel shows the interpretable dual-branch computation graph, and the lower panel specifies model selection and layered validation.
Figure 3.
ACTR-CSLF architecture and validation boundary. The upper panel shows the interpretable dual-branch computation graph, and the lower panel specifies model selection and layered validation.
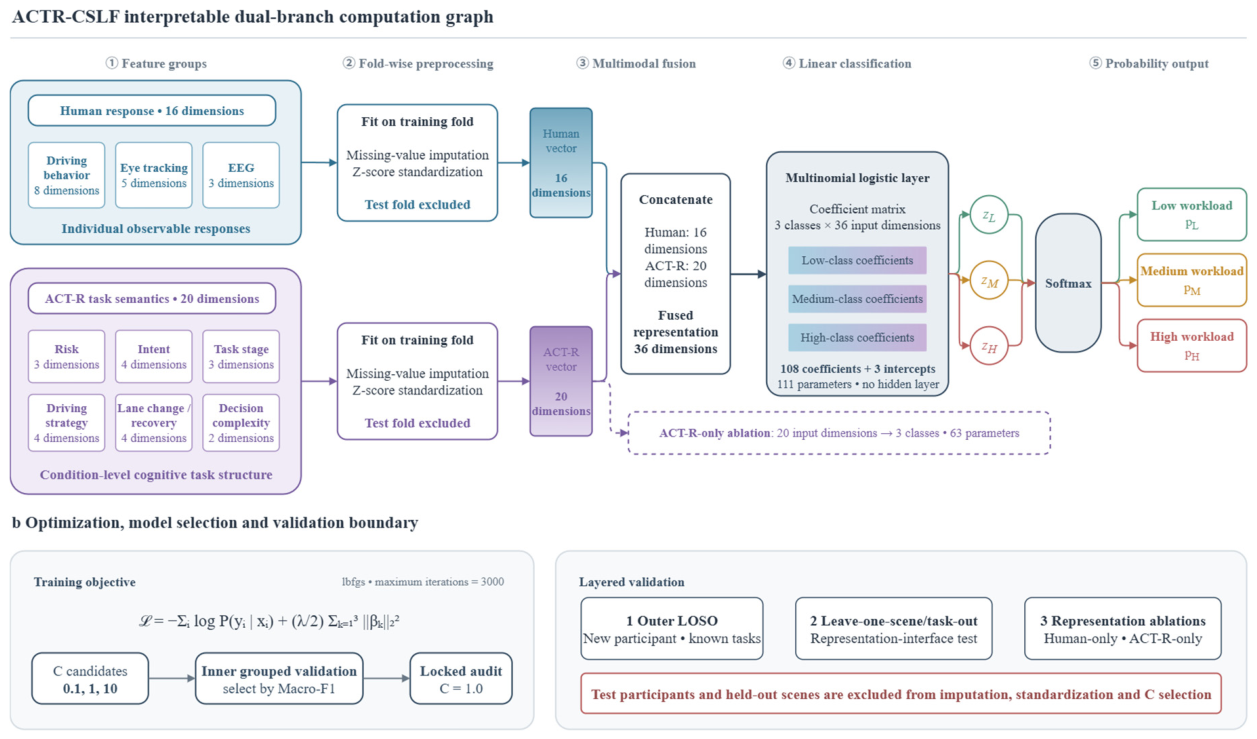
Figure 4.
Closed-set task-context and ACT-R representation decomposition under LOSO. Bars begin at zero and show the frozen Macro-F1 values. Condition-majority uses the majority class estimated for each condition within a training fold; ACT-R-only uses only the 20 task cognitive semantic features.
Figure 4.
Closed-set task-context and ACT-R representation decomposition under LOSO. Bars begin at zero and show the frozen Macro-F1 values. Condition-majority uses the majority class estimated for each condition within a training fold; ACT-R-only uses only the 20 task cognitive semantic features.
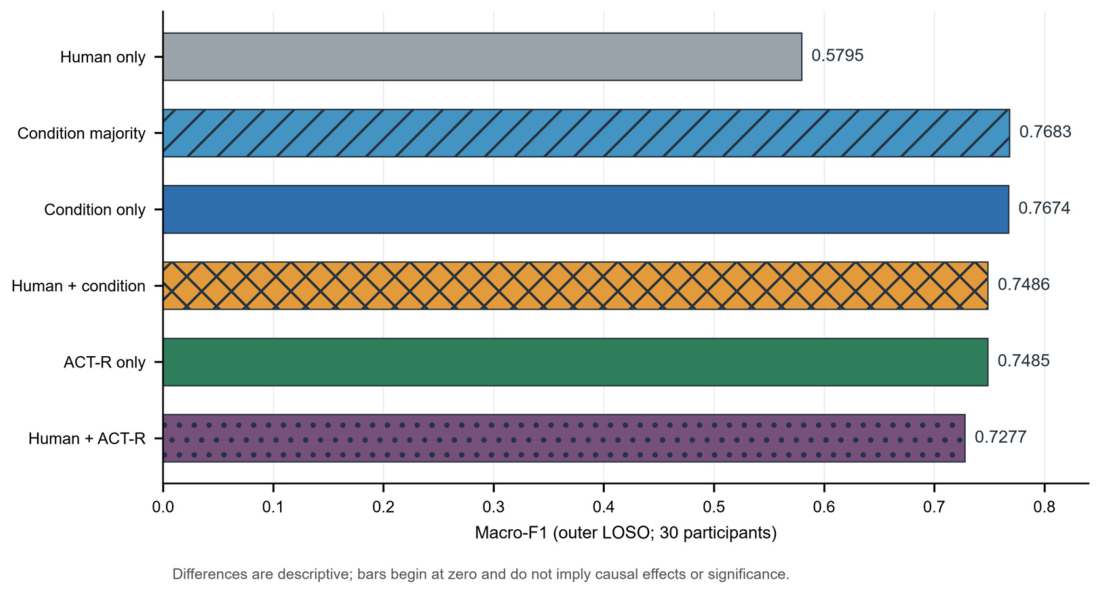
Figure 5.
Proportions of low-, medium-, and high-workload labels in the 14 weather-task conditions. Color and cell values jointly encode within-condition proportions, revealing the distributional structure of the task-condition prior.
Figure 5.
Proportions of low-, medium-, and high-workload labels in the 14 weather-task conditions. Color and cell values jointly encode within-condition proportions, revealing the distributional structure of the task-condition prior.
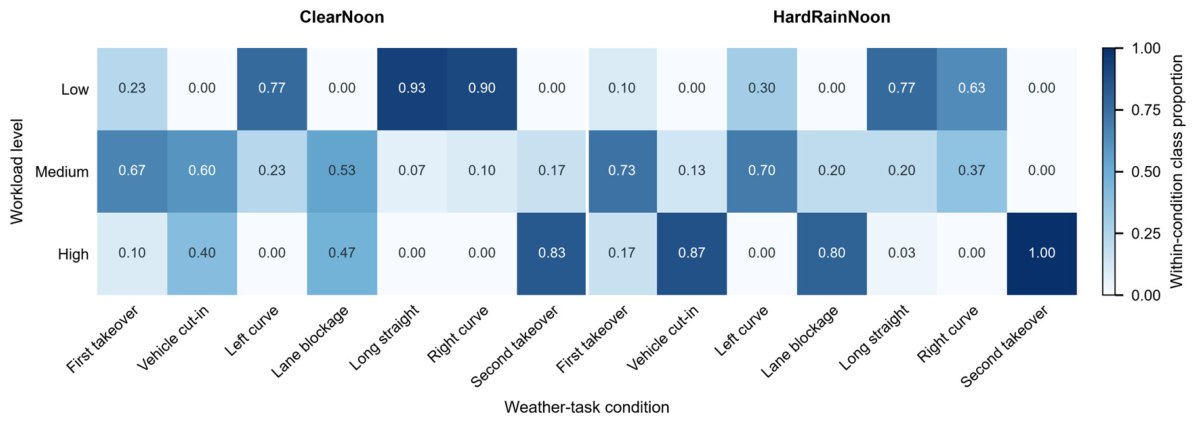
Figure 6.
Seven-fold Macro-F1 and accuracy for four representations under leave-one-scene-out validation. The factorized and 14-condition one-hot models use an all-zero unknown fallback for an unseen scene; ACT-R retains a fixed-dimensional representation when the established model can generate 20-dimensional semantics for the held-out scene.
Figure 6.
Seven-fold Macro-F1 and accuracy for four representations under leave-one-scene-out validation. The factorized and 14-condition one-hot models use an all-zero unknown fallback for an unseen scene; ACT-R retains a fixed-dimensional representation when the established model can generate 20-dimensional semantics for the held-out scene.
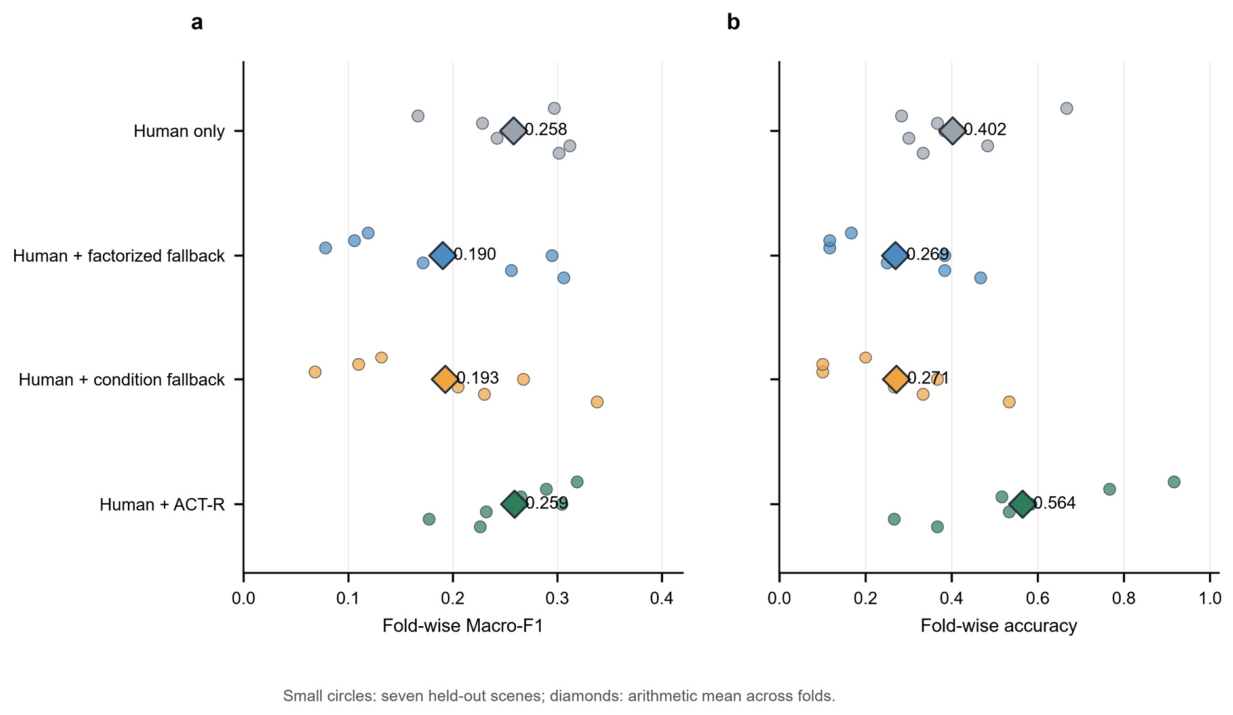
Figure 7.
Performance-complexity Pareto relationships among the frozen models. Exported parameter count is shown on a logarithmic axis, and the efficiency measurements follow the common frozen benchmark.
Figure 7.
Performance-complexity Pareto relationships among the frozen models. Exported parameter count is shown on a logarithmic axis, and the efficiency measurements follow the common frozen benchmark.
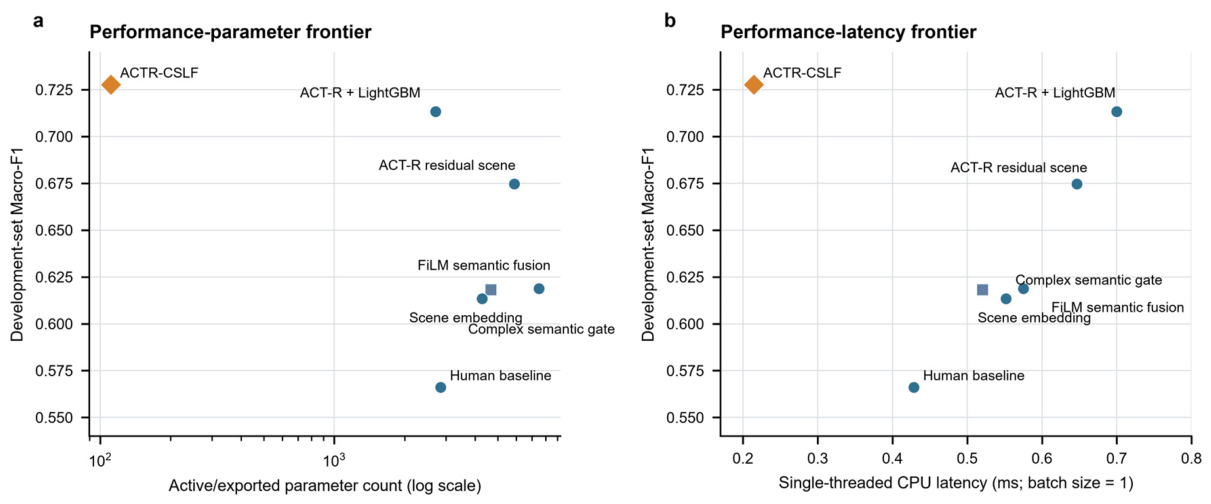
Figure 8.
Grouped permutation importance for the Human+ACT-R model. Points show the mean decrease in Macro-F1 across 100 within-participant permutations, and horizontal lines show the empirical 2.5th-97.5th percentile interval.
Figure 8.
Grouped permutation importance for the Human+ACT-R model. Points show the mean decrease in Macro-F1 across 100 within-participant permutations, and horizontal lines show the empirical 2.5th-97.5th percentile interval.
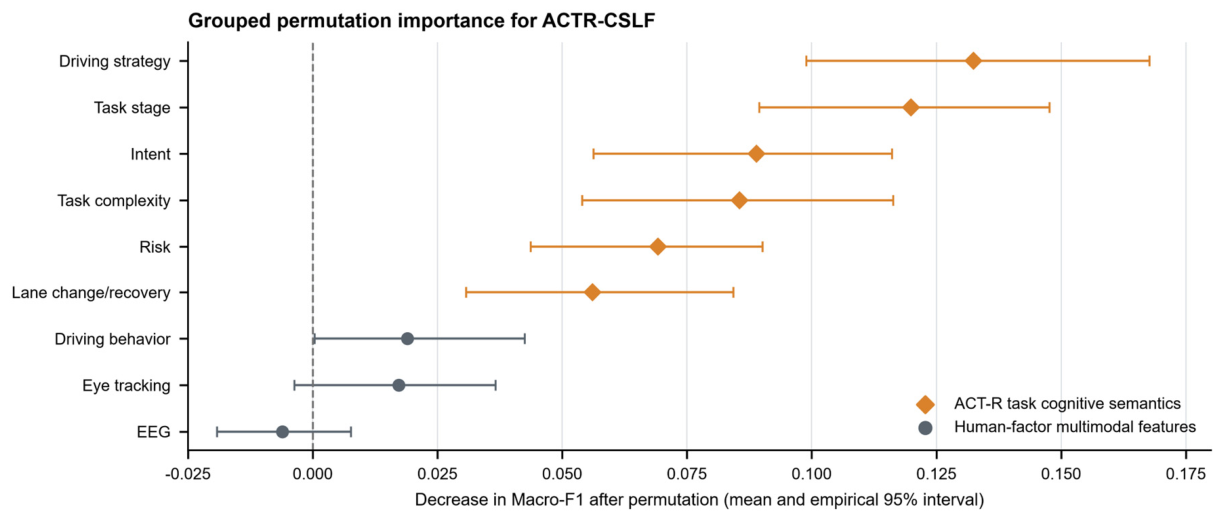
Table 1.
Target driving tasks and operational definitions.
| Segment | Formal task name | Main task requirement | Rationale for inclusion |
|---|---|---|---|
| B | First takeover (triggered by disappearance of lane markings) | Respond to voice and head-up-display requests and resume vehicle control | Represents initial transfer of control and situation recovery |
| C | Vehicle cut-in conflict | Detect a vehicle cutting in from the right and execute longitudinal/lateral risk responses | Represents response to an abrupt traffic conflict |
| D | Left-curve driving | Track a left-curving road continuously while maintaining the lane | Represents sustained lateral-control demand |
| E | Lane-blockage avoidance and lane change | Identify a passable lane, change lanes to avoid the blockage, and resume stable driving | Represents route assessment and a compound maneuver |
| F | Long-straight steady driving | Maintain stable control on a straight segment with low event density | Provides an active-driving low-demand reference |
| G | Right-curve driving | Track a right-curving road continuously while maintaining the lane | Represents sustained lateral control in the opposite direction |
| I | Second takeover and obstacle avoidance | Resume control again and avoid a forward blockage | Represents repeated takeover and compound risk management |
Table 5.
Closed-set decomposition of task context and ACT-R representation under LOSO.
| Model | Input role | Accuracy | Macro-F1 | Balanced accuracy | QWK |
|---|---|---|---|---|---|
| Human-only Logistic | Individual multimodal response | 0.5857 | 0.5795 | 0.5864 | 0.6114 |
| Condition-majority | Condition-level majority prior | 0.7667 | 0.7683 | 0.7671 | 0.8161 |
| Condition-only 14-condition | Joint condition identity | 0.7667 | 0.7674 | 0.7671 | 0.8181 |
| Factorized context-only | Weather/scene identity | 0.7643 | 0.7641 | 0.7648 | 0.8179 |
| Human+Weather/Scene | Individual response + factorized identity | 0.7381 | 0.7330 | 0.7388 | 0.8048 |
| Human+14-condition | Individual response + joint identity | 0.7500 | 0.7486 | 0.7505 | 0.8092 |
| ACT-R-only | Task cognitive structure | 0.7500 | 0.7485 | 0.7507 | 0.8092 |
| Human+ACT-R | Individual response + task cognitive structure | 0.7333 | 0.7277 | 0.7341 | 0.8021 |
Table 7.
Leave-one-scene-out and locked 20-to-11 holdout results.
| Validation | Model | Accuracy | Macro-F1 | Balanced accuracy | QWK |
|---|---|---|---|---|---|
| Leave-one-scene-out | Human-only | 0.4024 | 0.2582 | 0.2551 | 0.0054 |
| Leave-one-scene-out | Human+factorized fallback | 0.2690 | 0.1902 | 0.2499 | 0.0578 |
| Leave-one-scene-out | Human+condition fallback | 0.2714 | 0.1929 | 0.2351 | 0.0019 |
| Leave-one-scene-out | Human+ACT-R | 0.5643 | 0.2590 | 0.2925 | -0.0604 |
| Locked 20-to-11 holdout | Human-only | 0.5195 | 0.5232 | 0.5175 | 0.5402 |
| Locked 20-to-11 holdout | Human+Weather/Scene | 0.7208 | 0.7206 | 0.7207 | 0.7768 |
| Locked 20-to-11 holdout | Human+14-condition | 0.7273 | 0.7287 | 0.7269 | 0.7784 |
| Locked 20-to-11 holdout | Human+ACT-R | 0.6818 | 0.6833 | 0.6802 | 0.7587 |
| Locked 20-to-11 holdout | Learned scene embedding | 0.6948 | 0.6883 | 0.6926 | 0.6724 |
Disclaimer/Publisher’s Note: The statements, opinions and data contained in all publications are solely those of the individual author(s) and contributor(s) and not of MDPI and/or the editor(s). MDPI and/or the editor(s) disclaim responsibility for any injury to people or property resulting from any ideas, methods, instructions or products referred to in the content. |
© 2026 by the authors. Licensee MDPI, Basel, Switzerland. This article is an open access article distributed under the terms and conditions of the Creative Commons Attribution (CC BY) license.
Copyright: This open access article is published under a Creative Commons CC BY 4.0 license, which permit the free download, distribution, and reuse, provided that the author and preprint are cited in any reuse.