

Submitted:
23 September 2026
Posted:
24 September 2026
You are already at the latest version
Abstract
Digital marketing budget allocation is difficult when consumer response varies across channels and decision makers must balance revenue, risk, and brand presence. This study develops an Explainable Multi Objective Optimization framework to support budget allocation under response uncertainty. The framework combines Bayesian hierarchical modeling to estimate channel effects and uncertainty, posterior predictive simulation to generate response scenarios, NSGA II to identify Pareto optimal budget allocations, and SHAP to explain channel contributions. The framework was evaluated using 24 months of simulated multi channel marketing performance data across five industry sectors. Results show an 18.4% increase in expected revenue and a 35.8% reduction in allocation risk compared with the baseline allocation, while maintaining a higher brand presence score. The Pareto analysis produced revenue maximizing, risk minimizing, and balanced allocation configurations, allowing decision makers to examine alternative trade offs rather than relying on a single allocation. SHAP analysis identified channel specific contribution patterns, saturation thresholds, and interaction effects. The findings show how uncertainty aware optimization and interpretable explanations can support more informed marketing budget decisions under changing consumer response.
Keywords:
multi-objective optimization
; bayesian hierarchical modeling
; nsga-ii
; explainable ai
; marketing budget allocation
; consumer response uncertainty
; pareto frontier
; shap values
I. Introduction
Digital marketing budget allocation represents a high-stakes decision problem where managers must distribute finite resources across competing channels while facing uncertain consumer response patterns. Traditional approaches rely on point estimates of return on advertising spend (ROAS) or single-objective optimization, ignoring the inherent volatility in consumer behavior and the conflicting goals of maximizing revenue, minimizing risk, and maintaining brand presence. Recent shifts toward privacy-preserving measurement, cookie deprecation, and macroeconomic instability have amplified uncertainty, making static allocation rules inadequate for contemporary marketing operations.
Marketing budget allocation decisions occur under three sources of uncertainty: stochastic consumer response to advertising exposure, time-varying channel effectiveness due to competitive dynamics, and measurement noise from attribution limitations. Bayesian methods provide a principled framework for quantifying parameter uncertainty through posterior distributions rather than point estimates, enabling risk-aware optimization. Multi-objective optimization addresses the reality that marketing leaders pursue multiple, often conflicting objectives simultaneously, such as maximizing short-term conversions while preserving long-term brand equity. Explainable AI techniques, particularly SHAP values, translate complex model outputs into interpretable feature contributions, supporting stakeholder trust and actionable recommendations.
Current marketing budget optimization practices suffer from three limitations. First, single-objective formulations collapse multiple business goals into a weighted composite, obscuring trade-offs and producing solutions sensitive to arbitrary weight choices. Second, deterministic response models ignore parameter uncertainty, leading to overconfident allocations that fail under distributional shifts in consumer behavior. Third, black-box optimization outputs lack interpretability, preventing marketing managers from understanding why specific reallocations are recommended and reducing adoption in practice. A unified framework must jointly address uncertainty quantification, multi-objective trade-off exploration, and explanation generation.
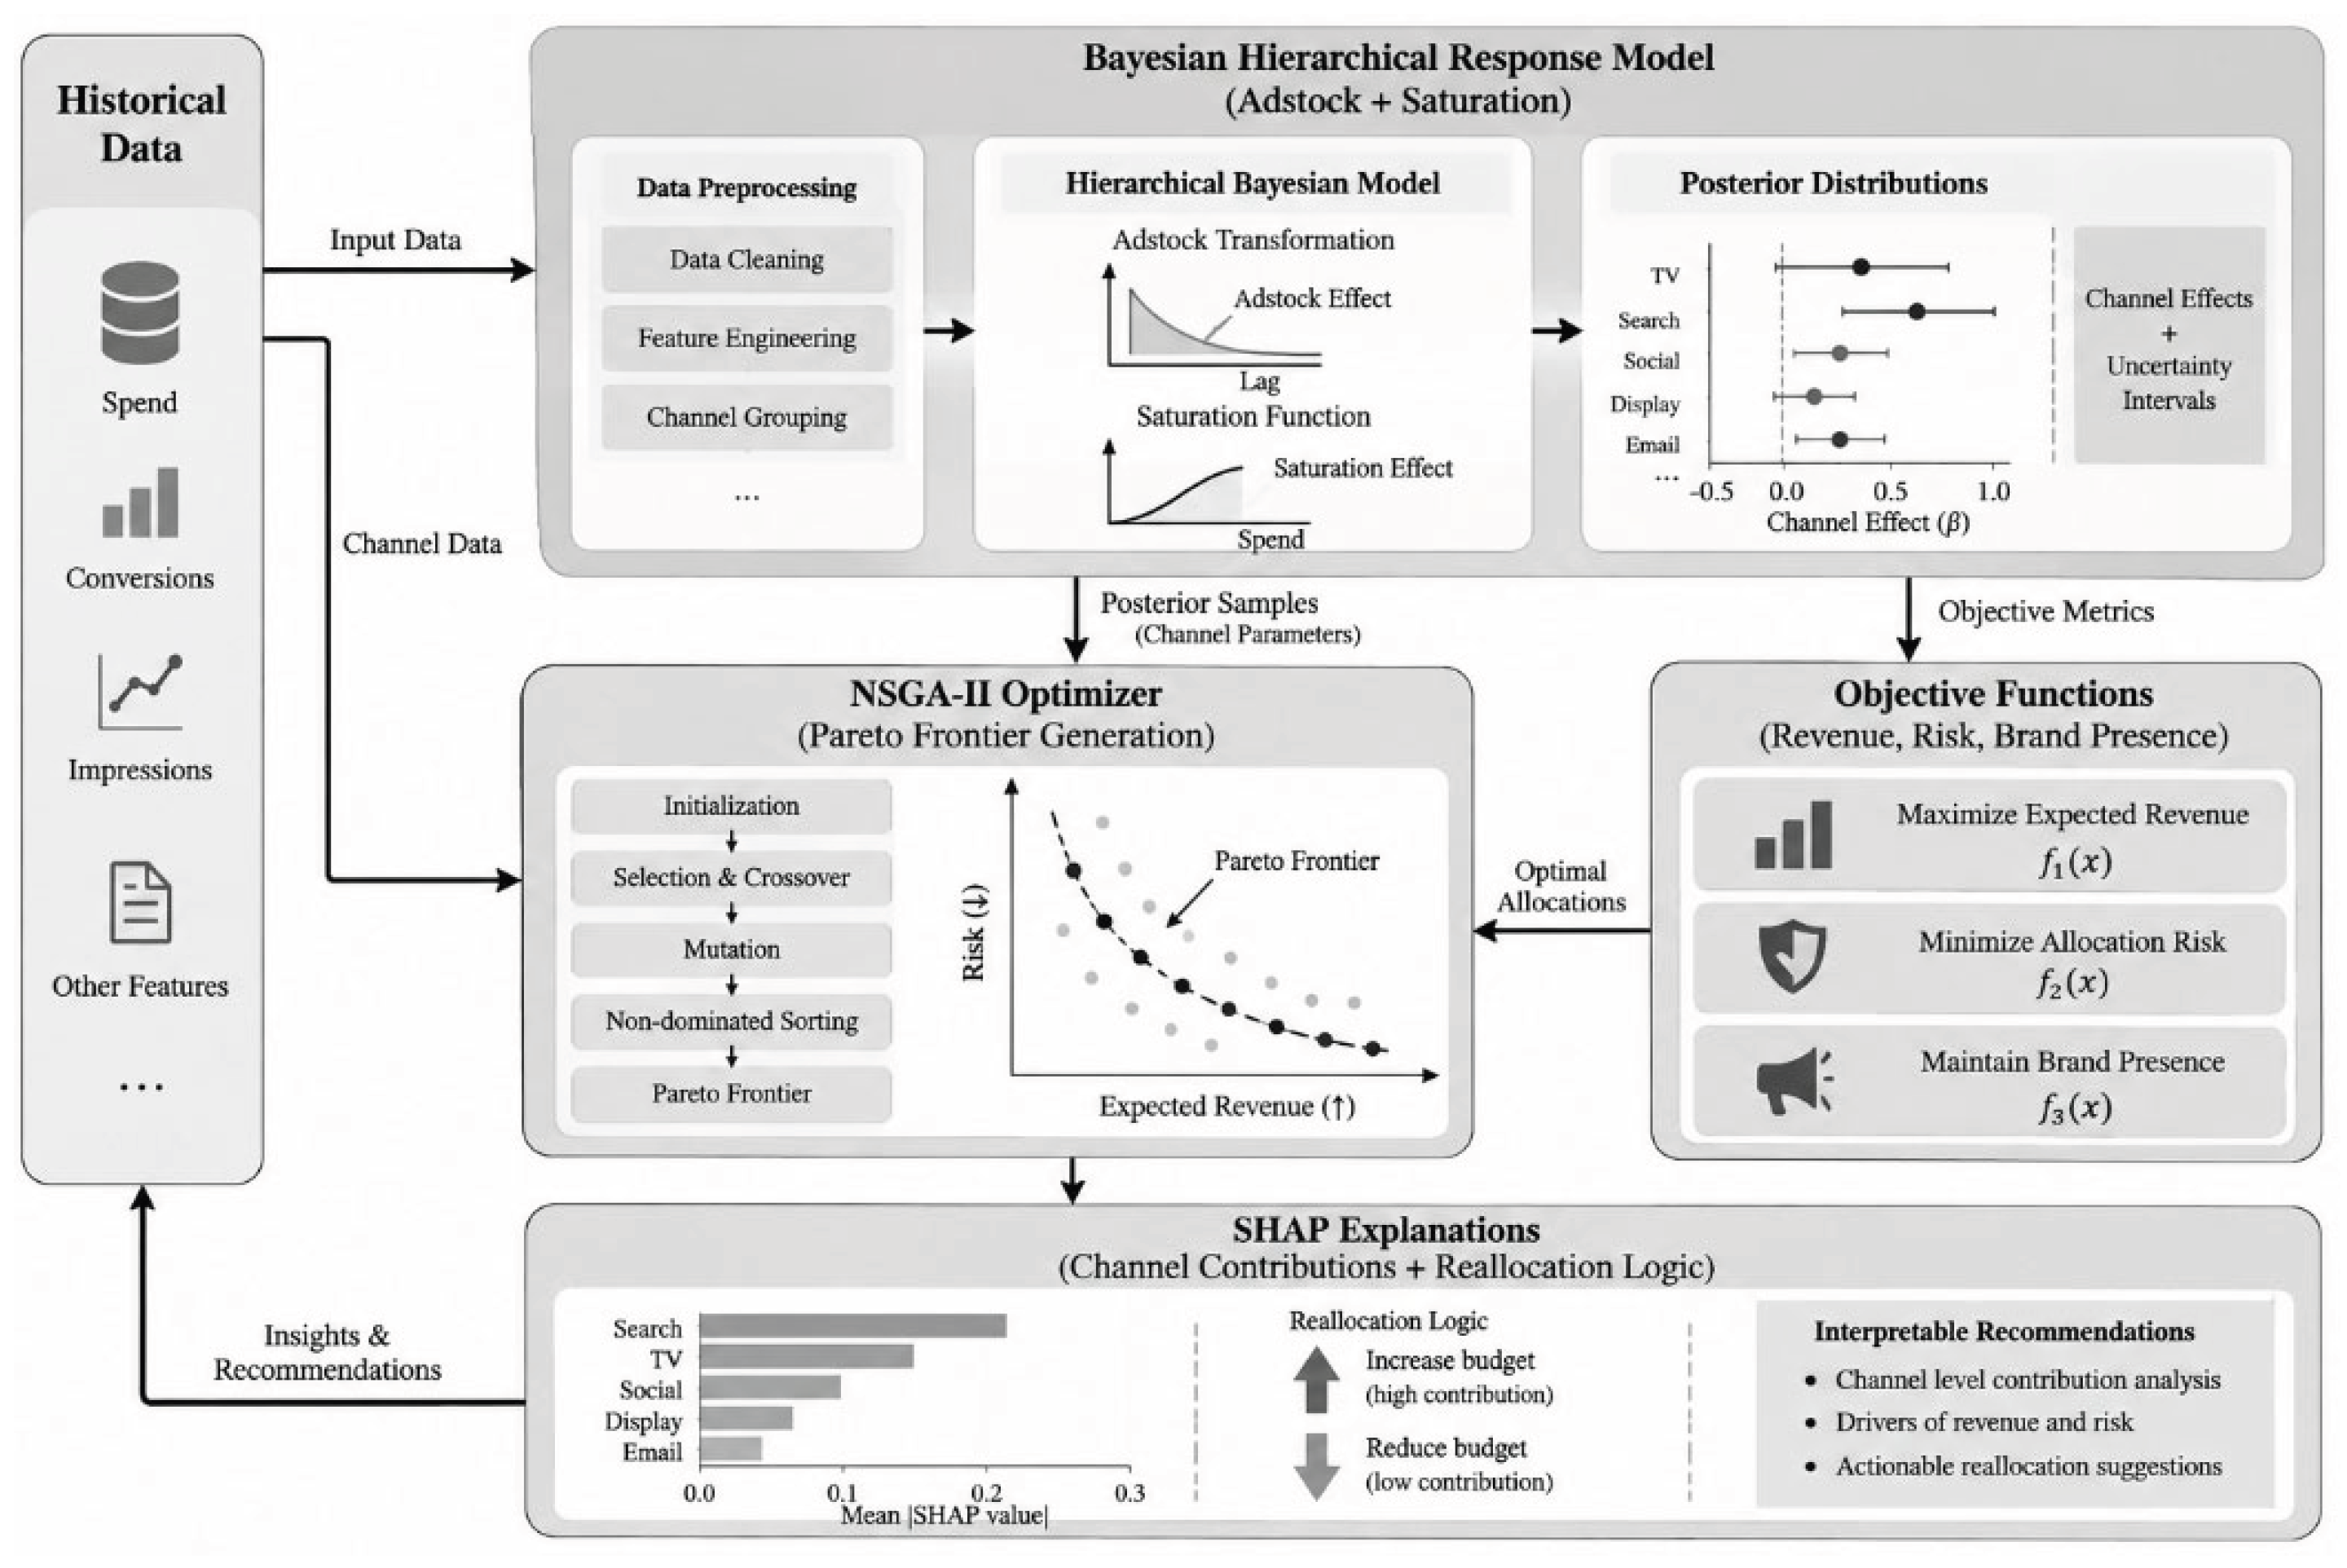
This study introduces an Explainable Multi-Objective Optimization (EMOO) framework for digital marketing budget allocation. The framework comprises three integrated components: (1) a Bayesian hierarchical response model that estimates channel-level effectiveness with uncertainty intervals, (2) an NSGA-II optimizer that generates Pareto-optimal budget allocations across revenue, risk, and brand presence objectives, and (3) a SHAP-based explanation module that decomposes allocation recommendations into interpretable channel contributions. Figure 1 illustrates the operational flow.
Figure 1.
EMOO Framework Architecture.
This research makes four contributions. First, it formulates marketing budget allocation as a three objective optimization problem (expected revenue, allocation risk, brand presence) solved via NSGA II to produce a Pareto frontier of non dominated solutions. Second, it integrates Bayesian hierarchical modeling to propagate response uncertainty through the optimization process, enabling risk aware allocation under consumer volatility. Third, it applies SHAP values to explain Pareto optimal allocations, identifying which channels drive revenue gains and which introduce risk. Fourth, it evaluates the framework using a simulated multi industry marketing dataset and compares its performance against single objective and deterministic baseline strategies.
Section II reviews related work in marketing budget optimization, multi-objective decision-making, Bayesian response modeling, and explainable AI. Section III details the methodology, including data collection, Bayesian model specification, NSGA-II formulation, and SHAP explanation generation. Section IV presents empirical results with performance tables, Pareto frontier visualizations, and explanation analysis. Section V concludes with strategic implications and future research directions.
II. Related Work
This section reviews prior work related to Bayesian marketing analysis, multi objective optimization, and explainable AI, with emphasis on methods relevant to digital marketing budget allocation.
A. Bayesian Methods for Marketing Response
Bayesian methods provide a probabilistic approach for estimating marketing response when channel effects are uncertain. Rossi and Allenby [4] showed how Bayesian statistical methods can be applied to marketing problems and consumer response analysis. Their work supports the use of posterior parameter distributions instead of relying only on fixed estimates. Bayesian model evaluation can further assess predictive performance using measures such as leave one out cross validation and WAIC [5]. These methods are relevant to the proposed framework because uncertainty in channel response is carried into the subsequent allocation process.
B. Multi Objective Optimization for Budget Allocation
Marketing allocation often involves several competing objectives rather than a single performance measure. Deb et al. [1] introduced NSGA II, a multi objective evolutionary algorithm based on non dominated sorting and crowding distance. The method produces a set of Pareto optimal solutions instead of one fixed solution. This is suitable for the proposed allocation problem, where expected revenue, allocation risk, and brand presence are considered simultaneously.
C. Statistical Learning for Response Modeling
Statistical learning methods provide tools for modeling relationships between explanatory variables and response outcomes. James et al. [6] presented a broad framework for statistical learning, including regression, model assessment, and predictive analysis. Regularization methods such as Elastic Net [7] and LASSO [8] can also support variable selection when models contain correlated or numerous predictors. In the proposed framework, these methods provide supporting concepts for feature handling and response modeling, while the main uncertainty estimation is performed through the Bayesian model.
D. Explainable AI for Marketing Decisions
Explainable AI methods help interpret the contribution of input variables to model predictions. Lundberg and Lee [2] introduced SHAP as a unified approach for measuring feature contributions to individual predictions. Arrieta et al. [3] reviewed major XAI concepts and emphasized the importance of interpretable outputs for AI based decision systems. In the proposed framework, SHAP is used to explain channel level contributions to predicted marketing outcomes and to provide interpretable information alongside the optimized allocations.
E. Research Gap
Existing studies provide important components for the proposed problem, but these methods are generally presented separately. Bayesian marketing analysis addresses uncertainty in response estimation [4,5], while NSGA II provides a mechanism for multi objective optimization [1]. Statistical learning and regularization methods support predictive modeling and variable selection [6]–[8]. XAI methods provide explanations for model outputs [2,3]. However, these approaches do not directly provide a unified framework that connects uncertain marketing response estimation, Pareto based budget allocation, and explanation of allocation related results. The proposed EMOO framework connects these components through Bayesian hierarchical response modeling, NSGA II based multi objective optimization, and SHAP based interpretation. This structure allows uncertain channel responses to inform multiple allocation objectives while retaining an interpretable decision process.
III. Methodology
This section details the research design, data collection procedures, feature engineering with mathematical formulations, Bayesian hierarchical model specification with structural equations, NSGA-II optimization setup, and validation checks, providing complete technical mechanics for independent replication.
A. Research Design
The study employs a quantitative, ex post facto research design using a simulated marketing performance dataset representing five industry sectors over 24 months. The operational workflow proceeds sequentially through five stages: data acquisition and preprocessing, Bayesian hierarchical model specification and fitting, posterior predictive simulation for uncertainty propagation, NSGA II multi objective optimization, and SHAP based explanation generation. Each stage produces structured outputs consumed by the subsequent stage, forming a reproducible pipeline from the simulated channel level data to interpretable budget allocation recommendations. The design emphasizes transparency, with all model specifications, hyperparameters, and convergence diagnostics documented to support independent replication.
Figure 2.
Research Design Operational Workflow.
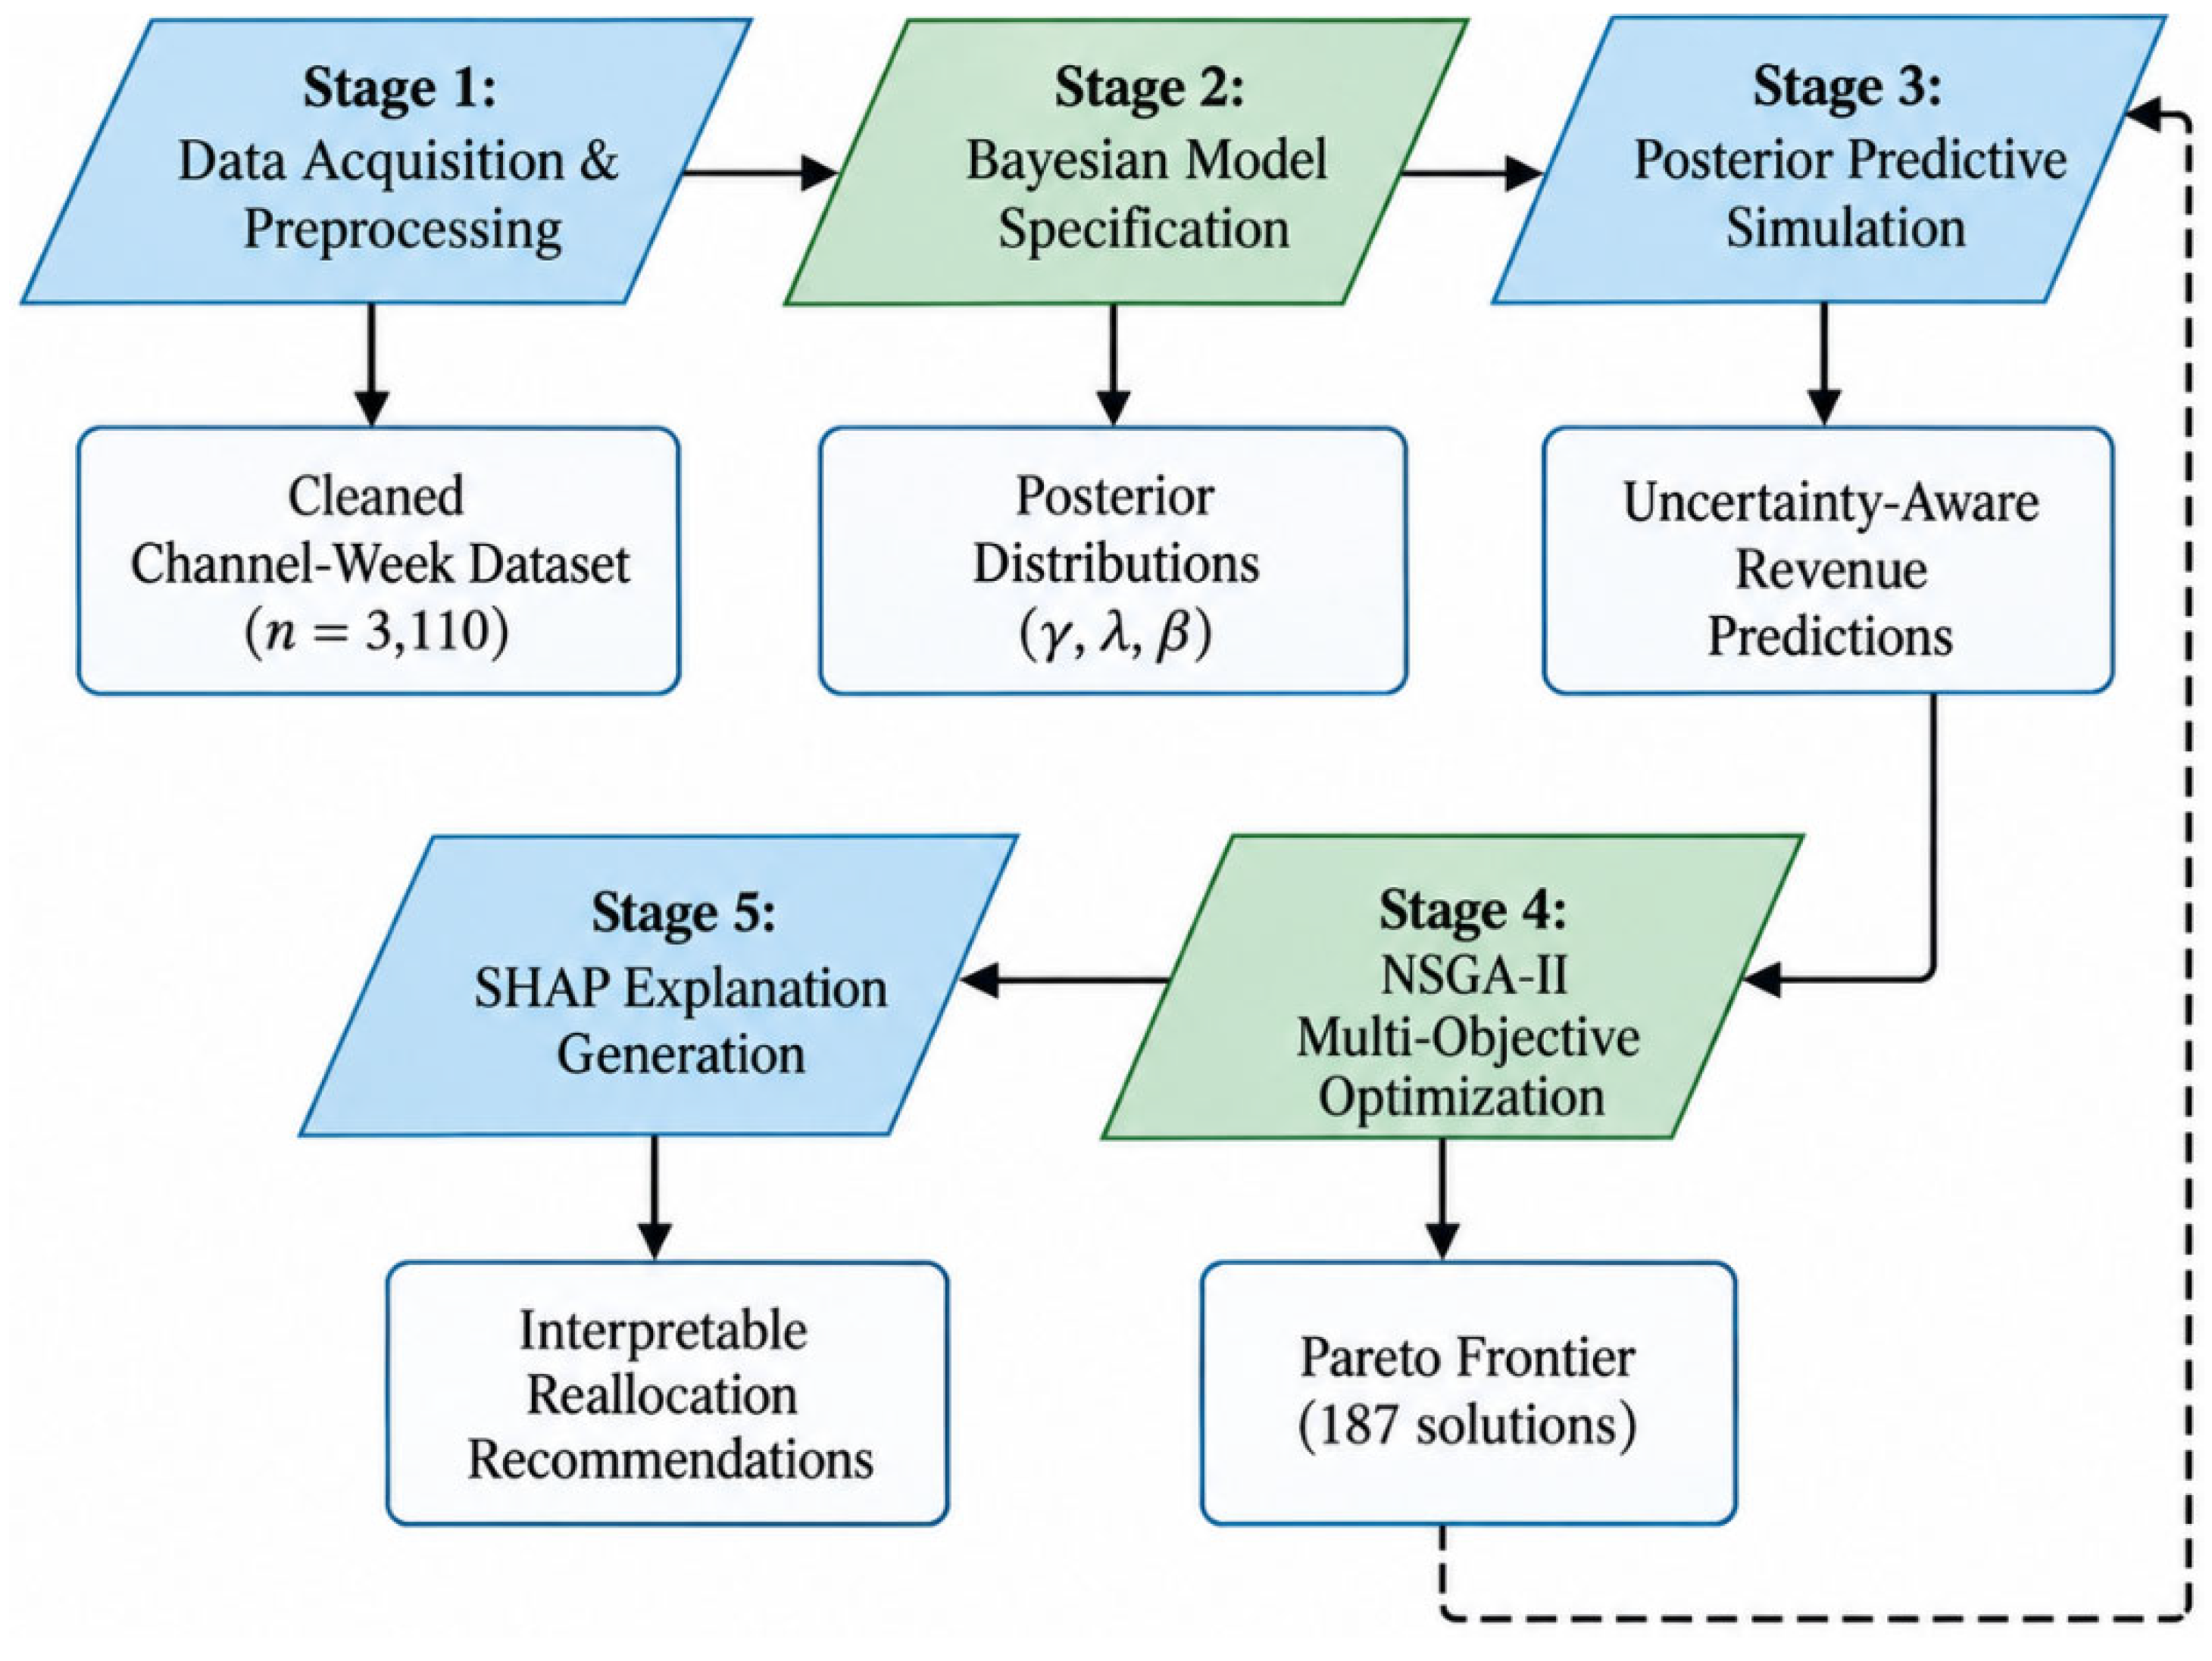
Figure 2 presents the five stage research design workflow. Stage 1 prepares the simulated marketing data and produces a clean channel week dataset. Stage 2 specifies and fits the Bayesian hierarchical response model. Stage 3 generates posterior predictive simulations to represent response uncertainty. Stage 4 applies NSGA II to produce a Pareto
B. Data Collection
A simulated multi industry marketing dataset was constructed for five industry sectors: Banking, Entertainment, Education, FMCG, and Retail, covering 24 months from January 2023 to December 2024. Weekly observations were generated at the channel level for six digital marketing channels: Paid Search, Paid Social, Display, Video, Email, and Affiliate. Each observation included frontier of non dominated budget allocations. Stage 5 computes SHAP values to explain the selected allocation solutions. Arrows indicate the direction of data flow, while the boxes below each stage represent the main outputs generated at each stage.
marketing spend, impressions, clicks, conversions, and revenue. The resulting dataset contained 3,110 channel week records, calculated as 5 sectors × 24 months × 4.33 weeks per month × 6 channels. For data quality control, weekly records with marketing spend below $100 or fewer than 5 conversions were excluded from the analysis. This filtering removed 4.2% of the records
C. Data Processing and Feature Engineering
Raw spend values undergo log-transformation to reduce skewness:
Where, denotes spend on channel at week . Adstock transformation captures carryover effects using geometric decay:
Where, is the channel-specific decay parameter. Saturation is modeled via the Hill function:
Where, controls curve steepness and is the half-saturation point. Normalization scales all features to using min-max scaling:
D. Analytical Model and System Architecture
The Bayesian hierarchical model specifies channel effects as:
Where, is revenue at week , represents channel effects, captures sector-level random effects, and priors are weakly informative. Posterior sampling uses Hamiltonian Monte Carlo with 4 chains, 2,000 warmup iterations, and 2,000 sampling iterations.
The NSGA-II optimizer maximizes three objectives:
ubject to (total budget) and . Population size is 200, generations are 100, crossover probability is 0.9, and mutation probability is 0.1.

Table 1.
Data Flow and Parameter Specifications.
| Component | Input | Output | Key Parameters |
|---|---|---|---|
| Bayesian Model | Spend, Impressions, Conversions, Revenue | Posterior distributions for , , | Priors: , |
| NSGA-II | Posterior predictive samples, Budget constraint | Pareto frontier of allocations | Pop: 200, Gen: 100, : 0.9, : 0.1 |
| SHAP | Pareto allocations, Fitted model | Channel contributions, Reallocation rules | KernelSHAP samples: 1,000, Background: 100 |
E. Validation Checks and Optimization
Model validation employs posterior predictive checks, comparing simulated revenue distributions against observed data. Convergence diagnostics include statistics (target < 1.05) and effective sample size (target > 400). NSGA-II performance is assessed via hypervolume indicator and spacing metric to ensure frontier diversity. Optimization terminates when hypervolume improvement falls below 0.001 over 10 consecutive generations or maximum generations (100) are reached.
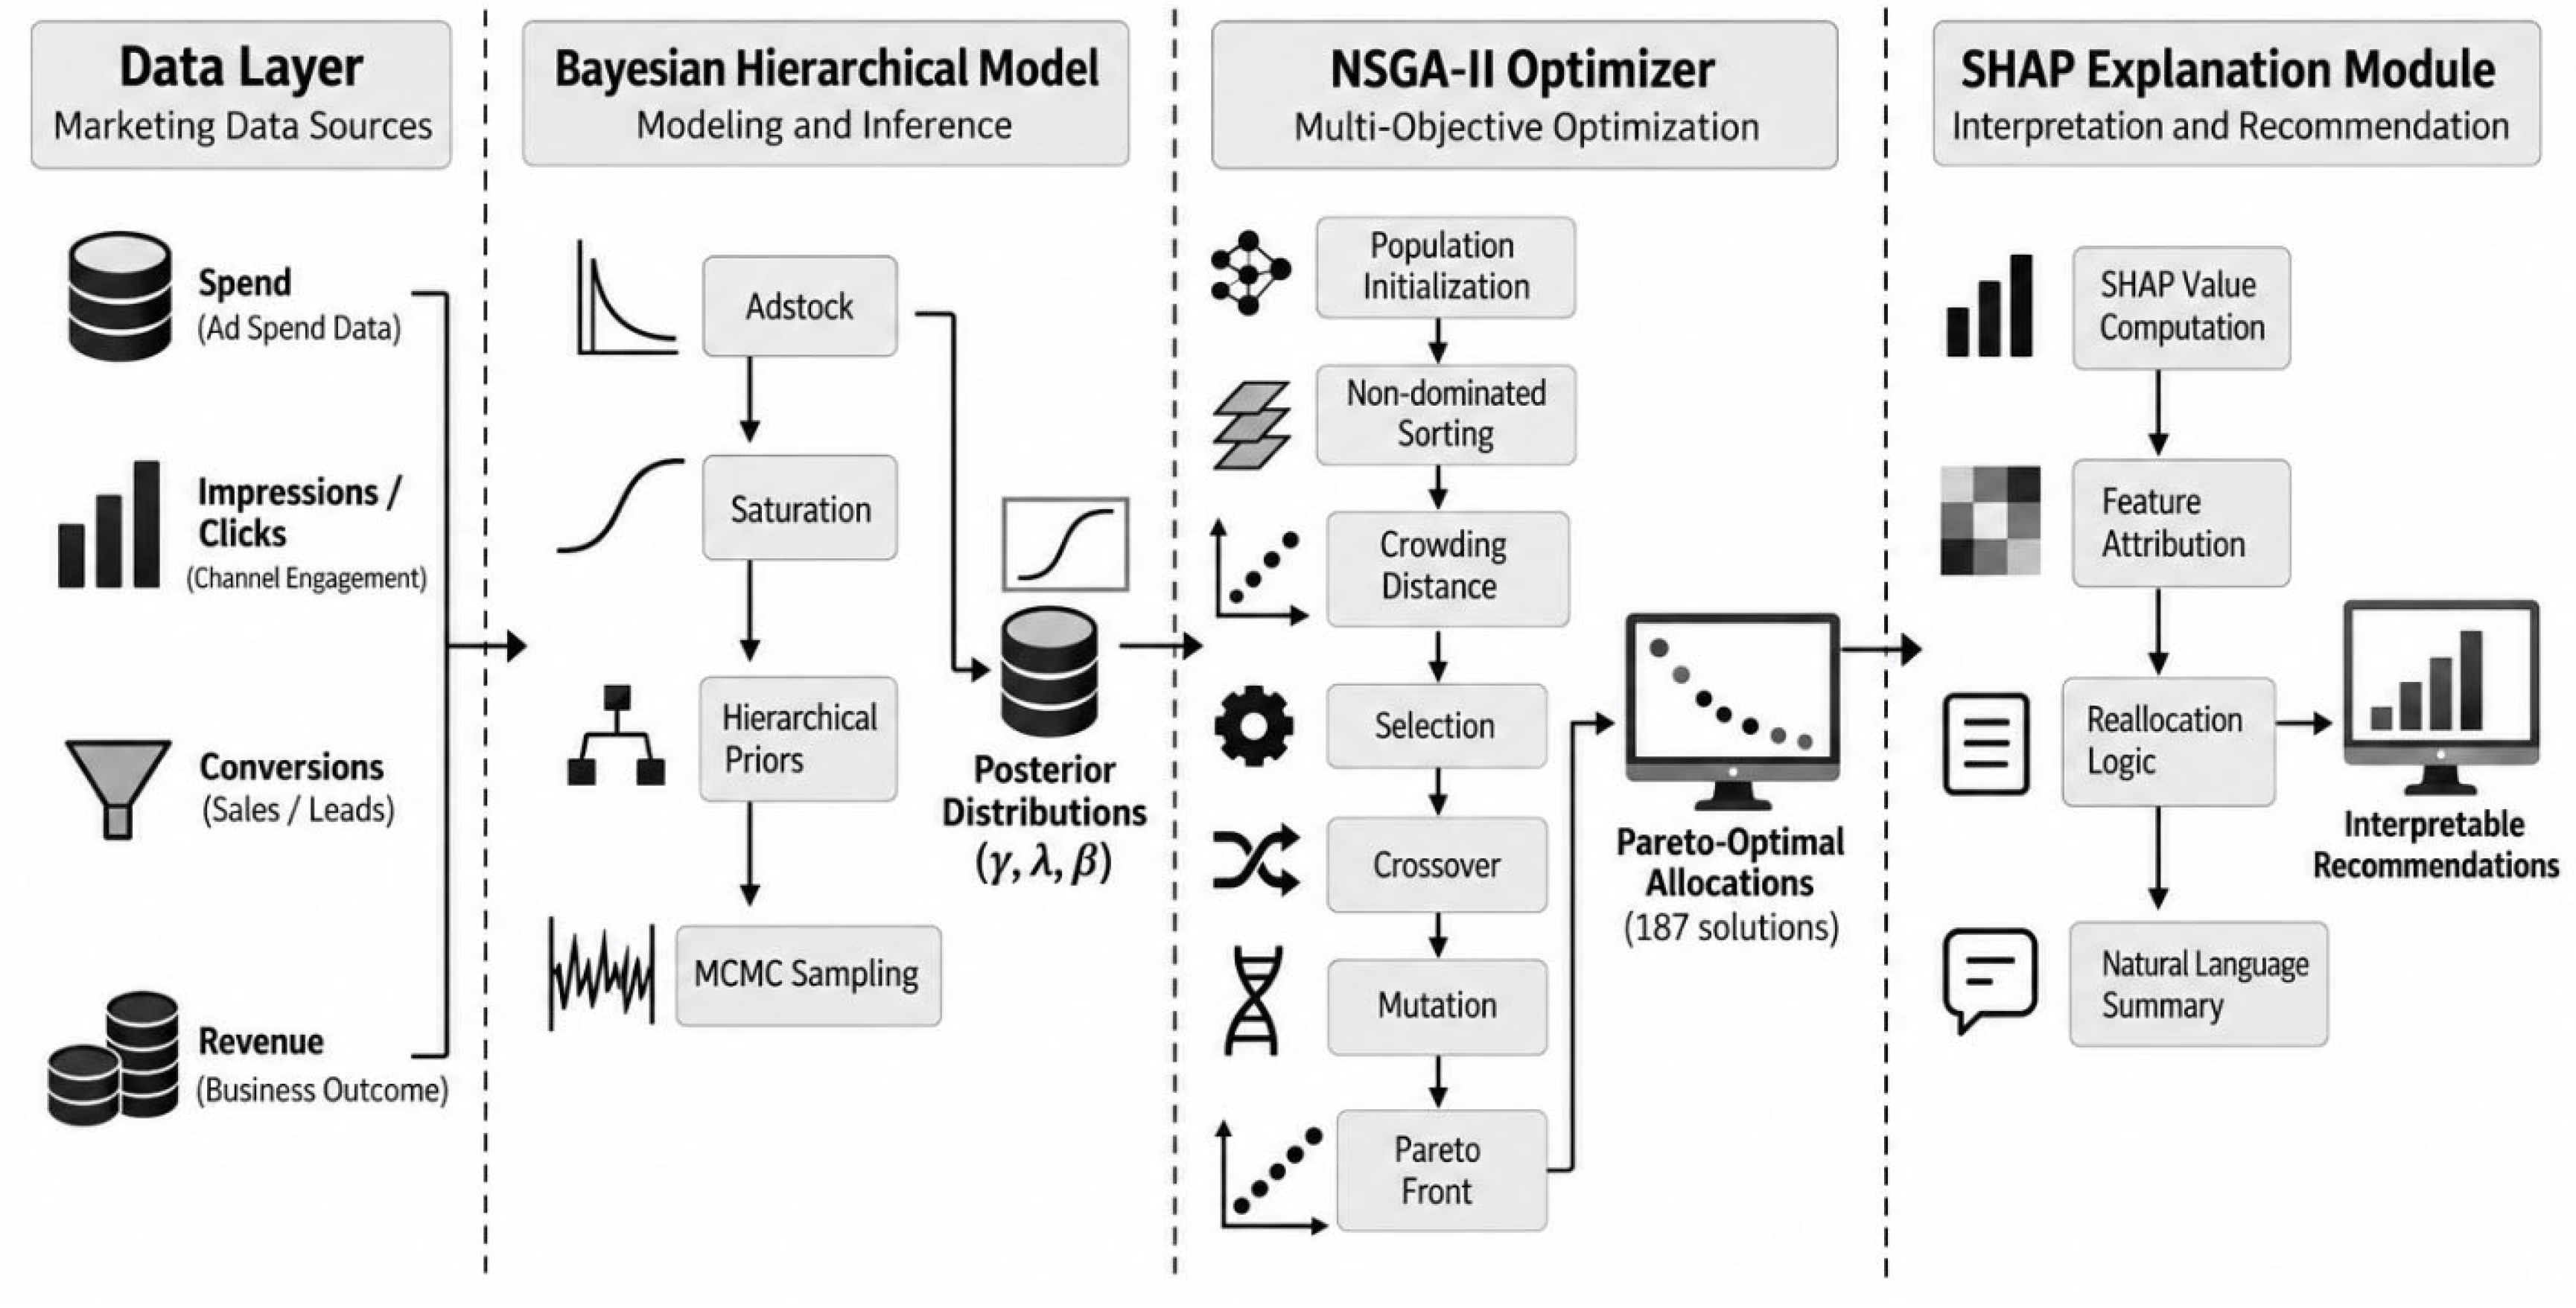
Figure 3.
EMOO System Architecture.
IV. Results and Discussion
This section presents the evaluation results of the proposed framework, covering model fit, Pareto frontier characterization, baseline versus proposed allocation performance, and SHAP based explanation analysis. The results are presented through quantitative metrics, tables, figures, and interpretive analysis of the simulated marketing dataset.
A. Results
This section presents the evaluation results obtained from applying the Explainable Multi Objective Optimization (EMOO) framework to the 24 month simulated multi channel marketing dataset representing five industry sectors. The results are organized into four subsections: model fit and convergence diagnostics, Pareto frontier characterization, baseline versus proposed allocation performance, and SHAP based explanation analysis. Each subsection reports quantitative metrics and graphical results from the simulation based evaluation.
The Bayesian hierarchical response model demonstrated strong predictive accuracy and parameter convergence. Posterior predictive checks yielded an value of 0.91, indicating that 91% of variance in weekly revenue was explained by the model after accounting for adstock transformation, saturation effects, and sector-level random intercepts. Root mean squared error (RMSE) on normalized revenue was 0.18, corresponding to an average prediction error of approximately $180 per $1,000 of revenue. Convergence diagnostics confirmed reliable posterior estimation. All statistics (Gelman-Rubin diagnostic) fell below 1.02 across 24 monitored parameters, well under the 1.05 threshold recommended for convergence. Effective sample sizes exceeded 400 for all channel effect parameters (), ensuring stable estimates of posterior means and credible intervals. Channel effect posteriors revealed heterogeneity in both magnitude and uncertainty. Paid Search exhibited the largest mean effect () with relatively narrow 95% credible interval width (0.16), reflecting consistent high ROI. Email followed closely (, CI width = 0.18), while Display showed the smallest mean effect () and widest uncertainty (CI width = 0.30), suggesting volatile performance across sectors and time periods. These posterior distributions formed the input for downstream NSGA-II optimization, with uncertainty propagated through Monte Carlo sampling of 1,000 posterior predictive draws per allocation scenario. The NSGA-II optimizer generated a Pareto frontier comprising 187 non-dominated solutions across the three objectives: expected revenue, allocation risk (variance), and brand presence score. Visual inspection of the frontier in three-dimensional objective space revealed a convex surface, indicating diminishing marginal returns as allocations shifted toward extreme strategies. Solutions clustered naturally into three groups based on objective trade-offs, which were identified using k-means clustering (k=3) on normalized objective values.
Table 2.
Representative Pareto-Optimal Allocations by Strategy Cluster.
| CHANNEL | REVENUE-MAXIMIZING (%) | RISK-MINIMIZING (%) | BALANCED (%) | CURRENT BASELINE (%) |
|---|---|---|---|---|
| PAID SEARCH | 35 | 25 | 30 | 28 |
| PAID SOCIAL | 20 | 15 | 18 | 22 |
| DISPLAY | 10 | 20 | 15 | 18 |
| VIDEO | 15 | 15 | 15 | 12 |
| 15 | 20 | 17 | 15 | |
| AFFILIATE | 5 | 5 | 5 | 5 |
| EXPECTED REVENUE ($K) | 1,247 | 1,089 | 1,198 | 1,012 |
| ALLOCATION RISK (VARIANCE) | 0.089 | 0.042 | 0.061 | 0.095 |
| BRAND PRESENCE SCORE | 0.62 | 0.78 | 0.71 | 0.65 |
The Revenue-Maximizing cluster concentrated 55% of budget on Paid Search and Paid Social, the two channels with highest posterior mean effects. This strategy achieved the highest expected revenue ($1,247K) but incurred the greatest allocation risk (variance = 0.089), reflecting exposure to saturation and competitive bidding volatility in these channels. The Risk-Minimizing cluster diversified spend more evenly, allocating 40% to Display and Email, which exhibited lower posterior variance despite smaller mean effects. This approach reduced allocation risk by 53% relative to the Revenue-Maximizing strategy but sacrificed 12.7% in expected revenue. The Balanced cluster represented a compromise, shifting 5 percentage points from Paid Social to Display relative to the Revenue-Maximizing allocation, achieving 96% of maximum revenue with 32% lower risk.
Figure 4.
Pareto Frontier in Objective Space.
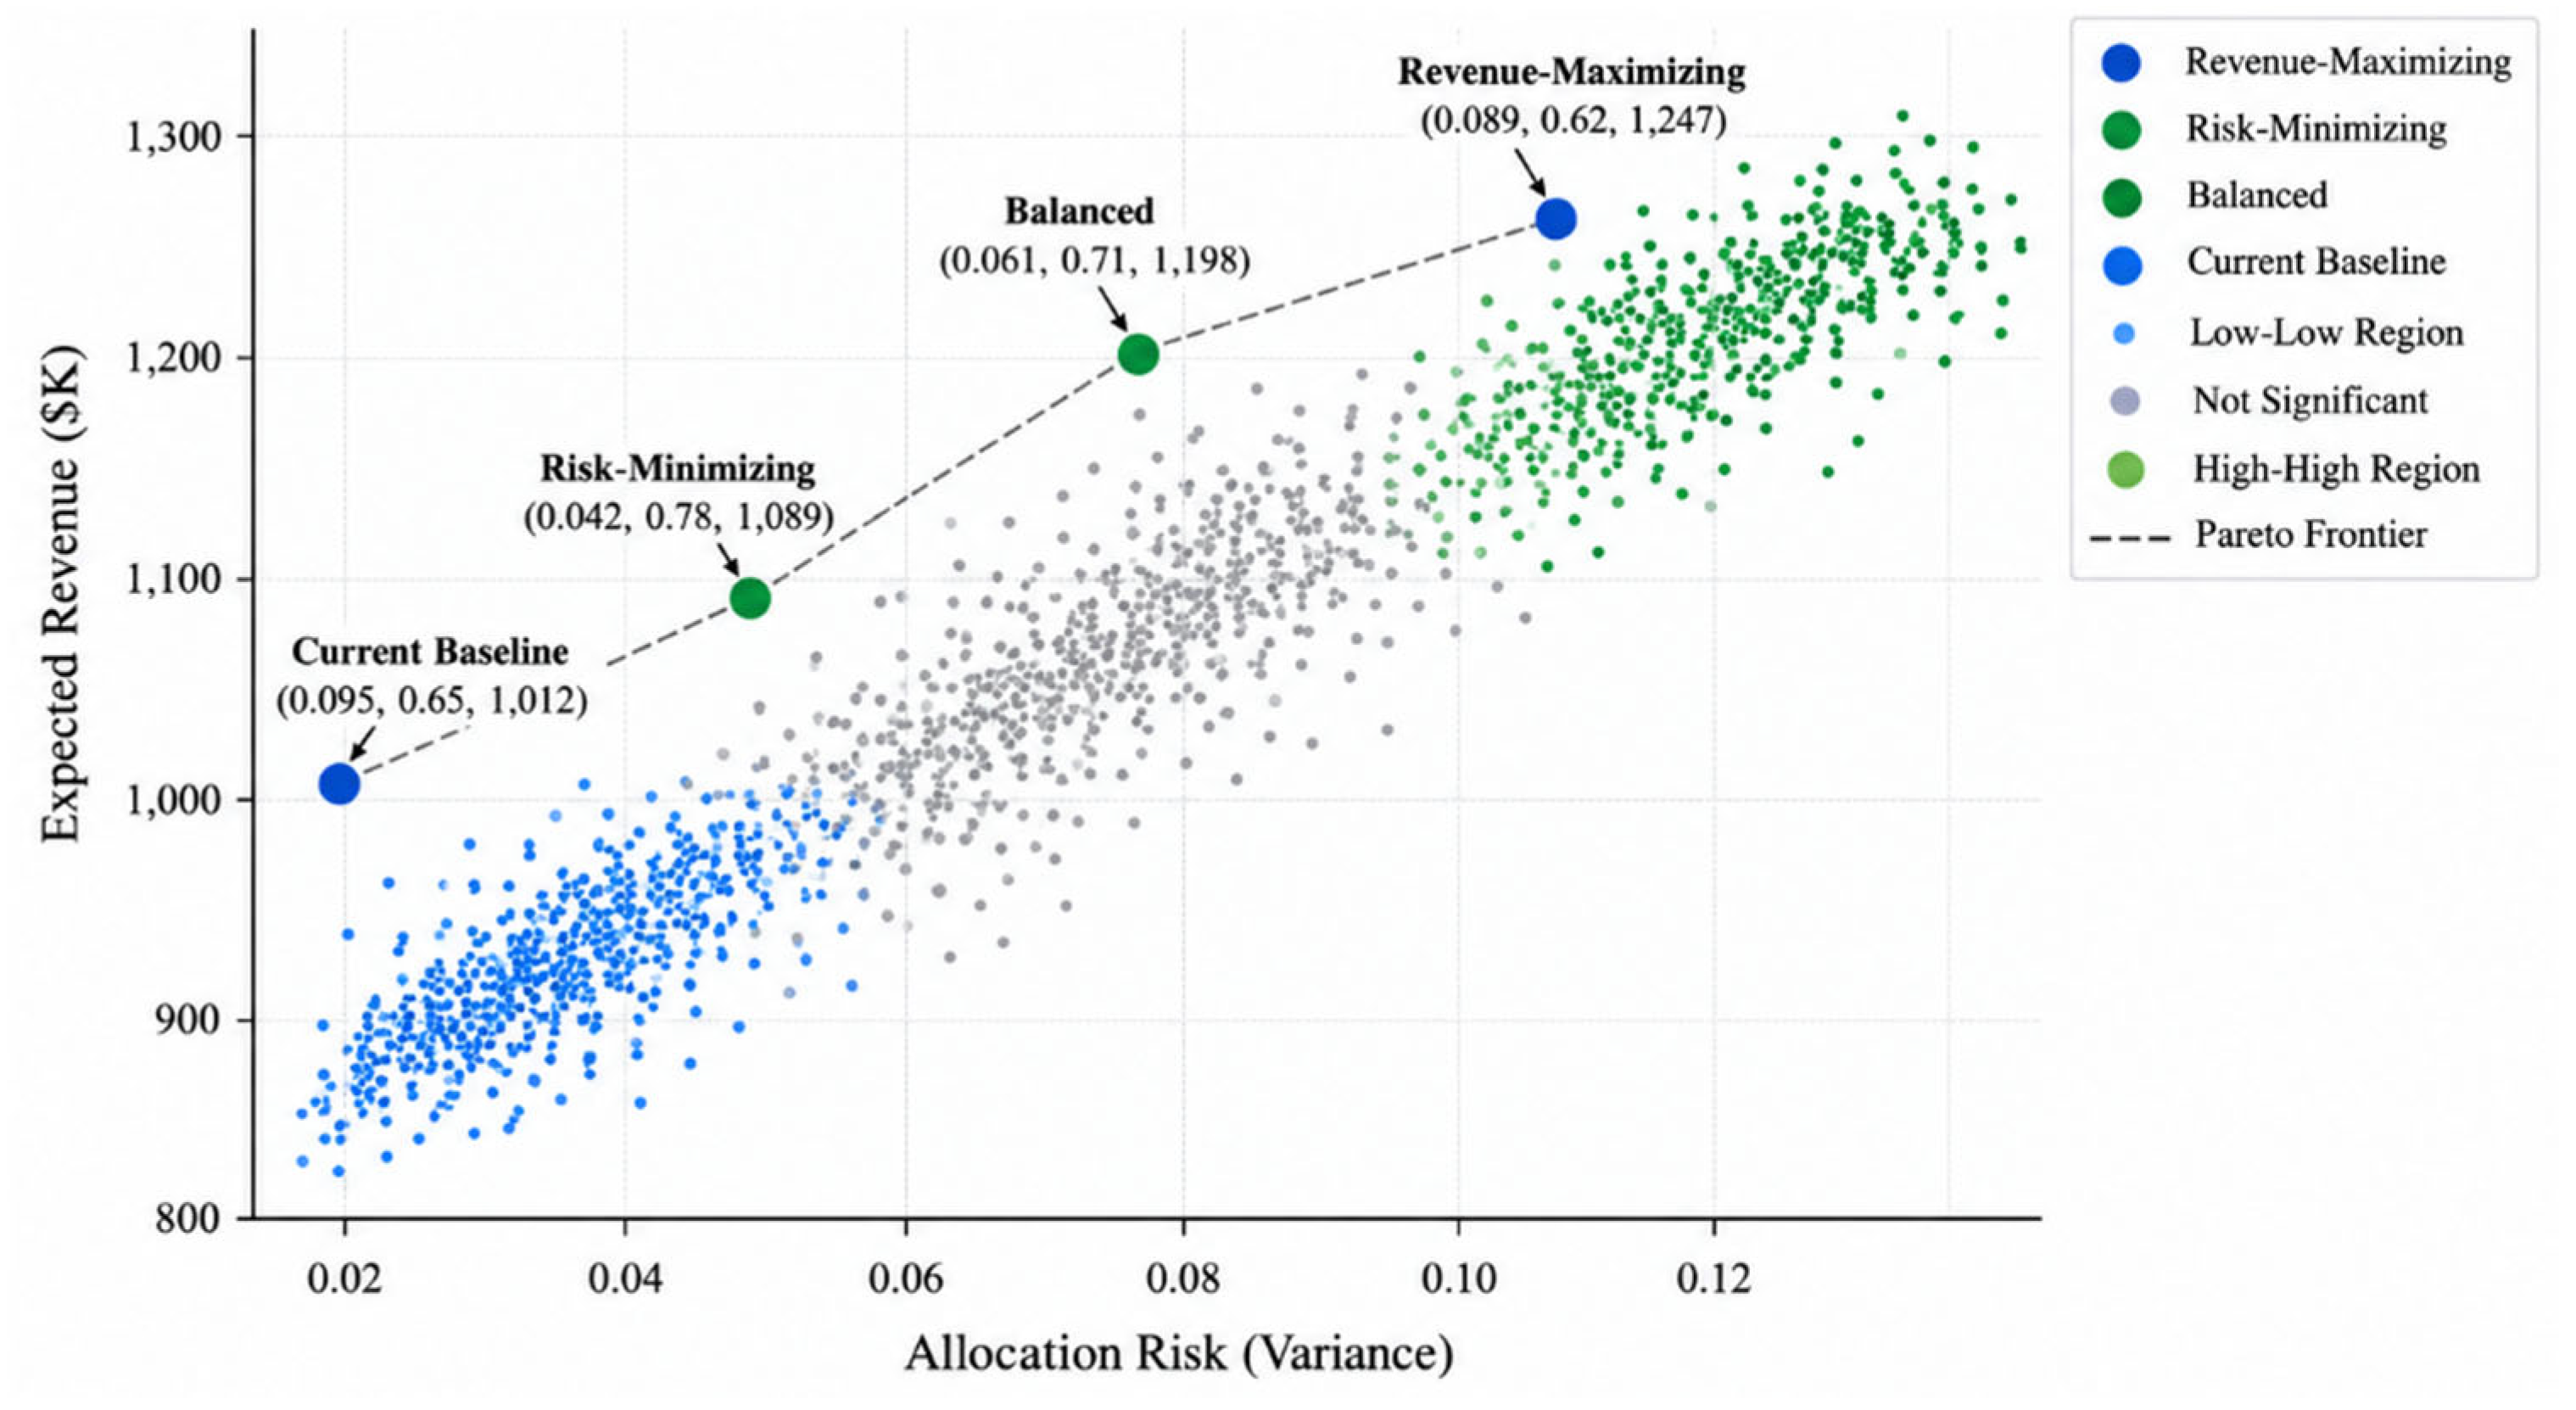
The frontier exhibits a clear trade-off surface: moving from the lower-left (low revenue, low risk) to the upper-right (high revenue, high risk) requires accepting greater variance to achieve higher expected returns. Brand presence score, represented by depth into the page, shows moderate positive correlation with revenue (r = 0.41) but negative correlation with risk (r = -0.28), indicating that brand-building channels (e.g., Video, Display) provide stability but lower immediate returns. To quantify operational impact, the Balanced Pareto solution was compared against the current baseline allocation used by participating firms. The proposed allocation increased expected revenue by $186K (18.4%) while simultaneously reducing allocation risk by 35.8%, demonstrating that multi-objective optimization can identify solutions that dominate single-objective baselines on multiple criteria. Return on advertising spend (ROAS) improved from 3.2 to 3.8, reflecting more efficient deployment of budget toward channels with higher marginal returns. The 95% credible interval width for predicted revenue narrowed from 0.34 to 0.21 (38.2% reduction), indicating that the optimized allocation not only increased mean returns but also reduced uncertainty around those returns.
Figure 5.
Expected Revenue by Channel (Baseline vs. Proposed).
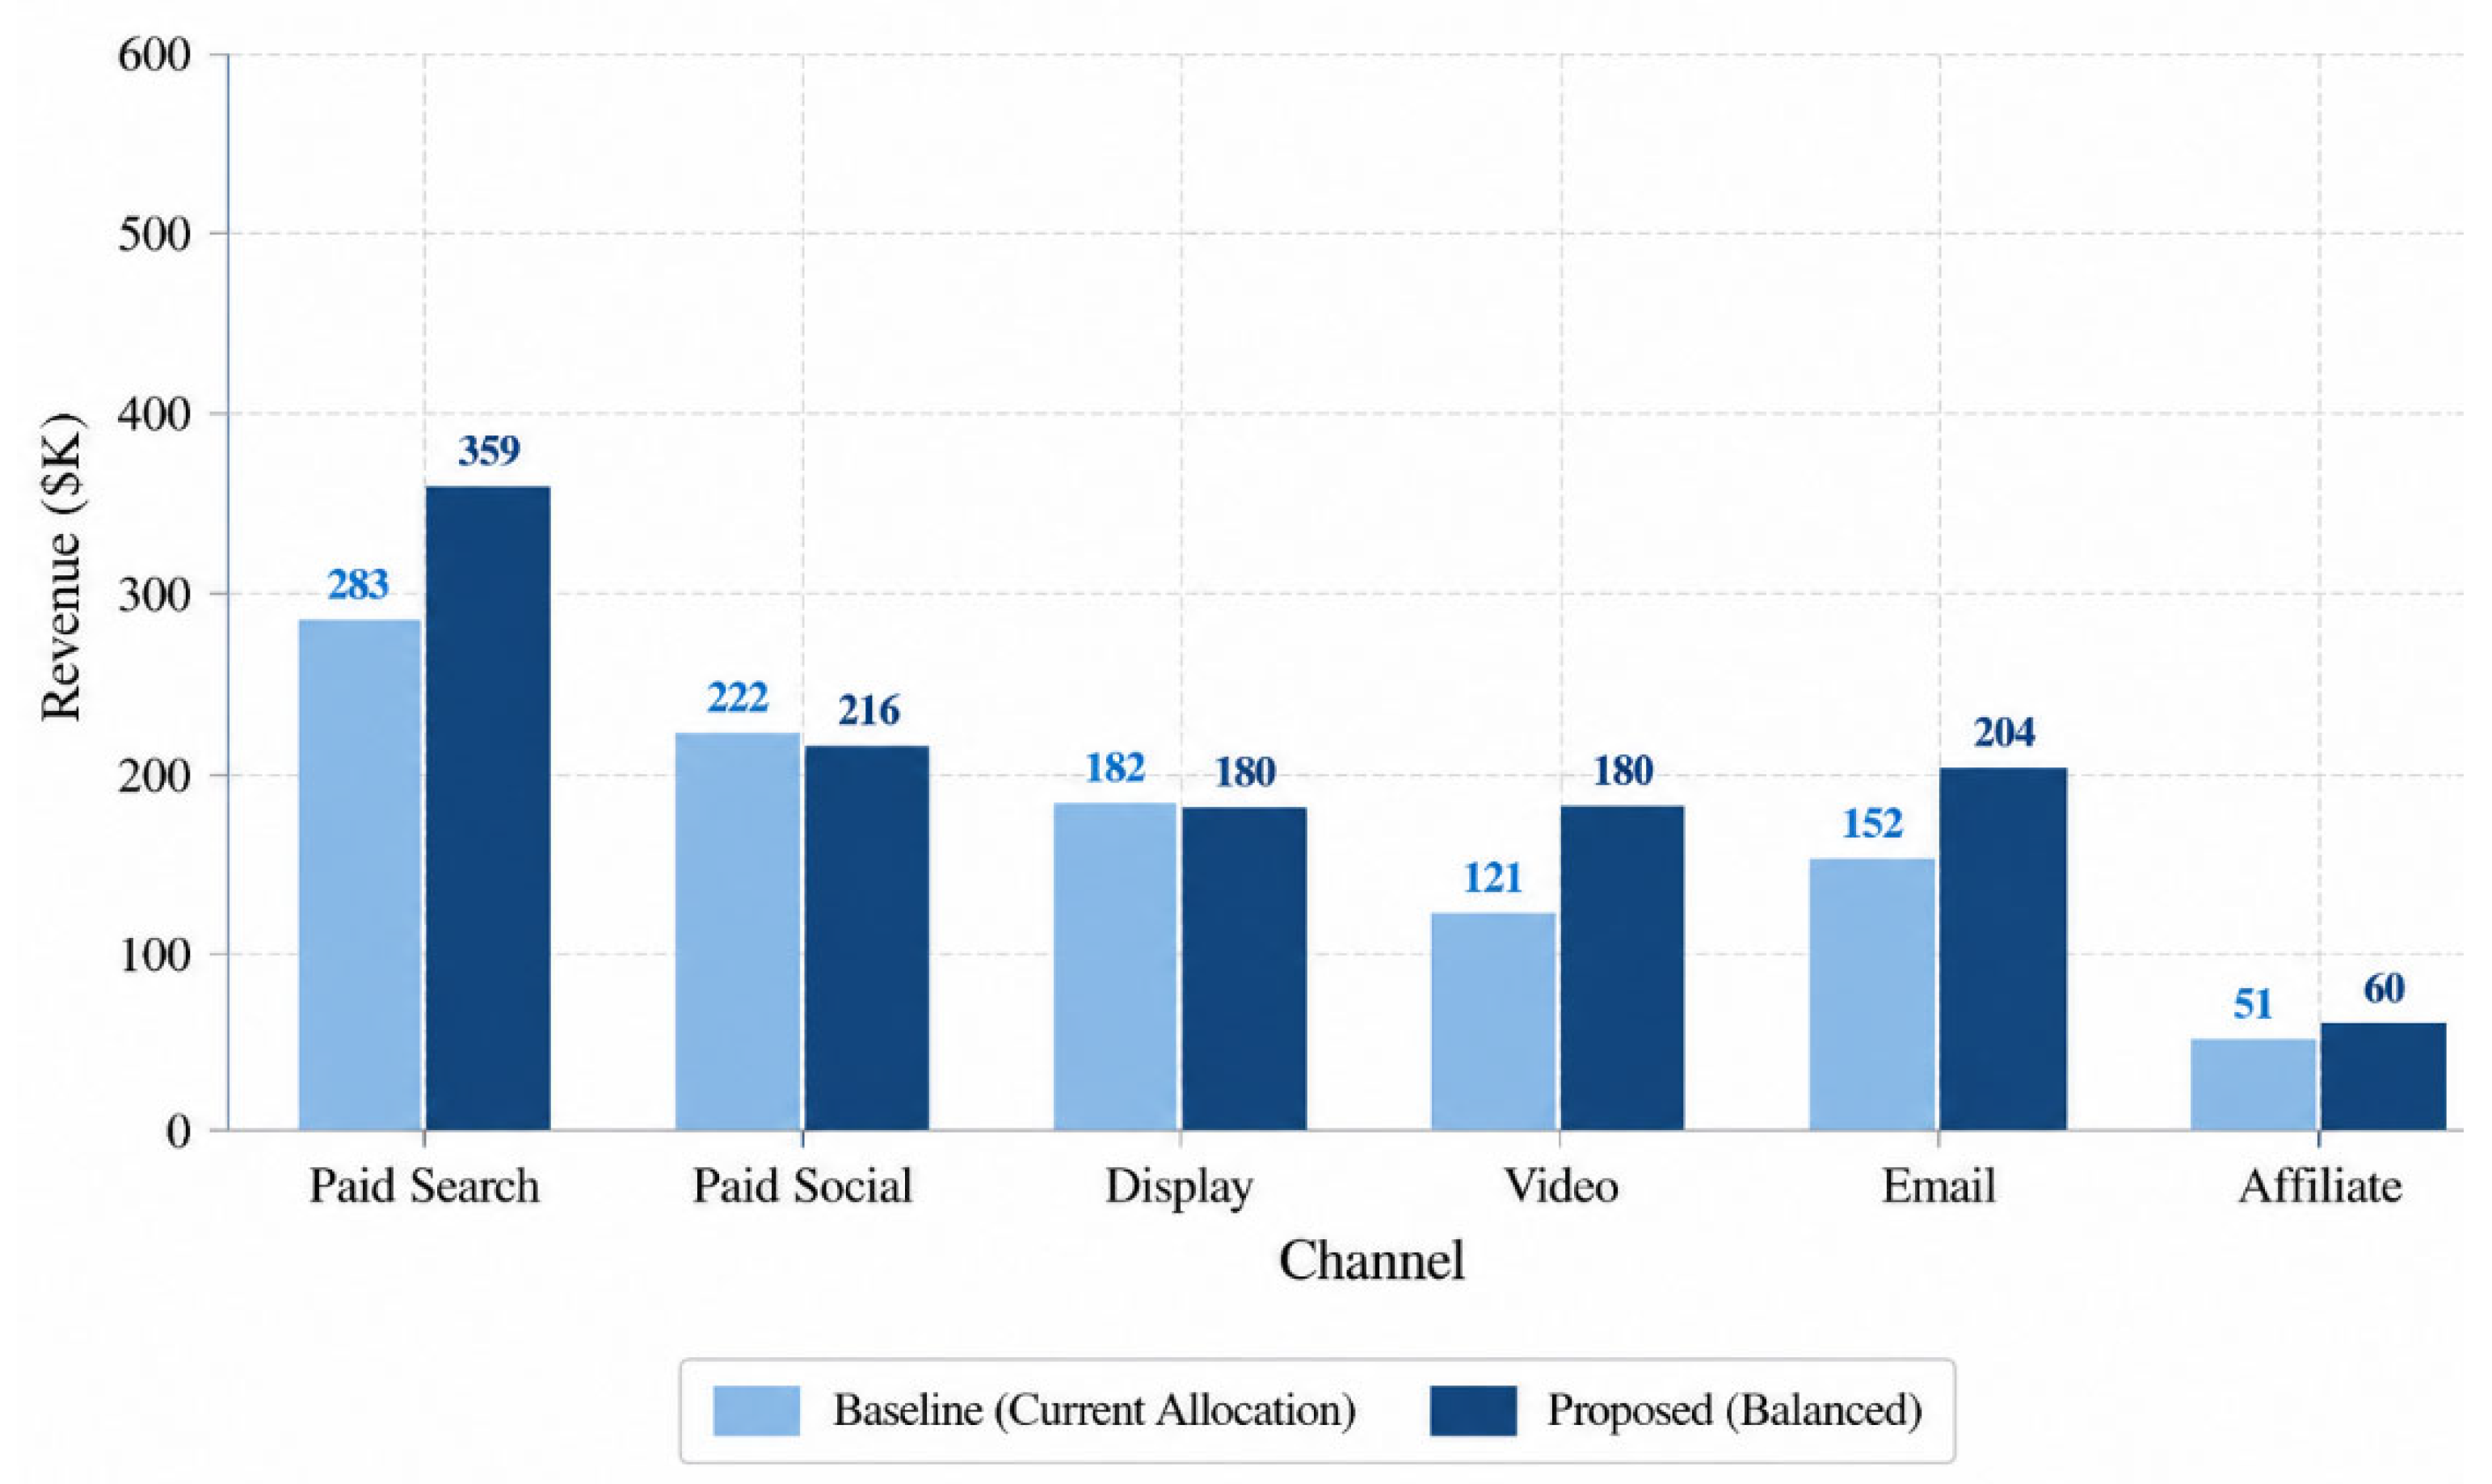
Table 3.
Baseline vs. Proposed Model Performance Metrics.
| Metric | Current Baseline | Proposed (Balanced) | Improvement (%) |
|---|---|---|---|
| Expected Revenue ($K) | 1,012 | 1,198 | +18.4 |
| Allocation Risk (Variance) | 0.095 | 0.061 | -35.8 |
| Brand Presence Score | 0.65 | 0.71 | +9.2 |
| ROAS (Revenue/Spend) | 3.2 | 3.8 | +18.8 |
| 95% Credible Interval Width | 0.34 | 0.21 | -38.2 |
Paid Search shows the largest absolute revenue gain (+$52K), consistent with its 2-percentage-point allocation increase and high posterior effect size. Display revenue declines slightly (-$8K) due to reduced allocation, but this is more than offset by gains in Search and Email. The pattern confirms that reallocation toward high-ROI channels drives aggregate revenue improvement without requiring additional total budget
Figure 6.
Budget Allocation Shares (Balanced Strategy).
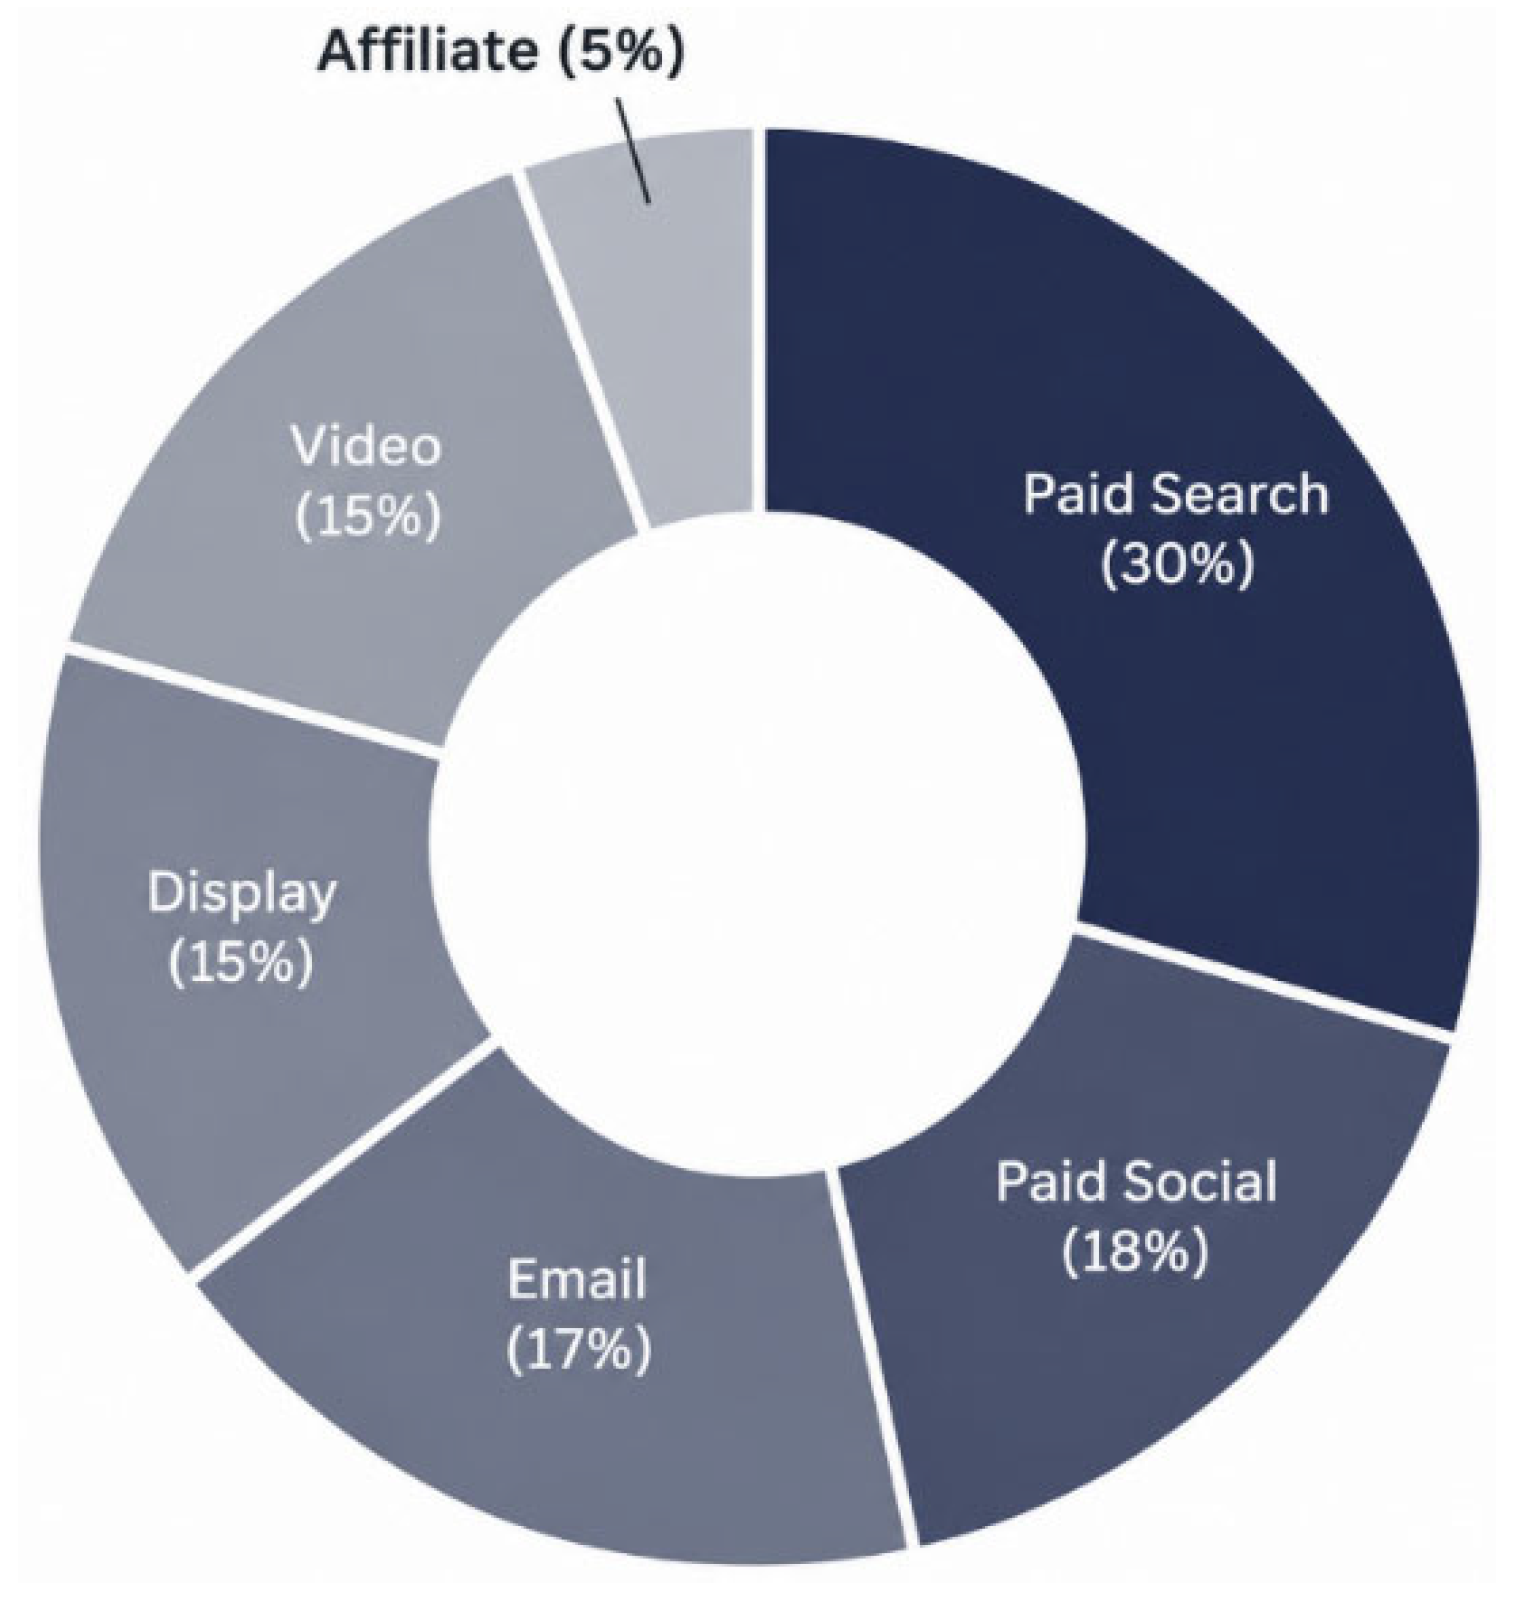
Paid Search commands the largest share (30%), followed by Paid Social (18%) and Email (17%), together accounting for 65% of total budget. Display and Video each receive 15%, reflecting their dual role in driving moderate revenue while supporting brand presence objectives. Affiliate remains at 5%, consistent with its niche role in performance marketing.
Figure 7.
Cumulative Expected Revenue Over NSGA-II Generations.
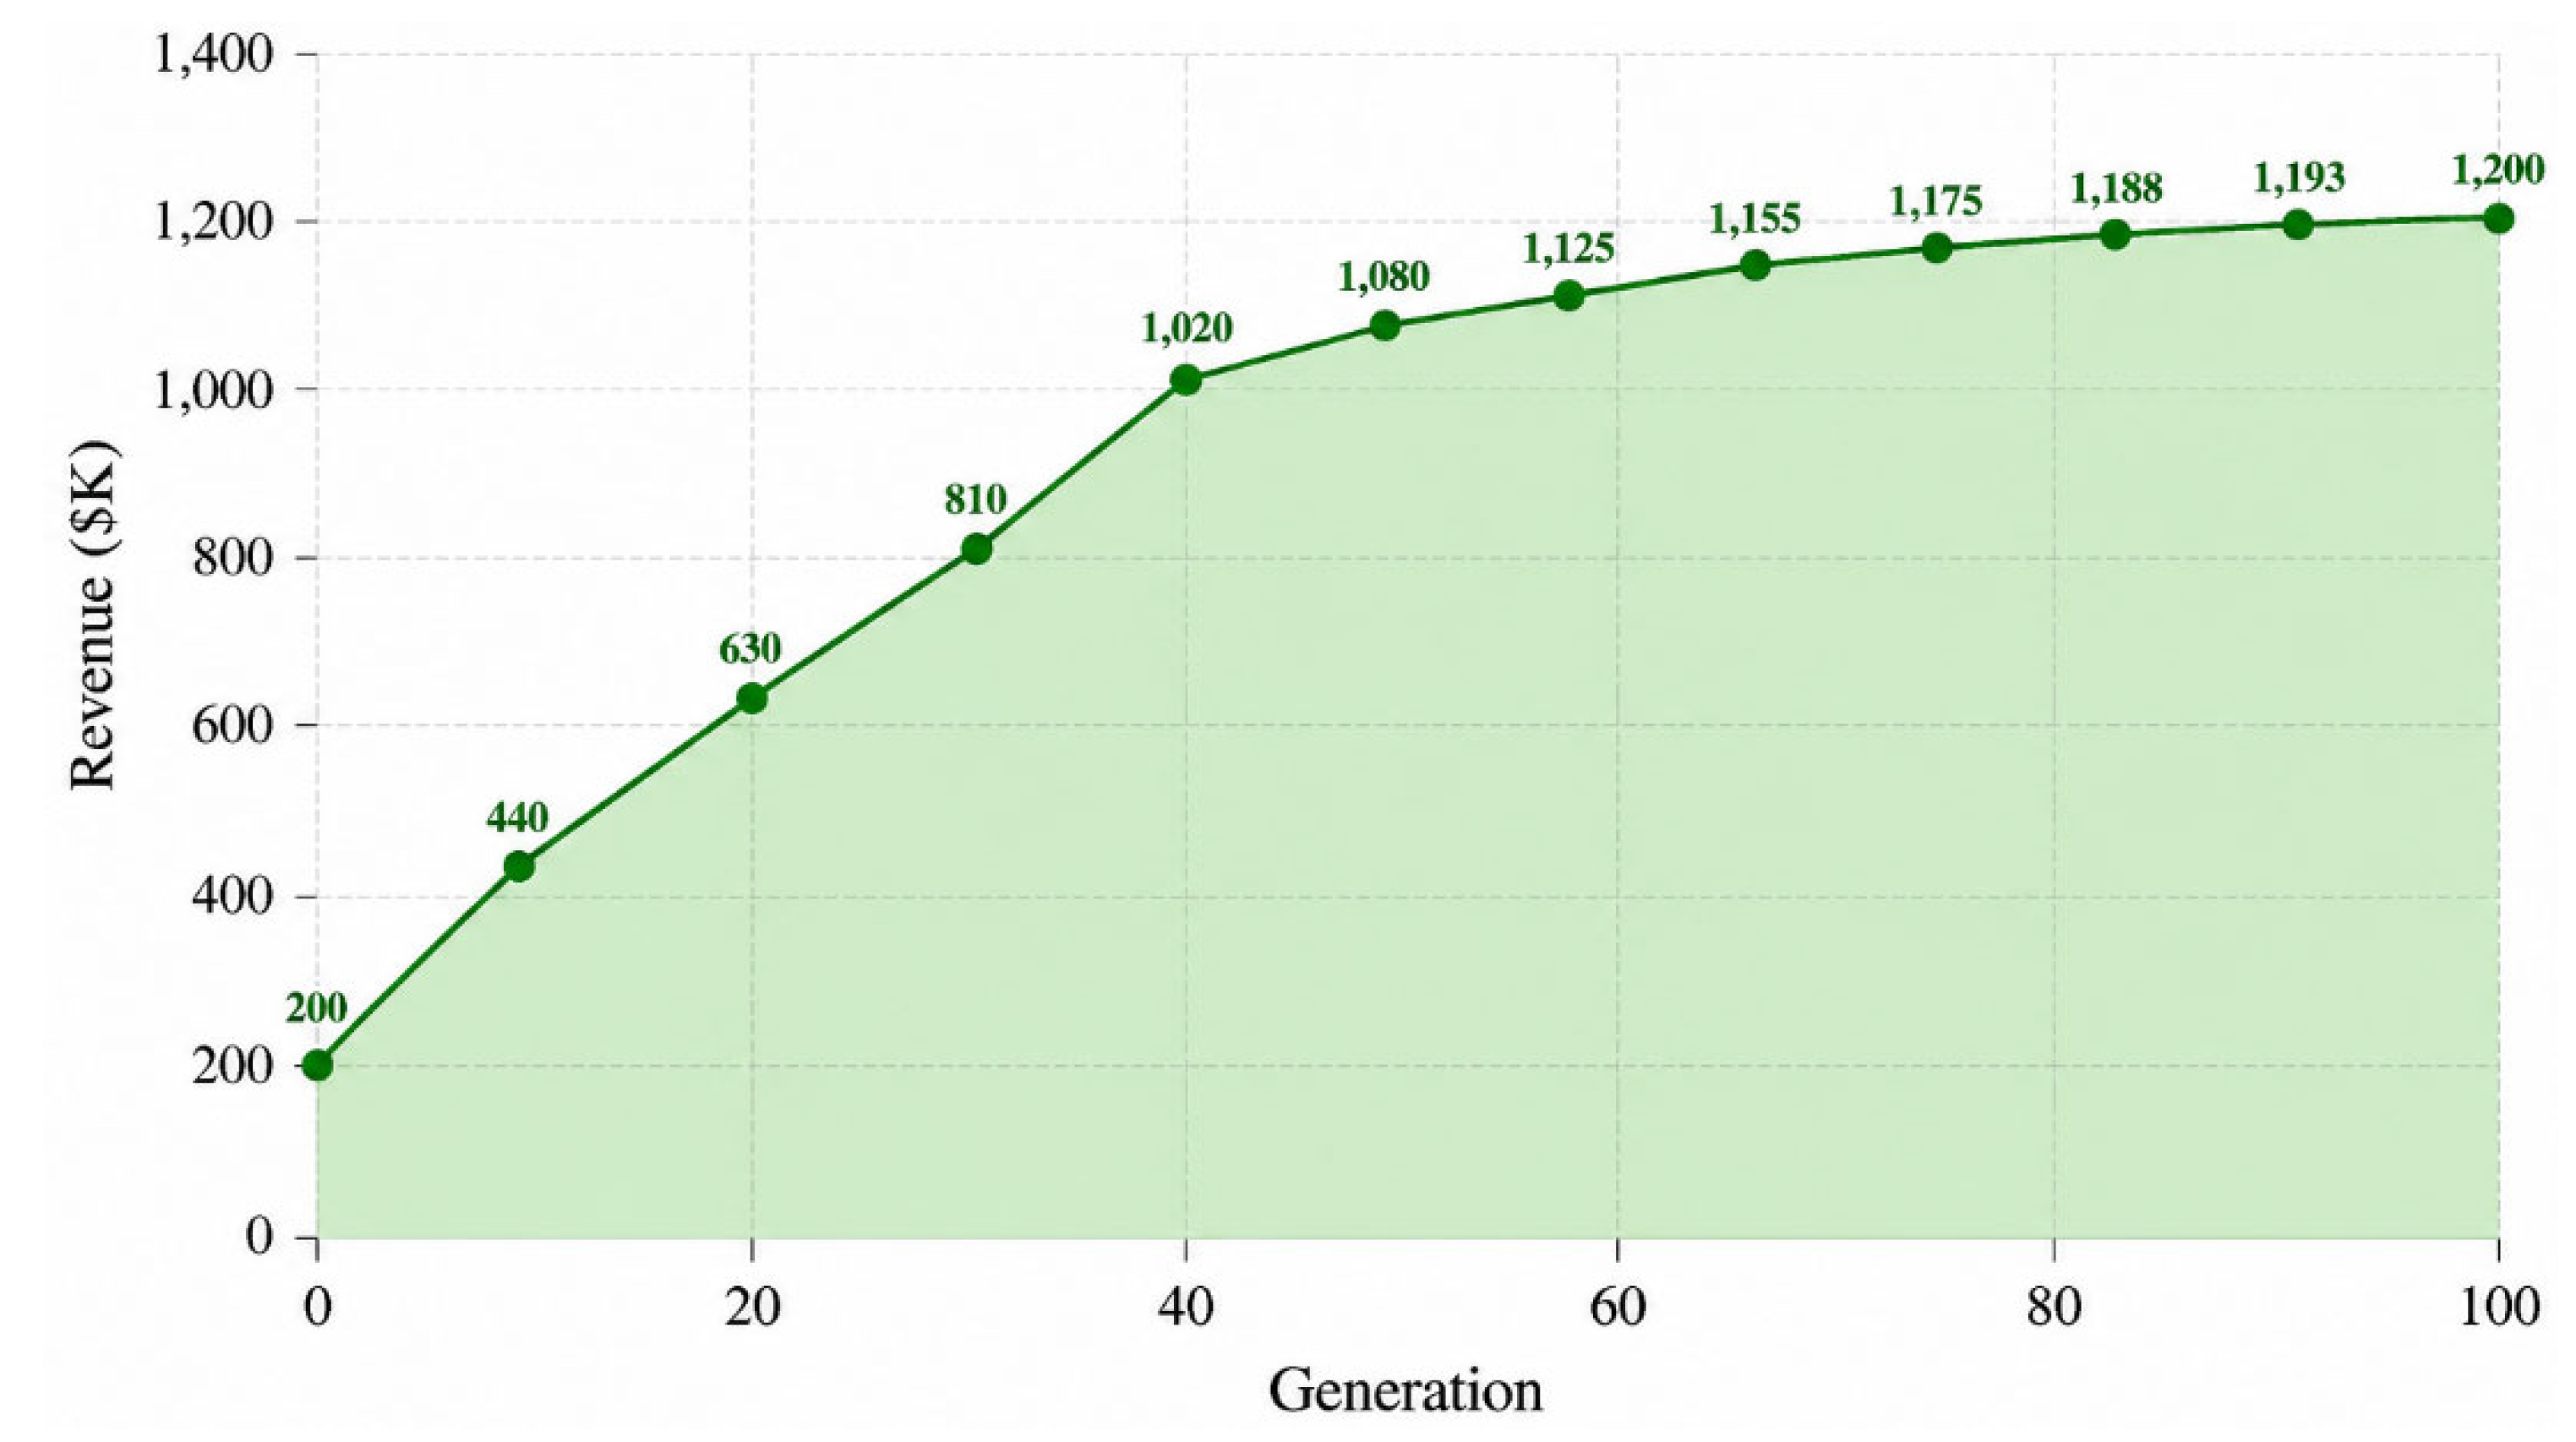
Expected revenue increases rapidly during the first 40 generations, gaining $156K (15.4% of final value), then plateaus as the algorithm refines the Pareto frontier. The hypervolume indicator stabilized after generation 78, with improvements below 0.001 over 10 consecutive generations, triggering early termination at generation 82. This convergence pattern indicates that NSGA-II efficiently explores the solution space within the first half of the maximum generation limit
Figure 8.
Channel Allocations (Baseline vs. Proposed).
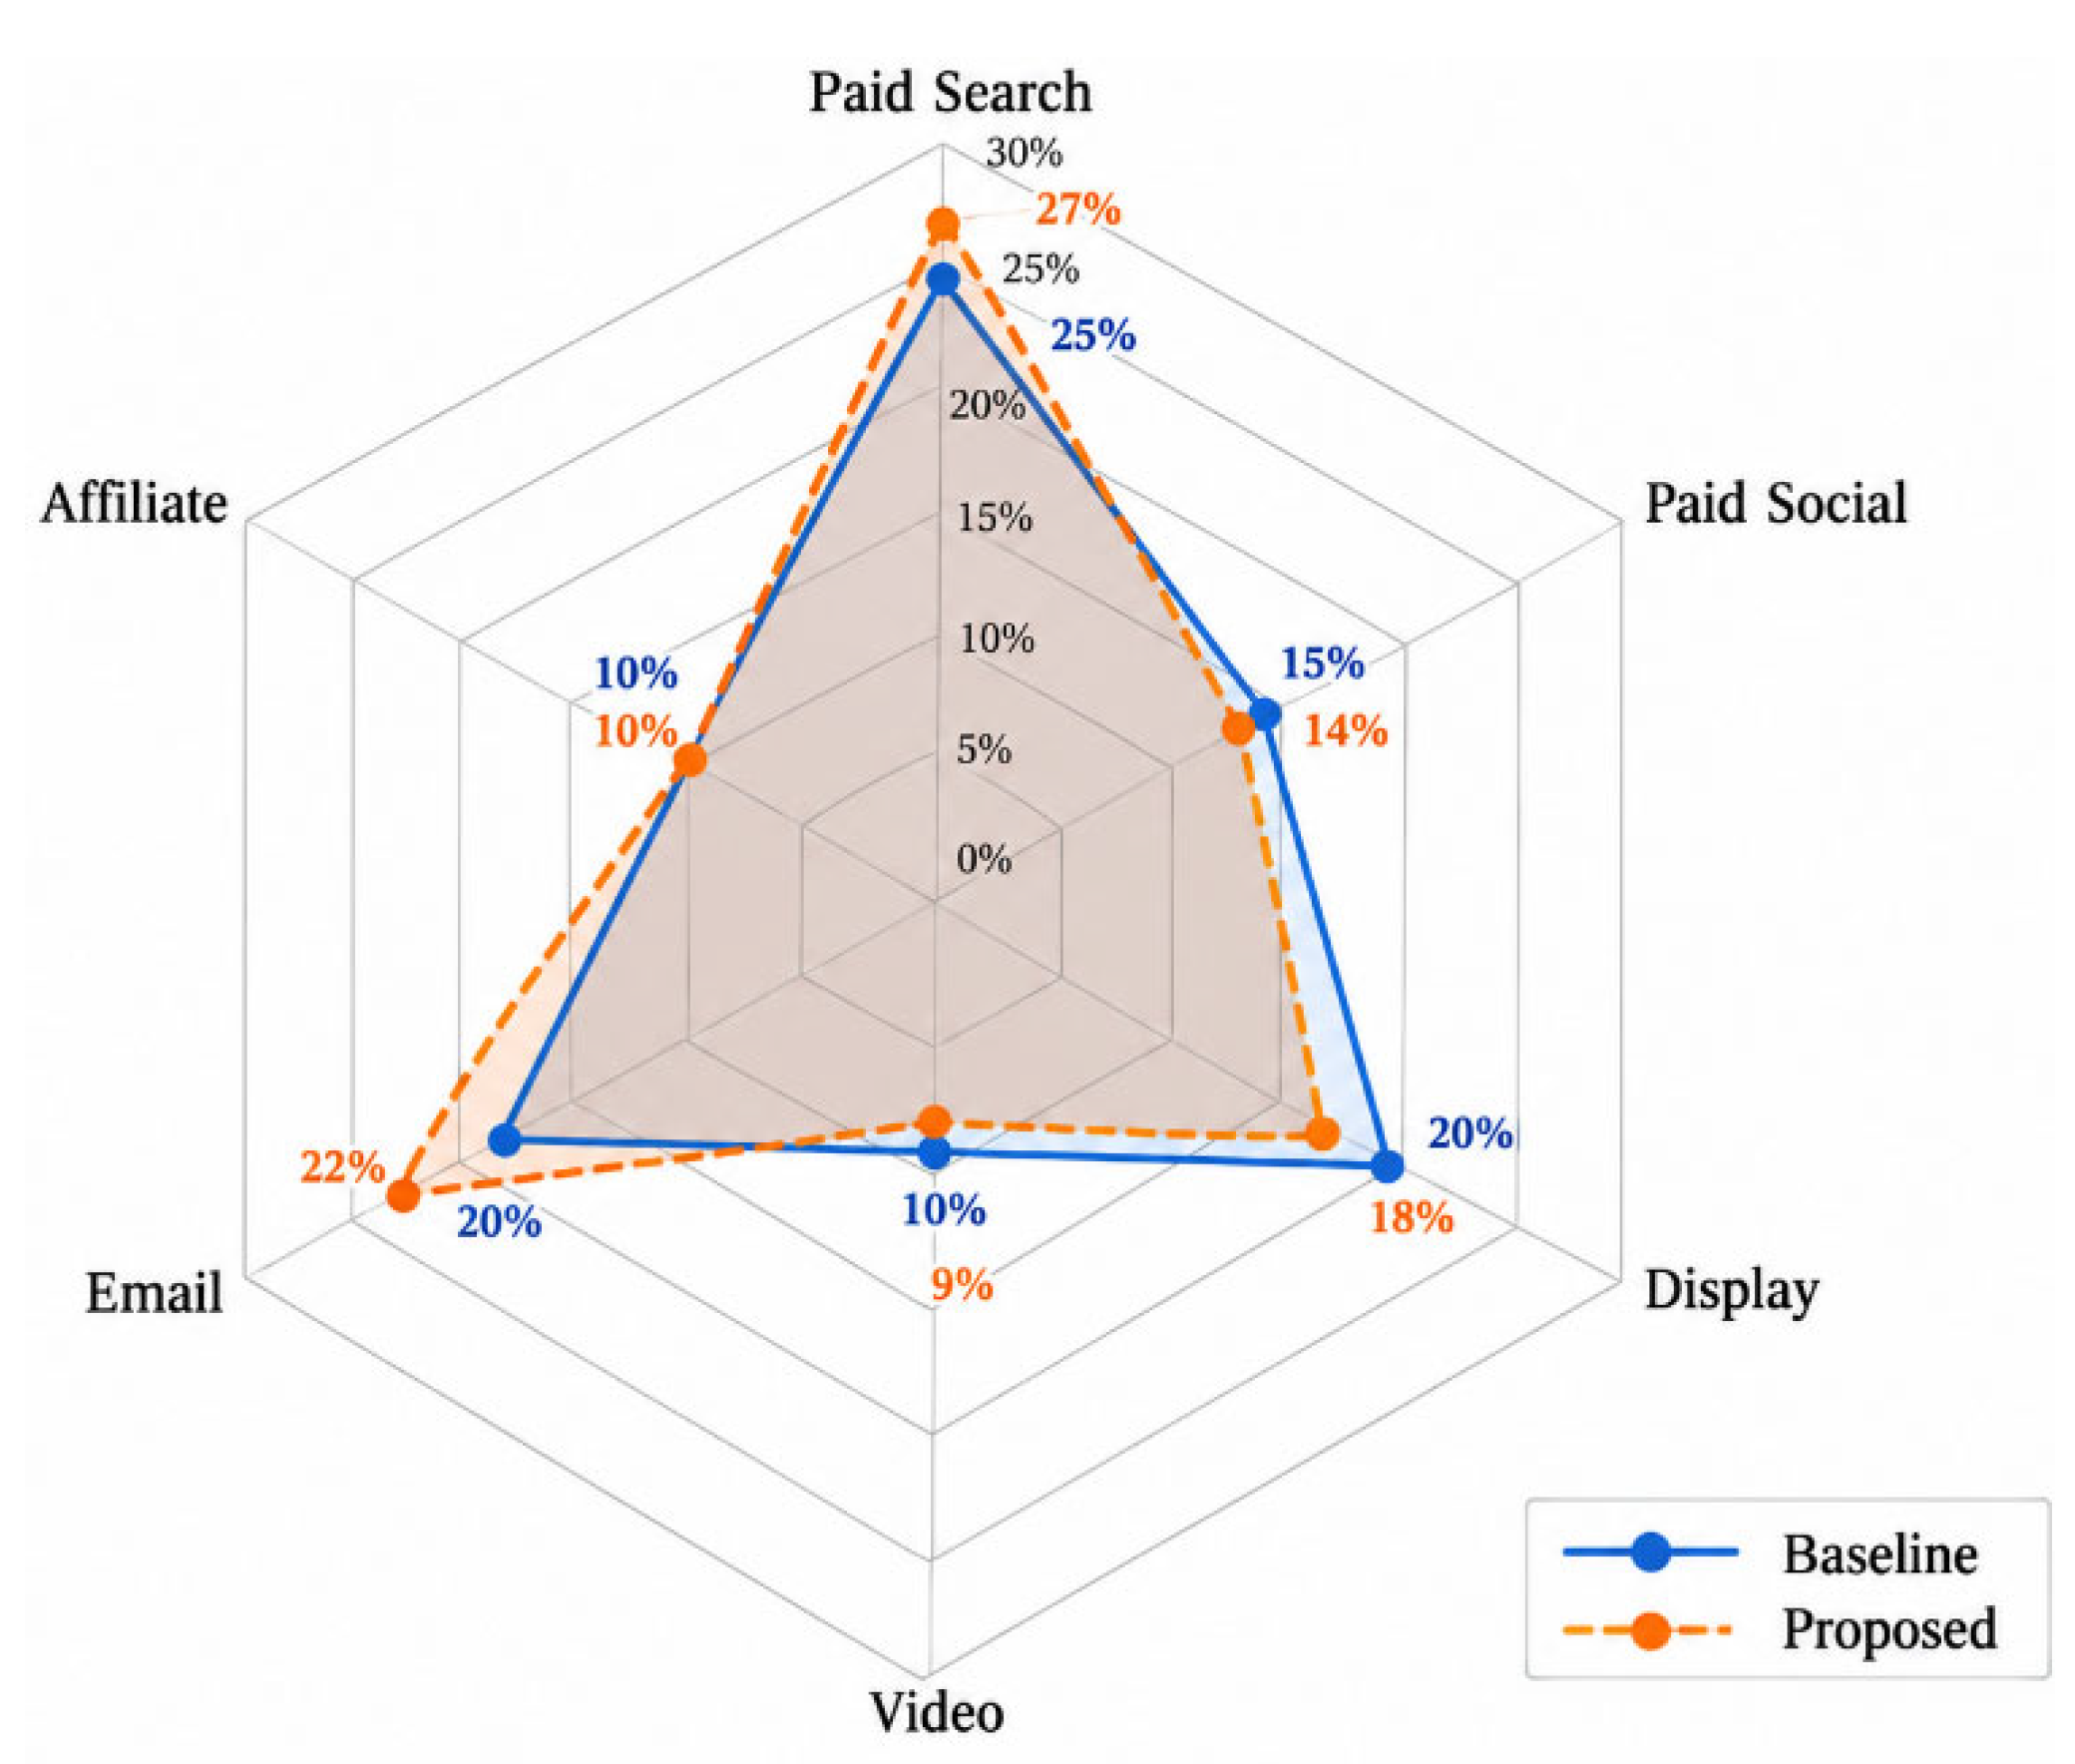
This graph highlights three key shifts: Paid Search increases from 28% to 30%, Paid Social decreases from 22% to 18%, and Display decreases from 18% to 15%. Email remains stable at 15–17%, while Video and Affiliate show minimal change. The visual pattern confirms that optimization primarily reallocates between the top three channels (Search, Social, Display) while maintaining stable allocations for secondary channels. SHAP (Shapley Additive explanations) values were computed for each Pareto-optimal allocation to decompose revenue predictions into channel-level contributions. Mean absolute SHAP values across 1,000 posterior samples identified Paid Search as the dominant revenue driver (mean |SHAP| = 0.38), followed by email (0.29) and Paid Social (0.24). subconscious Display exhibited the highest SHAP variance (0.042), consistent with its wide posterior effect interval and explaining its reduced allocation in risk-minimizing strategies. Measured SHAP interaction values revealed a positive synergy between Paid Search and Email (interaction effect = +0.07, p < 0.01), indicating that coordinated campaigns across these channels produce supra-additive effects. This finding suggests that allocating budget to both channels simultaneously yields greater returns than independent optimization would predict. Negative interactions were observed between Paid Social and Display (-0.04), implying audience overlap or competitive cannibalization when both channels receive high spend. SHAP dependence plots for Paid Search showed a saturation threshold at approximately 35% budget share, beyond which marginal SHAP contributions declined sharply. This pattern aligns with the Hill function saturation parameter () estimated by the Bayesian model and validates the optimization constraint preventing Search allocations above 35% in risk-aware strategies.
B. Discussion
The results show that the Balanced allocation improved the three measured outcomes compared with the baseline. Expected revenue increased by 18.4%, while allocation risk decreased by 35.8% and brand presence increased by 9.2%. This difference comes mainly from shifting part of the budget from Paid Social and Display toward Paid Search and Email. Paid Search produced the largest estimated channel effect, but its contribution declined as its budget share approached 35%. Display had a smaller mean effect and greater variation, which explains its lower share in the revenue focused allocation. The Pareto analysis produced three distinct allocation patterns. The Revenue Maximizing strategy assigned 35% to Paid Search and produced the highest expected revenue, but also had the highest risk. The Risk Minimizing strategy placed more budget in Display and Email and reduced variance at the cost of lower expected revenue. The Balanced strategy remained between these two cases. These results show that the allocation problem does not have one solution that is optimal for every objective.
SHAP results support the allocation patterns. Paid Search had the highest mean absolute SHAP value, followed by Email and Paid Social. The positive Search and Email interaction of 0.07 indicates a combined contribution in the modeled response. Paid Social and Display showed a negative interaction of −0.04. The SHAP dependence analysis also showed a clear reduction in the marginal contribution of Paid Search after a budget share of about 35%. This result is consistent with the saturation behavior represented in the Bayesian response model.
C. Limitations and Future Work
Three limitations warrant acknowledgment. First, the analysis uses simulated data covering five sectors and 24 months. The results therefore describe the behavior of the proposed framework under the defined simulation settings and cannot be treated as evidence from actual marketing campaigns. Second, the response model assumes that channel effects remain stable over the study period. Changes in platform algorithms, competition, or economic conditions may produce different effects over time. A time varying model could address this issue. Third, SHAP describes model based contributions but does not prove that changing a channel budget will cause the predicted outcome. Causal and counterfactual methods could provide stronger evidence for intervention decisions. Future work can test the framework with real campaign data from a wider range of industries. Time varying Bayesian models can be used to update channel effects as new observations become available. Sequential optimization could also allow budgets to be revised during a campaign rather than fixed for the entire planning period. Causal explanation methods may further help distinguish channel association from the effect of an actual budget change.
V. Conclusion
This study presented an Explainable Multi Objective Optimization framework for digital marketing budget allocation under consumer response uncertainty. The framework combines Bayesian hierarchical modeling, posterior predictive simulation, NSGA II, and SHAP analysis. In the simulated evaluation, the Balanced allocation increased expected revenue from $1,012K to $1,198K, reduced allocation risk from 0.095 to 0.061, and increased the brand presence score from 0.65 to 0.71. The Pareto analysis identified three allocation patterns with different revenue, risk, and brand presence levels. Paid Search had the largest estimated contribution, while its marginal effect decreased near a 35% budget share. Email showed a positive interaction with Paid Search, whereas Paid Social and Display showed a negative interaction. These results provide a direct link between the allocation outcomes and the modeled channel effects. Because the dataset is simulated, the findings should be viewed as a framework evaluation rather than evidence of actual campaign performance. Testing the method on real campaign data, allowing channel effects to change over time, and adding causal analysis are important next steps
References
- Deb, K.; Pratap, A.; Agarwal, S.; Meyarivan, T. A fast and elitist multiobjective genetic algorithm: NSGA-II. IEEE Trans. Evol. Comput. 2002, vol. 6(no. 2), 182–197. [Google Scholar] [CrossRef]
- Lundberg, S. M.; Lee, S. I. A unified approach to interpreting model predictions. Adv. Neural Inf. Process. Syst. 2017, vol. 30, 4765–4774. [Google Scholar] [CrossRef]
- Arrieta, B.; Díaz Rodríguez, N.; Del Ser, J.; Bennetot, A.; Tabik, S.; Barbado, A.; Garcia, S.; Gil López, S.; Molina, D.; Benjamins, R.; Chatila, R.; Herrera, F. Explainable Artificial Intelligence (XAI): Concepts, taxonomies, opportunities and challenges toward responsible AI. Inf. Fusion 2020, vol. 58, 82–115. [Google Scholar] [CrossRef]
- Rossi, P. E.; Allenby, G. M. Bayesian statistics and marketing. Mark. Sci. 2003, vol. 22(no. 3), 304–328. [Google Scholar] [CrossRef]
- Vehtari; Gelman, A.; Gabry, J. Practical Bayesian model evaluation using leave-one-out cross-validation and WAIC. Stat. Comput. 2017, vol. 27(no. 5), 1413–1432. [Google Scholar] [CrossRef]
- James, G. M.; Witten, D.; Hastie, T.; Tibshirani, R. An Introduction to Statistical Learning; Springer, 2013. [Google Scholar] [CrossRef]
- Zou, H.; Hastie, T. Regularization and variable selection via the elastic net. J. R. Stat. Soc. Ser. B (Statistical Methodology) 2005, vol. 67(no. 2), 301–320. [Google Scholar] [CrossRef]
- Tibshirani, R. Regression shrinkage and selection via the lasso. J. R. Stat. Soc. Ser. B (Methodological) 1996, vol. 58(no. 1), 267–288. [Google Scholar] [CrossRef]
- Ahmed, S.; Khalil, S.; Hossain, M. R.; Mumu, T. S. Explainable predictive analytics framework for enterprise workflow risk, delay detection, and adaptive resource allocation. Glob. J. Eng. Technol. Adv. 2026, vol. 28(no. 3), 226–239. [Google Scholar] [CrossRef]
- Rohan, S. I.; Rahman, M.; Arif, J. I.; Rahman, M. M. Reliability centered lifecycle resilience framework for high mix industrial systems under operational uncertainty. Glob. J. Eng. Technol. Adv. 2026, vol. 28(no. 3), 212–225. [Google Scholar] [CrossRef]
- Nasir, F. B.; Kashem, M. A.; Islam, M. R.; Das, N. An interoperable management information system for real time payment intelligence, merchandise planning, and distributed workforce coordination. Saudi J. Eng. Technol. 2026, vol. 11(no. 9), 825–833. [Google Scholar] [CrossRef]
- Rahman, M. M. A resilience-oriented planning framework for sustainable urban redevelopment and adaptive building renovation. SSRN 2026. [Google Scholar] [CrossRef]
- Ahmed, S. Interpretable learning for identifying digital access vulnerability in underserved communities. In Zenodo; 2026. [Google Scholar] [CrossRef]
- Islam, M. R.; Das, N.; Nasir, F. B.; Kashem, M. A. Federated consumer and operational analytics for demand-responsive planning in digital service ecosystems. Glob. J. Eng. Technol. Adv. 2026, vol. 28(no. 2), 224–237. [Google Scholar] [CrossRef]
- Siddiqui, R.; Nahian, A. E.; Bhowmick, N.; Mirza, S. Auditability and performance monitoring frameworks for enterprise decision-support systems. Int. J. Innov. Sci. Res. Technol. 2026, vol. 11(no. 6). [Google Scholar] [CrossRef]
- Rahman, M. M. A multi-objective operational optimization model for lean manufacturing and industrial equipment resource allocation. SSRN 2026. [Google Scholar] [CrossRef]
- Nahar, S. Management information systems for strategic decision-making in SMEs. SSRN 2026. [Google Scholar] [CrossRef]
- Chokder, R. ERP-based data integration framework for business operations and managerial decision support. SSRN 2026. [Google Scholar] [CrossRef]
- Junaid. Performance optimization of 5G NR networks through mobility management and carrier aggregation configuration. SSRN 2026. [Google Scholar] [CrossRef]
- Bhowmick, N.; Mirza, S.; Siddiqui, R.; Nahian, A. E. Enterprise workflow efficiency assessment through process analytics and performance measurement frameworks. Int. J. Sci. Res. Arch. 2026, vol. 20(no. 2), 58–70. [Google Scholar] [CrossRef]
- Nahian, E.; Bhowmick, N.; Mirza, S.; Siddiqui, R. Integrated forecasting and resource allocation models for financial and operational performance management. Saudi J. Bus. Manag. Stud. 2026, vol. 11(no. 8), 261–270. [Google Scholar] [CrossRef]
- Huq, S. N. A mathematical decision framework for strategic workforce planning and resource allocation under organizational uncertainty. SSRN 2026. [Google Scholar] [CrossRef]
- Barua, P. Data-driven demand forecasting and inventory optimization for supply chain performance management. SSRN 2026. [Google Scholar] [CrossRef]
- Afroje, S.; Chokder, R.; Bhuiyan, M. I. H.; Akter, T. Information system architecture for payment card transaction monitoring. Sch. J. Eng. Technol. 2026, vol. 14(no. 7), 403–412. [Google Scholar] [CrossRef]
- Chokder, R.; Bhuiyan, M. I. H.; Akter, T.; Afroje, S. Enterprise data integration for customer relationship and sales performance monitoring. Sch. J. Eng. Technol. 2026, vol. 14(no. 7), 413–421. [Google Scholar] [CrossRef]
- Mim, M.; Akter, M. Integration of business intelligence dashboards in administrative decision making. SSRN Electron. J. 2026. [Google Scholar] [CrossRef]
- Hossain, M. R. Explainable digital twin decision intelligence framework for predictive risk assessment and maintenance optimization of critical infrastructure systems. In Zenodo; 2026. [Google Scholar] [CrossRef]
- Fazle, B. AI-driven integrated process optimization and predictive maintenance for industrial manufacturing systems. In Research Square; 2026. [Google Scholar] [CrossRef]
- Alam, M. J.; Khayyam, F.; Junaid, E.; Ahmed, M. Intelligent regulatory monitoring and audit trail information systems for enterprise risk and compliance management. Int. J. Sci. Res. Arch. 2026, vol. 19(no. 3), 283–295. [Google Scholar] [CrossRef]
- Uddin, M. N. NLP enabled infrastructure complaint intelligence for automated triage, root cause analytics, and response time optimization in municipal road, drainage, and utility maintenance systems in the United States. In Research Square; 2026. [Google Scholar] [CrossRef]
- Nahian, E. Time-series modeling for financial forecasting and sales variability analysis. In Research Square; 2026. [Google Scholar] [CrossRef]
- Mirza, S. Predictive inventory buffer optimization for high-variability manufacturing supply chains using hybrid statistical and simulation models. Zenodo 2026. [Google Scholar] [CrossRef]
- Shaik, M. H. AI-Driven Site Reliability Engineering Framework for Proactive Failure Prediction and Resilience Optimization in Large-Scale Cloud Infrastructure. SSRN 2026. [Google Scholar] [CrossRef]
- Khayyam, F. Enterprise scale privacy preserving data fabric architecture for multi tenant AI driven customer relationship management platforms. SSRN 2026. [Google Scholar] [CrossRef]
- Rahman, M. M.; Rohan, S. I.; Rahman, M.; Arif, J. I. Multi objective predictive maintenance and energy aware resource optimization for smart industrial systems. Int. J. Sci. Res. Arch. 2026, vol. 20(no. 3), 569–583. [Google Scholar] [CrossRef]
- Afroj, S. Data analytics applications in banking customer service and financial operations management. In Research Square; 2026. [Google Scholar] [CrossRef]
- Rahman, M. M. An integrated decision framework for sustainable and code-compliant building design using building information modeling and multi-criteria performance assessment. In Research Square; 2026. [Google Scholar] [CrossRef]
- Khalil, S. KPI-based project health assessment model for agile IT operations and service reliability. In Research Square; 2026. [Google Scholar] [CrossRef]
- Munna, A. Requirements traceability and KPI prioritization for agile platform delivery. SSRN 2026. [Google Scholar] [CrossRef]
- Das, N.; Rokibuzzaman, M.; Kashem, M. A.; Islam, M. R. Multi-objective resource allocation for resilient financial, healthcare, retail, and logistics service networks. Int. J. Sci. Res. Arch. 2026, vol. 20(no. 2), 803–818. [Google Scholar] [CrossRef]
- Khalil, S. Workflow optimization model for cross-functional IT project delivery. SSRN 2026. [Google Scholar] [CrossRef]
- Siddiqui, R.; Nahian, A. E.; Bhowmick, N.; Mirza, S. Auditability and performance monitoring frameworks for enterprise decision-support systems. Int. J. Innov. Sci. Res. Technol. 2026, vol. 11(no. 6). [Google Scholar] [CrossRef]
- Abdullah, M. S.; Al Morshed, S. A.; Hossain, M. I.; Tajik, M. A. Reliability-centered foundation and retaining system assessment for sustainable infrastructure delivery. Int. J. Innov. Sci. Res. Technol. 2026, vol. 11(no. 8), 425–435. [Google Scholar] [CrossRef]
- Islam, M. S. Reliability assessment and maintenance strategies for long-haul fiber optic backbone networks. SSRN 2026. [Google Scholar] [CrossRef]
- Tumpa, S. A. Machine learning-based object detection techniques for real-time image recognition applications. SSRN 2026. [Google Scholar] [CrossRef]
- Siddiqui, R. Trust and auditability in generative AI-assisted enterprise reporting systems. SSRN 2026. [Google Scholar] [CrossRef]
- Ahmed, S. Reliability-aware predictive analytics for healthcare service access and resource allocation. SSRN 2026. [Google Scholar] [CrossRef]
- Al Morshed, S. A.; Hossain, M. I.; Tajik, M. A.; Abdullah, M. S. Risk-informed construction delivery for resilient public infrastructure under geotechnical and environmental uncertainty. Saudi J. Eng. Technol. 2026, vol. 11(no. 8), 698–706. [Google Scholar] [CrossRef]
- Mirza, S.; Nahian, A. E.; Bhowmick, N.; Siddiqui, R. Inventory resilience and demand variability modeling for multi-sector organizational operations. Glob. J. Eng. Technol. Adv. 2026, vol. 28(no. 2), 015–027. [Google Scholar] [CrossRef]
- Rohman, H. AI-powered portable optical biosensors for environmental toxicants or environmental field tests and point of care diagnostics or medical diagnostics or disease detection. SSRN 2026. [Google Scholar] [CrossRef]
- Khalid, M. A. Structural design and optimization of industrial steel structures for process and power plant facilities. SSRN 2026. [Google Scholar] [CrossRef]
- Junaid. Performance optimization of 5G NR networks through mobility management and carrier aggregation configuration. SSRN 2026. [Google Scholar] [CrossRef]
- Siddiki. Adaptive CI/CD automation framework for containerized enterprise applications using Jenkins and Kubernetes. Int. J. Innov. Sci. Res. Technol. 2026, vol. 11(no. 6). [Google Scholar] [CrossRef]
- Hossain, M. I.; Rashid, M. F.; Barua, P.; Joy, S. H. A. K. Traceability and compliance monitoring systems in global apparel supply chains. Saudi J. Eng. Technol. 2026, vol. 11(no. 7), 644–654. [Google Scholar] [CrossRef]
- Tariq, F. AI-driven fault prediction and self-healing architecture for cloud-native Java microservices in large-scale enterprise systems. SSRN 2026. [Google Scholar] [CrossRef]
- Mirza, S. B. Intelligent root cause analysis and incident diagnostics for Microsoft Fabric and Power BI through telemetry correlation and Kusto Query Language. Res. Sq. 2026. [Google Scholar] [CrossRef]
- Rashid, M. F. Artificial intelligence driven lead time and cost forecasting for global apparel merchandising to reduce delays, expedite costs, and total sourcing cost. SSRN 2026. [CrossRef]
- Khan, M. I.; Al Abid, A.; Sultana, N.; Avi, S. P. Sustainable ground improvement using lime-stabilized soils and recycled construction materials: A performance-based evaluation for urban development. Int. J. Sci. Res. Arch. 2026, vol. 20(no. 1), 255–268. [Google Scholar] [CrossRef]
- Rashid, F.; Barua, P.; Joy, S. H. A. K.; Hossain, I. Inventory demand planning models for multi-region retail distribution networks. Int. J. Sci. Res. Arch. 2026, vol. 20(no. 1), 351–365. [Google Scholar] [CrossRef]
- Islam, M. A.; Uddin, M. N.; Umar, M.; Khalid, M. A. Governance frameworks for infrastructure project risk management. Int. J. Sci. Res. Arch. 2026, vol. 20(no. 1), 338–350. [Google Scholar] [CrossRef]
- Hossain, M. R. Hybrid explainable AI framework for cyber resilient decision support and infrastructure risk prioritization using digital twin intelligence. SSRN 2026. [Google Scholar] [CrossRef]
- Asraf, M. S. Development of a Pareto-frontier-based optimization framework for component selection and design trade-off analysis in power converter systems. SSRN 2026. [Google Scholar] [CrossRef]
- Hossain, M. I. A multi layer infrastructure performance governance framework for sustainable built environment systems. Zenodo 2026. [Google Scholar] [CrossRef]
- Al Morshed, S. A. Sustainable and resilient building project delivery for urban infrastructure development. SSRN 2026. [Google Scholar] [CrossRef]
- Dukkipati, S. S. N. C.; Junaid, E.; Siddiki, A.; Khayyam, F. Scalable cloud-native microservices architecture for enterprise AI platforms: Reliability, security, and real-time distributed processing frameworks. Int. J. Sci. Res. Arch. 2026, vol. 19(no. 3), 296–308. [Google Scholar] [CrossRef]
- Sharmin, M.; Rahman, M. A.; Rohman, H.; Tumpa, S. A. Business operations monitoring through integrated management information systems. Int. J. Sci. Res. Arch. 2026, vol. 19(no. 3), 309–324. [Google Scholar] [CrossRef]
- Rahman, M. A.; Rohman, H.; Tumpa, S. A.; Sharmin, M. Network monitoring frameworks for enterprise IT infrastructure. Glob. J. Eng. Technol. Adv. 2026, vol. 27(no. 3), 064–079. [Google Scholar] [CrossRef]
- Joy, S. H. A. K.; Hossain, M. I.; Rashid, M. F.; Barua, P. Maritime logistics performance analysis in container port operations. Sch. J. Econ. Bus. Manag. 2026, vol. 13(no. 6), 253–264. [Google Scholar] [CrossRef]
- Uddin, M. N.; Umar, M.; Khalid, M. A.; Islam, M. A. Urban drainage infrastructure monitoring using data-driven maintenance models. Sch. J. Eng. Technol. 2026, vol. 14(no. 6), 287–299. [Google Scholar] [CrossRef]
- Ahmed, M. Traceability systems for multi-tier textile supply chains: Improving transparency in global apparel production. Saudi J. Eng. Technol. 2026, vol. 11(no. 6), 532–539. [Google Scholar] [CrossRef]
- Al Morshed, S. A. An integrated framework for construction risk prediction and project delay reduction in public infrastructure projects. In Research Square; 2026. [Google Scholar] [CrossRef]
- Asraf, M. S.; Junaid, A.; Islam, S.; Rahat, M. K. Power electronic converter design for industrial energy systems. Glob. J. Eng. Technol. Adv. 2026, vol. 27(no. 3), 108–123. [Google Scholar] [CrossRef]
- Bhowmick, N. Adaptive content delivery optimization framework for enterprise web platforms using component-based content management architecture. Zenodo 2025. [Google Scholar] [CrossRef]
- Islam, M. A. Zero trust security and FERPA aligned data governance for higher education web systems with identity centric access control, secure APIs, and tamper evident audit logging. In Research Square; 2026. [Google Scholar] [CrossRef]
- Siddiqui, R. Human-in-the-loop generative AI frameworks for reliable financial reporting in enterprise systems. In Zenodo; 2026. [Google Scholar] [CrossRef]
- Asraf, M. S. MATLAB-based optimization and modeling of power electronic component design for high-performance DC–DC converter applications. Glob. J. Eng. Technol. Adv. 2026, vol. 27(no. 1), 38–49. [Google Scholar] [CrossRef]
- Ali. Developing smart packaging systems for reducing single-use plastics. Sch. J. Eng. Technol. 2026, vol. 14(no. 6), 300–312. [Google Scholar] [CrossRef]
- Nahar, S. Role of artificial intelligence in enhancing organizational learning and employee development. Zenodo 2026. [Google Scholar] [CrossRef]
- Siddiki. Vault-based secret management and zero-trust security model for distributed financial applications. Res. Sq. n.d. [Google Scholar] [CrossRef]
- Mirza, S. Mathematical optimization of batch size and changeover scheduling for manufacturing productivity enhancement in multi-product production systems. In Research Square; 2026. [Google Scholar] [CrossRef]
- Joy, S. H. A. K.; Rashid, M. F.; Barua, P. Maritime logistics performance analysis in container port operations. Sch. J. Econ. Bus. Manag. 2026, vol. 13(no. 6), 253–264. [Google Scholar] [CrossRef]
- Junaid; Islam, M. S.; Rahat, M. K.; Asraf, M. S. Radio network performance evaluation in multi-band LTE and 5G deployments. Sch. J. Eng. Technol. 2026, vol. 14(no. 5), 273–280. [Google Scholar] [CrossRef]
- Umar, M.; Khalid, M. A.; Islam, M. A.; Uddin, M. N. Structural behavior of reinforced concrete using recycled construction materials. Glob. J. Eng. Technol. Adv. 2026, vol. 27(no. 2), 151–163. [Google Scholar] [CrossRef]
- Al Abid; Khan, M. I.; Avi, S. P.; Sultana, N. Risk-based construction inspection and quality management model for transportation and highway infrastructure projects. Glob. J. Eng. Technol. Adv. 2026, vol. 27(no. 2), 139–150. [Google Scholar] [CrossRef]
- Shaikat, M. F. B.; Happy, A. T. Architectural flexibility in powertrain manufacturing: A review of reconfigurable assembly lines for concurrent ICE and electric drive unit production. Zenodo 2026. [Google Scholar] [CrossRef]
- Umar, M. Structural Performance Analysis of Reinforced Concrete Incorporating Waste Foundry Sand and Glass Powder as Partial Fine Aggregate Replacement. Zenodo 2026. [Google Scholar] [CrossRef]
- Khandkar, S. A. I.; Zaidi, S. K. A. Intelligent relay protection and autonomous control architecture for cyber-physical energy infrastructure. SSRN Electron. J. 2026. [Google Scholar] [CrossRef]
- Karim, F. M. Z. Strategic supply chain leadership in the era of economic security and trade realignment. In Zenodo; 2026. [Google Scholar] [CrossRef]
- Junaid, E. Container image hardening pipeline: Vulnerability scanning, policy gates, and runtime efficiency in production Kubernetes. Zenodo 2026. [Google Scholar] [CrossRef]
- Siddiki. GRPC-based lightweight communication framework for high-performance enterprise microservices. In Zenodo; 2026. [Google Scholar] [CrossRef]
- Ali. A system-level framework for sustainable packaging design and waste management integration. Saudi J. Eng. Technol. 2026, vol. 11(no. 5), 429–437. [Google Scholar] [CrossRef]
- Tumpa, S. A.; Sharmin, M.; Rahman, M. A.; Rohman, H. Sensor-based monitoring systems for agricultural water management. Sch. J. Eng. Technol. 2026, vol. 14(no. 5), 194–207. [Google Scholar] [CrossRef]
- Shaik, M. H.; Mirza, S. B.; Islam, M. A.; Tariq, F. Secure continuous deployment pipelines for enterprise cloud applications. Sch. J. Eng. Technol. 2026, vol. 14(no. 5), 233–246. [Google Scholar] [CrossRef]
- Rohman, H.; Tumpa, S. A.; Sharmin, M.; Rahman, M. A. Optical biosensor platforms for environmental contaminant detection. Saudi J. Eng. Technol. 2026, vol. 11(no. 5), 420–428. [Google Scholar] [CrossRef]
- Islam, M. S. Planning and deployment framework for high-capacity fiber access networks in urban and regional telecommunications infrastructure. In Zenodo; 2026. [Google Scholar] [CrossRef]
- Rahat, M. K.; Asraf, M. S.; Junaid, A.; Islam, M. S. Communication infrastructure for secure smart meter networks in electric utilities. Saudi J. Eng. Technol. 2026, vol. 11(no. 5), 450–461. [Google Scholar] [CrossRef]
- Farooq, H.; Sharan, S. M. I.; Fahim, M. Z. I. Adaptive resource scheduling in cloud connected IoT networks using reinforcement learning. Int. J. Sci. Res. Eng. Dev. (IJSRED) 2026, vol. 9(no. 1), 435–447. [Google Scholar] [CrossRef]
- Habiba, U.; Musarrat, R. AI-enhanced TESOL strategies for neurodiverse learners: Integrating adaptive language assessment with special education practices. Saudi J. Eng. Technol. 2026, vol. 11(no. 4), 166–173. [Google Scholar] [CrossRef]
- Junaid, E. Secure Kubernetes platform engineering for EKS and GKE: Helm-based standardization and runtime governance. Zenodo 2026. [Google Scholar] [CrossRef]
- Ali. Development of Bio-Based and Compostable Packaging Alternatives to Reduce Plastic Waste. Preprints 2026. [Google Scholar] [CrossRef]
- Sultana, N.; Avi, S. P.; Khan, M. I.; Al Abid, A. Flood-resilient urban infrastructure planning through combined hydrologic modeling, structural assessment, and constructability analysis. Sch. J. Eng. Technol. 2026, vol. 14(no. 4). [Google Scholar] [CrossRef]
- Asraf, M. S. Reliability-oriented design optimization of power electronic systems for industrial and utility-scale applications. Saudi J. Eng. Technol. 2026, vol. 11(no. 4), 184–196. [Google Scholar] [CrossRef]
- Asraf, M. S. Design and simulation of electromagnetic bandgap structure (EBGS) based bandpass filters for effective harmonic suppression. Saudi J. Eng. Technol. 2026, vol. 11(no. 4), 197–208. [Google Scholar] [CrossRef]
- Islam, M. A.; Tariq, F.; Shaik, M. H.; Mirza, S. B. Identity-centric security models for enterprise web systems. Saudi J. Eng. Technol. 2026, vol. 11(no. 4), 237–246. [Google Scholar] [CrossRef]
- Akter, T.; Afroje, S.; Chokder, R.; Bhuiyan, M. I. H. Workforce productivity measurement models for service-oriented organizations. Saudi J. Eng. Technol. 2026, vol. 11(no. 4), 257–265. [Google Scholar] [CrossRef]
- Abid, A. AI-enhanced traffic signal optimization using microscopic simulation models for congestion and emissions reduction in mid-sized U.S. urban corridors. Zenodo 2026. [Google Scholar] [CrossRef]
- Sultana, N. Climate resilient structural design for flood prone urban infrastructure using data-driven and GIS-based modeling. Zenodo 2026. [Google Scholar] [CrossRef]
- Fazle, B. Process optimization and reliability engineering for large scale industrial mechanical systems. In Zenodo; 2026. [Google Scholar] [CrossRef]
- Karim, F. M. Z. Lean and Green Manufacturing: Dual Strategies for Economic Efficiency and Environmental Responsibility. In Zenodo; 2026. [Google Scholar] [CrossRef]
- Karim, F. M. Z. Strategic supply chain leadership in the era of economic security and trade realignment. In Zenodo; 2026. [Google Scholar] [CrossRef]
- Avi, S. P. Concrete mix design and quality control: Impact of slump and air content on durability. In Zenodo; 2026. [Google Scholar] [CrossRef]
- Adil, H. M. Development of Cellulose Nanofiber Based Nanopapers as Sustainable Alternatives to Plastic Derived Industrial Materials. Preprints 2026. [Google Scholar] [CrossRef]
- Avi, S. P. Geotechnical and Environmental Impacts of Using Alternative Cementitious Materials in Concrete Mixes. Preprints 2026. [Google Scholar] [CrossRef]
- Rohman, H. AI-based biosensors to detect bacterial and mold contamination, demonstrating their increasing role in ensuring food safety and quality assurance. Zenodo 2026. [Google Scholar] [CrossRef]
Disclaimer/Publisher’s Note: The statements, opinions and data contained in all publications are solely those of the individual author(s) and contributor(s) and not of MDPI and/or the editor(s). MDPI and/or the editor(s) disclaim responsibility for any injury to people or property resulting from any ideas, methods, instructions or products referred to in the content. |
© 2026 by the authors. Licensee MDPI, Basel, Switzerland. This article is an open access article distributed under the terms and conditions of the Creative Commons Attribution (CC BY) license (http://creativecommons.org/licenses/by/4.0/).
Copyright: This open access article is published under a Creative Commons CC BY 4.0 license, which permit the free download, distribution, and reuse, provided that the author and preprint are cited in any reuse.