

Submitted:
21 September 2026
Posted:
23 September 2026
You are already at the latest version
Abstract
We characterized octonucleate Entamoeba isolates from galliform birds and lesser rheas (Rhea pennata) using cyst morphometry and SSU rRNA sequence/secondary structure analyses, comparing them with published data for morphologically comparable Entamoeba species. Entamoeba gallinarum is the only octonucleate species described from galliform hosts; the morphology of the galliform isolates was consistent with this species except for their larger cyst size. Because no genetic data from E. gallinarum are available and morphometric differences alone were considered insufficient to support a new species, the galliform isolates were conservatively assigned to E. gallinarum. The rhea isolates fell within the morphometric ranges reported for E. gallinarum sensu this study, E. coli, and E. muris. Analysis of published E. coli sequences identified several lineages delimited by compensatory base changes (CBCs), supporting its interpretation as a cryptic species complex. The SSU rRNA sequence of the rhea isolates was identical to those of a lineage within E. coli subtype ST2. Without determining which lineage represents E. coli sensu stricto, we propose the rhea-associated lineage as a new species, Entamoeba choiquei n. sp. Finally, we introduce Enta-LISA, an R-based workflow integrating primary sequence divergence and CBC comparisons of SSU rRNA secondary structures to facilitate reproducible lineage delimitation in Entamoeba.
Keywords:
Entamoeba taxonomy
; Entamoeba choiquei n.sp.
; Morphology
; SSU rRNA gene
; compensatory base change analysis
; ribosomal lineages
; genetic analysis workflow
1. Introduction
The amoebae in the genus Entamoeba are parasites of the gastrointestinal tract of vertebrates, except for a few species that have been described from the environment [1]. There are two stages in their life cycle: the active trophozoite and the resting cyst, the latter being the form of transmission between hosts through contaminated water or food. There is a defined number of nuclei in the mature cysts, usually one, four, or eight, which allows informal grouping of the species into morphological groups [2], commonly referred to as bovis (uninucleate cysts), histolytica (tetranucleate cysts), coli (octonucleate cysts), or gingivalis (no cyst stage) [3]. Apart from the number of nuclei in the mature cysts, very few morphological traits can be considered for the description and identification of the species (basically, the trophozoite and cyst size and nuclear morphology), and historically, the host species have in many cases been considered a differential characteristic [1].
There are only a few Entamoeba species described originally from birds: Entamoeba lagopodis in grouse [4] and Entamoeba anatis in ducks [5] belong to the histolytica group, Entamoeba gallinarum in poultry [6] belongs to the coli group, and Entamoeba struthionis in ostriches [7] belongs to the bovis group. In ratites and by genetic analysis, Entamoeba polecki and Entamoeba suis have also been identified in ostriches [8], and E. struthionis, E. polecki, and Entamoeba dispar in greater rheas (Rhea americana) [8,9,10]. In a previous study on the parasites infecting wild and farm-reared greater and lesser rheas (R. americana and Rhea pennata, respectively) in Argentina [11], we detected uninucleate cysts in greater and lesser rheas and octonucleate cysts in lesser rheas. These findings were provisionally identified as Entamoeba bovis-like and Entamoeba coli-like, respectively, pending future genetic analysis and comparisons with related taxa.
Because cyst morphology in Entamoeba is not a reliable criterion for species delimitation, although it can be used to assess compatibility with previously described taxa [1], a reliable taxonomic assessment requires both morphological and molecular evidence. Numerous attempts to genetically characterize the uninucleate cysts from the common and lesser rhea isolates were unsuccessful, whereas SSU rDNA sequences were obtained from the octonucleate cysts. However, no molecular data were available at that time for E. gallinarum, the only avian species described to date producing octonucleate cysts, and this species could not be excluded as that found in the lesser rhea isolates. Over the following 15 years, samples from chickens and other galliform birds were repeatedly examined in search of comparative material, but positive samples proved difficult to obtain, delaying the comparative analysis and formal taxonomic assessment of the octonucleate Entamoeba found in the lesser rhea isolates. Meanwhile, partial SSU rDNA sequences from human isolates that were identical to those obtained from the rhea isolates became available [9,12], providing additional context for evaluating the taxonomic identity and host range of the rhea isolates. In the present study, we report the first SSU rDNA sequences attributable to E. gallinarum and provide a morphological and molecular characterization of the E. coli-like isolates from lesser rheas.
2. Materials and Methods
2.1. Sample Origin and Initial Processing
2.1.1. Rhea Samples
We collected faecal samples from Argentinean common and lesser rheas in a previous study published in 2013 [11] (Martínez-Díaz et al. 2013). In that work, samples were collected from wild and farm birds; they were immediately fixed in 70% alcohol and stored in labelled hermetic plastic containers until analysis. One part of each sample was kept in 70% alcohol, and another part was homogenized in distilled water in 50 ml tubes for 24 h, centrifuged at 1500 rpm for 5 min in a Mixtasel BL centrifuge (JP Selecta, Barcelona, Spain), and the sediment processed to obtain a faecal concentrate following the formalin–ethyl acetate stool concentration technique [13]. Slides stained in Lugol’s iodine were made from the concentrate sediments to investigate the presence of parasite structures. Uninucleate Entamoeba cysts were found in common rheas, and uninucleate and octonucleate cysts in lesser rheas. Uninucleate cysts were processed and analyzed using the same protocol as for the octonucleate cysts described below; however, he genetic analyses yielded negative results and they are not further considered in this study.
Three samples of lesser rheas from two different farms containing octonucleate cysts were selected for subsequent analyses. For each of them, the remaining original sample part stored in 70% alcohol was processed for morphological and DNA analysis in 2008, at the time of the findings. In each sample, the 70% alcohol was removed, and the samples were homogenized in distilled water in 50 ml tubes for 72 h (with the water replaced every 24 h after centrifugation at 1500 rpm for 5 min) before further processing.
2.1.2. Galliform Samples
Between 2009 and 2025, we analyzed a total of 103 faecal samples from galliform birds (common fowl, guinea fowl, turkey, peafowl and partridge) from a wide range of sources, including free-ranging individuals and birds kept by private owners or at zoological institutions in pens of varying sizes, some of them relatively large. In all cases, the samples were collected from the ground stored in labelled plastic containers, and examined within 4 hours of collection.
Each sample was processed using the formalin–ethyl acetate concentration method, while another part was kept under refrigeration at 4 °C for further processing. Slides stained with Lugol’s iodine were made from the concentrate sediments. Only three samples were positive for octonucleate Entamoeba cysts: two from common fowl (Gallus gallus), obtained in 2015 and 2024 at the ZooAquarium of Madrid (Spain), and one from helmeted guinea fowl (Numida meleagris), obtained in 2016 at Faunia Park, Madrid (Spain); all three samples were collected from quarantined birds. The refrigerated part of the positive samples was processed immediately for morphological and genetic analyses.
2.2. Morphological and Statistical Analysis
Fecal smears from positive, washed rhea samples were stained using chlorazole black and trichrome staining. To ensure the washed rhea samples adhered to the slides, we mixed a drop of fecal homogenate with a drop of PVA and allowed it to dry overnight at 37 °C before staining. We also attempted to stain the galliform samples with both methods, but no cysts were detected in the stained slides.
Data on cyst and nuclear diameters and nuclear morphology were recorded from Lugol’s iodine preparations and permanently stained slides. Using an Olympus BX51 microscope (Olympus, Tokyo, Japan) at 1000× magnification, we measured a minimum of 30 cysts and two nuclei per cyst. Measurements were taken with an ocular micrometer graduated at 1 µm; we visually estimated intermediate values when they fell between two divisions, resulting in an effective precision of approximately 0.5 µm. F.P.-G. measured the rhea samples, whereas both F.P.-G. and L.E.-S. measured the galliform samples. Because both observers had independently measured other Entamoeba species in previous studies with no significant differences between them, we did not include the observer as a factor in subsequent analyses. Images were captured using an Olympus DP50 or DP23 camera connected to the microscope.
Morphological comparisons were based on qualitative cyst features, including cyst shape, nuclear appearance, endosome position, and peripheral chromatin. Morphometric comparisons with published data were restricted to cyst diameter, because nuclear diameter is not consistently reported in available descriptions of octonucleate Entamoeba species. All statistical analyses were performed using IBM SPSS Statistics version 30 (IBM Corporation, New York, NY, USA). The level of significance was set at p < 0.05.
We addressed two main objectives in the morphometric analyses. First, within-group variation was assessed separately for isolates from each host origin (rhea and galliform birds) to determine whether data could be pooled for subsequent analyses. For galliform isolates, only data from one staining method (Lugol’s iodine) was available and differences among isolates were evaluated using a one-way ANOVA. For rhea isolates, variation was assessed using a factorial ANOVA, treating isolate and staining method as fixed factors and including their interaction in the model. The influence of each factor was quantified using eta-squared (η²), which represents the proportion of total variation explained by that factor [14].
Second, we performed comparative analyses with published data for two purposes: (i) to assess whether the combination of host association and morphological similarity supported identifying the galliform isolates as E. gallinarum, by comparing our data with published descriptions of this species [6,15,16]; and (ii) to evaluate the morphometric relationship of the rhea isolates to selected octonucleated Entamoeba species. These comparisons included data from our galliform isolates, E. gallinarum [6,15,16], Entamoeba muris [17], and E. coli [18,19,20]. We included E. gallinarum because it is the only octonucleated species described in birds, and E. coli and E. muris because they represent the only nominal octonucleated species with currently available molecular data, thereby allowing us to integrate the morphometric comparisons with the genetic analyses performed in this study. For this same reason, the Entamoeba sp. lineages identified in molecular analyses were not considered in morphometric comparisons because they lack associated morphometric data.
Different statistical approaches were applied according to the objective of each analysis and the type of available data. To compare the galliform isolates with published descriptions of E. gallinarum, one-sample t-tests were performed when only published mean values were available. Conversely, Welch’s t-test were used when individual measurements were available because it is robust to unequal variances and sample sizes. Additionally, the Mann–Whitney U test was used as a non-parametric alternative. To complement significance testing, standardized effect sizes were calculated. Cohen’s d was used to quantify the difference between group means relative to within-group variability [21], and also Hedges’ g was calculated as a bias-corrected estimator to assess the potential influence of sample size on effect size estimates [22]. Furthermore, standardized differences were used to estimate the degree of overlap between morphometric distributions following Inman and Bradley [23]. This approach complements significance testing by evaluating whether statistically significant differences correspond to a meaningful separation between distributions or to broadly overlapping morphometric ranges.
To compare cyst diameter in the rhea isolates with that reported in other octonucleate Entamoeba datasets, a one-way ANOVA was performed followed by Games–Howell post-hoc pairwise comparisons. We selected this procedure because it provides reliable pairwise comparisons when sample sizes and variances differ among groups.
2.3. DNA Extraction, PCR Amplification and Sequencing
Total DNA was extracted using the SpeedTools Tissue DNA Extraction Kit (Biotools B&M Labs S.A., Madrid, Spain). About 500 µl of the centrifuged water homogenates (rhea samples) or of the fresh faeces (galliform samples) were resuspended in 1 ml TE buffer (10 mM Tris, 1 mM EDTA, pH 8) and then processed according to manufacturer’s instructions. The DNA extract was finally eluted in 100 µL of water (milliQ grade) and stored at -20 °C until use.
We amplified the nearly complete SSU rDNA sequence using the forward primer E1D (5’-GTTGATCCTGCCAGTATTATATGC-3’) and the reverse primer EF2 (5’-TGATCCTTCCGCAGGTTCAC-3’). PCR amplifications were performed in a total volume of 25 µL using the PureTaq Ready-To-Go™ PCR Beads (now manufactured by Merck KGaA, Darmstadt, Germany). Reactions were made in a Mastercycler Gradient 5331 thermocycler (Eppendorf AG, Hamburg, Germany) programmed as follows: initial denaturation at 94 °C for 10 min; 30 cycles of denaturation at 94 °C for 1 min, primer annealing at 60 °C for 1 min, and extension at 72 °C for 3 min; followed by a final extension at 72 °C for 5 min.
Amplicons were visualized in 1% agarose gels stained with ethidium bromide (Sigma-Aldrich, Saint Louis, MO, USA, for the 2008 analyses) or Pronasafe (Condalab, Torrejón de Ardoz, Spain). The products were purified using a QIAquick® PCR Purification Kit (Qiagen, Hilden, Germany) and sequenced them with the PCR primers at the Sequencing Service of the Complutense University. Sequencing was performed on an ABI Prism 3730xl DNA Analyzer (Applied Biosystems; now Thermo Fisher Scientific, Waltham, MA, USA). We used primer walking to obtain the complete SSU rDNA sequence. Finally, the chromatogram files were processed and aligned using ChromasPro software (Technelysium Pty. Ltd.), version 1.50 (for the 2008 analyses of rhea isolates) and 2.1.10 (for the recent sequences of galliform isolates).
2.4. Sequence Retrieval, Structure-Informed Alignment, and Lineage Inference and Sequence Assignment
Figure 1 provides an overview of the analytical workflow followed in this part of the study. We compared the sequences from the rhea and galliform isolates with those available in the GenBank/EMBL/DDBJ databases using the BLASTN algorithm implemented on the National Center for Biotechnology Information (NCBI) website (https://blast.ncbi.nlm.nih.gov/Blast.cgi). Based on these BLASTN search results, we retrieved homologous SSU rDNA sequences. To avoid excluding divergent but potentially related lineages, we initially considered sequences showing at least 90% identity to the rhea isolates; subsequently, we retained only sequences longer than 1,200 base pairs (bp), corresponding to a minimum of approximately 60% coverage relative to near-complete sequences. We further excluded sequences assigned to non-octonucleated Entamoeba species, non-octonucleated isolates, or isolates with unknown cyst morphology. The sequences of E. histolytica (X65163), Entamoeba nuttalli (AB282657), and E. dispar (Z49256) were retained and used as outgroups in the phylogenetic analyses.
We aligned sequences by taking SSU rRNA secondary structures into account, following proposed models [24]. When necessary, we determined secondary structures through comparative analysis using the homology modeling option implemented on the ITS2 database website (https://its2.bioapps.biozentrum.uni-wuerzburg.de/; last accessed: 13 May, 2026). For partially or incompletely modeled regions, we performed additional comparisons using secondary structures derived from 3D models generated using the AlphaFold Server (https://alphafoldserver.com/; last accessed May 13, 2026) [25] and analyzed with the DSSR program (version 2.5.0-2025; [26]). Furthermore, we obtained structure predictions using RNAfold from the ViennaRNA Package v2.6.3 [27], as implemented with default parameters on the RNAfold WebServer (http://rna.tbi.univie.ac.at/cgi-bin/RNAWebSuite/RNAfold.cgi; last accessed May 13, 2026). Finally, sequence-secondary structure alignment was performed in 4SALE [28].
We manually identified helices showing extensive indels and very low sequence similarity among octonucleated Entamoeba sequences within the global sequence–structure alignment. We then extracted and realigned these helices independently using mLocARNA [29], which simultaneously considers primary sequence and RNA secondary structure. For each conflicting helix, mLocARNA was run in probabilistic mode with consistency transformation and iterative refinement enabled, performing five refinement iterations for each alignment. To evaluate alignment robustness, we used two alternative mLocARNA parameter sets differing in gap penalties: a permissive setting (--indel=-300, --indel-opening=-800) and a more conservative setting (--indel=-500, --indel-opening=-1000). We compared the resulting alignments and regarded regions of a helix that aligned identically under both parameter sets as robustly aligned. Conversely, whenever alternative parameter settings produced different but plausible alignments, the regions extending from the first inconsistently aligned base pair to the terminal loop were marked as ambiguous. In these regions, we transferred the local alignment obtained under the more conservative gap-penalty settings to the global alignment; minor and unambiguous inconsistencies in the position correspondence of paired nucleotides across sequences were corrected through limited manual editing. This decision gave preference to the solution requiring less fragmentation, thereby minimizing unsupported assumptions about multiple independent indel events. To assess the impact of retaining the primary sequence of structurally ambiguous regions in lineage inference, we generated two datasets: a variant of the complete alignment that included the primary sequences of the ambiguous regions but masked their secondary structure annotation by replacing opening and closing parentheses with dots (‘.’) in the dot-bracket notation; and a derived trimmed alignment from which we removed these regions.
We first established the reference ribosomal lineages comprising the selected published sequences of octonucleate Entamoeba species/lineages prior to comparing the rhea and galliform isolates. We followed the established ribosomal lineage terminology [9,30], incorporating recent modifications [24]. Most of the retrieved GenBank sequences belonged to E. coli, which is currently regarded as a species complex comprising several ribosomal subtypes with subtype ST2 showing extensive internal genetic variability [12]; however, no ribosomal lineages have yet been proposed within this species or its subtypes. We inferred reference lineages using a recent framework in which pairwise sequence divergence and compensatory base changes (CBCs) in the SSU rRNA secondary structure served to assess whether sequences corresponded to the same or distinct evolutionary lineages [24].
CBCs are defined as substitutions that affect both nucleotides of a paired position in the rRNA secondary structure while preserving base pairing [31]. We performed pairwise sequence comparisons and CBC analyses using a custom R script, Enta-LISA (Entamoeba Lineage Inference and Sequence Assignment; Supplementary File S1), written in R version 4.5.2 (R Foundation for Statistical Computing, Vienna, Austria) and tested under RStudio version 2025.09 (Posit Software PBC, Boston, MA, USA). For reliable CBC comparisons, the nucleotides at the 5’ and 3’ positions of each base pair must occupy homologous positions in the structural alignment across all sequences where that pair occurs; Enta-LISA verified this condition before lineage inference. In both datasets (masked and trimmed alignments), we calculated pairwise uncorrected distances, or p-distances (as estimates of pairwise genetic divergence, following [32]), over the effective overlap between each pair of sequences, requiring a minimum of 500 positions after excluding those with gaps in both sequences. We included positions with ambiguous nucleotide states in the overlap count but excluded them from the distance calculations.
For reference lineage inference, sequences with no detected CBCs were considered compatible with assignment to the same lineage, and the existence of two or more CBC sites as indicative of distinct lineages [24]. When a single CBC was detected, we additionally evaluated sequence divergence using two complementary exploratory criteria and we retained a sequence within a lineage if it met at least one of them. First, the minimum uncorrected p-distance between the candidate sequence and the other sequences in the lineage was below 0.010 (the empirical threshold proposed to indicate possible separation between evolutionary lineages [24]). Second, when nucleotide diversity (π) could be estimated for the lineage, the minimum uncorrected p-distance fell below the 4*π threshold. This rule (hereafter, Birky’s 4*π rule) is based on Birky’s 4× criterion [33], according to which divergence between individuals from different evolutionary lineages must be at least four times the nucleotide diversity within a lineage; when π is small (as in Entamoeba species and lineages [24]), 4*π can be used as a simplified approximation of this criterion. This comparison can also be performed for a candidate sequence representing a putative new lineage, provided that nucleotide diversity can be estimated for the reference lineage [33]). The Enta-LISA script identified lineage cores and evaluated candidate sequences according to these criteria.
To further validate the differentiation of inferred lineages within E. coli subtype ST2, we reanalyzed a reduced dataset containing these sequences (the ‘ST2 dataset’). We reassessed the previously masked regions in the complete alignment and considered their secondary structure whenever their alignment was unambiguous within this restricted dataset; the analysis was repeated using the Enta-LISA script.
Once the reference lineages were established, the sequences from the rhea and galliform isolates were compared against them using the Enta-LISA script. Regions corresponding to those previously identified as structurally unreliable in the initial lineage inference analysis were initially kept masked. For each query sequence, uncorrected p-distances to the sequences of each reference lineage were calculated, and the number of CBC sites was determined. The criteria described above were then applied to assess whether the query sequence could be assigned to an established lineage or if it represented a distinct one. When a query sequence was assigned to a reference lineage, further iterative analyses restricted to that lineage were performed; previously masked regions were reassessed and reincorporated if the sequence-structure alignment was now reliable. Iterations ceased when the new sequence was assigned to a new lineage, when all structurally evaluable regions had been included in the comparison, or when no additional ambiguous regions could be reliably resolved.
2.5. Phylogenetic Relationships
The phylogenetic analysis was intended to establish the placement of the newly sequenced isolates, particularly those from galliform birds, rather than to assess the sensitivity of phylogenetic reconstruction to ambiguously alignable regions. For this reason, only the trimmed alignment was used. Secondary structure annotation was removed from the alignment, missing data at the start or end of partial sequences were coded as ‘?’, and the resulting sequence-only file was imported into MEGA12 [34]. Phylogenetic trees were reconstructed using Maximum Likelihood (ML) and Maximum Parsimony (MP) methods. For the ML method, the Tamura-Nei model with a gamma distribution and a proportion of invariant sites (TN93+G+I) was selected as the best-fitting model based on the Akaike Information Criterion and the Bayesian Information Criterion calculated in MEGA. In both the ML and MP analyses, all alignment positions were considered, and node support was assessed using 500 bootstrap replicates.
3. Results
3.1. Morphological Characterization of the Rhea and Galliform Isolates
3.1.1. Cyst Morphology
The morphological features of cysts of lesser rhea origin were briefly described in a previous study [11]; here, we expand upon that description. All observed cysts (Figure 2A-C) were spherical or slightly ovoid, although those mixed with PVA during fixation often exhibited irregular shapes. In all cases, the cysts contained eight nuclei evenly distributed throughout the cytoplasm. No chromatoid bodies were observed. The cytoplasm occasionally appeared slightly denser in the central region, particularly in chlorazole black and trichrome-stained preparations. Nuclear morphology was characterized by a punctiform endosome, which was occasionally eccentric, and uniformly distributed peripheral chromatin.
Cysts from galliform birds (Figure 2D-E) exhibited essentially identical morphology. No qualitative differences were observed, except that the endosome was more frequently eccentric.
3.1.2. Morphometric Characteristics
Descriptive statistics of cyst and nucleus measurements are shown in Table 1. For the galliform isolates, one-way ANOVAs revealed no significant differences among isolates for either cyst diameter (p=0.601, η² = 0.011) or nuclear diameter (p=0.371, η² = 0.008), and measurements were pooled for subsequent analyses. For the rhea isolates, factorial ANOVAs showed no significant effects of isolate or the interaction between isolate and staining method on either variable, but staining method showed a statistically significant effect on both cyst diameter (p = 0.024, η² = 0.027) and nuclear diameter (p = 0.043, η² = 0.009) (Table 2). However, these effects were small, and only one pairwise comparison was significant in each case (Lugol vs. chlorazole black for cyst diameter; Lugol vs. trichromic for nuclear diameter) (Table 3). Overall, isolate identity, staining method, and their interaction explained only a minor proportion of the total variability, indicating that morphometric variation was primarily expressed at the level of individual cysts and nuclei rather than among isolates or staining methods. Accordingly, measurements from all rhea isolates and staining methods were also pooled for subsequent analyses.
3.2. Comparative Morphometric Analyses
3.2.1. Galliform Isolates Versus Entamoeba Gallinarum
The cyst diameter of Entamoeba from galliform birds (17.1 ± 1.7 µm, n = 92) was significantly larger than that reported by Hegner [15] for E. gallinarum (15.0 ± 1.2 µm, n = 10; Table 4). The standardized difference between datasets was large (Cohen’s d = 1.333; Hedges’ g = 1.323), indicating a substantial difference in mean values. This effect was not biased by sample size differences; the near-identical values of Cohen’s d and Hedges’ g indicate that the sample size imbalance between datasets had a negligible influence on the effect size estimation. The estimated overlap between distributions was approximately 50.5%, and size ranges clearly overlapped between datasets (Hegner: 14–18 µm; present study: 13–22 µm), indicating that these differences do not correspond to a clear morphological separation.
When only mean values were available from the literature, comparisons using one-sample t-tests indicated that the mean cyst diameter of the isolates from galliform hosts in the present study differed significantly from those reported by [6] (12–15 µm; t = 12.221, d.f. = 91, p < 0.001) and [16] (mean: 12.5 µm, range: 10–13 µm; t = 26.561, d.f. = 91, p < 0.001).
3.2.2. Rhea Isolates Versus Other Octonucleate Entamoeba Taxa
The one-way ANOVA revealed significant differences in cyst diameter among the octonucleate Entamoeba datasets included in the comparison. Pairwise Games–Howell comparisons (Table 5) showed that the rhea isolates did not differ significantly from either the galliform isolates or certain E. coli and E. muris datasets; conversely, significant differences were detected between the rhea isolates and E. gallinarum, as well as other E. coli and E. muris datasets. Visual inspection of the morphometric distributions (Figure 3) showed extensive overlap among the different datasets. Interestingly, several datasets assigned to the same species differed significantly, while others assigned to different species exhibited comparable cyst diameters.
3.3. Genetic Analyses
3.3.1. Sequence Characteristics of the Lesser Rhea and Galliform Isolates
The SSU rDNA sequences obtained from the different lesser rhea isolates were identical. The sequence comprised 2,098 bp and had a GC content of 42.1%. The SSU rDNA sequences obtained from the galliform isolates were 2,129 bp long. The sequence from the guinea fowl isolate contained two ambiguous positions, 910R (G/A) and 1861R (G/A), whereas the sequences from the common fowl isolates were identical and contained adenine at both positions. These ambiguities correspond to hemi-CBCs in the secondary SSU rRNA structure (910A-921U/G-U and 1861A-1870U/G-U). Apart from the two ambiguous positions, the sequences obtained from galliform hosts were identical. These sequences have been deposited in the GenBank/EMBL/DDBJ databases under accession numbers FN396614 (lesser rhea isolate) and PZ754747- PZ754748 (galliform isolates).
In subsequent analyses, the sequence from the guinea fowl isolate was represented by two alternative sequence variants differing only at the two ambiguous positions, as ambiguous nucleotide symbols may be handled inconsistently during pairwise distance and nucleotide diversity calculations. Rather than generating all four possible nucleotide combinations, we considered only one variant with adenine at both sites (alternative sequence 1, AS1), corresponding to the sequence observed in the common fowl isolates, and another with guanine at both sites (alternative sequence 2, AS2), representing the maximum possible sequence divergence from the sequences of the common fowl isolates. This approach allowed the effect of the unresolved positions to be evaluated while avoiding artificial expansion of the dataset through the inclusion of all mathematically possible but unresolved sequence combinations.
3.3.2. Reference Lineages Within the Octonucleate Sequences
Thirty five SSU rDNA sequences of octonucleate Entamoeba isolates were retrieved from GenBank (Table 6). Examination of the secondary structure-based alignment showed that most paired regions were highly conserved among them. However, high sequence variability was presented in several helices (Supplementary Figure S1), leading in some cases to ambiguously alignable regions that were excluded from the initial lineage inference analysis (Supplementary Figure S2).
Comparative analyses of the downloaded sequences initially identified 9 reference lineages in both the masked and trimmed alignments. Among them, one corresponded to the currently recognised E. muris, one to Entamoeba sp. RL7, and one to Entamoeba sp. RL11. The remaining lineages comprised sequences currently assigned to E. coli ST1–ST3. Subtypes ST1 and ST3 each corresponded to a single lineage, whereas ST2 comprised multiple lineages whose delimitation was more clearly established using the ST2 dataset (Table 7; Supplementary Table S1). The increased resolution provided by this dataset was particularly evident for sequences AF149914 and FR686440: although they showed substantial sequence divergence (p-distance = 0.0169), the initial analysis assigned them to the same lineage because no CBCs were detected between them, whereas the ST2-specific analysis resolved them into two distinct lineages; consequently, 10 reference lineages were finanlly identified (Table 6). Sequence FR686408 differed from other sequences in its lineage (EC2-UAM) by one CBC (1279G-1288C vs AU) or hemi-CBC (GC vs GU)(positions refer to the complete alignment coordinates in Supplementary Figure S2). However, the minimum p-distance between FR686408 and the other lineage members was 0.0016, which is below the applicable thresholds (Table 8), supporting the retention of FR686408 within the lineage.
As the objective of the present study was not to redefine the taxonomic limits of E. coli, none of these lineages was assigned to E. coli sensu stricto, and they were provisionally designated as E. coli-RLs or E. coli-CLs (Table 6). All pairs of lineages differed by at least two CBCs, supporting their recognition as distinct lineages (Table 7; Supplementary Table S1). The masked and trimmed alignments yielded only minor differences in the p-distances, π, and corresponding Birky 4×π thresholds calculated for these 10 lineages (Table 8), without affecting any threshold-based decisions or final lineage assignments.
3.3.3. Genetic Divergence and Secondary Structure-Based Analysis of the Rhea and Galliform Isolates Relative to Other Octonucleate Entamoeba Species and Lineages
The galliform isolates showed marked genetic divergence from all identified octonucleate Entamoeba species and lineages in both the masked and trimmed alignments (Table 8; Supplementary Figure S2). Pairwise comparisons revealed minimum p-distances that consistently exceeded the predefined divergence threshold of 0.010. Likewise, for all lineages in which nucleotide diversity could be estimated, the minimum observed p-distance exceeded the corresponding Birky’s 4×π value. CBC analyses further showed that the galliform isolates differed from all identified octonucleate species and lineages by 38–67 CBCs (Table 8; Supplementary Table S1), providing unequivocal support for their recognition as a distinct evolutionary lineage.
The lesser rhea isolates were identical to one of the lineages identified within E. coli subtype ST2, namely E. coli CL EC2-PM (Table 8; Supplementary Figure S2). Pairwise comparisons yielded a p-distance of 0.0000 and no CBC differences between the rhea isolates and this lineage, whereas comparisons with all remaining reference lineages exceeded the predefined divergence threshold and, where applicable, the corresponding Birky’s 4×π value. The second-round analysis restricted to the E. coli ST2 lineages detected additional CBCs between the lesser rhea isolates and the remaining ST2 lineages (Table 8; Supplementary Table S1 and Supplementary Figure S3). For example, the number of CBCs relative to E. coli EC2-NIH increased from 9 to 14, and that relative to E. coli EC2-TAZ from 1 to 3, whereas the identity of the rhea isolates with E. coli CL EC2-PM remained unchanged.
3.3.4. Phylogenetic Relationships
The trimmed alignment used for phylogenetic analyses comprised 2,069 positions (Supplementary Figure S2). The topology of the trees was identical between the ML and MP methods. The E. muris, Entamoeba sp. RL7, and RL11 sequences together formed a well-separated branch with high bootstrap support forming the E. muris-like clade, whereas the galliform sequences formed a sister clade with moderate to low bootstrap support (Figure 4A). The E. coli subtypes were clearly separated from one another with high bootstrap support, and together formed a distinct, likewise strongly supported clade (the E. coli-like clade) (Figure 4A). Within ST2, all lineages identified in the structural analyses were recovered on separate branches with high bootstrap support, except for the branch grouping the EC2-PM/EC2-UAM lineages to the exclusion of EC2-TAZ, which received moderate to low support (Figure 4B).
4. Discussion
4.1. Morphological Variability Among Octonucleate Entamoeba and the Identification of the Galliform Isolates as E. gallinarum
The comparison of the rhea and galliform isolates with other octonucleate Entamoeba datasets further illustrates the limited taxonomic value of cyst size when considered in isolation. The rhea and galliform isolates did not differ significantly from one another, and both were morphometrically indistinguishable from several published datasets traditionally assigned to E. coli and E. muris; conversely, they differed significantly from others assigned to these same nominal species. Likewise, the box-and-whisker comparison revealed extensive overlap among morphometric distributions and failed to identify discrete groups corresponding to the currently recognized species. Instead, morphometric similarity often crossed species boundaries, whereas datasets assigned to the same nominal species differed significantly from one another.
This pattern is consistent with observations made during the earliest morphometric studies of E. coli. Several authors noted that cyst-size distributions were not always continuous but frequently suggested the existence of distinct morphometric populations [36]. Malins Smith [19], based on his data and that of W.A. Kuenen and N.H. Swellengrebel [35] suggested the existence of morphologically distinct forms. James R. Matthews [20] distinguished three principal size groups among human isolates, while noting that mixed infections could obscure their recognition. Nevertheless, these observations were largely dismissed, and the prevailing view, strongly influenced by authors such as S.L. Brug [37] and C. Dobell [38,39], became that E. coli represented a single morphologically variable species, with cyst size ranging between 11 and 36 µm [19]. Similar conclusions were reached in E. muris by Neal [17], who consistently observed two morphotypes (one originally found in mice and another in rats) but ultimately interpreted them as intraspecific variation.
Current molecular evidence provides a different perspective. Both E. coli and E. muris are now known to comprise multiple genetically distinct lineages [9,12,40]. However, no direct relationship has yet been established between these molecular lineages and the morphometric variation described for these species in classical literature [17,18,20], which could have reflected genuine biological entities rather than simple phenotypic variation. Recently, W. Qian and coworkers [40] identified several Entamoeba lineages related to E. muris, but they considered their morphological analyses preliminary and insufficient to support firm conclusions. To our knowledge, the present study provides the first detailed morphometric data for a molecularly characterized E. coli ribosomal lineage. The isolate from lesser rheas shares an identical SSU rDNA sequence with isolates corresponding to E. coli CL EC2-PM recovered from humans in Peru and Malawi [12], thereby extending the known host and geographic distribution of this lineage. Notably, the rhea-human lineage belongs to the genetically heterogeneous E. coli ST2 assemblage; therefore, the morphometric data presented here can only be confidently attributed to this particular lineage and should not be extrapolated to ST2 as a whole or to other genetically closely related genetic lineages.
Collectively, these observations support the view that morphology alone does not provide reliable species-level discrimination among octonucleate Entamoeba [12]. Nevertheless, subtle but consistent morphometric differences should not be dismissed, as they may represent the phenotypic expression of independently evolving lineages whose distinctiveness can only be confidently established through molecular characterization. Further morphological studies of molecularly characterized octonucleate Entamoeba lineages are needed to determine whether particular morphometric patterns correspond to genetically differentiated lineages.
In this context, E. gallinarum remains the only Entamoeba species described to date from galliform birds producing octonucleate cysts [1], and records of octonucleate cysts in galliform and related avian hosts have consistently been attributed to this species based on host origin and cyst morphology, with no evidence of additional compatible species [15,16,41,42,43]. This species was regarded as common in chickens [3], based on its detection in approximately 30% of a large sample examined in Pennsylvania [16]. However, cysts may be rarely present in faeces [16]. This could explain why prevalence data remain remarkably scarce, and the few data available indicate this species is rarely detected: 4.5% among 176 free-ranging domestic chickens in southern Chile [43] and 0.9% in ducks in Egypt [42]. In the present study, octonucleate Entamoeba cysts were detected in only 3 of the 103 galliform samples examined (2.9%). This proportion should not be interpreted as an estimate of prevalence because the sampling was not designed as an epidemiological survey; nevertheless, it reflects the considerable practical difficulty encountered in obtaining material attributable to E. gallinarum, which ultimately delayed the completion of this study.
No morphological data are provided in recent studies reporting E. gallinarum. Although the cyst size of the galliform isolates examined in this study differed significantly from measurements of E. gallinarum published in the first half of the 20th century [6,15,16], these differences should be interpreted with caution. Despite the large standardized difference observed relative to Hegner’s dataset [15], the estimated overlap between morphometric distributions remained substantial (approximately 51%), indicating that a large proportion of cysts fall within the same size range. Furthermore, the high within-sample variability indicates that the observed differences do not support the recognition of a clear morphological discontinuity.
Methodological factors may also contribute to these discrepancies. Although it was previously considered that, at least in E. histolytica, iodine does not affect cyst size [44], fixation, dehydration, and staining procedures are known to alter cell dimensions in protists and may influence comparisons among studies [45,46,47].
Importantly, statistically significant morphometric differences can also be found among the classical descriptions of E. gallinarum. Hegner’s measurements (15 ± 1.2 µm; [15]) differ significantly from both the midpoint of the cyst diameter range reported by Tyzzer [6] (13.5 µm; one-sample t-test: t = 3.703, df = 9, p = 0.002) and the mean value reported by McDowell [16] (12.5 µm; one-sample t-test: t = 6.391, df = 9, p < 0.001). Therefore, statistically significant differences in cyst size can occur even among the published reference descriptions of the same nominal species. Together with the broad overlap between size distributions observed in the present study, these findings indicate that statistical significance alone should not be interpreted as evidence of taxonomic distinctness.
Taken together, the available evidence supports interpreting the observed morphometric differences as part of the variation within E. gallinarum. From a taxonomic perspective, the most conservative approach is therefore to assign the present isolates to E. gallinarum: they originate from its characteristic host group, are morphologically compatible with previous descriptions, and no other octonucleate Entamoeba species has been described from avian hosts that would allow an alternative identification.
Nevertheless, the consistent difference in cyst size detected between the present isolates and historical descriptions raises the possibility that E. gallinarum, like E. coli and E. muris, may eventually prove to comprise a complex of cryptic species. By itself, however, the morphometric difference observed between the present isolates and published descriptions does not justify the recognition of a separate species. Any taxonomic proposal based solely on this character would be difficult to support, particularly in view of the substantial overlap between size distributions, the absence of additional diagnostic morphological characters, and the precedent that comparable morphometric differences in E. coli and E. muris were historically interpreted as intraspecific variation until molecular data became available [1]. In this respect, the current taxonomic situation of E. gallinarum closely resembles that previously encountered in E. coli and E. muris: morphological variation is presently interpreted within a single nominal species because comparative molecular evidence is lacking, but future sequencing of additional galliform isolates, particularly those whose morphology more closely matches the original descriptions of E. gallinarum, may reveal that this variation corresponds to independently evolving cryptic lineages. Such data will determine whether the observed variation represents a single morphologically variable species or multiple independently evolving lineages. Until comparative molecular data from additional galliform isolates become available, the most reasonable taxonomic approach is to identify the present isolates as E. gallinarum. Under this interpretation, the molecular data reported here constitute the first SSU rDNA sequences attributable to this species.
4.2. Genetic Variability, Ribosomal Lineages and Species Delimitation Among Octonucleate Entamoeba
4.2.1. Ribosomal Lineages Among Octonucleate Entamoeba
During the 20th century, the taxonomy of Entamoeba, like that of many other protozoa, was based primarily on morphology and host identity. The introduction of molecular methods, principally those based on the SSU rRNA gene, has substantially altered the taxonomy within the genus. Molecular evidence has expanded the known host ranges of species previously considered restricted to particular host groups [10,48,49], resolved taxonomic synonymies [24,50], and revealed considerable genetic variation within nominal species [12,30,51,52,53,54]. One consequence of these studies has been the recognition that, although morphology and host identity may contribute to species identification, these features are generally not reliable criteria on their own for species delimitation [1].
The first published SSU rDNA sequences of Entamoeba species already revealed substantial genetic variability within E. coli, although the available molecular evidence was not considered sufficient at that time to justify the description of new species [55]. In response to the extensive genetic diversity subsequently detected within the genus, C.R. Stensvold and coworkers proposed in 2011 [9] an informal system of ribosomal lineages intended to accommodate this variability and to avoid a proliferation of species established solely on sequence differences. Under this system, ribosomal lineages were recognized mainly from their phylogenetic relationships and bootstrap support and they could eventually be formally described as species when adequate morphological information became available [9,30]. The system has since been widely adopted, and formal descriptions of new species have been restricted to a few cases involving marked genetic differentiation, such as Entamoeba bangladeshi [56], or organisms for which no compatible species had previously been described, such as Entamoeba marina from marine sediments [57] and the uninucleate-cyst-forming Entamoeba chiangraiensis from eels [58].
The 2011 proposal also established subtypes within two species, E. coli and Entamoeba polecki (synonymizing several closely related species in the latter case), and subtypes were later also introduced for E. gingivalis [53]. Unlike ribosomal lineages, which were regarded as potentially corresponding to distinct species, subtypes were initially interpreted as variants (phylogenetic clusters) within a species. More recently, however, an additional E. coli subtype was described and the possibility that the subtypes of this nominal species represent distinct species was explicitly acknowledged [54]. Likewise, the species previously synonymized as subtypes of E. polecki have been reinstated as valid species [24]. Because the genetic variability represented by subtypes and ribosomal lineages ultimately reflects the differentiation of evolutionary lineages, whether recognized within a named species (subtypes) or not yet assigned to one (the RL and CL categories of Entamoeba sp.) [24], we use the ribosomal lineage designation (RL/CL depending on sequence length) for the former E. coli subtypes to provide a consistent terminology, while retaining names that indicate their correspondence with the original subtype designations.
A modification of the original phylogeny-based system for lineage delimitation has recently been proposed to bring species delimitation criteria in Entamoeba into closer agreement with the usual requirements of formal taxonomy, particularly the identification of observable diagnostic differences [1,24]. Under the original system, lineage recognition depended on operational thresholds applied to bootstrap support for phylogenetic clustering. Although bootstrap support is not a measure of sequence divergence, this approach shares with distance-based delimitation methods, including those relying on barcoding gaps [59,60], the use of an analysis-dependent numerical threshold that does not itself constitute an observable diagnostic character. The use of operational thresholds for species delimitation has been, and remains, the subject of intense debate among taxonomists [61,62,63,64,65,66,67,68,69,70,71,72,73,74]. The recently proposed approach [24] replaces lineage delimitation based on bootstrap-supported phylogenetic clustering with a character-based criterion relying on observable molecular differences, namely CBCs at homologous positions in the rRNA secondary structure. In this system, genetic distance thresholds are used as indicator of possible distinctiveness that require further analysis rather than as lineage delimitation criteria.
Application of this revised framework shows that the genetic diversity currently subsumed under E. coli can be partitioned into several well-differentiated ribosomal lineages. However, lineage assessment in the present study was restricted to the relatively small number of sequences that met the similarity and length requirements established for their inclusion in our analyses. This limitation is particularly relevant to E. coli, to which a large number of sequences have been assigned [9,12]. A comprehensive assessment of genetic variation within E. coli sensu lato was beyond the scope of this study; therefore, a broader analysis may reveal additional lineages beyond those identified here.
The former E. coli subtypes should not be regarded simply as intraspecific variants: subtypes ST1 and ST3 each correspond to a distinct lineage (supporting the proposal by [12]), whereas the sequence diversity observed within ST2 is distributed among several independently differentiated lineages. This subdivision is well supported by CBCs at homologous positions in the SSU rRNA secondary structure. The relatively low number of CBCs (3-13) separating the ST2 lineages from one another, compared with those separating them from the other E. coli subtypes (11-34), is also consistent with their closer phylogenetic relationships. Notably, some lineages only contained partial sequences, which may have reduced the number of CBCs detectable in some of the pairwise comparisons. As already recognized for the main E. coli subtypes [12], the lineages identified within E. coli sensu lato represent independently differentiated evolutionary entities which, in an asexual organism such as Entamoeba, are expected to correspond to distinct species-level entities [1,24]. They should not be assumed to constitute intraspecific variants merely because they have traditionally been assigned to the same nominal species. To contextualize their differentiation, sequences FR686444 (CL EC2-TAZ) and FR686443 (CL EC2-PM), representing the two most closely related E. coli lineages in the phylogenetic analysis, differed by three CBCs and showed a p-distance of 0.023 and a patristic distance of 0.0111 substitutions per site (sps) in the ML tree. For comparison, E. histolytica and E. nuttalli, which are recognized as distinct valid species and estimated to have diverged 5.93 ± 0.28 million years ago (Mya) [75], differed by one CBC and showed a p-distance of 0.008 and a patristic distance of 0.0044 sps, whereas E. histolytica and E. dispar, estimated to have diverged 9.97 ± 1.37 Mya [75], differed by one CBC and showed a p-distance of 0.018 and a patristic distance of 0.0158 sps. Although coarse, this comparison provides an informative evolutionary frame of reference and reinforces the CBC-based interpretation that even the relatively small differences separating some E. coli lineages may be taxonomically meaningful rather than merely reflecting intraspecific or intra-subtype variation.
4.2.2. Species Delimitation and Formal Proposal of Entamoeba Choiquei sp. nov.
Within the current lineage-based framework used for Entamoeba, formal taxonomic recognition requires adequate morphological characterization [1,9,30]. The present study provides the morphological and molecular data required for the formal taxonomic assessment of the rhea isolates/E. coli RL EC2-PM lineage. As stated in previous sections, morphology alone does not provide reliable species-level discrimination among octonucleate Entamoeba; however, this lineage displays diagnostic genetic differences from the remaining octonucleate Entamoeba lineages.
Determining which of the lineages currently assigned to E. coli should retain the name E. coli sensu stricto also lies beyond the scope of the present study. Clifford Dobell [38] attributed the authorship of E. coli to the Italian zoologist B. Grassi [76]. In his account, Grassi referred to several human cases in Italy, but did not include any morphological or morphometric data that would allow the nominal species to be associated with any of the detailed descriptions published subsequently [18,19,20,35,38] or with the present description of the rhea isolates. As Grassi’s material is unavailable for analysis, it is impossible to specifically associate it with any of the presently recognized genetic lineages. Resolving which lineage should retain the name E. coli sensu stricto will require a comprehensive taxonomic and nomenclatural revision, potentially including the designation of a neotype characterized by both morphological and molecular data from the geographical area represented by Grassi’s account.
Isolates assigned to E. coli subtype ST2 have been reported from humans and animals predominantly in the Southern Hemisphere [12]. Although this distribution does not preclude this subtype as previously defined or any of the lineages into which it is here resolved, from representing E. coli sensu stricto, it provides no positive basis for associating any of these lineages, and specifically the rhea isolate/EC2-PM lineage, with Grassi’s Italian material. Assigning this lineage to E. coli sensu stricto would be especially difficult to justify. Therefore, we make the taxonomic decision not to retain the EC2-PM lineage among the candidates for E. coli sensu stricto, and we formally propose its recognition as a distinct species, characterized as follows:
Proposed name: Entamoeba choiquei n.sp.
Type host: lesser rhea, Darwin’s rhea, or choique (Rhea pennata)
Description: cysts (Figure 4A) spherical or slightly ovoid, 13-22 µm in diameter (mean 17.1 ± 1.7 µm), containing eight nuclei evenly distributed in the cytoplasm. Cytoplasm sometimes slightly denser in the central region. Nuclei measure 2-4 µm in diameter (mean 2.5 ± 0.5 µm), with a punctiform endosome, occasionally eccentric, and uniformly distributed peripheral chromatin.
Reference SSU rDNA sequence: GenBank accession number FN396614.
Differential diagnosis: the species is morphologically indistinguishable from other octonucleate Entamoeba species; its delimitation is based on compensatory base changes in the SSU rRNA secondary structure. Barcode regions include SSU rRNA helix 29 (5’ side: positions 862-898; 3’ side: positions 903-934) and helix 35 (5’ side: positions 1123-1156; 3’ side: positions 1192-1224). DNA barcode sequences: 5’-AAACAGAACAGAAATCAATATTGAATTATGGGGATGG (SSU rRNA helix 29, 5’ side; positions 862-898) and 5’-AAGGATTGGATAAGAAATTTCTGAAGTATGGGAT (helix 35, 5’ side; positions 1123-1156).
Other hosts: Human (inferred from sequence identity with human isolates, GenBank accession numbers FR686443 and FR686445).
4.3. A secondary Structure Guided Workflow for Alignment Validation and CBC Analysis
The secondary structure-guided workflow developed in the present study is consistent with the most recent proposal for SSU rRNA gene-based taxonomy in Entamoeba [24]. It combines positional homology, reversible masking of ambiguously aligned regions, and taxon-specific alignment refinement into an iterative and reproducible workflow. Consequently, this approach provides a transparent and reproducible framework for subsequent studies of closely related rRNA sequences for which secondary structure models are available. To facilitate these CBC comparisons, we developed the Enta-LISA script.
The quality of the alignment is crucial in sequence comparison and phylogenetic analyses. General-purpose multiple sequence alignment programs primarily infer positional correspondence from primary sequence similarity, whereas programs developed specifically for rRNA or other non-coding RNAs can incorporate secondary structure information in different ways. SSU-ALIGN [77] aligns sequences to pre-existing covariance models representing the consensus sequence and secondary structure of reference SSU rRNAs, whereas approaches such as those implemented in MAFFT (Q-INS-i and X-INS-i options; [78]) and R-Coffee [79] automatically generate the structural information used to guide the alignment. Although these approaches incorporate secondary structure information, they do not use structural models that have been individually evaluated and refined through a detailed procedure like the one we applied in the present study. A related validation strategy was recently applied to E. muris-like lineages [40] by using sequence-based alignments generated with ClustalX and MAFFT (FFT-NS-i option) to evaluate positional homology; that study excluded regions regarded as ambiguously aligned from another alignment generated with the structurally informed MAFFT Q-INS-i option. In the present study, the first relevant requirement was that the alignment method could use the secondary structure model established for each sequence. For this purpose, mLocARNA [29,80] and RNAlign2D [81] were initially considered because both can use a sequence-specific secondary structure model as input. However, neither program explicitly verifies the coordinated positional homology of both partners of each base pair in the resulting alignment. Consequently, bases aligned at homologous positions on one side of a helix could have their pairing partners aligned at different positions on the opposite side. mLocARNA was selected because such structural inconsistencies occurred in fewer helices and affected shorter sequence regions than with RNAlign2D.
A central problem addressed by the proposed workflow and also encountered by automated alignment-filtering methods is that primary sequence variation among divergent rRNA sequences may make positional homology difficult to establish in some regions of alignments. Such regions should not be regarded as uncertain merely because they are variable and discarded by default. In the present study, trimming affected estimates of within-lineage nucleotide diversity and π tended to be lower, and the number of CBCs detected between closely related lineages (as it is the case of those within the E. coli subtype ST2) was also lower. Besides, variable regions may contain substantial phylogenetic information. The trimmed alignment contained 188 fewer positions than the complete alignment (8.3% of its length) and retained 497 of the 627 parsimony-informative sites; thus, trimming removed approximately 21% of these sites, this indicating that excluded regions could not be regarded as uniformly uninformative. Ambiguously alignable regions should be evaluated individually rather than retained or excluded indiscriminately.
Automated filtering methods address the effects of alignment uncertainty primarily in phylogenetic inference, whereas the present procedure was developed to establish positional correspondence for CBC analysis; phylogenetic inference is a secondary application of the resulting alignment. Widely used programs such as Gblocks [82,83], trimAl [84], BMGE [85] and ClipKIT [86] evaluate properties of the columns (positions) in pre-existing alignments, while GUIDANCE, GUIDANCE2 [87,88] and TCS [89] assess reliability through alternative alignments or local consistency. Although these approaches provide reproducible measures of alignment reliability, they do not specifically evaluate positional homology within the architecture of a conserved RNA secondary structure. By contrast, the present approach used pairing relationships and helix architecture to distinguish structurally homologous positions from regions in which positional correspondence remained uncertain. This distinction is particularly relevant for rRNA because primary sequence divergence and length can be highly variable in expansion regions among divergent species or lineages even when the secondary structure model is conserved.
Ambiguously alignable positions can be excluded from the initial analysis and later reassessed in less divergent subsets, in which previously masked positions can be retained [90,91,92]. This approach is important for CBC analysis: a position whose homology cannot be established provides no evidence for either the presence or absence of a CBC. Reversible masking thus helps prevent the inference of spurious CBCs in broad comparisons without permanently discarding positions that can be validated within a narrower taxonomic scope.
The implications for phylogenetic analysis are less straightforward. The retention of ambiguously alignable regions may introduce spurious similarities or differences, whereas their indiscriminate exclusion may remove informative variation, particularly for relationships among closely related lineages, this reducing phylogenetic resolution or even worsen tree reconstruction [86,90,93]. Depth-dependent effects have been reported in relation to rRNA regions associated with expansion segments and indel-rich stem–loop structures [90,94,95], and the exclusion of such regions has long been recommended for analyzing deep phylogenetic relationships [90,96]. A tiered strategy may therefore be appropriate for phylogenetic analysis: ambiguously alignable regions would initially be excluded when examining relationships among the main, more divergent lineages, whereas additional analyses could subsequently be conducted within selected clades using lineage-specific alignments in which previously trimmed regions had been reassessed and, where positional homology is supported, restored.
The workflow used in this study was designed to evaluate potential lineages within a restricted group of congeneric sequences rather than as a general filtering strategy for large, taxonomically broad alignments. Its principal limitation is its reliance on expert evaluation of RNA structure, which makes it less readily scalable than fully automated filtering and increases the need for detailed documentation. Its performance in broader and more heterogeneous datasets would require specific evaluation, particularly because the iterative recovery of trimmed or masked positions depends on identifying restricted and internally coherent sequence subsets. Reproducibility can be improved by providing the complete and trimmed alignments, documenting the affected regions and structural criteria, and reporting analyses from both datasets.
5. Conclusions
The galliform isolates examined in this study showed cyst size distributions that differed from published data but clearly overlapped with them. Direct molecular identification was not possible because no SSU rDNA sequences are available from previously studied galliform isolates, whether or not they are morphometrically compatible with the original description of E. gallinarum. Because the observed morphometric differences alone would not provide sufficient grounds for proposing a new species, we adopted a conservative approach and assigned our isolates to E. gallinarum, the only Entamoeba species hitherto described from galliform birds and the only octonucleate species described from avian hosts. Molecular analyses of additional galliform isolates, particularly those morphometrically compatible with the original description of E. gallinarum, will be needed to determine whether this taxon comprises several genetically distinct lineages, as has been shown for E. coli and E. muris.
The cyst morphometry of the lesser rhea isolates was compatible with that of E. gallinarum sensu this study, E. coli, and E. muris, whereas their SSU rDNA sequence was identical to that of a lineage within E. coli subtype ST2. Our analysis of published E. coli sequences further identified several lineages delimited by CBCs, supporting previous evidence that E. coli represents a cryptic species complex. Without attempting to determine which of these lineages corresponds to E. coli sensu stricto, we propose that the lineage represented by the lesser rhea isolates constitutes a distinct species, herein named Entamoeba choiquei.
Finally, the workflow developed here provides a reproducible framework for analyzing SSU rDNA sequence data and genetic differentiation within Entamoeba. Its implementation in the R script Enta-LISA integrates primary sequence divergence with CBC comparisons between SSU rRNA secondary structures, facilitating the identification and delimitation of independently evolving lineages and providing a useful basis for subsequent taxonomic assessments.
Supplementary Materials
The following supporting information can be downloaded at Preprints.org, File S1: Enta-LISA script (R code); Figure S1: Generic secondary structure model of the SSU rRNA of octonucleate Entamoeba; Figure S2: Secondary structure-based sequence alignment of octonucleate Entamoeba species and lineages; Figure S3: Secondary structure of the SSU rRNA of Entamoeba from lesser rhea isolates (accession number FN396614) and partial sequence-structure alignments showing positions in which compensatory base changes (CBCs) were identified. Table S1: Compensatory base changes (CBCs) in the SSU rRNA secondary structure of selected octonucleate Entamoeba species/lineages.
Author Contributions
Conceptualization, F.P.-G.; methodology, L.E.-S. and F.P.-G.; software, F.P.-G.; validation, L.E.-S. and F.P.-G.; formal analysis, L.E.-S. and F.P.-G.; investigation, L.E.-S. and F.P.-G.; resources, J.L.N., M.B.M. and F.P.-G.; data curation, L.E.-S. and F.P.-G.; writing—original draft preparation, L.E.-S. and F.P.-G.; writing—review and editing, L.E.-S., J.L.N., M.B.M. and F.P.-G.; funding acquisition, J.L.N., M.B.M. and F.P.-G. All authors have read and agreed to the published version of the manuscript.
Funding
This research was funded by the Dirección General de Investigación of the Spanish Ministerio de Educación y Ciencia (Project CGL2006-04343) and by the Research Group on Epidemiology, Diagnosis and Antiparasitic Therapy of the Complutense University (group number 911120).
Institutional Review Board Statement
Ethical approval is not required for this study. Lesser rhea faecal samples were obtained and processed in a previous study (reference [Martínez Díaz et al. 2013]). The rhea and galliform hosts were naturally infected. Faecal samples were spontaneously voided by the animals and collected from the ground by the authors, farmers or owners; no direct manipulation of the animals occurred for the collection of the samples used in this study.
Informed Consent Statement
Not applicable.
Data Availability Statement
The Enta-LISA script is included in the supplementary material of this article and is distributed under a CC BY-SA license. Sequence data have been deposited in the GenBank/EMBL/DDBJ databases under accession numbers FN396614, PZ754747, and PZ754748. Datasets including morphometric data for cysts from the rhea and galliform isolates, the complete (untrimmed) sequence alignment, and phylogenetic tree files, have been deposited in Mendeley Data and are accessible under the DOI: 10.17632/v36mp9bd4n.2 (preview link: https://data.mendeley.com/preview/v36mp9bd4n?a=ceb8ad2d-b434-4463-b0a8-af71a13112a0). Further inquiries can be directed to the corresponding author.
Acknowledgments
During the preparation of this work, the authors used ChatGPT 5.6 to optimize and check R code for errors and to improve grammar and language use. The authors reviewed and edited the output as needed and take full responsibility for the content of the published article.
Conflicts of Interest
The authors declare no conflicts of interest.
Abbreviations
The following abbreviations are used in this manuscript:
| SSU rDNA sequence | DNA sequence encoding the SSU rRNA gene |
| SSU rRNA | small subunit ribosomal RNA sequence. |
References
- Esteban-Sánchez, L.; Martínez-Díaz, R.A.; Ponce-Gordo, F. The Taxonomy of the Genus Entamoeba (Archamoebea: Endamoebidae): A Historical and Nomenclatural Review. Pathogens 2026, 15, 213. [CrossRef]
- Hoare, C.A. Amoebic infections in animals. Vet. Rev. Annot. 1959, 5, 91-102.
- Levine, N.D. Protozoan parasites of domestic animals and of man; Burgess Publishing Co.: Minneapolis, Minnesota, USA, 1961; 412 pp. [CrossRef]
- Fantham, H.B. Observations on the parasitic protozoa of the red grouse (Lagopus scoticus), with a note on the grouse fly. Proc. Zool. Soc. Lond. 1910, 80, 692–708.
- Fantham, H.B. Some parasitic protozoa found in South Africa. VII. S. Afr. J. Sci. 1924, 21, 435–444.
- Tyzzer, E.E. Amoebae of the caeca of the common fowl and of the turkey. – Entamoeba gallinarum, sp.n., and Pygolimax gregariniformis, gen. et. spec. nov. J. Med. Res. 1920, 41, 199-209.
- Ponce-Gordo, F.; Martínez-Díaz, R.A.; Herrera, S. Entamoeba struthionis n.sp. (Sarcomastigophora: Endamoebidae) from ostriches (Struthio camelus). Vet. Parasitol. 2004, 119, 327–335. [CrossRef]
- Wang, Y.; Zeng, Y.; Wu, Y.; Lu, F.; Hou, X.; Shao, J.; Zhang, T.; Shao, C. Molecular characterization and zoonotic potential of Entamoeba spp., Enterocytozoon bieneusi and Blastocystis from captive wild animals in Northwest China. BMC Vet. Res. 2024, 20, 309. [CrossRef]
- Stensvold, C.R.; Lebbad, M.; Victory, E.L.; Verweij, J.J.; Tannich, E.; Alfellani, M.; Legarraga, P.; Clark, C.G. Increased sampling reveals novel lineages of Entamoeba: consequences of genetic diversity and host specificity for taxonomy and molecular detection. Protist 2011, 162, 525–541. [CrossRef]
- Esteban-Sánchez, L.; García-Rodríguez, J.J.; Ponce-Gordo, F. Unusual Findings of Human-Associated Four-Nucleated Entamoeba Species in Captive Wild Animals. Animals 2025, 15, 90. [CrossRef]
- Martínez-Díaz, R.A.; Martella, M.B.; Navarro, J.L.; Ponce-Gordo, F. Gastrointestinal parasites in greater rheas (Rhea americana) and lesser rheas (Rhea pennata) from Argentina. Vet. Parasitol. 2013, 194, 75-78. [CrossRef]
- Stensvold. C.R.; Ascuña-Durand, K.; Chihi, A.; Belkessa, S.; Kurt, Ö.; El-Badry, A.; van der Giezen, M.; Clark, C.G. Futher insight into the genetic diversity of Entamoeba coli and Entamoeba hartmanni. J. Eukaryot. Microbiol. 2023, 70, e12949. [CrossRef]
- Levine, J.A.; Estevez, E.G. Method of concentration of parasites from small amount of feces. J. Clin. Microbiol. 1983, 18, 786–788. [CrossRef]
- Richardson, J.T.E. Eta squared and partial eta squared as measures of effect size in educational research. Educ. Res. Rev. 2011, 6, 135-147. [CrossRef]
- Hegner, R. The infection of parasite-free chicks with intestinal protozoa from birds and other animals. Am. J. Epidemiol. 1929, 9, 33-62. [CrossRef]
- McDowell, S. Jr. A morphological and taxonomic study of the caecal protozoa of the common fowl, Gallus gallus L. J. Morphol. 1953, 92, 337-399. [CrossRef]
- Neal, R.A. An experimental study of Entamoeba muris (Grassi, 1879); its morphology, affinities and host-parasite relationship. Parasitology 1950, 40, 343-365. [CrossRef]
- Mathis, C.; Mercier, L. Existe-t-il des kystes i plus de quatre noyaux chez Entamoeba dysenteriae? Bull Soc. Path. Exot. 1917, 10, 165-170.
- Smith, M.A. Measurements of and observations upon the cysts of Entamoeba histolytica and of Entamoeba coli. Ann. Trop. Med. Parasitol. 1918, 12, 27-69.
- Matthews, J.R. A mensurative study of the cysts of Entamoeba coli. Ann. Trop. Med. Parasitol. 1919, 12, 259-272. [CrossRef]
- Cohen, J. The t Test for Means. In: Cohen, J. (Ed.) Statistical Power Analysis for the Behavioral Sciences, 2nd. Ed. Lawrence Erlbaum Associates, Publishers: Hillsdale (NJ), USA, 1988. Pages 19-74.
- Hedges, L.V.; Olkin, I. Estimation of a Single Effect Size: Parametric and Nonparametric Methods. In: Hedges, L.V.; Olkin, I. (Eds), Statistical Methods for Meta-Analysis. Academic Press: Orlando (FL), USA, 1985. Pages 75-106. [CrossRef]
- Inman, HJ.F.; Bradley, E.L. Jr The overlapping coefficient as a measure of agreement between probability distributions and point estimation of the overlap of two normal densities, Commun. Stat. Theory Methods 1989, 18, 3851-3874. [CrossRef]
- Esteban-Sánchez, L.; Ponce-Gordo, F. Assessing Species Delimitation in Entamoeba (Amoebozoa: Endamoebidae) Using the Small Subunit rRNA Gene: Its Application to the Entamoeba polecki Complex. Microorganisms 2026, 14, 360. [CrossRef]
- Abramson, J.; Adler, J.; Dunger, J.; Evans, R.; Green, T.; Pritzel, A.; Ronneberger, O.; Willmore, L.; Ballard, A.J.; Bambrick, J.; et al. Accurate structure prediction of biomolecular interactions with AlphaFold 3. Nature 2024, 630, 493–500. [CrossRef]
- Lu, X.J.; Bussemaker, H.J.; Olson, W.K. DSSR: An integrated software tool for dissecting the spatial structure of RNA. Nucleic Acids Res. 2015, 43, e142. [CrossRef]
- Lorenz, R.; Bernhart, S.H.; zu Siederdissen, H.; Tafer, H.; Flamm, C.; Stadler, P.F.; Hofacker, I.L. ViennaRNA Package 2.0. Algorithms Mol. Biol. 2011, 6, 26. [CrossRef]
- Seibel, P.N.; Müller, T.; Dandekar, T.; Wolf, M. Synchronous visual analysis and editing of RNA sequence and secondary structure alignments using 4SALE BMC. Res. Notes 2008, 1, 91. [CrossRef]
- Will, S.; Reiche, K.; Hofacker, I.L.; Stadler, P.F.; Backofen, R. Inferring non-coding RNA families and classes by means of genome-scale structure-based clustering. PLoS Comput. Biol. 2007, 3, e65. [CrossRef]
- Jacob, A.S.; Busby, E.J.; Levy, A.D.; Komm, N.; Clark, C.G. Expanding the Entamoeba Universe: New Hosts Yield Novel Ribosomal Lineages. J. Eukaryot. Microbiol. 2016, 63, 69-78. [CrossRef]
- Gutell, R.R.; Larsen, N.; Woese, C.R. Lessons from an evolving rRNA: 16S and 23S rRNA structures from a comparative perspective. Microbiol. Rev. 1994, 58, 10-26. [CrossRef]
- Nei, M.; Li, W.H. Mathematical model for studying genetic variation in terms of restriction endonucleases. Proc. Natl. Acad. Sci. USA 1979, 76, 5269–5273. [CrossRef]
- Birky, C.W., Jr.; Wolf, C.; Maughan, H.; Herbertson, L.; Henry, E. Speciation and selection without sex. Hydrobiologia 2005, 546, 29–45. [CrossRef]
- Kumar, S.; Stecher, G.; Suleski, M.; Sanderford, M.; Sharma, S.; Tamura, K. Molecular Evolutionary Genetics Analysis version 12 for adaptive and green computing. Mol. Biol. Evol. 2024, 41, 1-9. [CrossRef]
- Kuenen, W.A.; Swellengrebel, N.H. Die Entamoben des Menachen und ihre praktische Bedeutung. Centralbl. f. Bakt. I Abt. (Orig.) 1913, 71, 378-410.
- Wenyon, C.; O’Connor, F.W. Human Intestinal Protozoa in the Near East. John Bale, Sons & Danielsson, Ltd.: London, Great Britain, 1917. 218 pp.
- Brug, S.L. Les kystes des amibes intestinalis de l’homme. Bull. Soc. Pathol. Exot. 1917, 10, 799-803.
- Dobell, C. The amoebae living in man. John Bale, Sons & Danielsson, Ltd.: London, Great Britain. 1919, 155 pp.
- Dobell C. Researches on the Intestinal Protozoa of Monkeys and Man: VIII. An Experimental Study of Some Simian Strains of “Entamoeba coli.” Parasitology 1936, 28, 541-593. [CrossRef]
- Qian, W.; Wei, L.; Chen, Y.; Lv, C. Three novel octonucleated Entamoeba lineages in pet fancy rats (Rattus norvegicus) in China: evidence from compensatory base change and phylogenetic analyses. Acta Trop. 2026, 281, 108244. [CrossRef]
- Silvanose, C.D.; Samour, J.H.; Naldo, J.L.M Bailey, T.A. Oro-pharyngeal protozoa in captive bustards: clinical and pathological considerations. Avian Pathol. 1998, 27, 526-530. [CrossRef]
- Abou Laila, M.; El-Bahy, N.; Hilali, M.; Yokoyama, N.; Igarashi, I. Prevalence of enteric parasites of ducks from Behera governorate, Egypt. J. Protozool. Res. 2011, 21, 36-44.
- Torres, P.; Cerna, O.; Rubilar, A.; Subiabre, A.; Oyarzún, P. Blastocystosis y otras infecciones intestinales por parásitos eucarióticos en Gallus gallus domesticus en localidades del sur de Chile. Rev. Inv. Vet. Perú 2020, 31, e19041. [CrossRef]
- Dobell, C; Jepps, M-W. A Study of the Diverse Races of Entamoeba histolytica distinguishable from one another by the dimensions of their Cysts. Parasitology 1918, 10, 320-351. [CrossRef]
- Parker, J.D.; Warner, M.C. Effects of fixation, dehydration and staining on dimensions of myxosporidan. J. Wildl. Dis. 1970, 6, 448-456. [CrossRef]
- Choi, J.W.; Stoecker, D.K. Effects of fixation on cell volume of marine planktonic protozoa. Appl. Environ. Microbiol. 1989, 55, 1761-1765. [CrossRef]
- Zinabu, G.M.; Bott. T.L. The effects of formalin and Lugol’s iodine solution on protozoal cell volume. Limnologica 2000, 30, 59-63. [CrossRef]
- Verweij, J.J.; Polderman, A.M.; Clark, C.G. Genetic variation among human isolates of uninucleated cyst-producing Entamoeba species. J. Clin. Microbiol. 2001, 39, 1644-1646. [CrossRef]
- Levecke, B.; Dorny, P.; Vercammen, F.; Visser, L.G.; van Esbroeck, M.; Vercruysse, J.; Verweij, J.J. Transmission of Entamoeba nuttalli and Trichuris trichiura from nonhuman primates to humans. Emerging Infec. Dis. 2015, 21, 1871-1872. [CrossRef]
- Clark, C.G.; Kaffashian, F.; Tawari, B.; Windsor, J.J.; Twigg-Flesner, A.; Davies-Morel, M.C.G.; Blessmann, J.; Ebert, F.; Peschel, B.; Van, A.L.; Jackson, C.J.; Macfarlane, L.; Tannich, E. New insights into the phylogeny of Entamoeba species provided by analysis of four new small-subunit rRNA genes. Int. J. Syst. Evol. Microbiol. 2006, 56, 2235-2239. [CrossRef]
- Stensvold, C.R.; Lebbad, M.; Clark, C.G. Genetic characterisation of uninucleated cyst-producing Entamoeba spp. from ruminants. Int. J. Parasitol. 2010, 40, 775-778. [CrossRef]
- Elsheikha, H.M.; Regan, C.S.; Clark, C.G. Novel Entamoeba findings in nonhuman primates. Trends Parasitol. 2018, 34, 283-294. [CrossRef]
- García, G. Ramos, F.; Martínez-Hernández, F.; Hernández, L.; Yáñez, J.; Gaytán, P. A new subtype of Entamoeba gingivalis: “E. gingivalis ST2, kamaktli variant”. Parasitol. Res. 2018, 117, 1277-1284. [CrossRef]
- Stensvold, C.R.; Berg, R.P.K.D.; Maloney, J.G.; Molokin, A.; Santin, M. Molecular characterization of Blastocystis and Entamoeba of muskoxen and sheep in Greenland. Int. J. Parasitol. 2023,53, 673-685. [CrossRef]
- Silberman, J.D.; Clark, C.G.; Diamond, L.S. y Sogin, M.L. Phylogeny of the genera Entamoeba and Endolimax as deduced from small-subunit ribosomal RNA sequences. Mol. Biol. Evol. 1999, 16, 1740-1751. [CrossRef]
- Royer, T.L.; Gilchrist, C.; Kabir, M.; Arju, T.; Ralston, K.S.; Haque, R.; Clark, C.G.; Petri, W.A.Jr. Entamoeba Bangladeshi nov. sp., Bangladesh. Emerg. Infect. Dis. 2012, 18, 1543-1545. [CrossRef]
- Shiratori, T.; Ishida, K. Entamoeba marina n. sp.; a new species of Entamoeba isolated from tidal flat sediment of Iriomote Island, Okinawa, Japan. J. Eukaryot. Microbiol. 2016, 63, 280-286. [CrossRef]
- Jinatham, V.; Popluechai, S.; Clark, C.G.; Gentekaki, E. Entamoeba chiangraiensis n. sp. (Amoebozoa: Entamoebidae) isolated from the gut of Asian swamp eel (Monopterus albus) in northern Thailand. Parasitology 2019, 146, 1719-1724. [CrossRef]
- Hebert, P.D.N.; Cywinska, A.; Ball, S.L.; deWaard, J.R. Biological identifications through DNA barcodes. Proc. R. Soc. B 2003, 270, 313-321. [CrossRef]
- Meyer, C.P.; Paulay, G. DNA barcoding: error rates based on comprehensive sampling. PLOS Biol. 2005, 3, e422. [CrossRef]
- Moritz, C.; Cicero, C. DNA Barcoding: Promise and Pitfalls. PLoS Biol. 2004, 2, e354. Doi: 10.1371/journal.pbio.0020354.
- Dasmahapatra, K.K.; Elias, M.; Hill, R.I.; Hoffman, J.I.; Mallet, J. Mitochondrial DNA barcoding detects some species that are real, and some that are not. Mol. Ecol. Resour.2010, 10, 264–273. Doi: 10.1111/j.1755-0998.2009.02763.x.
- Bergsten, J.; Bilton, D.T.; Fujisawa, T.; Elliott, M.; Monaghan, M.T.; Balke, M.; Hendrich, L.; Geijer, J.; Herrmann, J.; Foster, G.N.; et al. The effect of geographical scale of sampling on DNA barcoding. Syst. Biol. 2012, 61, sys037. [CrossRef]
- Stoeckle, M.Y.; Thaler, D.S. DNA barcoding works in practice but not in (neutral) theory. PLoS ONE 2014, 9, e100755. [CrossRef]
- Čandek, K.; Kuntner, M. DNA barcoding gap: reliable species identification over morphological and geographical scales. Mol. Ecol. Resour. 2015, 15, 268-277. [CrossRef]
- Zhang, H.-G.; Lv, M.-H.; Yi, W.-B.; Zhu, W.-B.; Bu, W.-J. Species diversity can be overestimated by a fixed empirical threshold: insights from DNA barcoding of the genus Cletus (Hemiptera: Coreidae) and the meta-analysis of COI data from previous phylogeographical studies. Mol. Ecol. Resour. 2017, 17, 314–323. [CrossRef]
- Meierotto, S.; Sharkey, M.J.; Janzen, D.H.; Hallwachs, W.; Hebert, P.D.; Chapman, E.G.; Smith, M.A. A revolutionary protocol to describe understudied hyper-diverse taxa and overcome the taxonomic impediment. Dtsc. Entomol. Z. 2019, 66, 119-145. [CrossRef]
- Zamani, A.; Vahtera, V.; Sääksjärvi, I.E.; Scherz, M.D. The omission of critical data in the pursuit of “revolutionary” methods to accelerate the description of species. Syst. Entomol. 2020, 46, 1-4. [CrossRef]
- Sharkey, M.J.; Janzen, D.H.; Hallwachs, W.; Chapman, E.G.; Smith, M.A.; Dapkey, T.; Brown, A.; Ratnasingham, S.; Naik, S.; Manjunath, R.; et al. Minimalist revision and description of 403 new species in 11 subfamilies of Costa Rican braconid parasitoid wasps, including host records for 219 species. ZooKeys 2021, 1013, 1-665. [CrossRef]
- Meier, R.; Blaimer, B.; Buenaventura, E.; Hartop, E.; von Rintelen, T.; Srivathsan, A.; Yeo, D. A re-analysis of the data in Sharkey et al.’s (2021) minimalist revision reveals that BINs do not deserve names, but BOLD Systems needs a stronger commitment to open science. Cladistics 2022, 38, 264-275. [CrossRef]
- Sharkey, M.J.; Tucker, E.M.; Baker, A.; Smith, M.A.; Ratnasingham, S.; Manjunath, R.; Hebert, P.; Hallwachs, W.; Janzen, D. More discussion of minimalist species descriptions and clarifying some misconceptions contained in Meier et al. 2021. ZooKeys 2022, 1110, 135-149. [CrossRef]
- Zamani, A.; Fric, Z.F.; Gante, H.F.; Hopkins, T.; Orfinger, A.B.; Scherz, M.D.; Bartoňová, A.S.; Pos, D.D. DNA barcodes on their own are not enough to describe a species. Syst. Entomol. 2022, 47, 385-389. [CrossRef]
- Phillips, J.D.; Gillis, D.J.; Hanner, R.H. Lack of Statistical Rigor in DNA Barcoding Likely Invalidates the Presence of a True Species’ Barcode Gap. Front. Ecol. Evol. 2022, 10, 859099. [CrossRef]
- Emerson, B.C. Delimiting species – prospects and challenges for DNA barcroding. Mol. Ecol. 2025, 34, e17677. [CrossRef]
- Romero, M.; Cerritos, R.; Ximenez, C. Horizontal gene transfers from bacteria to Entamoeba complex: a strategy for dating events along species divergence. J. Parasitol. Res. 2016, 2016, 3241027. [CrossRef]
- Grassi, B. Dei Protozoi parassiti e specialmente di quelli che sono nell’uomo. Gazz. Med. Ital.-Lombard. 1879, 39, 445-448.
- Nawrocki, E.P. Structural RNA homology search and alignment using covariance models. PhD Thesis, Washington University School of Medicine, St. Louis, MO, USA, 2009.
- Katoh, K.; Standley, D.M. MAFFT multiple sequence alignment software version 7: improvements in performance and usability. Mol. Biol. Evol. 2013, 30, 772-780. [CrossRef]
- Wilm, A.; Higgins, D.G.; Notredame, C. R-Coffee: a method for multiple alignment of non-coding RNA. Nucleic Acids Res. 2008, 36, e52. [CrossRef]
- Will, S.; Joshi, T.; Hofacker, I.L.; Stadler, P.F.; Backofen, R. LocARNA-P: Accurate boundary prediction and improved detection of structural RNAs. RNA 2012, 18, 900-914. [CrossRef]
- Woźniak, T.; Sajek, M.; Jaruzelska, J.; Sajek, M.P. RNAlign2D: a rapid method for combined RNA structure and sequence-based alignment using a pseudo-amino acid substitution matrix. BMC Bioinformatics 2021, 22, 504. [CrossRef]
- Castresana, J. Selection of conserved blocks from multiple alignments for their use in phylogenetic analysis. Mol. Biol. Evol.2000, 17, 540–552. [CrossRef]
- Talavera, G.; Castresana, J. Improvement of phylogenies after removing divergent and ambiguously aligned blocks from protein sequence alignments. Syst. Biol. 2007, 56, 564–577. [CrossRef]
- Capella-Gutiérrez, S.; Silla-Martínez, J.M.; Gabaldón, T. trimAl: a tool for automated alignment trimming in large-scale phylogenetic analyses. Bioinformatics 2009, 25, 1972–1973. [CrossRef]
- Criscuolo, A.; Gribaldo, S. BMGE (Block Mapping and Gathering with Entropy): a new software for selection of phylogenetic informative regions from multiple sequencealignments. BMC Evol. Biol. 2010, 10, 210. [CrossRef]
- Steenwyk, J.L.: Buida, T.J. III; Li, Y.; Shen, X.-X.; Rokas, A. ClipKIT: A multiple sequence alignment trimming software for accurate phylogenomic inference. PLoS Biol. 2020, 18, e3001007. [CrossRef]
- Penn, O.; Privman, E.; Ashkenazy, H.; Landan, G.; Graur, D.; Pupko, T. GUIDANCE: a webserver for assessing alignment confidence scores. Nucleic Acids Res. 2010, 38, 23–28. [CrossRef]
- Sela, I.; Ashkenazy, H.; Katoh, K.; Pupko, T. GUIDANCE2: accurate detection of unreliable alignment regions accounting for the uncertainty of multiple parameters, Nucleic Acids Res. 2015, 43 (W1), W7–W14. Doi: 10.1093/nar/gkv318.
- Chang, J.-M.; Di Tommaso, P.; Notredame, C. TCS: A New Multiple Sequence Alignment Reliability Measure to Estimate Alignment Accuracy and Improve Phylogenetic Tree Reconstruction, Mol. Biol. Evol. 2014, 31, 1625-1637. [CrossRef]
- Lutzoni, F.; Wagner, P.; Reeb, V.; Zoller, S. Integrating ambiguously aligned regions of DNA sequences in phylogenetic analyses without violating positional homology. Syst. Biol. 2000, 49, 628-651. [CrossRef]
- Gatesy, J., DeSalle, R., & Wheeler, W. C. Alignment-ambiguous nucleotide sites and the exclusion of systematic data. Mol. Phylogenet. Evol. 1993, 2, 152–157. [CrossRef]
- Pepato, A.R.; Klimov, P.B. Origin and higher-level diversification of acariform mites - evidence from nuclear ribosomal genes, extensive taxon sampling, and secondary structure alignment. BMC Evol. Biol. 2015, 15, 178. [CrossRef]
- Tan, G.; Muffato, M.; Ledergerber, C.; Herrero, J.; Goldman, N.; Gil, M.; Dessimoz, C. Current methods for automated filtering of multiple sequence alignments frequently worsen single-gene phylogenetic inference. Syst. Biol. 2015, 64, 778–791. [CrossRef]
- Letsch, H.O.; Kjer, K.M. Potential pitfalls of modelling ribosomal RNA data in phylogenetic tree reconstruction: evidence from case studies in the Metazoa. BMC Evol Biol. 2011, 11, 146. [CrossRef]
- Rajan, V. A method of alignment masking for refining the phylogenetic signal of multiple sequence alignments. Mol. Biol. Evol. 2013, 30, 689-712. [CrossRef]
- Guillespie, J.J. Characterizing regions of ambiguous alignment caused by the expansion and contraction of hairpin-stem loops in ribosomal RNA molecules. Mol. Phylogenet. Evol. 2004, 33, 933-943. [CrossRef]
Figure 1.
Operational workflow for lineage inference and sequence assignment. The flowchart details the steps and programs used in this study. The boxed area at the bottom outlines the iterative reassessment procedure (steps 5–6) used to assign the rhea and galliform isolates to lineages, with each comparison incorporating as much SSU rRNA secondary structure information as possible.
Figure 1.
Operational workflow for lineage inference and sequence assignment. The flowchart details the steps and programs used in this study. The boxed area at the bottom outlines the iterative reassessment procedure (steps 5–6) used to assign the rhea and galliform isolates to lineages, with each comparison incorporating as much SSU rRNA secondary structure information as possible.
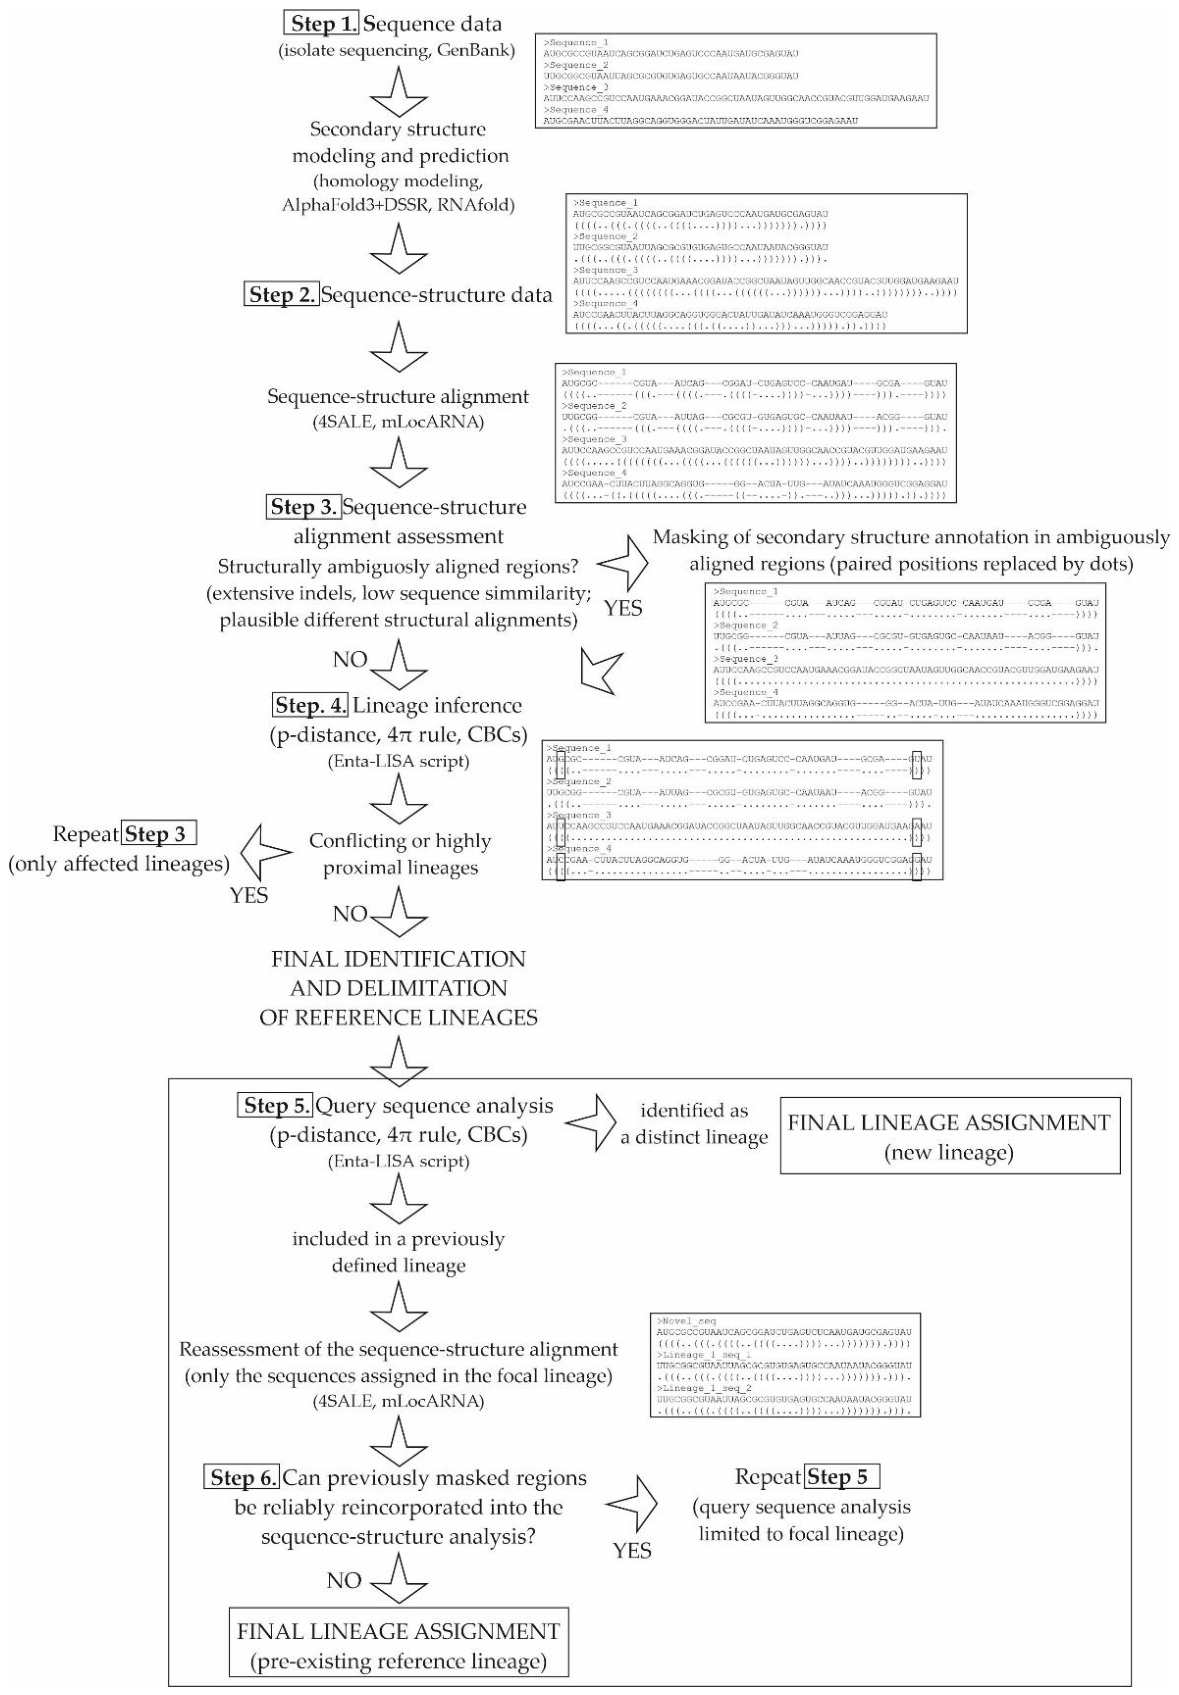
Figure 2.
Octonucleate Entamoeba cysts found in lesser rheas (A-C) and galliform birds (D-E) stained with Lugol’s iodine (A, D-F), Trichromic (B), and Chlorazole black (C). Images E and F correspond to different optical planes of the same cyst. Scale bar: 10 µm.
Figure 2.
Octonucleate Entamoeba cysts found in lesser rheas (A-C) and galliform birds (D-E) stained with Lugol’s iodine (A, D-F), Trichromic (B), and Chlorazole black (C). Images E and F correspond to different optical planes of the same cyst. Scale bar: 10 µm.
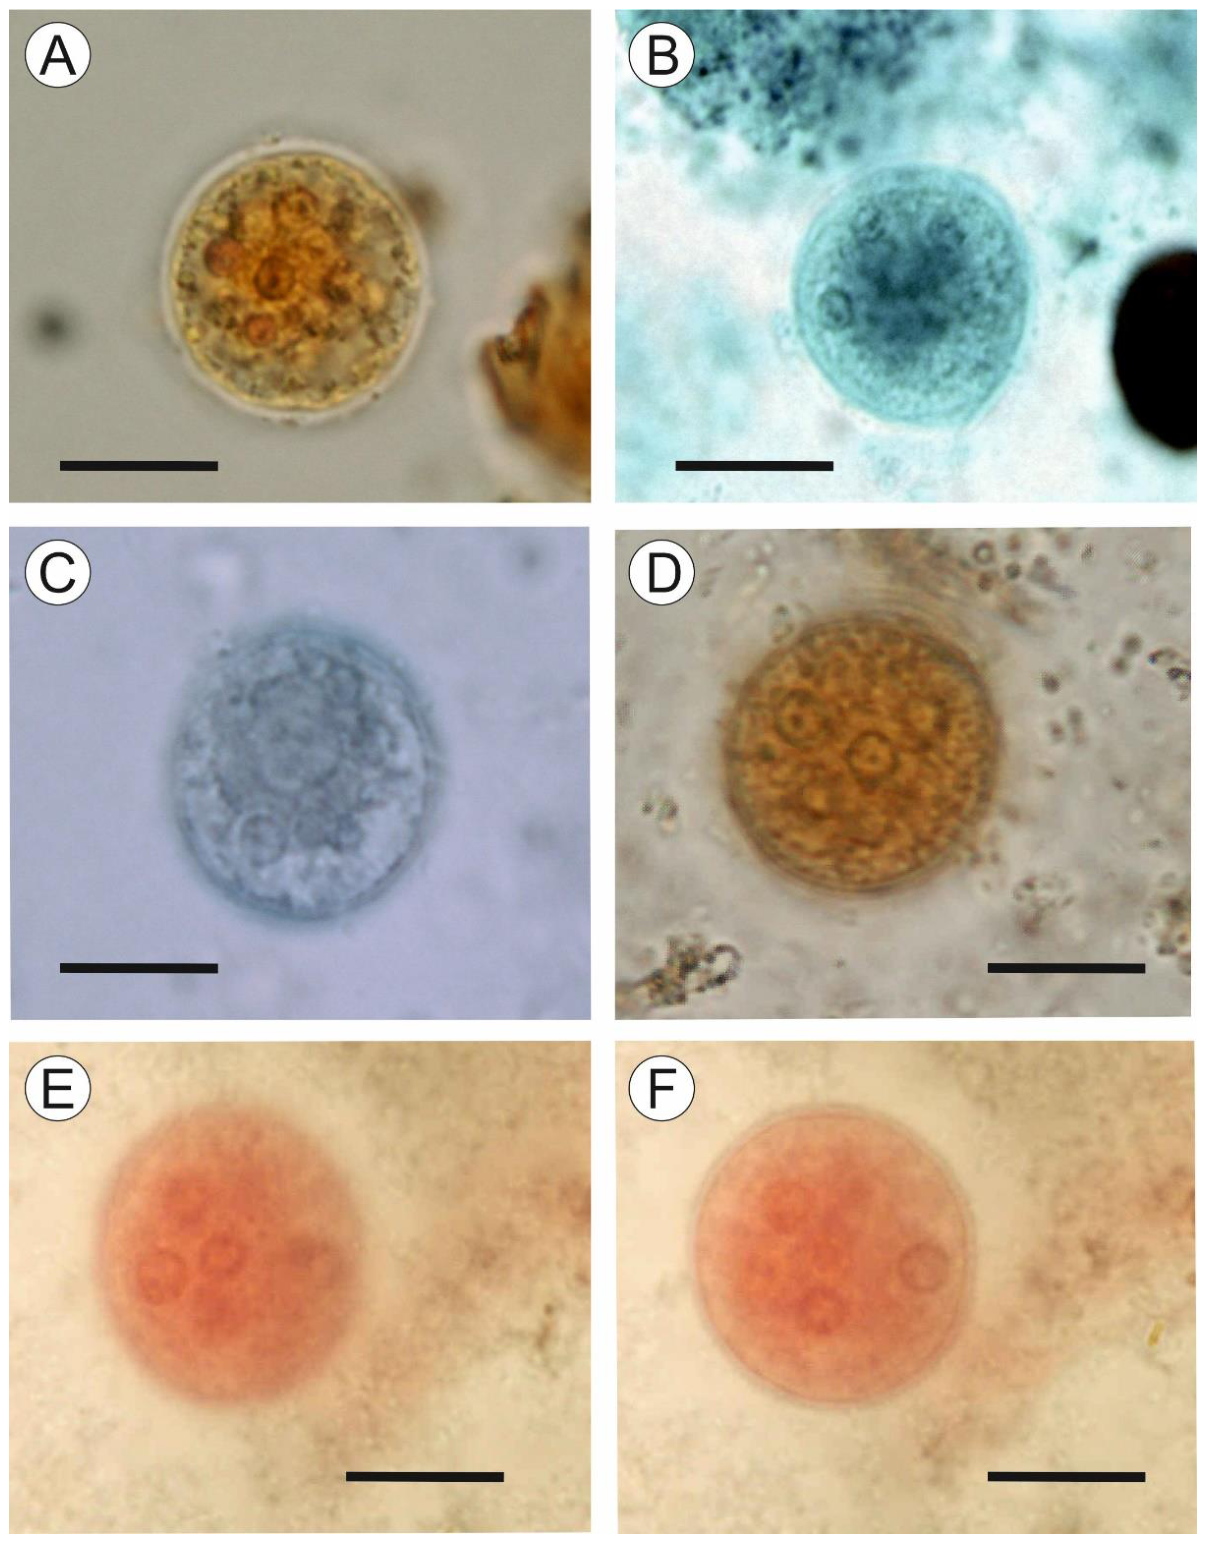
Figure 3.
Mean cyst diameter (center marks), ±1 standard deviation (boxes), and observed range (whiskers) for rhea isolates, galliform isolates, and published datasets of octonucleate Entamoeba. Dataset codes: (1) rhea isolates, present study; (2) galliform isolates, present study; (3) Entamoeba gallinarum [15]; (4) Entamoeba coli [35]; (5) E. coli [18]; (6) E. coli [19]; (7–10) E. coli [20], human samples #3, #13, #22, and #27, respectively; (11–12) Entamoeba muris [17], mouse and rat isolates, respectively.
Figure 3.
Mean cyst diameter (center marks), ±1 standard deviation (boxes), and observed range (whiskers) for rhea isolates, galliform isolates, and published datasets of octonucleate Entamoeba. Dataset codes: (1) rhea isolates, present study; (2) galliform isolates, present study; (3) Entamoeba gallinarum [15]; (4) Entamoeba coli [35]; (5) E. coli [18]; (6) E. coli [19]; (7–10) E. coli [20], human samples #3, #13, #22, and #27, respectively; (11–12) Entamoeba muris [17], mouse and rat isolates, respectively.
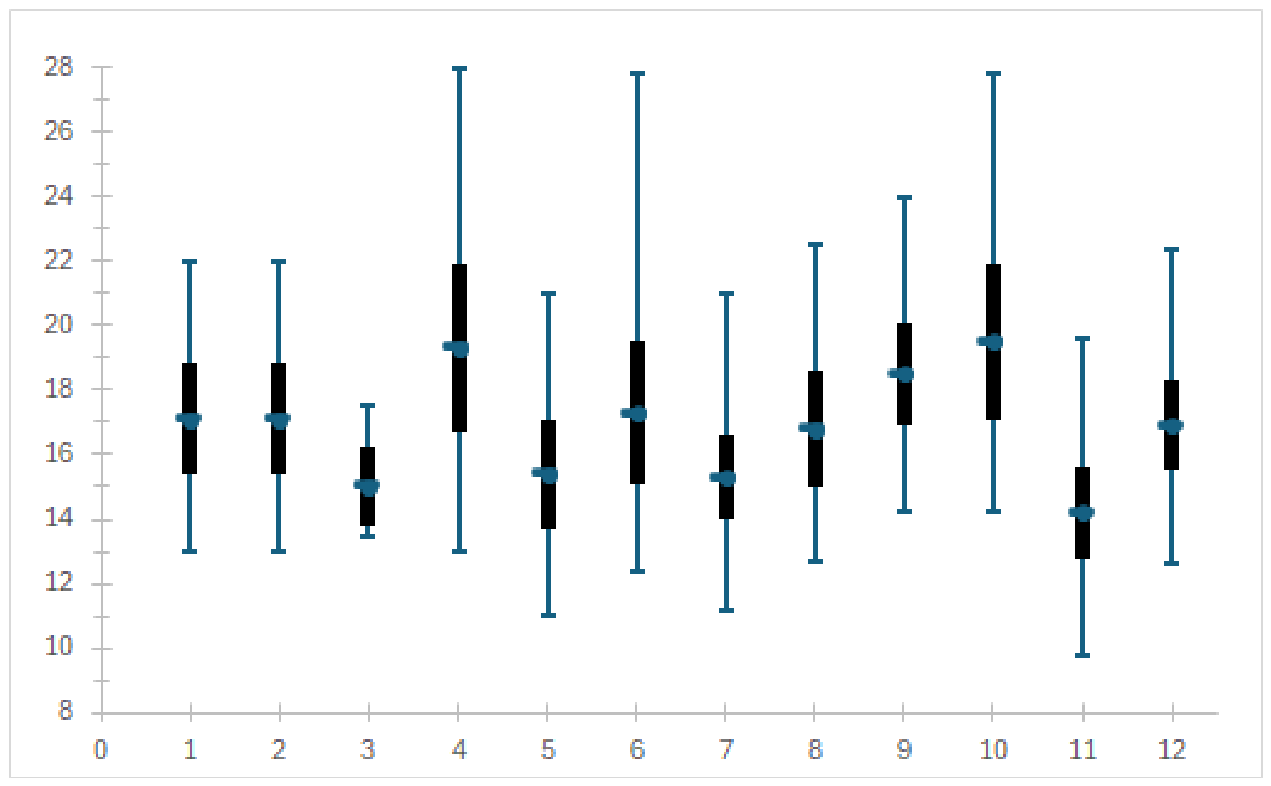
Figure 4.
A) Phylogenetic tree inferred from the trimmed alignment of SSU rDNA sequences of octonucleate Entamoeba species and lineages using the maximum likelihood (ML) method and the Tamura-Nei model of nucleotide evolution. A discrete Gamma distribution was used to model evolutionary rate differences among sites (5 categories; +G parameter = 0.5693) with 33.59% of sites deemed evolutionarily invariant (+I) . The subtree corresponding to the Entamoeba coli subtype ST2 is collapsed but it is shown in detail in (B). Two alternative sequences (AS1 and AS2) were used for the sequence PZ754748 (guinea fowl isolate; see text for details). The tree is rooted using the sequences Entamoeba histolytica X65163, Entamoeba dispar Z49256 and Entamoeba nuttalli AB282657 as the outgroup. Numbers at the nodes represent the bootstrap support values computed from 500 replicates for the ML and maximum parsimony methods, respectively. The tree is drawn to scale, with branch lengths measured in the number of substitutions per site. B) The subtree comprising the E. coli subtype ST2 lineages from the tree in (A). The sequences obtained in this study are marked in bold.
Figure 4.
A) Phylogenetic tree inferred from the trimmed alignment of SSU rDNA sequences of octonucleate Entamoeba species and lineages using the maximum likelihood (ML) method and the Tamura-Nei model of nucleotide evolution. A discrete Gamma distribution was used to model evolutionary rate differences among sites (5 categories; +G parameter = 0.5693) with 33.59% of sites deemed evolutionarily invariant (+I) . The subtree corresponding to the Entamoeba coli subtype ST2 is collapsed but it is shown in detail in (B). Two alternative sequences (AS1 and AS2) were used for the sequence PZ754748 (guinea fowl isolate; see text for details). The tree is rooted using the sequences Entamoeba histolytica X65163, Entamoeba dispar Z49256 and Entamoeba nuttalli AB282657 as the outgroup. Numbers at the nodes represent the bootstrap support values computed from 500 replicates for the ML and maximum parsimony methods, respectively. The tree is drawn to scale, with branch lengths measured in the number of substitutions per site. B) The subtree comprising the E. coli subtype ST2 lineages from the tree in (A). The sequences obtained in this study are marked in bold.
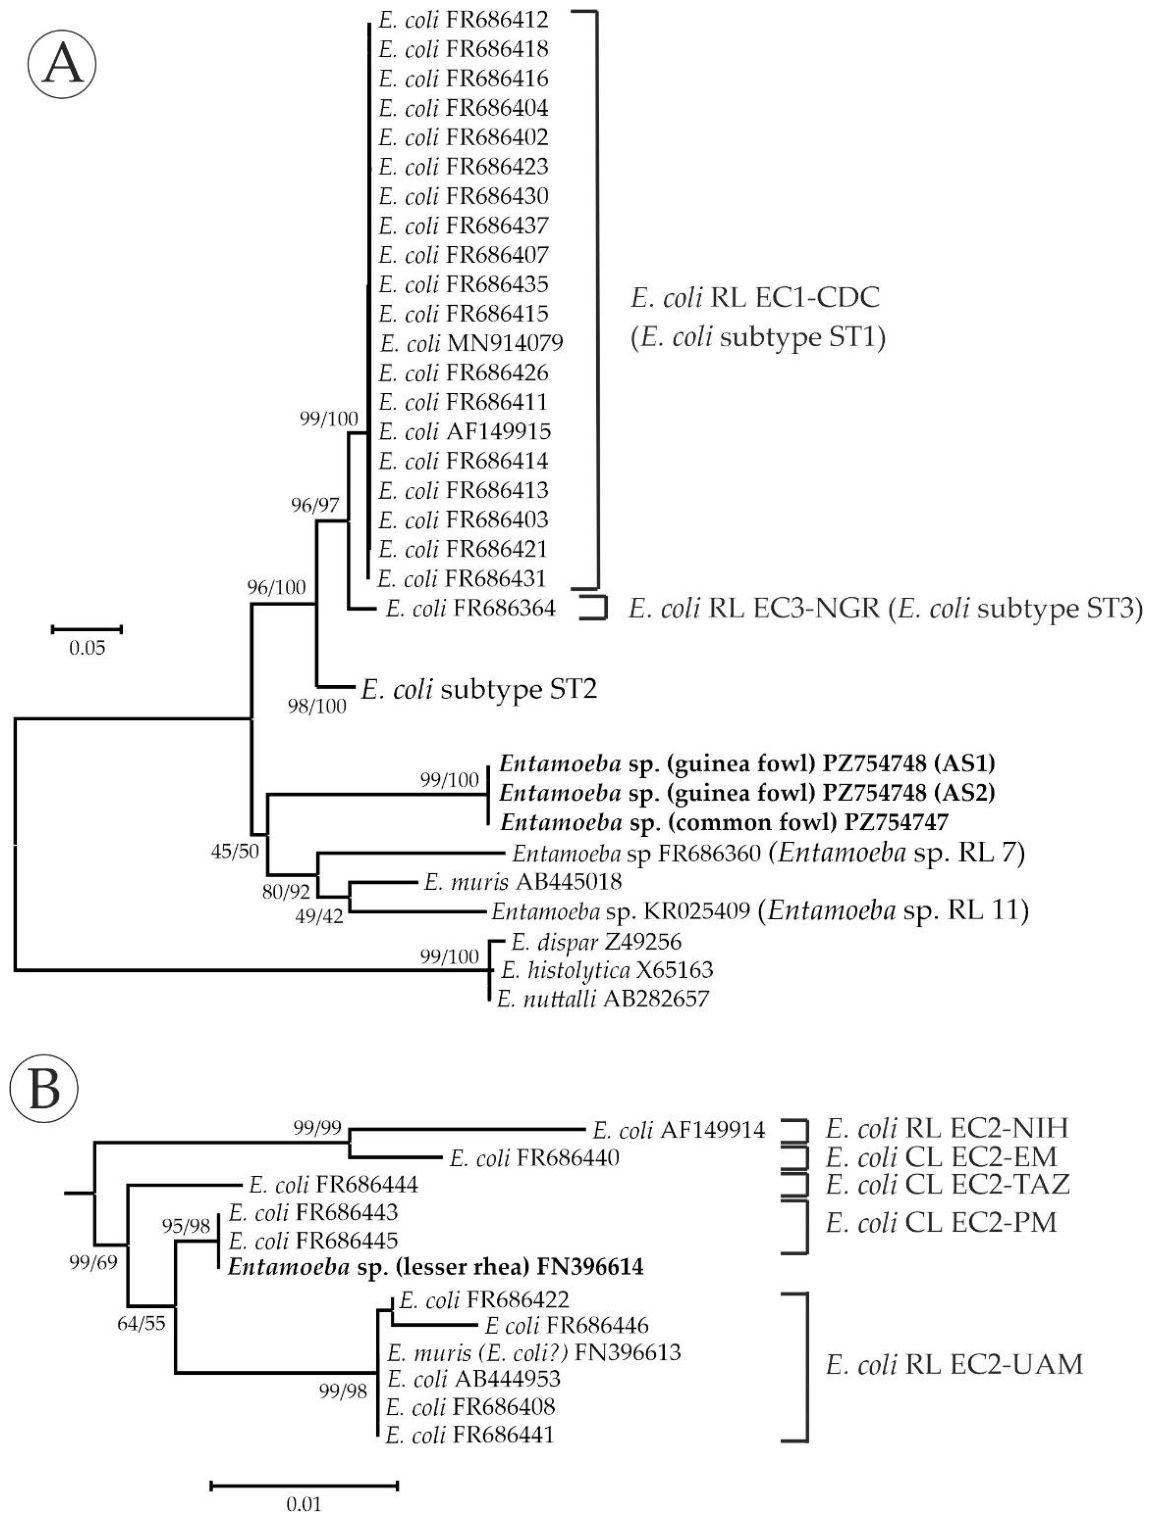

Table 1.
Descriptive statistics for the octonucleate Entamoeba cysts from lesser rheas and galliform birds (common fowl and guinea fowl) analyzed in this study. For each sample and staining method, the mean value ± standard deviation, size range, and sample size (n) are provided. All measurements are given in micrometers.
Table 1.
Descriptive statistics for the octonucleate Entamoeba cysts from lesser rheas and galliform birds (common fowl and guinea fowl) analyzed in this study. For each sample and staining method, the mean value ± standard deviation, size range, and sample size (n) are provided. All measurements are given in micrometers.
| Staining method | ||||||
| Host | Isolate | Parameter | Lugol’s iodine | Chlorazole black | Trichromic | Combined data |
| Lesser rhea | LR1 | cyst diameter | 17.5±1.6 (14-21) | 16.7±1.5 (14-20) | 16.8±1.7 (14-22) | 17.0±1.6 (14-22) |
| (n=37) | (n=30) | (n=31) | (n=98) | |||
| nucleus diameter | 2.7±0.5 (2-4) | 2.5±0.6 (2-4) | 2.4±0.5 (2-4) | 2.6±0.5 (2-4) | ||
| (n=92) | (n=73) | (n=85) | (n=250) | |||
| LR2 | cyst diameter | 17.3±1.8 (14-21) | 16.8±1.9 (13-21) | 17.0±1.5 (14-20) | 17.0±1.7 (13-21) | |
| (n=30) | (n=30) | (n=30) | (n=90) | |||
| nucleus diameter | 2.5±0.5 (2-4) | 2.6±0.6 (2-4) | 2.5±0.5 (2-4) | 2.5±0.5 (2-4) | ||
| (n=77) | (n=81) | (n=80) | (n=238) | |||
| LR3 | cyst diameter | 17.7±1.5 (15-21) | 16.9 ±1.8 (13-20) | 17.5±1.6 (14-21) | 17.4±1.6 (13-21) | |
| (n=32) | (n=30) | (n=30) | (n=92) | |||
| nucleus diameter | 2.6±0.5 (2-4) | 2.5±0.5 (2-4) | 2.5±0.5 (2-4) | 2.5±0.5 (2-4) | ||
| (n=80) | (n=80) | (n=85) | (n=245) | |||
| Combined data | cyst diameter | 17.5±1.6 (14-21) | 16.8±1.7 (13-21) | 17.1±1.6 (14-22) | 17.1±1.7 (13-22) | |
| (n=99) | (n=90) | (n=91) | (n=280) | |||
| nucleus diameter | 2.6±0.5 (2-4) | 2.5±0.5 (2-4) | 2.5±0.5 (2-4) | 2.5±0.5 (2-4) | ||
| (n=249) | (n=234) | (n=250) | (n=733) | |||
| Common fowl | GA1 | cyst diameter | 16.9±1.9 (13-21) | 16.9±1.9 (13-21) | ||
| (n=32) | (n=32) | |||||
| nucleus diameter | 2.5±0.6 (2-4) | 2.5±0.6 (2-4) | ||||
| (n=85) | (n=85) | |||||
| Common fowl | GA2 | cyst diameter | 17.1 ±1.4 (15-20) | 17.1 ±1.4 (15-20) | ||
| (n=30) | (n=30) | |||||
| nucleus diameter | 2.4±0.5 (2-4) | 2.4±0.5 (2-4) | ||||
| (n=90) | (n=90) | |||||
| Guinea fowl | GA3 | cyst diameter | 17.4±1.6 (15-22) | 17.4±1.7 (15-22) | ||
| (n=30) | (n=30) | |||||
| nucleus diameter | 2.6±0.6 (2-4) | 2.6±0.6 (2-4) | ||||
| (n=90) | (n=90) | |||||
| Combined data | cyst diameter | 17.1±1.7 (13-22) | 17.1±1.7 (13-22) | |||
| (n=92) | (n=92) | |||||
| nucleus diameter | 2.5±0.6 (2-4) | 2.5±0.6 (2-4) | ||||
| (n=265) | (n=265) | |||||
Table 2.
Results of the ANOVAs assessing the effects of isolate, staining method, and their interaction on cyst and nuclear diameters in galliform and rhea isolates. Effect sizes are reported as eta squared (η²). Abbreviations: d.f. = degrees of freedom; p = p-value.
Table 2.
Results of the ANOVAs assessing the effects of isolate, staining method, and their interaction on cyst and nuclear diameters in galliform and rhea isolates. Effect sizes are reported as eta squared (η²). Abbreviations: d.f. = degrees of freedom; p = p-value.
| Host origin | Variable | Effect | df | F | p | η² |
| Galliform birds | Cyst diameter | Isolate | 2, 89 | 0.512 | 0.601 | 0.011 |
| Nuclear diameter | Isolate | 2, 262 | 0.996 | 0.371 | 0.008 | |
| Lesser rhea | Cyst diameter | Isolate | 2, 271 | 1.244 | 0.290 | 0.009 |
| Staining method | 2, 271 | 3.795 | 0.024 | 0.027 | ||
| Isolate × staining method | 4, 271 | 0.215 | 0.930 | 0.003 | ||
| Nuclear diameter | Isolate | 2, 724 | 0.410 | 0.664 | 0.001 | |
| Staining method | 2, 724 | 3.160 | 0.043 | 0.009 | ||
| Isolate × staining method | 4, 724 | 2.009 | 0.091 | 0.011 |
Table 3.
Significant Bonferroni-adjusted pairwise comparisons among staining methods in rhea isolates. Only statistically significant comparisons are shown. Mean differences and 95% confidence intervals (CIs) are expressed in micrometers. Abbreviation: p = Bonferroni-adjusted p-value.
Table 3.
Significant Bonferroni-adjusted pairwise comparisons among staining methods in rhea isolates. Only statistically significant comparisons are shown. Mean differences and 95% confidence intervals (CIs) are expressed in micrometers. Abbreviation: p = Bonferroni-adjusted p-value.
| Variable | Comparison | Mean diff. | 95% CI | p |
| Cyst diameter | Lugol vs. Chlorazole black | 0.661 | 0.081–1.240 | 0.019 |
| Nuclear diameter | Lugol vs. Trichromic | 0.119 | 0.005–0.233 | 0.037 |
Table 4.
Comparison of cyst diameter between the present study (galliform hosts) and the dataset reported by [15]. For each dataset, the sample size (n), mean ± standard deviation, and size range (in micrometers) are shown. Differences between datasets were evaluated using the Mann–Whitney U test and Welch’s t-test. Abbreviations: U, Mann–Whitney statistic; Z, standardized test statistic; t, Welch’s t-value; d.f., degrees of freedom; p, significance level (p-value).
Table 4.
Comparison of cyst diameter between the present study (galliform hosts) and the dataset reported by [15]. For each dataset, the sample size (n), mean ± standard deviation, and size range (in micrometers) are shown. Differences between datasets were evaluated using the Mann–Whitney U test and Welch’s t-test. Abbreviations: U, Mann–Whitney statistic; Z, standardized test statistic; t, Welch’s t-value; d.f., degrees of freedom; p, significance level (p-value).
| Mann-Whitney | Welch’s t | ||||||||
| Dataset | n | Mean ± sd | Range | U | Z | p | t | df | p |
| Present study (galliform hosts) | 92 | 17.1 ± 1.7 | 13–22 | 131.000 | -3.75 | <0.001 | 5.178 | 13.05 | <0.001 |
| [15] | 10 | 15.0 ± 1.2 | 14-18 | ||||||
Table 5.
Comparative morphometric data for the cyst diameters of rhea isolates, galliform isolates, and published datasets of octonucleate Entamoeba. All values are given in micrometers. The p-values correspond to pairwise comparisons between each dataset and the rhea isolates, obtained using the Games–Howell (G-H) post hoc test following one-way ANOVA.
Table 5.
Comparative morphometric data for the cyst diameters of rhea isolates, galliform isolates, and published datasets of octonucleate Entamoeba. All values are given in micrometers. The p-values correspond to pairwise comparisons between each dataset and the rhea isolates, obtained using the Games–Howell (G-H) post hoc test following one-way ANOVA.
|
Cyst diameter |
Comparison with rhea isolates G-H p-value |
|||||
| Species / sample | Data source | n | mean ± s.d. | range | ||
| Entamoeba sp. (rhea origin) | present study | 280 | 17.1 ± 1.7 | 13.0 - 22.0 | ||
| Entamoeba sp. (galliform origin) | present study | 92 | 17.1 ± 1.7 | 13.0 - 22.0 | 1.000 | |
| Entamoeba gallinarum | [15] | 10 | 15.0 ± 1.2 | 13.5 - 17.5 | 0.007 | |
| Entamoeba coli | [35] | 100 | 19.3 ± 2.6 | 13.0 - 28.0 | <0.001 | |
| E. coli | [18] | 100 | 15.4 ± 1.7 | 11.0 - 21.0 | <0.001 | |
| E. coli | [19] | 1000 | 17.3 ± 2.2 | 12.4 - 27.8 | 0.973 | |
| E. coli - human #3 | [20] | 1000 | 15.3 ± 1.3 | 11.2 - 21.0 | <0.001 | |
| E. coli - human #13 | [20] | 200 | 16.8 ± 1.8 | 12.7 - 22.5 | 0.693 | |
| E. coli - human #22 | [20] | 1000 | 18.5 ± 1.6 | 14.2 - 24.0 | <0.001 | |
| E. coli - human #27 | [20] | 500 | 19.5 ± 2.4 | 14.2 - 27.8 | <0.001 | |
| Entamoeba muris - mouse | [17] | 200 | 14.2 ± 1.4 | 9.8 - 19.6 | <0.001 | |
| E. muris - rat | [17] | 200 | 16.9 ± 1.4 | 12.6 - 22.4 | 0.822 | |
Table 6.
GenBank sequences of octonucleate Entamoeba species and lineages included in this study, their assignment to the lineages inferred herein, and the correspondence of these lineages with previously recognized species, ribosomal or candidate lineages (RLs/CLs), and subtypes (STs).
Table 6.
GenBank sequences of octonucleate Entamoeba species and lineages included in this study, their assignment to the lineages inferred herein, and the correspondence of these lineages with previously recognized species, ribosomal or candidate lineages (RLs/CLs), and subtypes (STs).
| Lineage designation | Previous designation | Sequences included | Host | Location |
| Entamoeba muris | Entamoeba muris | AB445018 | Mongolian gerbil (Meriones ungiculatus) |
Japan |
| Entamoeba coli RL EC1-CDC | E. coli ST1 | AF149915 | Human | USA |
| MN914079 | Human | Germany | ||
| FR686402 | Human | n/a | ||
| FR686403 | Human | n/a | ||
| FR686404 | Human | n/a | ||
| FR686407 | Human | n/a | ||
| FR686411 | Human | n/a | ||
| FR686412 | Human | n/a | ||
| FR686413 | Human | n/a | ||
| FR686414 | Human | n/a | ||
| FR686415 | Human | n/a | ||
| FR686416 | Human | n/a | ||
| FR686418 | Human | n/a | ||
| FR686421 | Human | n/a | ||
| FR686423 | Human | Brazil | ||
| FR686426 | Human | n/a | ||
| FR686430 | Human | n/a | ||
| FR686431 | Human | n/a | ||
| FR686435 | Human | n/a | ||
| FR686437 | Human | n/a | ||
| E. coli RL EC2-NIH | E. coli ST2 | AF149914 | Human | UK |
| E. coli RL EC2-UAM | E. muris / E. coli ST2 | FN396613 | Rat (Rattus rattus) | Spain |
| E. coli ST2 | AB444953 | Gorilla (Gorilla gorilla) | Japan | |
| FR686408 | Human | n/a | ||
| FR686422 | Human | n/a | ||
| FR686441 | Human | n/a | ||
| FR686446 | Human | Ecuador | ||
| E. coli CL EC2-EM | E. coli ST2 | FR686440 | Human | n/a |
| E. coli CL EC2-PM | E. coli ST2 | FR686443 | Human | Peru |
| FR686445 | Human | Malawi | ||
| E. coli CL EC2-TAZ | E. coli ST2 | FR686444 | Human | Tanzania |
| E. coli RL EC3-NGR | E. coli ST3 | FR686364 | Human | Nigeria |
| Entamoeba sp. RL 7 | Entamoeba sp. RL 7 | FR686360 | Phayre’s leaf monkey (Trachypithecus phayrei) |
UK |
| Entamoeba sp. RL 11 | Entamoeba sp. RL 11 | KR025409 | Short-tailed field vole (Microtus agrestis) |
UK |
Table 7.
Compensatory base changes in the SSU rRNA secondary structure among the identified species and lineages of octonucleate Entamoeba. Values in the outlined cells were obtained from the analysis restricted to Entamoeba coli subtype ST2 using the complete sequence-structure alignment. All remaining values were obtained with structurally ambiguous regions trimmed or masked. Codes: EMU: Entamoeba muris; CDC: Entamoeba coli ribosomal lineage (RL) EC1-CDC; NIH: E. coli RL EC2-NIH; UAM: E. coli RL EC2-UAM; EM: E. coli conditional lineage (CL) EC2-EM; PM: E. coli CL EC2-PM; TAZ: E. coli CL EC2-TAZ; NGR: E. coli RL EC3-NGR; E7: Entamoeba sp. RL7; E11: Entamoeba sp. RL11.
Table 7.
Compensatory base changes in the SSU rRNA secondary structure among the identified species and lineages of octonucleate Entamoeba. Values in the outlined cells were obtained from the analysis restricted to Entamoeba coli subtype ST2 using the complete sequence-structure alignment. All remaining values were obtained with structurally ambiguous regions trimmed or masked. Codes: EMU: Entamoeba muris; CDC: Entamoeba coli ribosomal lineage (RL) EC1-CDC; NIH: E. coli RL EC2-NIH; UAM: E. coli RL EC2-UAM; EM: E. coli conditional lineage (CL) EC2-EM; PM: E. coli CL EC2-PM; TAZ: E. coli CL EC2-TAZ; NGR: E. coli RL EC3-NGR; E7: Entamoeba sp. RL7; E11: Entamoeba sp. RL11.
| EMU | CDC | NIH | UAM | EM | PM | TAZ | NGR | E7 | |
| CDC | 53 | ------ | |||||||
| NIH | 60 | 31 | ------ | ||||||
| UAM | 57 | 28 | 10 | ------ | |||||
| EM | 30 | 12 | 2 | 9 | ------ | ||||
| PM | 31 | 11 | 6 | 5 | 5 | ------ | |||
| TAZ | 29 | 11 | 5 | 4 | 6 | 3 | ------ | ||
| NGR | 62 | 18 | 26 | 26 | 12 | 12 | 11 | ------ | |
| E7 | 43 | 60 | 60 | 58 | 32 | 33 | 32 | 60 | ------ |
| E11 | 39 | 50 | 63 | 61 | 39 | 38 | 38 | 58 | 46 |
Table 8.
Nucleotide diversity (π) and corresponding Birky 4×π thresholds for the identified reference lineages of octonucleate Entamoeba, and pairwise genetic distance ranges, threshold evaluations, and compensatory base change (CBC) counts in comparisons with the Entamoeba isolates from lesser rheas and galliform birds, based on the trimmed and masked alignments. Additional comparisons between the lesser rhea isolates and Entamoeba coli subtype ST2 lineages were performed using an ST2-restricted alignment (see text for details). For each species or lineage, the number of sequences (n), π, and the 4×π value are shown. The “thresholds exceeded” column indicates whether the observed p-distance range exceeded the 0.010 threshold and the corresponding 4×π value, respectively. CBC counts were identical for the trimmed and masked alignment datasets and are therefore reported only once. When a species or lineage included only one sequence, π, 4×π and the corresponding Birky-based comparison are indicated as not determined (nd).
Table 8.
Nucleotide diversity (π) and corresponding Birky 4×π thresholds for the identified reference lineages of octonucleate Entamoeba, and pairwise genetic distance ranges, threshold evaluations, and compensatory base change (CBC) counts in comparisons with the Entamoeba isolates from lesser rheas and galliform birds, based on the trimmed and masked alignments. Additional comparisons between the lesser rhea isolates and Entamoeba coli subtype ST2 lineages were performed using an ST2-restricted alignment (see text for details). For each species or lineage, the number of sequences (n), π, and the 4×π value are shown. The “thresholds exceeded” column indicates whether the observed p-distance range exceeded the 0.010 threshold and the corresponding 4×π value, respectively. CBC counts were identical for the trimmed and masked alignment datasets and are therefore reported only once. When a species or lineage included only one sequence, π, 4×π and the corresponding Birky-based comparison are indicated as not determined (nd).
| galliform isolates | lesser rhea isolates | |||||||||||
| Species/lineage | n | Alignment type | π | 4×π | p-distance range | thresholds exceeded | CBCs | p-distance range | thresholds exceeded | CBCs | ||
|
Entamoeba from galliform birds |
4 | trimmed | 0.0007 | 0.0027 | 0-2171-0.2171 | yes / yes | 67 | |||||
| masked | 0.0006 | 0.0025 | 0.2514-0.2514 | yes / yes | ||||||||
| E. muris | 1 | trimmed | nd | nd | 0.2266-0.2271 | yes / nd | 62 | 0.1966-0.1966 | yes / nd | 60 | ||
| masked | nd | nd | 0.2672-0.2677 | yes / nd | 0.2315-0.2315 | yes / nd | ||||||
| E. coli RL EC1-CDC | 20 | trimmed | 0.0005 | 0.0022 | 0.1988-0.2200 | yes / nd | 56 | 0.0861-0.1012 | yes / yes | 28 | ||
| masked | 0.0011 | 0.0044 | 0.2400-0.2562 | yes / nd | 0.1189-0.1530 | yes / yes | ||||||
| E. coli RL EC2-NIH | 1 | trimmed | nd | nd | 0.2175-0.2175 | yes / nd | 68 | 0.0313-0.0313 | yes / nd | 6 | ||
| masked | nd | nd | 0.2512-0.2512 | yes / nd | 0.0466-0.0466 | yes / nd | ||||||
| ST2-restricted | nd | nd | 0.0466-0.466 | yes / nd | 11 | |||||||
| E. coli RL EC2-UAM | 6 | trimmed | 0.0022 | 0.0088 | 0.2155-0.2287 | yes / yes | 65 | 0.0147-0.0211 | yes / yes | 2 | ||
| masked | 0.0038 | 0.0151 | 0.2476-0.2598 | yes / yes | 0.0224-0.0285 | yes / yes | ||||||
| ST2-restricted | 0.0038 | 0.0151 | 0.0224-0.0285 | yes / yes | 5* | |||||||
| E. coli CL EC2-EM | 1 | trimmed | nd | nd | 0.2145-0.2145 | yes / nd | 39 | 0.0270-0.0270 | yes / nd | 3 | ||
| masked | nd | nd | 0.2449-0.2449 | yes / nd | 0.0415-0.0415 | yes / nd | ||||||
| ST2-restricted | nd | nd | 0.0415-0.0415 | yes / nd | 5 | |||||||
| E. coli CL EC2-PM | 2 | trimmed | 0.0000 | 0.0000 | 0.2287-0.2287 | yes / yes | 39 | 0.0000-0.0000 | no / no | 0 | ||
| masked | 0.0000 | 0.0000 | 0.2614-0.2614 | yes / yes | 0.0000-0.0000 | no / no | ||||||
| ST2-restricted | 0.0000 | 0.0000 | 0.0000-0.0000 | no / no | 0 | |||||||
| E. coli CL EC2-TAZ | 1 | trimmed | nd | nd | 0.2277-0.2277 | yes / nd | 38 | 0.0143-0.0143 | yes / nd | 1 | ||
| masked | nd | nd | 0.2581-0.2581 | yes / nd | 0.0230-0.0230 | yes / nd | ||||||
| ST2-restricted | nd | nd | 0.0230-0.0230 | yes / nd | 3 | |||||||
| E. coli RL EC3-NGR | 1 | trimmed | nd | nd | 0.2188-0.2188 | yes / nd | 67 | 0.1027-0.1027 | yes / nd | 25 | ||
| masked | nd | nd | 0.2564-0.2564 | yes / nd | 0.1396-0.1396 | yes / nd | ||||||
| Entamoeba sp. RL 7 | 1 | trimmed | nd | nd | 0.2335-0.2340 | yes / nd | 53 | 0.1936-0.1936 | yes / nd | 58 | ||
| masked | nd | nd | 0.2686-0.2691 | yes / nd | 0.2351-0.2351 | yes / nd | ||||||
| Entamoeba sp. RL 11 | 1 | trimmed | nd | nd | 0.2478-0.2483 | yes / nd | 53 | 0.2229-0.2229 | yes / nd | 59 | ||
| masked | nd | nd | 0.2905-0.2910 | yes / nd | 0.2662-0.2662 | yes / nd | ||||||
* Maximum combined number of CBCs with respect to sequences in this lineage; in sequence-to-sequence comparisons, the number of CBCs varied between 3-4 (Supplementary Table S1 and Supplementary Figure S3).
Disclaimer/Publisher’s Note: The statements, opinions and data contained in all publications are solely those of the individual author(s) and contributor(s) and not of MDPI and/or the editor(s). MDPI and/or the editor(s) disclaim responsibility for any injury to people or property resulting from any ideas, methods, instructions or products referred to in the content. |
© 2026 by the authors. Licensee MDPI, Basel, Switzerland. This article is an open access article distributed under the terms and conditions of the Creative Commons Attribution (CC BY) license (http://creativecommons.org/licenses/by/4.0/).
Copyright: This open access article is published under a Creative Commons CC BY 4.0 license, which permit the free download, distribution, and reuse, provided that the author and preprint are cited in any reuse.